 Navreet Suri
 Yuan Zhang
 Lisa M. Gieg
 M. Cathryn Ryan
95% of researchers rate our articles as excellent or good
Learn more about the work of our research integrity team to safeguard the quality of each article we publish.
Find out more
ORIGINAL RESEARCH article
Front. Microbiol. , 05 May 2021
Sec. Microbiological Chemistry and Geomicrobiology
Volume 12 - 2021 | https://doi.org/10.3389/fmicb.2021.610389
This article is part of the Research Topic Selective Controls on Microbial Energy Metabolisms: From the Microscale to the Macroscale View all 8 articles
Denitrification is a microbial process that converts nitrate (NO3–) to N2 and can play an important role in industrial applications such as souring control and microbially enhanced oil recovery (MEOR). The effectiveness of using NO3– in souring control depends on the partial reduction of NO3– to nitrite (NO2–) and/or N2O while in MEOR complete reduction of NO3– to N2 is desired. Thauera has been reported as a dominant taxon in such applications, but the impact of NO3– and NO2– concentrations, and pH on the kinetics of denitrification by this bacterium is not known. With the goal of better understanding the effects of such parameters on applications such as souring and MEOR, three strains of Thauera (K172, NS1 and TK001) were used to study denitrification kinetics when using acetate as an electron donor. At low initial NO3– concentrations (∼1 mmol L–1) and at pH 7.5, complete NO3– reduction by all strains was indicated by non-detectable NO3– concentrations and near-complete recovery (> 97%) of the initial NO3-N as N2 after 14 days of incubation. The relative rate of denitrification by NS1 was low, 0.071 mmol L–1 d–1, compared to that of K172 (0.431 mmol L–1 d–1) and TK001 (0.429 mmol L–1 d–1). Transient accumulation of up to 0.74 mmol L–1 NO2– was observed in cultures of NS1 only. Increased initial NO3– concentrations resulted in the accumulation of elevated concentrations of NO2– and N2O, particularly in incubations with K172 and NS1. Strain TK001 had the most extensive NO3– reduction under high initial NO3– concentrations, but still had only ∼78% of the initial NO3-N recovered as N2 after 90 days of incubation. As denitrification proceeded, increased pH substantially reduced denitrification rates when values exceeded ∼ 9. The rate and extent of NO3– reduction were also affected by NO2– accumulation, particularly in incubations with K172, where up to more than a 2-fold rate decrease was observed. The decrease in rate was associated with decreased transcript abundances of denitrification genes (nirS and nosZ) required to produce enzymes for reduction of NO2– and N2O. Conversely, high pH also contributed to the delayed expression of these gene transcripts rather than their abundances in strains NS1 and TK001. Increased NO2– concentrations, N2O levels and high pH appeared to cause higher stress on NS1 than on K172 and TK001 for N2 production. Collectively, these results indicate that increased pH can alter the kinetics of denitrification by Thauera strains used in this study, suggesting that liming could be a way to achieve partial denitrification to promote NO2– and N2O production (e.g., for souring control) while pH buffering would be desirable for achieving complete denitrification to N2 (e.g., for gas-mediated MEOR).
Denitrification is a major nitrate (NO3–) reduction pathway that contributes to biochemical gas (NO, N2O and N2) production in anoxic environments. It is a microbially facilitated process performed by facultative anaerobic bacteria capable of reducing NO3– to nitrite (NO2–), ultimately producing di-nitrogen (N2) via other gas species (NO and N2O; Korom, 1992). The complete reduction of NO3– to N2 requires the presence of sufficient amounts of organic (for organoheterotrophic denitrification; like organic acids, hydrocarbons) and/or inorganic (for lithotrophic denitrification; like sulfur containing compounds, transition metals) electron donors (Spormann and Widdel, 2000; Chakraborty and Coates, 2004; Zhu and Getting, 2012; Capua et al., 2019). The transient accumulation of intermediates (NO2–, NO, and N2O) can be observed at the onset of or during denitrification, under optimum growth and metabolic conditions. On the other hand, accumulated NO2– and N2O can persist at sub-optimal and extreme environmental conditions (e.g., high temperatures, acidic or alkaline pH conditions, high salinities; Liu et al., 2014; Fida et al., 2016; An et al., 2017). Limited availability of electron donors can also drive partial denitrification, but many natural denitrifier habitats contain rich sources of electron donors.
Denitrification is widespread in nature and the production of NO2–, N2O and/or N2 as end products is required in many NO3–-dependent practical uses. This metabolic process can play an important role in controlling sulfide formation and microbially enhanced oil recovery (MEOR) in oil reservoirs. Souring control can be achieved by NO2– inhibition of dissimilatory sulfite reductase (Dsr) required for the reduction of sulfite to sulfide by sulfate-reducing bacteria (SRB; Gieg et al., 2011; Callbeck et al., 2013). Nitrous oxide (N2O) in its dissolved form can also be beneficial to limiting sulfide production since it is toxic to SRB and many other microbial species by raising the redox potential in its ambient environment (Sørensen et al., 1980; Londry and Suflita, 1999). However, the liberation of excess N2O to the atmosphere is a concern because of its high potency for ozone depletion in the stratosphere and contribution to greenhouse gas levels (Ravishankara et al., 2009; Montzka et al., 2011). Nitrite can also cause toxicity to other organisms. Thus, the complete reduction of produced NO2– and N2O to N2 is preferred in many industrial applications, including NO3– removal from contaminated waters and gas-mediated enhanced oil recovery (Soares, 2000; Rocca et al., 2007; Lazar et al., 2007; Safdel et al., 2017; Huno et al., 2018).
The production of denitrification intermediates and N2 is dependent on physico-chemical growth conditions, enzyme kinetics and differential gene expression patterns among denitrifying species (Philippot et al., 2001; Liu et al., 2013; Fida et al., 2016). The majority of denitrifying bacteria are distributed within the classes α-, β-, γ-, and ε- of phylum Proteobacteria though they can be members of other phyla such as Firmicutes, Actinobacteria, Bacteroidetes and Planctomyces (Zumft, 1997). Several genera of these bacteria have been enriched and isolated from different environments to determine rates of denitrification and their abilities to express denitrification genes. Their phenotypic responses vary more with diverse regulatory networks than the genes controlling denitrification outcomes (Zumft, 1997; Van Spanning et al., 2007). Under mesophilic conditions, members of the genus Thauera within the Betaproteobacteria have been reported to be dominant in NO3–-impacted environments (Agrawal et al., 2012; Shen et al., 2018). Some strains of this genus were isolated and characterized for denitrification products and their denitrification regulatory phenotypes (DRPs; Liu et al., 2013; Fida et al., 2016). Thauera can use volatile fatty acids (VFAs such as acetate, propionate and butyrate), monoterpenes, heterocyclic aromatic compounds and hydrocarbons as electron donors for organoheterotrophic NO3– reduction (Foss and Harder, 1998; Mechichi et al., 2002). Two distinct types of DRPs have been distinguished in Thauera, based on the accumulation of NO2– as an intermediate when NO3– reduction occurs with acetate oxidation. These include rapid, complete onset (RCO) or progressive onset (PO) of denitrification genes. The regulatory control of N2O was observed to be less stringent than the other intermediates among all the Thauera strains irrespective of their DRPs. Although the N2O intermediate remained as a major end product in the incubations of one of these strains (T. phenylacetica; Liu et al., 2013), it was not clear whether this difference was related to its phylogeny, specific DRP, or physico-chemical growth conditions. This particular study (Liu et al., 2013) did not include strains like T. aromatica that are often the dominant denitrifiers in different environments, and which have been found to be important mediators of NO3–-dependent sulfide control and MEOR (Evans et al., 1991; Anders et al., 1995; Mechichi et al., 2002; Agrawal et al., 2012; Suri et al., 2019).
To further extend the knowledge on regulatory phenotypes of other Thauera strains and the factors affecting NO3– reduction to N2 production in the interest of application to industrial processes, Thauera strains isolated from organic carbon-rich environments were selected for the current study. The known optimum growth temperature and pH range for these strains is 28–30°C and 7.0–7.5, respectively. Incomplete to complete reduction of 1 to 5 mmol L–1 NO3– using VFAs, esters and alkylbenzenes as electron donors by these strains was shown in previous studies under these optimal conditions (Mechichi et al., 2002; Fida et al., 2016; Suri et al., 2017). The partial reduction of NO3– to NO2–, and prolonged NO2– accumulation was observed at NO3– concentrations higher than 2 mmol L–1, but the role of N2O and N2 cannot be assessed since their concentrations were not reported. In addition, the effect of important growth parameters (e.g., pH) on their metabolic abilities to produce N2 was not addressed (Fida et al., 2016; Suri et al., 2017; Suri et al., 2019). The variable production of NO2–, N2O and N2 by denitrifiers is desired in different industrial applications, which can potentially be customized by modification of their growth environments. Keeping the published data in view, the impact of initial NO3– concentrations, intermediate denitrification products (NO2–, N2O), and culture pH values on the rate and extent of denitrification were evaluated for the growth of representative Thauera strains. In addition, NO2– toxicity to the Thauera stains was evaluated by using it as an electron acceptor.
Three strains of Thauera were used in this study (Table 1). Two of these namely, T. aminoaromatica TK001 and T. aromatica NS1, were isolated from enrichment cultures obtained using produced water from a NO3– treated heavy oil reservoir (Fida et al., 2016; Suri et al., 2019). The third strain, T. aromatica K172, originated from activated sludge and was purchased from DSMZ culture collection, Braunschweig, Germany1.
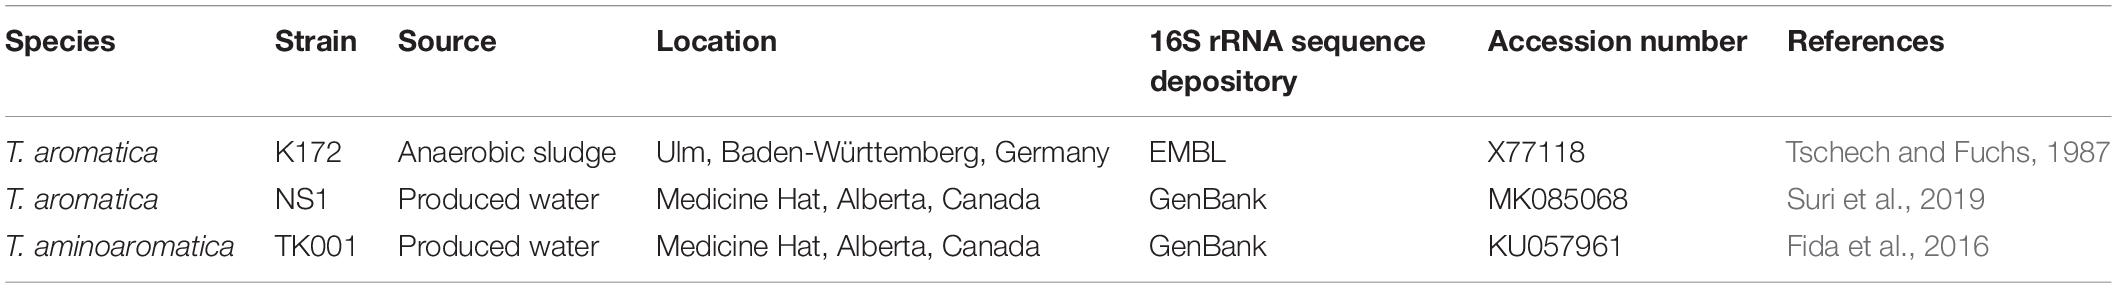
Table 1. Description of denitrifying Thauera strains used to inoculate microcosms in this study.
All strains were grown in CSBK medium (a minimal salts medium; Suri et al., 2017) for comparison of their denitrification characteristics. After autoclaving, the medium was allowed to cool to room temperature while being flushed with 99.9% helium (He) to remove dissolved oxygen. The cooled medium was amended with pre-sterilized stock solutions of trace elements and tungstate and selenite (Widdel and Bak, 1992). Sodium bicarbonate (0.03 M) was added as a buffer and the initial pH of medium was adjusted to 7.5 by addition of 1 M hydrochloric acid (HCl).
Microcosms were prepared by dispensing 50 mL anoxic medium into 120 mL serum bottles using the Hungate technique (Löffler et al., 2005). The sterilized anaerobic stock solutions of sodium acetate (1 M) and sodium nitrate (1 M) were prepared aseptically with ultrapure (milliQ®) water. Microcosms were prepared using two different acetate and NO3– concentrations (0.5 and 1 mmol L–1), with the same concentrations of acetate and NO3– (1:1) added to each individual microcosm. The serum bottles were sealed with butyl rubber stoppers and crimped with aluminum seals.
Frozen bacterial stocks of Thauera strains were initially used for cultivation in CSBK with 0.5 mmol L–1 of NO3– and acetate. Incubations were conducted at 30°C until the NO3– and reduced intermediates were not detectable in microcosms (using the analytical methods described in sections “Biochemical Analyses” and “Headspace Gas Measurements”). The bacterial cultures were centrifuged, the collected cell pellets were re-suspended in CSBK, and were then used to inoculate duplicate or triplicate microcosms containing 1 mmol L–1 of NO3– and acetate (1:1) to monitor denitrification kinetics. Prior to inoculation, the ∼70 mL headspace of each bottle was flushed with He and equilibrated to laboratory barometric pressure (∼0.9 atm) by piercing the butyl rubber stopper with a sterile syringe needle.
Bacterial cells were added to microcosms to an optical density (OD600) of approximately 0.005 in each bottle to attain similar initial cell densities for each of the three strains. The microcosms were then incubated at 30°C, and bacterial growth and changes in concentrations of acetate, NO3–, NO2–, N2O and N2 were monitored by withdrawing aqueous and gas phase samples periodically from the bottles during incubation using He-flushed syringes following procedures outlined in sections “Biochemical Analyses” and “Headspace Gas Measurements.”
Culture sub-samples (0.5–1 mL) were collected during the incubation period to assess bacterial growth and substrate consumption rates. The aqueous samples were centrifuged in microcentrifuge tubes at 13,000 rpm for 10 min, and the collected supernatants were analyzed for acetate, NO3–, and NO2– concentrations using High Performance Liquid Chromatography (HPLC; Waters 600E; Suri et al., 2017; Okpala and Voordouw, 2018). The remaining cell pellets were washed with sterilized distilled water twice and re-suspended in 1 mL of water. The bacterial cell concentrations were subsequently estimated by measuring optical density of cell suspensions at 600 nm (OD600), using distilled water as a blank.
Acetate concentrations were measured by HPLC using 300 μL of the supernatant aliquots that were acidified with 20 μL of 1 M H3PO4 prior to being eluted through a Prevail organic acid (OA) 5 μ column (250 mm × 4.6 mm, Alltech, Guelph, ON, Canada) using 25 mM KH2PO4 (pH 2.5) at a flow rate of 1 mL min–1. Supernatants (100 μL) mixed with 400 μL of acetonitrile buffer were eluted through an IC-PAK anion column (4 × 150 mm, Waters) with 24% (v/v) acetonitrile, 2% butanol and 2% borate-gluconate buffer at a flow rate of 2 mL min–1 for measuring NO3– and NO2–. The peaks detected using a Waters 2487 UV detector at 210 and 220 nm were compared with known standards to obtain acetate, NO3– and NO2– concentrations, respectively.
The pH of aqueous phase samples was measured using a Thermo Scientific Inc., Orion model 310 pH meter (VWR International, Mississauga, ON, Canada) calibrated to a pH range of 4–10. Alkalinity was determined by titration of aqueous phase samples with phthalate buffer in the presence of bromophenol blue to an end point pH of 3.5. Absorbance of bromophenol blue complex measured at 600 nm (A600) compared to the known standards was used as a measure of total alkalinity expressed as millieq/L. An automated pre-calibrated titrator equipped with a spectrophotometer (Thermoscientific) was used for these measurements.
Headspace gases (CO2, N2O and N2) were quantified using gas chromatography (GC; Hewlett Packard 5890A). Prior to sampling, the needle of an empty syringe was first pierced into rubber stoppers to release excess pressure in the headspace to barometric pressure (Supplementary Figure 1). The volume that the piston moved to was recorded as additional headspace volume. Samples (1 mL) withdrawn from the headspace using a gas tight syringe (Agilent) were injected into a GC equipped with a RT-Msieve 5A column (Restek-RT-19722; 30 m × 0.32 mm) and pulsed discharge detector-HIID mode (PDD-HIID). The injector, oven, and detector temperatures were set to 28°C, 30°C, and 33°C, respectively. Helium (> 99.99% purity; Praxair) served as the carrier and makeup gas. Standard curves generated in the range of 0.001 to 99.9% (equivalent to 0.002 to 20 mmol L–1) were used to calculate headspace concentrations of gases in the culture bottles. Aqueous concentrations of gases were calculated from the headspace concentrations using equation 1 and dimensionless Henry’s constants of 0.726, 0.528, and 0.014 for CO2, N2O and N2, respectively at 30°C. The constants were calculated using parameters provided by Sander (2015):
where Caq, Cg, and H are the aqueous concentration (in mmol L–1), the headspace concentration (in mmol L–1) and dimensionless Henry’s constant, respectively. The Henry’s constants were further adjusted for the ionic strengths of the medium and culture conditions (Schumpe et al., 1982; Schumpe, 1993).
In some instances, the data are presented as the % of a particular N-species remaining (e.g., NO3–, NO2–, N2O or N2). These values were estimated as follows (using the percent N2 produced from NO3– as an example, where NO3– INITIAL, NO3– FINAL and N2 produced are the initial NO3– concentration, final NO3– concentration and final N2 concentration, respectively, each expressed as mmol L–1)
Batch microcosms were prepared using 120 mL pre-sterilized serum bottles flushed with He, closed with butyl rubber stoppers and crimped with aluminum seals. In each case, sterilized solutions of acetate and N-species were added aseptically at different initial concentrations to anoxic CSBK medium and the pH was adjusted using 1 M HCl or 1 M NaOH. The headspaces of the bottles were subsequently flushed with He and equilibrated to barometric pressure prior to being inoculated with Thauera strains at initial cell densities ca. OD600 ≅ 0.005.
Four sets of iterative batch tests were prepared using the techniques above (sets 1 to 4; Table 2), with N-species from the three electron acceptors that participate in denitrification (i.e., NO3–, NO2–, or N2O), and in one case with varying initial pH values (7.5 to 10). In each case acetate was added as an electron donor in equimolar concentrations to the initial N-species (i.e., in 1:1 ratio). Two to four replicate microcosms were used for each of the three denitrifying strains in each set of batch microcosm tests. After preparation and inoculation, microcosms were incubated at 30°C for either 14, 30, or 90 days (depending on the experiment). Samples for initial aqueous (acetate, NO3– and NO2–) and headspace concentrations (CO2, N2O and N2) were collected immediately after inoculation and for the final measurements at the end of the incubation period. Denitrification intermediates, alkalinity and pH were also measured with time and with sampling conducted during the incubation period as described above.
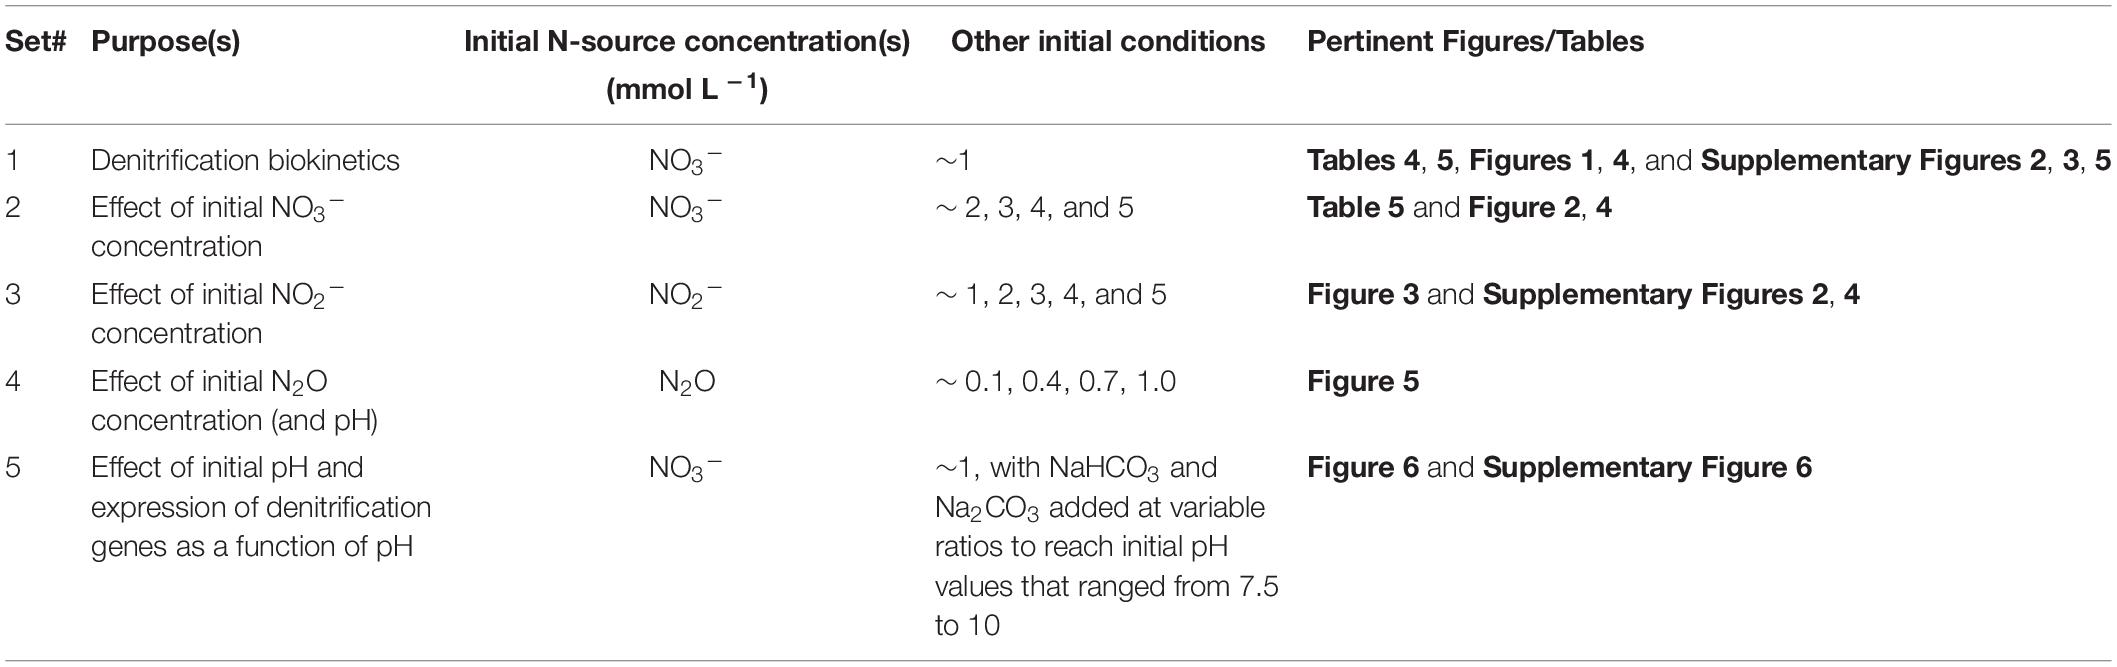
Table 2. Description of sets of microcosm batch tests conducted, including their purpose, the initial N-source (NO3–, NO2– or N2O) and their concentrations, other initial conditions, and the figures and/or tables where the results are reported.
Anoxic CSBK medium containing 1 mmol L–1 of acetate and NO3– (1:1) in sealed serum bottles was amended with different ratios of pre-sterilized solutions of sodium bicarbonate (1 M) and sodium carbonate (1 M). The range of initial pH in these bottles was 7.5 to 10 (set 5; Table 2). The bottles were inoculated with Thauera isolates at similar initial cell densities (OD600 ≅ 0.005). Headspaces of these bottles were flushed and equilibrated with He to barometric pressure prior to incubation at 30°C. The reduction of NO3–, production of reduced intermediates (NO2–, N2O) and N2 upon denitrification was measured periodically in the aqueous phase and headspace of bottles during 14 days of incubation. The time of incubation was chosen based on the observations from initial denitrification experiments conducted at pH 7.5 (Figure 1). Considering the amount of N2 produced in cultures under this pH equivalent to 1, the fold change was calculated using equation 3 and measured concentrations of N2 in the bottles. For values lower than 1, the fold decrease was calculated using equation 4.
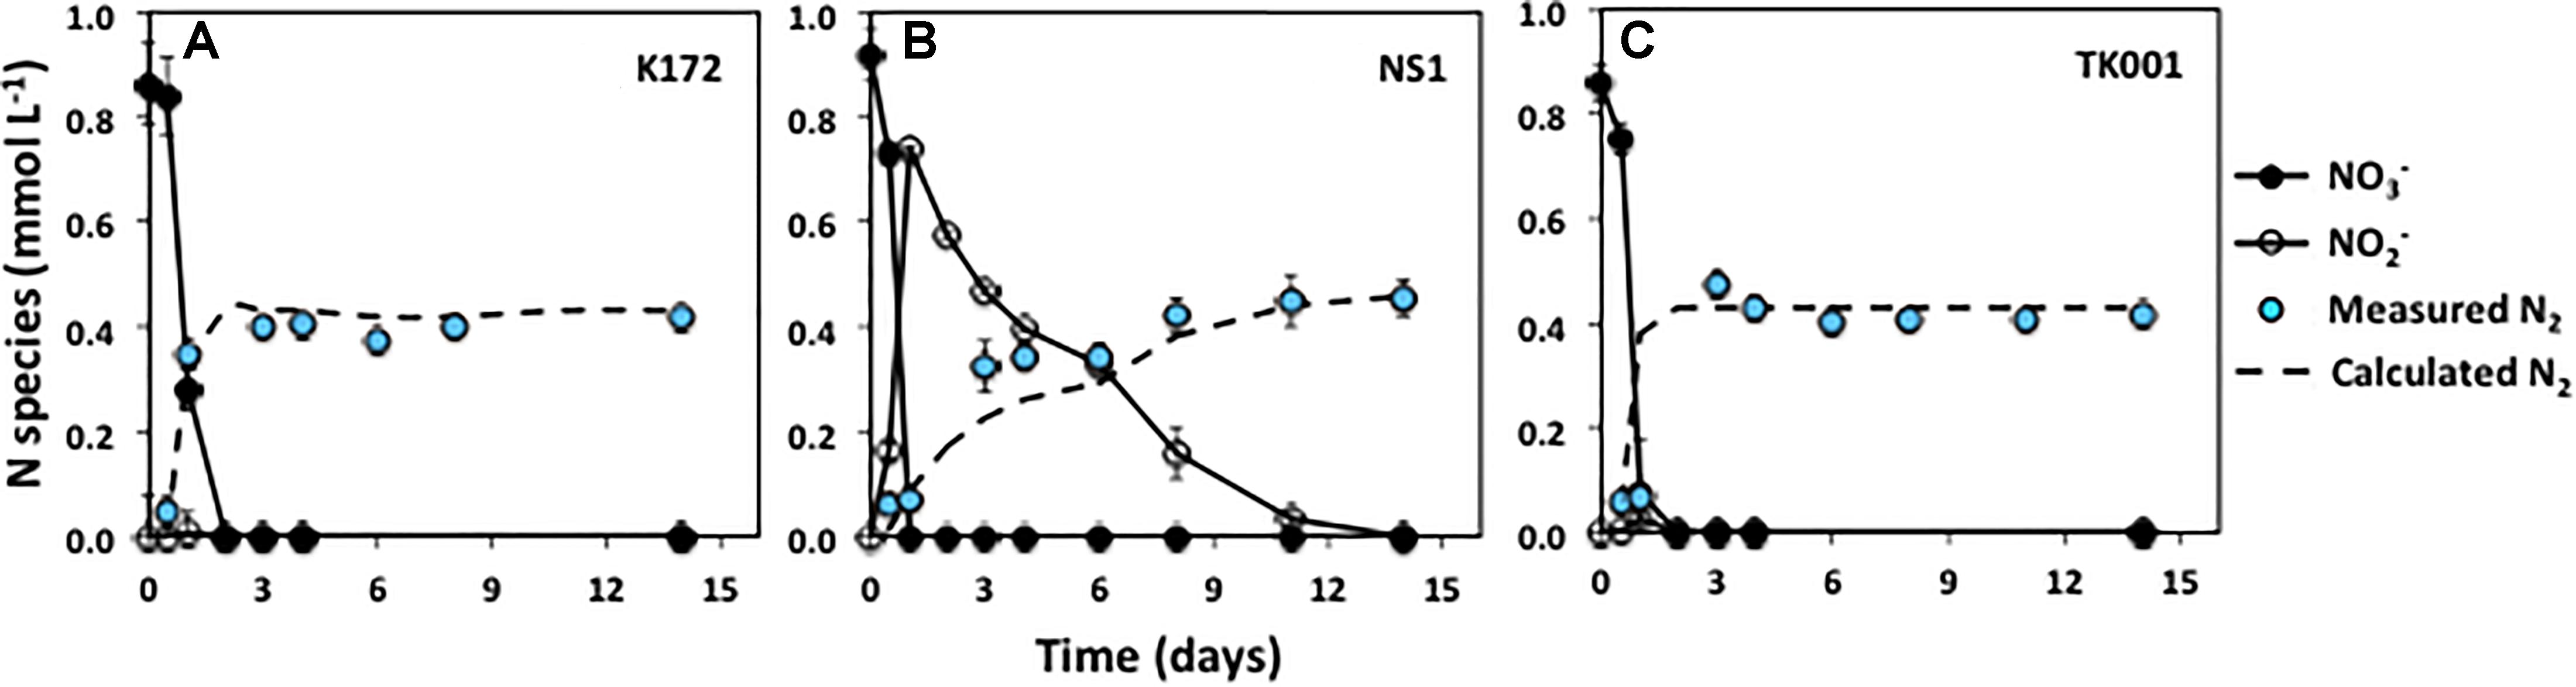
Figure 1. Time series of NO3–, NO2– and measured N2 during denitrification with three different denitrifying Thauera strains (K172, NS1 and TK001) in batch cultures amended with ∼ 0.9 mmol L–1 NO3– and acetate. Error bars represent the standard errors for three to four microcosm replicates. The dashed line indicates the N2 concentrations calculated assuming decreases in initial NO3–-N concentrations are completely reduced to N2.
Culture subsamples (1 mL) from incubations with optimum and higher pH (section “Effect of Initial pH on NO3– Reduction to N2”) were transferred to 1.5 mL sterilized RNase free microcentrifuge tubes during early and late exponential phases and were centrifuged at 12,000 rpm for 30 min to collect cell pellets. The collected cell pellets were frozen immediately at −80°C. RNA was extracted from these frozen cell pellets within 2 weeks of collection using the RNeasy kit (Qiagen). For extraction, the cell pellets were first re-suspended in 100 μL of TE buffer (10 mM Tris, 1 mM EDTA) containing 15 mg/mL lysozyme (Sigma) and the tubes were incubated at room temperature on a shaker at 300 rpm for 10 min. Buffer RLT (Qiagen) was then added (350 μL) to the tubes followed by vigorous vortexing. The resulting mixture was transferred to a 2 mL tube containing 25–50 mg of acid-washed glass beads (212–300 μm; Sigma) and the cells were disrupted in a Tissuelyser LT (Qiagen) at 50 Hz for 5 min. The lysate obtained was centrifuged at maximum speed for 5–10 s, the supernatant was transferred to a clean tube, and then mixed with 220 μl of 100% ethanol. The extracted RNA was purified from the mixture using RNeasy spin columns according to the manufacturer’s instructions and quantified using a nanophotometer (Implen).
Total RNA (100–500 ng) was reverse transcribed to obtain cDNA using the SuperScript IV VILO Master Mix (Invitrogen) according to the manufacturer’s instructions. The cDNA concentrations of all the samples were normalized to 1 ng/μl with PCR grade water. Real time qPCR assays were performed with primers specific for 16S rRNA, nirS (nitrite reductase) and nosZ (nitrous oxide reductase) genes using PowerUP SYBR Green Master Mix (Applied Biosystems) on a Quanstudio 3 Real Time PCR System (Thermofisher) running Quantstudio Design and Analysis v1.5.1 Software. The primer sequences used for PCR amplification of these genes are summarized in Table 3. The 16S rRNA gene primers were designed based on the similarity of aligned 1400-1500 bp 16S rRNA sequences of Thauera strains used in this study. The PCR cycling conditions were 95°C for 2 min followed by 45 cycles of 95°C for 1 s and 60°C for 30 s. The specificity of the PCR reaction was confirmed using melt curve analysis. Standard curves were performed using control cDNA from representative samples that yielded a dynamic linear range of 0.005 to 50 ng sample per reaction and efficiencies ranging from 96.8 to 102.6% (Bustin et al., 2009). The data was analyzed using the Thermofisher relative quantification application on the Thermofisher cloud that employs the 2–ΔΔCT method for determining relative gene expression (Schmittgen and Livak, 2008).
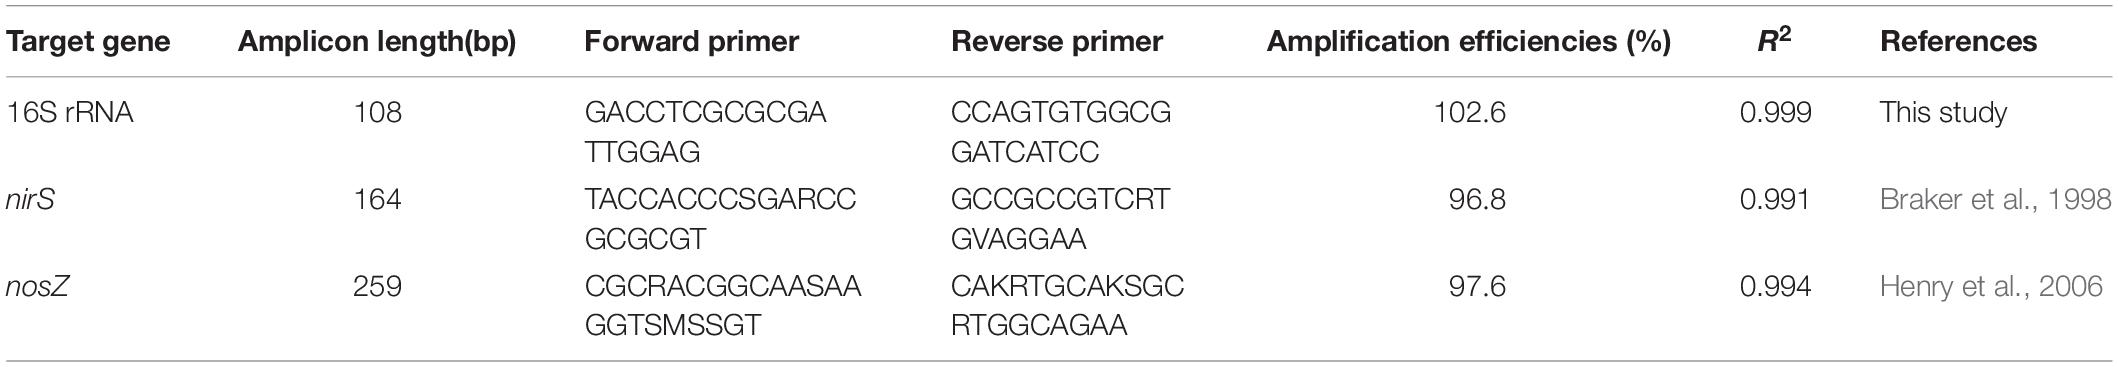
Table 3. Sequences of primers used for quantitative PCR (qPCR) and parameters of calibration curves used for qPCR analysis.
The cDNA amplicons from representative end-point qPCR reactions for the 16S rRNA, nirS and nosZ genes were purified using PCR spin columns (Sigma). The gene sequences were obtained by Sanger dideoxy sequencing at the Core DNA Services Laboratory of the University of Calgary with both forward and reverse primers (Table 3). The resulting sequences were assembled into contigs using SnapGene software2. The gene identity of assembled sequences was confirmed using NCBI Nucleotide BLAST search using 16S rRNA gene sequences as control sequences for the three strains3. The identified partial nirS and nosZ sequences of strains of Thauera obtained were submitted to NCBI GenBank database (accession numbers MT186692 to MT186694 and MT186689 to MT186691, respectively).
All of the tested Thauera strains rapidly reduced NO3– to N2 using acetate as an electron donor upon incubation under identical initial conditions (∼ 0.9 mmol L–1 NO3–, pH 7.5; Figure 1). Incubations were performed in four replicates via two separate experiments (both included in Set 1; Table 2) conducted with two replicates in each. The rates of denitrification, and end products were similar within the replicates and the experiments for each strain. Nitrate concentrations were reduced to below detection levels (< 0.001 mmol L–1) in all the cultures within two days.
The denitrification kinetics in cultures with K172 and TK001 were similar, with complete reduction of NO3– to N2 occurring within three days of incubation for both cultures (with denitrification rates of 0.431 and 0.429 mmol L–1 d–1, respectively; Table 4). On the other hand, NS1 took 14 days for complete conversion of NO3– to N2, with transient accumulation of NO2– concentrations that peaked within two days at 0.74 mmol L–1 and declined over the course of incubation. The denitrification rate (0.071 mmol L–1 d–1) of NS1 was also lower as compared to the other two strains. No significant accumulation of N2O was detected in any of these cultures, and the final concentrations of 0.42 to 0.45 mmol L–1 of N2 indicated that 97.3 to 98.9 % of the initial NO3–-N was reduced to N2 (Figure 1 and Table 4).
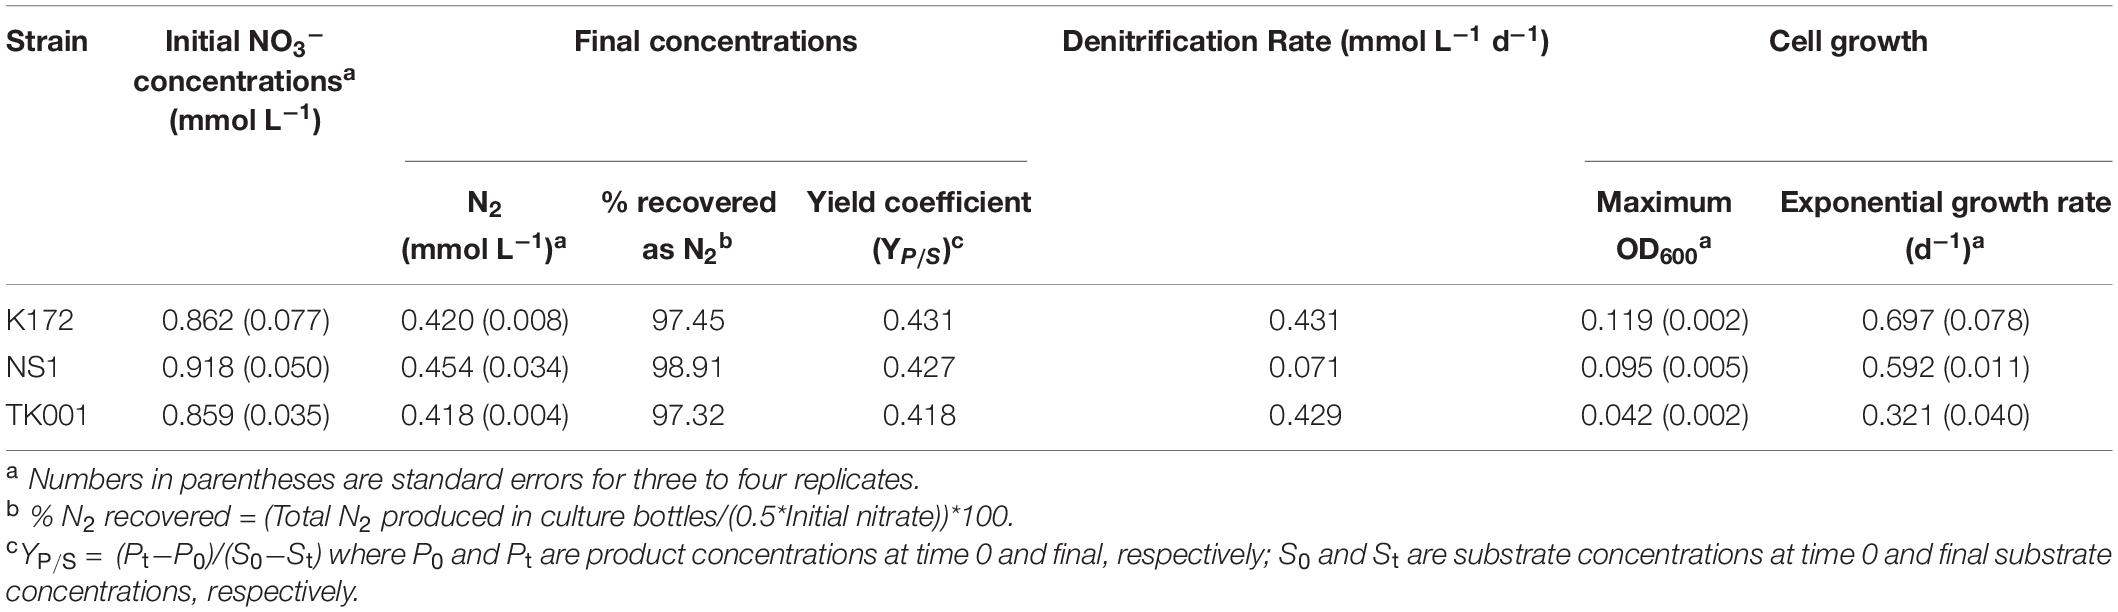
Table 4. Microcosm parameters, microbial growth characteristics (first order growth rate), denitrification rate and N2 production by denitrifying Thauera strains amended with NO3– and acetate in CSBK medium in 14-day microcosm incubations at 30°C (Figure 1).
The microcosms that were prepared using denitrification intermediates as electron acceptors (NO2– and N2O) instead of NO3– also gave similar rates of N recovery as N2, with no N2O detected as an intermediate in NO2– amended cultures (Supplementary Figure 2). However, the rates of reduction of these intermediates were lower than those with NO3–. There was a lag period of 0.5 to 3 days before the Thauera strains initiated reduction of NO2– and N2O. On average, 0.42 ± 0.01 mmol L–1 of N2 was produced in these cultures by the end of the incubation period (Supplementary Figure 2).
The bacterial cell growth characteristics and product yield coefficients for the three Thauera strains are summarized in Table 4. The strain K172 cultures consumed 0.86 mmol L–1 NO3– and grew to a highest maximum OD600 of 0.119. In comparison, NS1 and TK001 grew to a lower maximum OD600 of 0.095 and 0.042, respectively after similar amounts of NO3– consumption (i.e., concentrations of 0.85 and 0.91 mmol L–1, respectively; Table 4). The rates of denitrification observed in the microcosms were inversely correlated with the exponential growth rates of these strains. The rate of NO3– reduction was highest in TK001 cultures with lowest exponential growth rate of 0.321 d–1. Strain NS1 showed lowest rate of NO3– reduction but had higher exponential growth rate of 0.592 d–1. Although the K172 cultures had a rates of NO3– reduction similar to that of TK001, their exponential growth rates were highest among the three strains (0.697 d–1; Table 4 and Supplementary Figure 3). The product yield coefficients from the cultures were 0.42 to 0.43 (Table 4).
All three bacterial strains were further cultivated on two to five-fold higher NO3– concentrations (1.90 to 4.60 mmol L–1; set 2; Tables 2, 5) with equimolar initial acetate concentrations. Varying the initial inputs of NO3– in culture bottles affected the denitrification rate and abundance of intermediate products. Complete reduction of NO3– to N2 was observed in all three cultures amended with 2.0 mmol L–1 initial NO3–. The percent N2 recovered from these bottles ranged from 96.6 to 110.9 % (Table 5). Denitrification was complete after 5 (K172), 60 (NS1) and 11 (TK001) days of incubation. Nitrite accumulated at higher concentrations (up to 1.46 mmol L–1) and persisted longer in the NS1 cultures as compared to the other two strains. The formation of N2O upon reduction of NO2– was not detected in cultures with K172 and TK001 while up to 0.23 mmol L–1 N2O formed upon reduction of NO2– in the NS1 cultures (Figure 2).
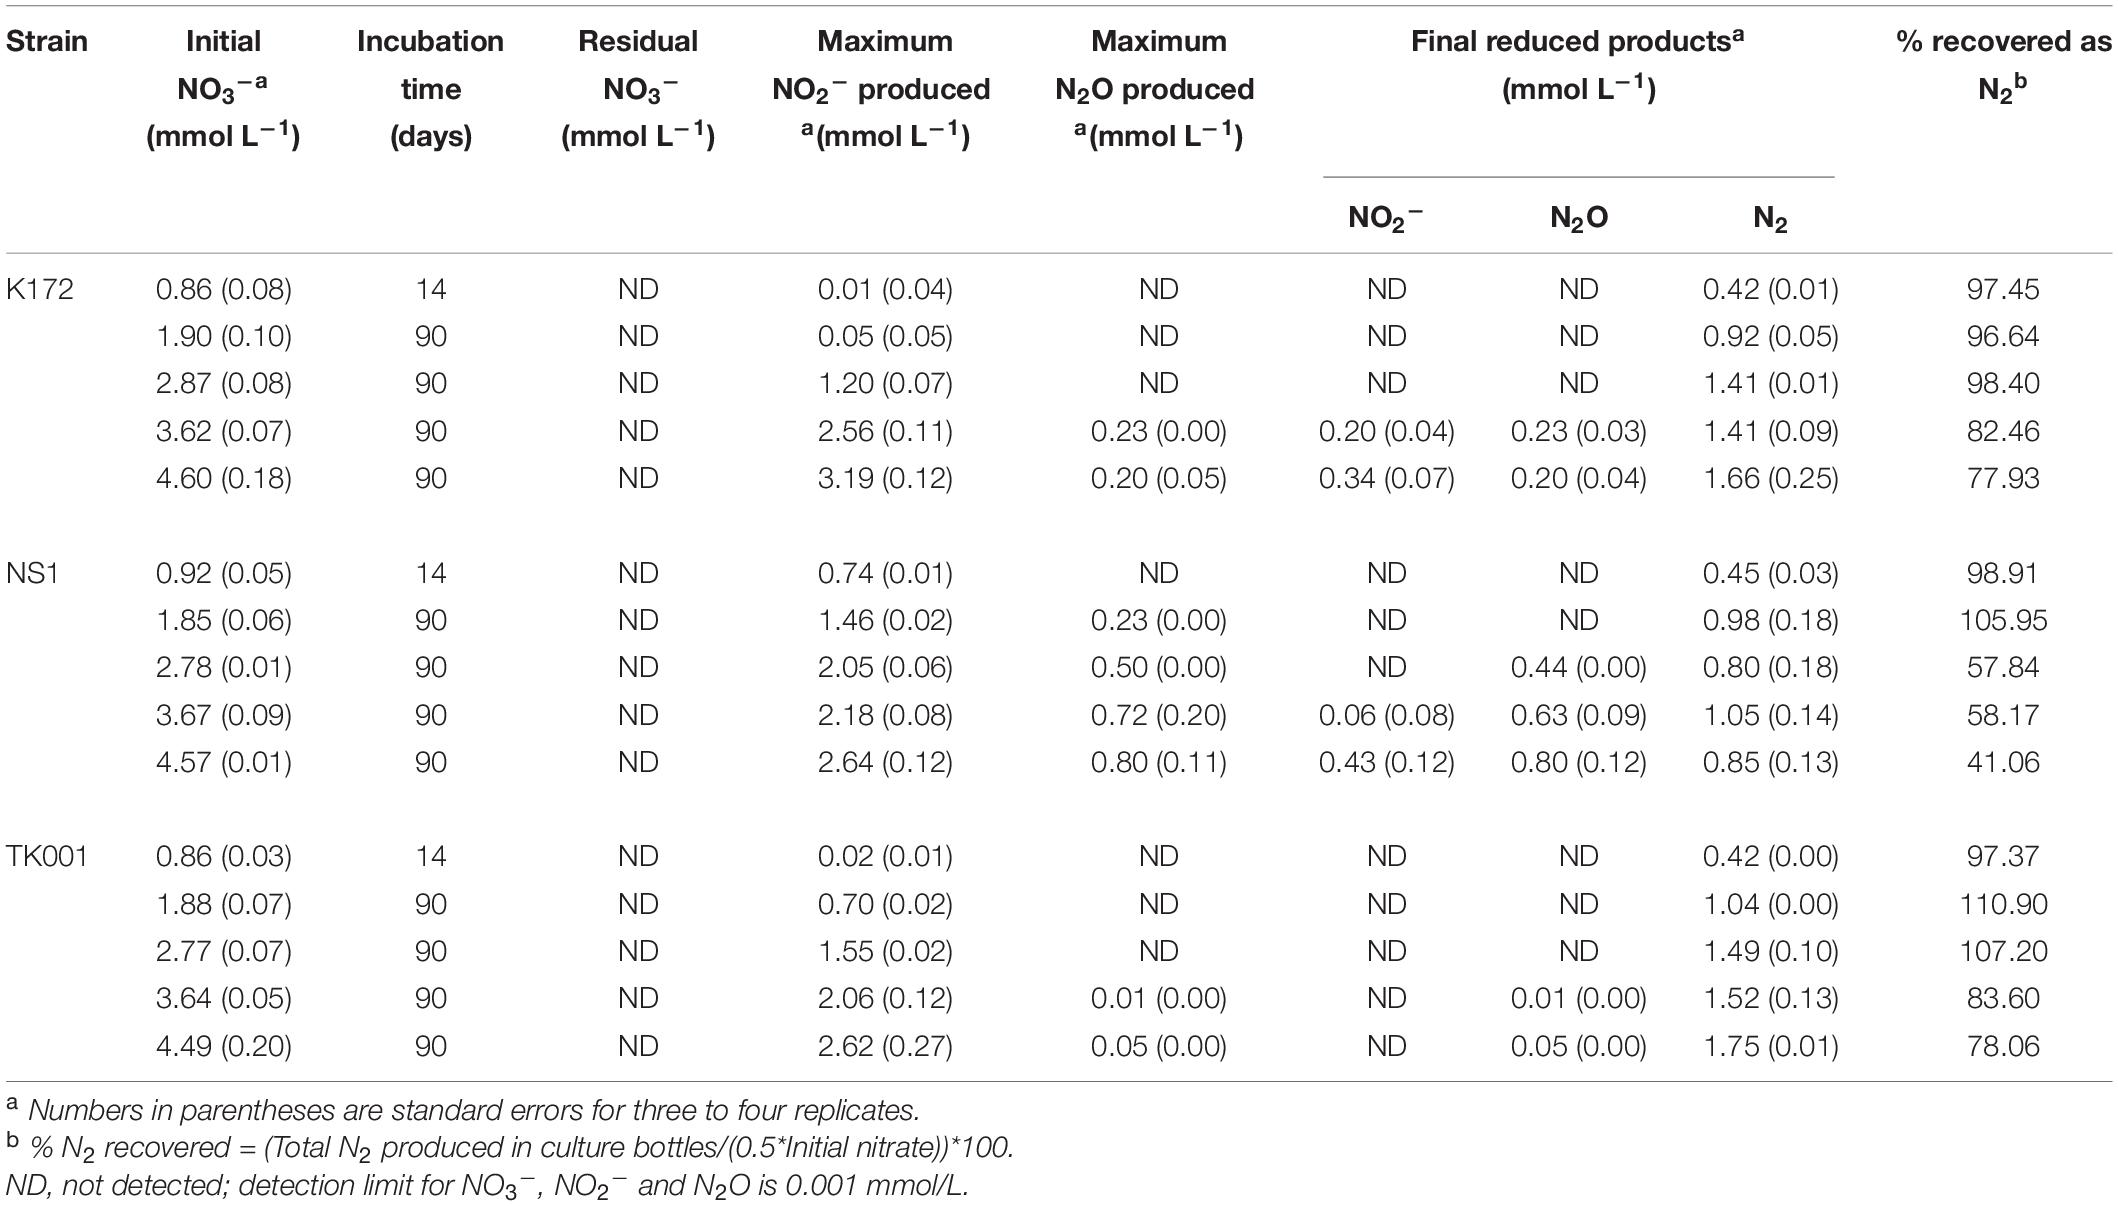
Table 5. Production and distribution of reduced products of denitrification coupled to acetate oxidation in batch cultures of Thauera strains amended with different NO3– concentrations.
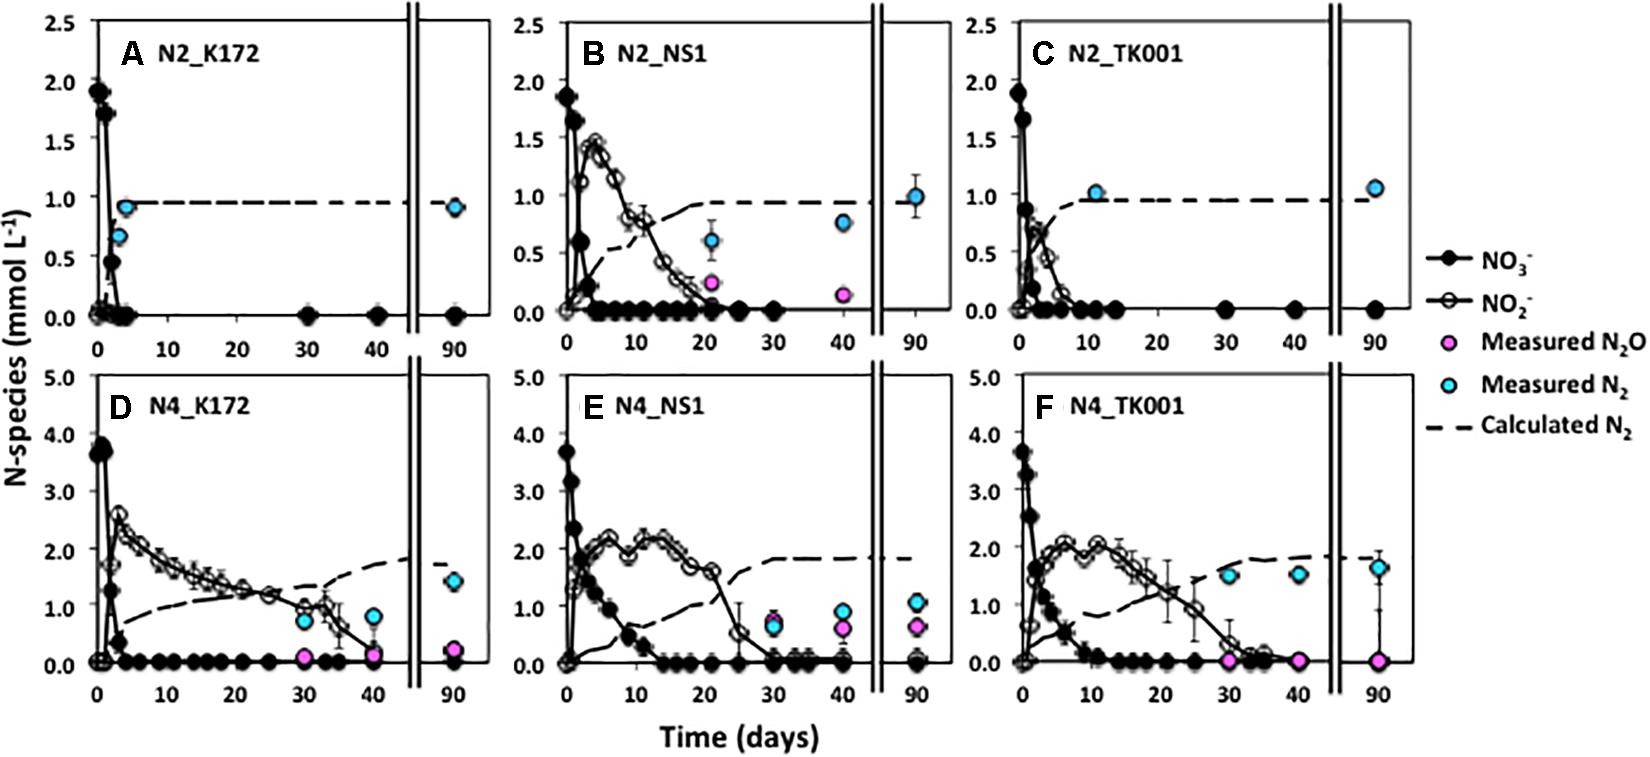
Figure 2. Time series of NO3–, NO2–, and measured N2 during denitrification with three different denitrifying Thauera strains (K172, NS1 and TK001) in batch cultures amended with two different initial NO3– concentrations of ∼ 2 mmol L–1 (N2; upper graphs) or ∼ 5 mmol L–1 (N4; lower graphs). Error bars represent the standard errors for three to four replicates. The dashed line indicates the N2 concentrations calculated assuming decreases in initial NO3-N concentrations are completely reduced to N2.
On average, 0.98 ± 0.06 mmol L–1 N2 was produced upon reduction of 1.88 ± 0.03 mmol L–1 NO3– in all cultures (Table 5). The complete conversion of NO3– to N2 was further observed up to 2.82 ± 0.07 mmol L–1 NO3– in cultures with strains K172 and TK001 but not in cultures with NS1. There was transient accumulation of 1.20 to 1.55 mmol L–1 NO2– only as an intermediate in the K172 and TK001 cultures. In contrast, NO2– and N2O both accumulated in NS1 incubations. At the end of a 90-day incubation period, NO2– was completely reduced and 0.44 ± 0.00 mmol L–1 N2O remained with the formation of 0.80 ± 0.18 mmol L–1 N2 in all cultures (Table 5).
The percentage of NO3–-N recovered as N2 at the end of a 90-day incubation decreased as initial NO3– concentrations increased. The decrease was similar in cultures with K172 and TK001. A four to five-fold higher input of NO3– (e.g., than 1 mmol L–1) in these cultures gave 14.38 to 19.42 % lower N2 (Table 5 and Figures 1, 2). A larger decrease in N2 production occurred with strain NS1, ranging from 40.74 to 57.85 %, and the decrease was observed at comparatively lower fold increase in initial NO3– inputs. Average initial NO3– concentrations of 3.65 and 4.59 mmol L–1 NO3–, produced NO2–, N2O and N2 at the end of 90-day incubation in cultures with K172 and NS1. In the TK001 cultures amended with similar NO3– concentrations, only N2O and N2 were formed (Table 5 and Figures 2C,F). Overall, the reduction of NO3– to N2 was less complete when higher NO3– concentrations were added in the tested Thauera cultures.
High concentrations of NO2– can be toxic to bacteria, thus inhibiting their metabolic activities. In order to investigate the effects of NO2– concentrations on the denitrification potential of the Thauera strains, two sets of kinetic experiments (both included in Set 3; Table 2) were conducted using NO2–as the sole electron acceptor when added at different concentrations (1 to 5 mmol L–1) and with equimolar initial concentrations of acetate as an electron donor (i.e., in 1:1 ratio). The patterns of NO2– reduction observed were similar in both the experiments. However, the rates of NO2– reduction were distinct among the three Thauera strains and different starting NO2– concentrations in batch cultures. With ∼1 mmol L–1 of initial NO2–, the reduction started after 2 (K172), 1 (NS1) and 0.5 (TK001) days of incubation of cultures (Supplementary Figure 2). The lag period before the initiation of NO2– reduction in these cultures further increased with the increase in NO2– concentration. For instance, it took 5 (K172), 3 (NS1) and 0.7 (TK001) days for Thauera strains to start reducing NO2– in cultures with five-fold higher NO2– (∼5 mmol L–1; Supplementary Figure 4). The NO2– concentrations had minimal effects on the NO2– reduction potential of strain TK001 in the beginning of incubation as compared to the other two Thauera strains. However, after 15 days of incubation there were no significant changes in the amounts of NO2– reduced in these cultures (Supplementary Figure 4C). Similarly, there was not much NO2– reduction in cultures with strain K172 after a similar incubation period (18 days; Supplementary Figure 4A). In comparison, levels of NO2– became more constant in cultures with strain NS1 in a shorter time of incubation (after 10 days; Supplementary Figure 4B). Continued incubation of all the Thauera cultures for 30 days did not show any additional substantive changes in NO2– reduction after these time periods.
Nitrite was completely reduced to N2 in all the cultures with initial NO2– concentrations of ∼1 mmol L–1 (Supplementary Figure 2). However, in cultures with higher initial NO2– concentrations complete reduction of NO2– to N2 was observed only in cultures with strain K172 and 2 mmol L–1 NO2– (Supplementary Figure 4A). The percent reduction of NO2– decreased with an increase in the initial NO2– concentrations with strain NS1 being most affected (Figure 3A). With a 5-fold increase in NO2– concentrations, the percent NO2– reduction in cultures decreased to 49.21% (K172), 41.39% (NS1) and 43.93% (TK001). The reduction of NO2– produced only N2 in the cultures with NS1 (Figures 3B,C). Nitrous oxide was not detected at any time point during incubation of these cultures. However, both N2O and N2 were produced as reduced end products of NO2– reduction in cultures with K172 and TK001. More N2O (0.56 to 0.67 mmol L–1) was produced in K172 cultures than in TK001 cultures (0.06 to 0.15 mmol L–1 of N2O; Figure 3B). Similar amounts of N2 were produced in cultures with NS1 (0.46 to 0.92 mmol L–1) and TK001 (0.47 to 0.96 mmol L–1). The N2 produced in K172 cultures were much lower in comparison (0.24 to 0.80 mmol L–1) especially at high initial NO2– concentrations (> 2 mmol L–1; Figure 3C). Overall, an average of 2.18 ± 0.36 (K172), 1.88 ± 0.16 (NS1) and 2.02 ± 0.11 (TK001) mmol L–1 of NO2– was reduced to N2O and N2 in cultures. The average increase in alkalinity of these cultures was 1.58 ± 0.10 meq/L caused by production of dissolved CO2 upon oxidation of acetate coupled to NO2– reduction. The culture pH increased to 8.14 ± 0.11 from 7.50.
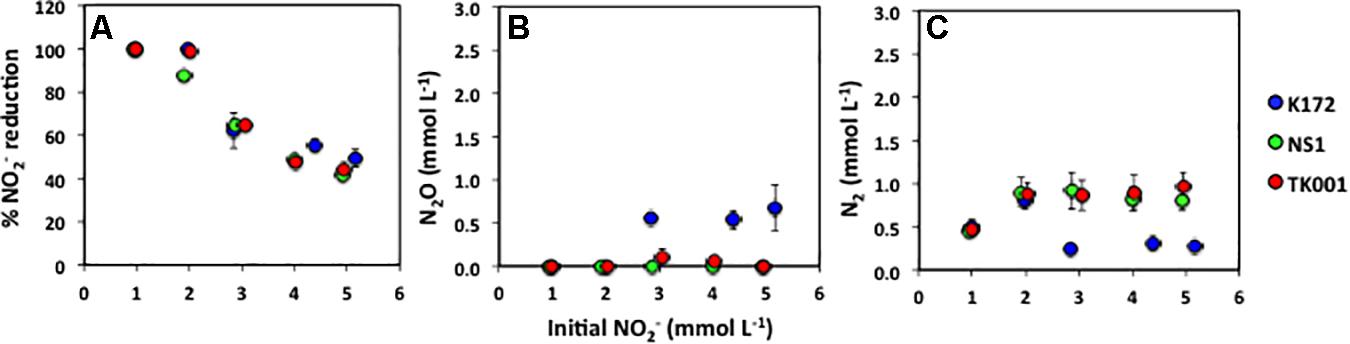
Figure 3. (A) Percent NO2– reduction (Equation 2), and final concentrations of (B) N2O and (C) N2 produced after 30 days of incubation in batch cultures of Thauera strains, shown as a function of varying initial NO2– concentrations (∼ 1 to 5 mmol L–1; x-axis). Error bars represent standard errors for three to four replicates. The time series for these batches are shown in Supplementary Figure 4.
pH is a measure of the hydrogen ion concentration in the aqueous phase and alkalinity is a measure of the capacity of aqueous phase in a contained system to neutralize acids. In anoxic closed carbonate system such as the culture bottles in our experiments, changes in dissolved inorganic species such as bicarbonates (HCO3–) and carbonates (CO32–) upon acetate oxidation to CO2(g) cause changes in alkalinity and pH unless there are mineral buffers. At the end of batch experiments that were initially amended with ∼1 mmol L–1 acetate and NO3–, a decrease of 0.72 ± 0.03 mmol L–1 in acetate concentration was observed. Based on the redox stoichiometry (equation 5), 0.55 ± 0.02 mmol L–1 (76.4 ± 4.7%) of acetate was oxidized for complete reduction of NO3– to N2 and the remaining 0.18 ± 0.06 mmol L–1 (25.0 ± 7.0 %) was presumably incorporated into bacterial biomass and other by-products (Figure 1 and Supplementary Figure 5; Chen et al., 2017).
Although carbon dioxide (CO2(g)) was not detected or detected at negligible concentrations by GC analysis, the CO2 loss to the atmosphere is negligible given the sealed culture bottles used. This indicates that all CO2 produced remained in the aqueous phase, where it would partition into the dissolved inorganic species. Accordingly, the pH of these cultures increased from 7.50 to 8.82 ± 0.08 (Figure 4). Using the measured pH values and dissociation constants, the total alkalinity was calculated to increase from 2.51 to 3.00 meq/L (Supplementary Material section 3). The measured alkalinity values (3.26 ± 0.16 meq/L) in these cultures upon completion of denitrification by Thauera strains were very similar to the calculated values and the reaction is well constrained for the lower initial NO3– concentrations (∼1 mmol L–1).
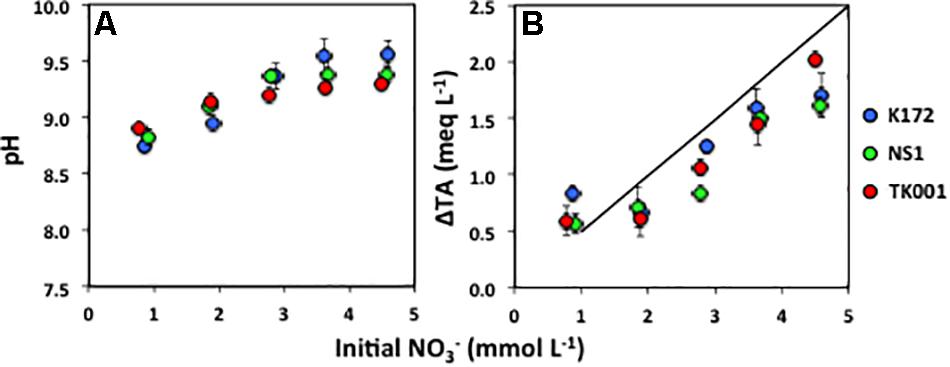
Figure 4. (A) Final pH and (B) change in total alkalinity (ΔTA; meq L–1) expressed as a function of initial NO3– concentrations (mmol L–1) (Table 4) produced through acetate oxidation coupled to denitrification by Thauera strains in batch cultures. Error bars represent standard errors for three to four replicates.
The increase in pH and alkalinity of cultures with increasing initial NO3– concentrations is shown in Figure 4. The cultures amended with higher initial NO3– concentrations tended to not produce as high alkalinity as equation 5 would predict (Figure 4). The difference was highest at ∼ 5 mmol L–1 initial NO3– concentrations especially in the cultures with strains K172 and NS1. In comparison, at the similar initial NO3– concentrations, the difference was lower in the cultures with TK001 that showed comparatively more complete denitrification (Table 4). This could be due to incomplete denitrification caused by high pH (up to 9.56), and less production of CO2 in NS1 and K172 cultures.
The direct effect of initial pH on growth and reduction of N2O by Thauera strains was tested in batch cultures with 0.04 to 1 mmol L–1 N2O as the sole electron acceptor and 0.5 mmol L–1 acetate as the electron donor (set 4; Table 2). The average amounts of remaining N2O in the cultures after 15 days of incubation are summarized in Figure 5. The percent N2O is plotted against the initial N2O concentrations added to the cultures. The reduction of N2O to N2 was not much affected at pH values of ∼8.1 where N2O was completely reduced to N2 at all concentrations in cultures with Thauera strains except in cultures with 1.05 mmol L–1 of initial N2O and inoculated with strain NS1. Minimal amounts of N2O (0.02 ± 0.04 %) remained in these cultures (Figure 5B). With the increase in initial pH, the remaining N2O that was not reduced to N2 increased in the cultures when 0.79 to 1 mmol L–1 initial N2O was provided. The percent N2O remaining was 32.73 ± 10.81, 24.72 ± 5.14 and 68.97 ± 7.63 % in NS1 cultures at pH 9.00, 9.40, and 9.80, respectively. Nitrous oxide added at lower concentrations (0.04 to 0.10 mmol L–1) to these cultures was not detected at any of the pH conditions tested and was completely reduced to N2. At the highest tested pH 9.8, the percent N2O not utilized increased from 22.49 ± 7.45 to 68.97 ± 7.63 % with the increase in initial added N2O from 0.35 to 0.93 mmol L–1 (Figure 5B). Similarly, at pH 9.8, the percent N2O not utilized increased with the increase in initial N2O concentrations in cultures with strains K172 and TK001, however, the amounts of increases were lower as compared to those in cultures with strain NS1. The increase in remaining %N2O cultures was from 0.29 to 36.97 % (K172) and 0.58 to 21.18 % (TK001) at initial N2O concentrations ranging from 0.35 to 0.83 mmol L–1 (Figures 5A,C). No significant amounts of remaining N2O were detected in cultures with K172 and TK001 at pH 9.4 at any of the added N2O levels. However, up to 41.29 ± 12.15 % (K172) and 12.80 ± 4.63 % (TK001) N2O remained in cultures at pH 9.0 and initial N2O concentrations of more than 0.40 mmol L–1. Overall, at higher pH, the percent reduction of high concentrations of N2O to N2 was lower than at pH 7.5 and 8.1 (Figure 5).
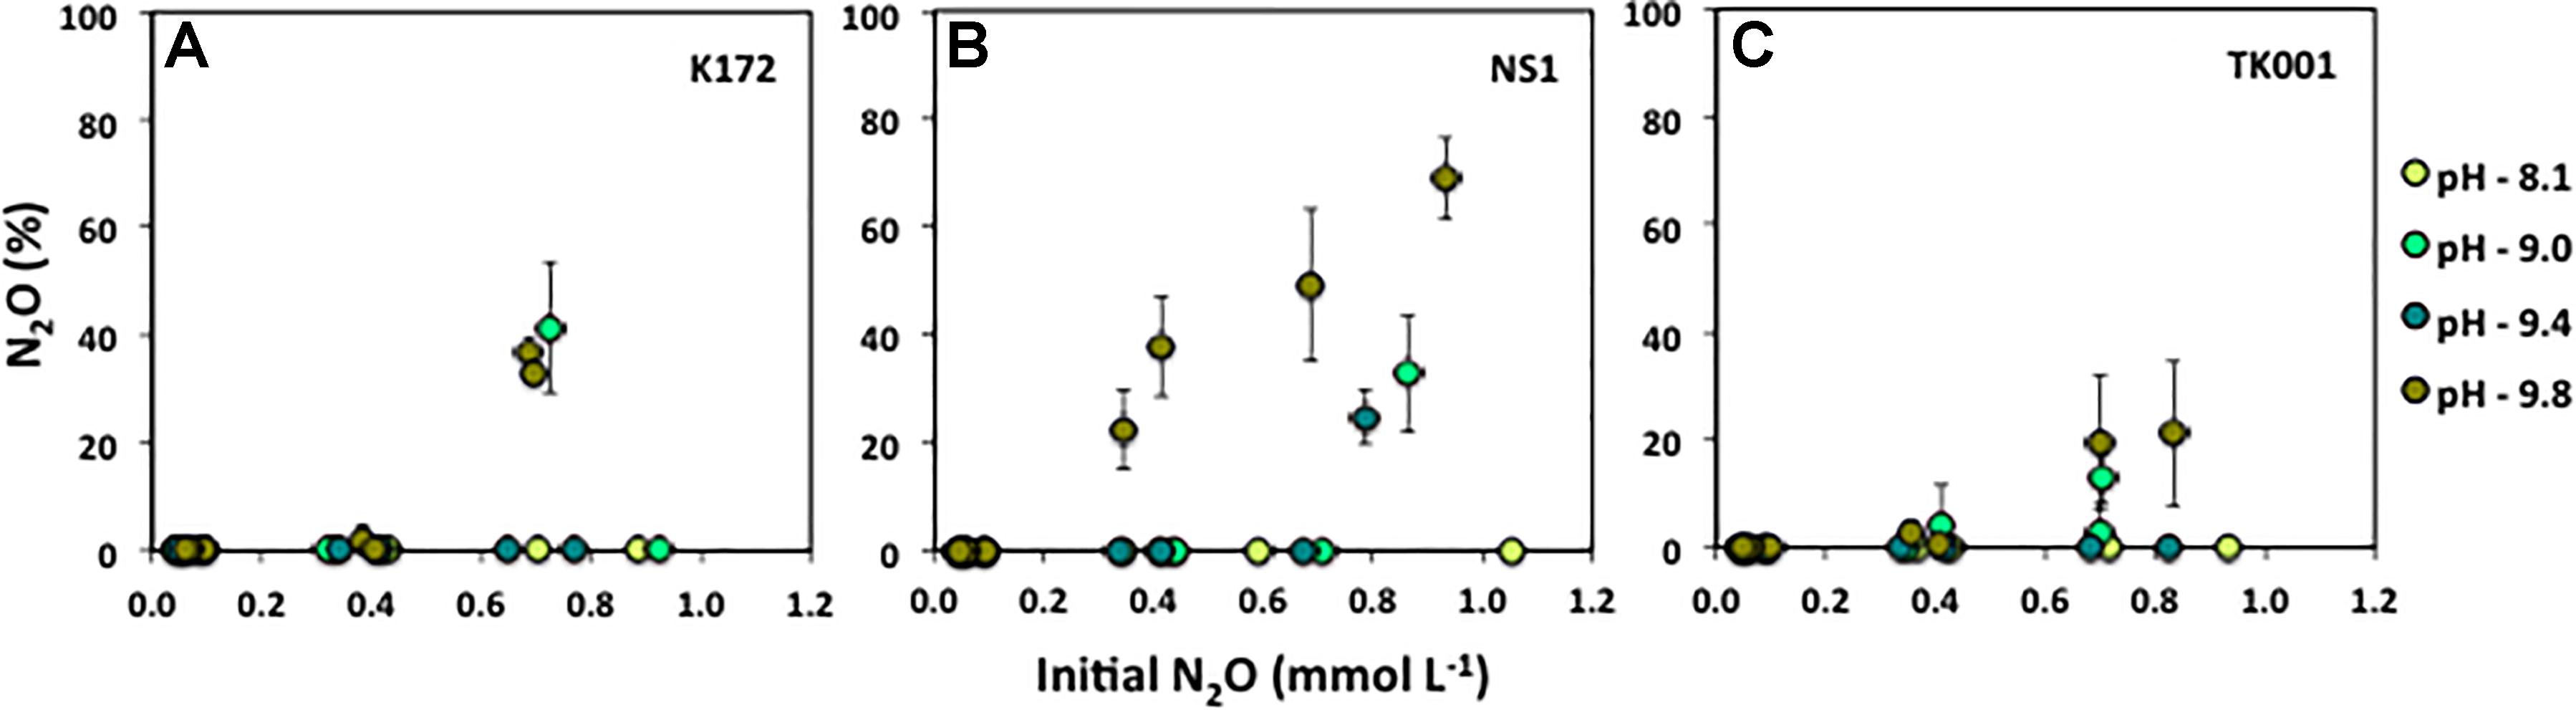
Figure 5. Percent N2OREMAINING calculated as ([N2O]/[N2O + N2])*100 after 15 days incubation of batch cultures of three different Thauera strains (K172, NS1 and TK001) as a function of varying initial N2O concentrations (0.05 to ∼ 1.0 mmol L–1), and varying initial pH values (8.10 to 9.80). Error bars represent standard errors for two replicates.
The expression of denitrification genes (nirS and nosZ; equation 6) was tested using reverse transcription qPCR (RT-qPCR) analysis to determine the role of these genes in prolonged transient accumulation of denitrification intermediates (NO2– and N2O) under high pH conditions.

The reduction of NO3–, production of N2 and expression of these genes was quantified in a separate experiment conducted at pH values identical to those measured in the cultures of denitrifying Thauera strains (Figures 4, 6). After 15 days of incubation, NO3– was completely reduced to NO2– in all the cultures except K172 cultures with pH of 9.42 and 9.87 (Supplementary Figure 6). The NO2– formed was further reduced completely in cultures with TK001 but not in cultures with K172 and NS1. The remaining NO2– concentrations were 5 to 6 fold lower (0.02 to 0.05 mmol L–1) in cultures inoculated with K172 than those with NS1 (0.13 to 0.26 mmol L–1). Nitrous oxide was not detected in any of the TK001 cultures throughout the incubation period, while minimal amounts of N2O (< 0.001 mmol L–1) were produced in cultures with NS1 and pH 9.88. Comparatively higher amounts of N2O (0.02 to 0.24 mmol L–1) accumulated in cultures with K172. The concentrations of NO2– and N2O in cultures of both these strains (K172 and NS1) correlated with their pH values. Increased pH values were associated with increased concentrations of these intermediates detected in these cultures.
For quantification of nirS and nosZ genes, the 16S rRNA gene was used as a control and their relative abundances at higher pH values were compared to those at optimum pH conditions using the 2–ΔΔCT method (Schmittgen and Livak, 2008). The standard curves for qPCR calibration were linear (R2 = 0.99) for all the three genes with amplification efficiencies between 96.8 to 102.6 % (Table 3). The amounts of N2 produced decreased with an increase in pH of cultures with the three Thauera strains; up to a 2.40, 1.66 and 1.48-fold decrease was observed for cultures inoculated with K172, NS1 and TK001, respectively as compared to the cultures with optimum pH (Figure 6). The decrease was most evident in the cultures exhibiting pH values between 9.11 and 9.90. The RT-qPCR analysis of nirS and nosZ transcripts supported this decrease of N2 production in batch cultures with K172 (Figure 6A). The nirS transcription levels in these cultures were 5.79 to 7.72-fold lower than the control cultures except for the cultures having pH values of 9.42 and 9.87. The abundance of nirS in these cultures increased by 1.40 to 1.59-fold as compared to its abundance at optimum pH conditions. The higher pH levels more greatly impacted the transcription levels of nosZ as its abundance decreased by 7.13 to 20.38-fold in these cultures (Figure 6A). Note that the samples for qPCR from K172 cultures were taken during the exponential growth phases; t = 2 and t = 5 to 15 days for optimum pH and higher pH conditions, respectively.

Figure 6. Changes in production of N2 and expression of denitrification genes (NirS and NosZ) as a function of increasing pH in batch cultures of denitrifying Thauera strains (K172, NS1 and TK001) amended with 1 mmol L–1 of NO3– and acetate. The red star (*) indicates optimum pH-7.5 taken as equivalent to 1 for comparison with high pH conditions. Error bars represent standard errors for three replicates.
The bacterial cells for RT-qPCR were collected at the same time, t = 5 and t = 15 days, for cultures inoculated with strains TK001 and NS1, respectively. Both nirS and nosZ were highly expressed in the cultures with NS1 and TK001 at all high pH conditions despite less N2 production (Figures 6B,C). For culture NS1, the nirS transcription levels were 1.77 to 6.86-fold higher in the cultures containing increased pH compared to the optimum pH control. The nosZ transcription levels also followed the similar pattern except in cultures having pH values of 7.77 and 8.56. In fact, the abundance of nosZ decreased by 1.10 to 1.39-fold in these cultures (Figure 6B). In all TK001 cultures incubated under all conditions, nosZ was more abundantly transcribed than nirS. However, the abundance of both these genes was higher under higher pH conditions than at the control pH. The transcription levels of nirS and nosZ were 1.61 to 2.44 and 1.83 to 3.30-fold higher, respectively, in these cultures (Figure 6C). The observed difference in the expression patterns and transcription levels of nirS and nosZ in cultures with three Thauera strains may be attributed to differences in their denitrification kinetics, sensitivity to pH stress conditions, and sampling times for analysis.
This study focused on the effects of physico-chemical parameters of the microbial growth environment on the metabolic activities of denitrifying bacterial isolates affiliated to the genus Thauera, namely T. aromatica K172, T. aromatica NS1 and T. aminoaromatica TK001. The biokinetic experiments conducted at 30°C and under anoxic conditions showed denitrification differences between these strains. Strains of Thauera previously studied were grouped into two categories based on the observed differences in their denitrification regulatory phenotypes (DRPs; Liu et al., 2013). The strains were characterized either by rapid, complete onset (RCO) or by progressive onset (PO) of denitrification genes linked to NO3– reduction and accumulation of intermediates like NO2– (Liu et al., 2013). At lower NO3– concentrations (∼1 mmol L–1), strains K172 and TK001 displayed an RCO type of DRP with non-detectable NO2– and N2O accumulation during denitrification coupled with acetate oxidation (Figures 1A,C). However, strain S2 studied by Liu et al. (2013), and similar to strain TK001, was reported to have a PO type of DRP upon reduction of NO3– (2 mM per 50 mL) coupled to acetate oxidation. The observed differences between the two T. aminoaromatica strains (TK001 and S2) in these two independent studies seem to be less related to similar culture conditions used than their reported metabolic activities. Even though there are high 16S rRNA gene sequence similarities (99% sequence identity), considerable phenotypic differences are known to exist between these two strains (Mechichi et al., 2002; Fida et al., 2016). The type strain K172 that showed similar denitrification phenotypic traits as TK001 in this study was also revealed to be genotypically different in its protein profile compared to strain S2 (Mechichi et al., 2002). The variation in observed DRPs of these strains could possibly be related to the expression patterns of proteins and abundance of denitrification genes (Mechichi et al., 2002; Liu et al., 2013). In contrast, strain NS1 exhibited similarities to a PO type of DRP and transient accumulation of NO2– resulting from reduction of NO3– (Figure 1B). This strain is phylogenetically more related to strains K172 and S100 (> 90% 16S rRNA gene similarity; Suri et al., 2019) but unexpectedly showed lower denitrification rates as compared to the type strain K172 under identical denitrifying culture conditions.
At higher NO3– concentrations (> 2 mmol L–1), the denitrification kinetics of the three Thauera strains became more similar showing a PO type of DRP and prolonged accumulation of NO2– and N2O (Figure 2 and Table 4), even at an ideal temperature (30°C). Suri et al. (2017) reported incomplete NO3– reduction and persistence of relatively high concentrations of NO2– formed through reduction of similarly high NO3– concentrations under these conditions. The toxicity posed by produced NO2– to dominant Thauera and Pseudomonas species was thought to be the reason but was not evaluated. In the present study, the NO2– accumulated to maximum concentration of 3.2 mmol L–1 in microcosms (Table 4). The exposure of Thauera strains to NO2– concentrations (0.9 to 5.2 mmol L–1), even higher than the accumulated concentrations (0.01 to 3.19 mmol L–1), did not appear to be inhibitory (Supplementary Figure 4). Instead, the denitrification rates were slower and ceased after reduction of 1.9 mmol L–1 NO2–. The use of NO2– as compared to NO3– as a sole initial electron acceptor had a variable impact on the DRPs. Strains TK001 and NS1 behaved similarly showing a RCO type of DRP but K172 showed a PO type of DRP. Strain K172 only partially reduced NO2– to N2 producing N2O as a product in addition to N2 (Supplementary Figures 2, 4 and Figure 3). In contrast, Liu et al. (2013) showed N2O produced as the only end product by T. phenylacetica characterized to have PO type of DRP. Considerable genotypic differences exist between these tested species, namely T. aromatica and T. phenylacetica, that appeared to be a reason for observed differences in their DRPs (Suri et al., 2019).
The impaired reduction of NO3– and the produced intermediate NO2– by Thauera strains under the influence of increasing temperature and decreasing electron donor concentrations has previously been shown in the laboratory (Fida et al., 2016; Suri et al., 2017). At temperatures above 45°C and at NO3– concentrations equivalent to the 1 mmol L–1 concentration used in this study, denitrification halts at NO2– (Reinsel et al., 1996; Greene et al., 2003; Fida et al., 2016; Okpala et al., 2017). However, subsequent complete reduction of NO2– to N2 occurs at temperatures below 45°C provided sufficient amounts of preferable electrons donors are available (Voordouw et al., 2009; Fida et al., 2016; Okpala et al., 2017). Similar patterns of NO2– persistence during NO3– reduction can also occur with an increase in salinity from 0.5 to 2.5 M (An et al., 2017). Here, we additionally demonstrate that pH changes, particularly alkalinity, can cause substantive impact on denitrification. The assays performed demonstrate that the denitrification product ratios (NO2–: N2O: N2) can vary with the variation in pH (Figure 4 and Table 5).
Higher pH conditions (pH ≥ 9) had a greater impact on the production and reduction of NO2– and N2O compared to the use of high NO3– concentrations (> 2 mmol L–1) by Thauera species. Such a pH effect has also been reported in other studies. At a pH of 8 and higher, the growth of Dechloromonas aromatica strain RCB was inhibited and there was accumulation of substantial amounts of N2O during NO3– reduction (Han et al., 2019). In contrast, transient to permanent accumulation of NO2– and N2O have been observed at neutral to acidic pH conditions. For instance, rates of denitrification in Thauera, Pseudomonas and Paracoccus cultures were lower, with increasing accumulated concentrations of NO2– and N2O at pH values of 6.0 to 7.5 (Bergaust et al., 2010; Suri et al., 2017; Kim et al., 2017). In this present study, the accumulation of NO2– at pH 7.5 was observed only for strain NS1 but was further reduced to N2 (Figure 1).
Microbial metabolisms vary with the type and concentration of electron donor, which can substantially affect pH and alkalinity (Gallagher et al., 2012). Acetate is a highly degradable electron donor readily available in many natural environments and its use in this study contributed to pH increase (Figure 4). Denitrifiers like Thauera and Pseudomonas also possess abilities to use other organic electron donors for driving their metabolism and energy processes (Agrawal et al., 2012; Suri et al., 2017; An et al., 2017). The effect of pH increase on NO3– reduction could be mitigated by using electron donors that do not cause pH shifts upon oxidation. Nonetheless, the use of acetate in the current study helped to gain initial knowledge on the overall variable effect of pH on the outcomes of denitrification.
The key enzymes that catalyze the reduction of NO2– to N2O and of N2O to N2 are nitrite reductase and nitrous oxide reductase, respectively. These enzymes are encoded by the nirS (nitrite reductase) and nosZ (nitrous oxide reductase) genes in many Thauera species and are intracellular but can undergo considerable changes in response to fluctuations in pH and other environmental conditions (Zumft, 1997; Wilks and Slonczewski, 2007; Fida et al., 2016). The mechanisms can include altered enzyme synthesis, inhibition of enzyme function and/or reduced or delayed transcription of denitrification genes (Bergaust et al., 2010; Liu et al., 2010; Fida et al., 2016). Our results indicated a correlation of high pH with reduced transcription of the nirS (at pH 7.8-9.0) and nosZ (at pH 7.8-9.9) genes resulting in less complete denitrification and lower N2 production in cultures of strain K172. Unexpectedly, even though the transcriptional levels of nirS were higher at pH ≥ 9, the amount of N2O produced from reduction of NO2– was much lower than that produced at pH ≤ 9 (Figure 6A, and Supplementary Figure 6A). Nitrate was not completely reduced in these cultures. Since NO3– is a preferred electron acceptor compared to NO2– and N2O, one possible explanation for our observation is that nitrate reductase (encoded by the nar gene and not quantified in this study) was still active and can compete more efficiently for electrons than nirS, thus causing partial denitrification (Almeida et al., 1995; Liu et al., 2013). The protons from the inside of cytoplasmic membrane are used for NO3– reduction while those from the periplasmic side of cytoplasmic membrane are used for NO2– reduction. At pH ≥ 9, protons may be comparatively scarce in the periplasm than at pH ≤ 9, thus resulting in inhibition of enzyme activity of nitrite reductase even though nirS transcriptional levels were high (Meijer et al., 1979; Glass and Silverstein, 1998). In contrast, the transcriptional levels of nirS increased only after depletion of NO3– in cultures of Thauera terpenica (Liu et al., 2013).
The transcriptional levels of nirS and nosZ were similar in cultures of strain TK001 at a tested pH, which is characterized to have the RCO type of DRP (Figures 6C, 1). The levels and expression patterns of the nirS and nosZ genes in cultures of Thauera sp. 63 with an RCO type of DRP were also shown to be similar during denitrification at pH 7.5 (Liu et al., 2013). The transcriptional levels of both these genes increased similarly at the beginning of denitrification, reached similar maximum levels and then decreased at the end of denitrification, however, the abundances of nosZ transcripts were sustained at higher levels than nirS transcripts, similar to our experiments (Liu et al., 2013; Figure 6C). Both nirS and nosZ were expressed simultaneously at each pH; however, the timing of maximum transcription was delayed with the increase in pH of cultures. This observation suggested that a decrease in the rates of denitrification at pH > 7.5 were caused by slower enzyme activity in comparison to that observed at pH 7.5, as was evident from lower N2 production at the incubation time assayed (t = 5 days; Figure 6C). Similar patterns of increased transcriptional levels of nirS and nosZ with the increase in pH were observed in NS1 cultures. Nitrite accumulated in these cultures, an expected effect of the PO type of DRP of this strain (Supplementary Figures 1, 6B and Figure 6). The temporary shut down of electron flow to nitrite reductase, deficiency of co-factors such as Cu required for its activity, inhibition of translation of its mRNA and/or repression of its activity at high pH and high NO2– concentrations can also cause NO2– to accumulate (Stouthamer, 1991; Baumann et al., 1997; Granger and Ward, 2003). Since there was sufficient electron donor (acetate) present, the observed inhibited NO2– reduction can possibly be explained by inhibition of nitrite reductase activity and DRP of the strain. The minimal N2O accumulation observed can be explained by the DRP of this strain, with lower transcription levels of nosZ and less N2O production by NO2– reduction (Figure 1 and Supplementary Figure 6). It has been suggested in previous studies that the accumulation of N2O during denitrification depends on the difference in rates of its production and reduction, but pH increase only lowered its reduction rate without any significant effect on its production upon NO2– reduction (Betlach and Tiedje, 1981; Liu et al., 2010; Han et al., 2019). In our study, the pronounced decrease in N2O reduction at concentrations, 0.69 to 0.93 to mmol L–1 and pH 9.8 can explain the observed accumulation of N2O (Figures 3, 5). In contrast, transient to permanent N2O accumulation at slightly acidic conditions (pH 6.0) has been repeatedly demonstrated for denitrifiers like Paracoccus denitrificans and Shewanella loihica (Bergaust et al., 2010; Liu et al., 2014; Kim et al., 2017). Variable patterns of reduced affinities of nosZ to N2O and reduced copy numbers of nosZ can explain the relevant decrease in its reduction rates. The transcription of nosZ was unaffected at optimal pH while it was lower at alkaline pH during denitrification in other studies (Liu et al., 2014; Kim et al., 2017; Han et al., 2019). Nitric oxide, not analyzed in our studies, has known toxicity to many microorganisms and can inhibit the activity of key enzymes including nitrous oxide. Based on the results obtained in this study, the observed decrease in the rates of denitrification by Thauera strains can be overall explained by inhibition of denitrification enzyme activities caused by lower or delayed transcription of genes encoding these enzymes and reduced affinity of these enzymes to substrates at tested high pHs.
Other researchers have shown the importance of thermophilicity, salinity and electron donors in NO3–-mediated industrial applications (Fida et al., 2016; An et al., 2017; Chen et al., 2017). This study provides information on the impact of N sources, their initial concentrations, and pH. The observed accumulation of NO2– and N2O upon NO3– reduction at increased pH is desirable in control of sulfide formation in soured oil fields. Although the results from our experiments with NO2– as a sole electron acceptor suggested that the use of NO2– to inhibit SRB would be preferable to the use of NO3–, this may not be favorable in other applications, such as wastewater treatment. In such cases, this reaction can readily cause damage to other beneficial microorganisms and aquatic life through increasing NO2– concentrations over time or discharge of NO2– rich waters in different aquifers (Philips et al., 2002; Zhou et al., 2011). Also, in applications such as MEOR, the reduction of NO2– to N2 is required for enhanced oil production (Gassara et al., 2015; Suri et al., 2019).
Based on our findings, we hypothesize that NO3– injections require careful adjustment of pH (e.g., liming) of oil reservoir waters to an alkaline pH range that could maintain a longer presence of denitirificaiton intermediates (NO2– and/or N2O) for more effective souring control even at mesophilic conditions. On the other hand, maintaining optimal pH levels to facilitate complete reduction of NO3– to N2 for activating maximum dissolved and free phase gas pressure for applications like MEOR could be managed by careful selection of N-sources and/or pH buffering.
The microbial communities in these applications are often complex and consist of actively interacting and competing bacterial species. Since the knowledge obtained here is based on studies of a single genus and a limited number of model strains, the suggested roles of these parameters in practical applications needs to be tested rigorously in laboratory to obtain a further proof-of-concept. More information is needed on the regulatory controls on exhibition of denitrification outcomes by wide range of denitrifiers from different ecosystems. Our studies may not be able to account for variations in denitrification outcomes as a response to changed physiological conditions in these scenarios. However, results of this work provide a solid basis for future research and long-term evaluations of correlations between N-source, alkalinity, pH, and end products of denitrification in various industrial systems.
The datasets presented in this study can be found in online repositories. The names of the repository/repositories and accession number(s) can be found in the article/Supplementary Material.
NS planned and conducted the experiments, collected, analyzed, and interpreted the data, drafted and revised the manuscript. YZ helped in conducting experiments, analyzing data and revising the manuscript. LMG supervised the work through ideas and discussions and revised the manuscript. MCR supervised the work, discussed obtained data, revised and approved the manuscript to be published. All authors contributed to the article and approved the submitted version.
This work was supported by a Mitacs-Kerui grant awarded to MCR and Global Research Initiative-Canada First Research Excellence Award awarded to the University of Calgary. An NSERC Collaborative Research and Development grant awarded to LMG also partially supported this research.
The authors declare that the research was conducted in the absence of any commercial or financial relationships that could be construed as a potential conflict of interest.
We thank Yin Shen and Hobart Si for laboratory and technical support.
The Supplementary Material for this article can be found online at: https://www.frontiersin.org/articles/10.3389/fmicb.2021.610389/full#supplementary-material
Agrawal, A., Park, H. S., Nathoo, S., Gieg, L. M., Jack, T. R., Miner, K., et al. (2012). Toluene depletion in produced oil contributes to souring control in a field subjected to nitrate injection. Environ. Sci. Technol. 46, 1285–1292. doi: 10.1021/es203748b
Almeida, J. S., Reis, M. A. M., and Carrondo, M. J. T. (1995). Competition between nitrate and nitrite reduction in denitrification by Pseudomonas fluorescens. Biotechnol. Bioeng. 46, 476–484.
An, B. A., Shen, Y., and Voordouw, G. (2017). Control of sulfide production in high salinity bakken shale oil reservoirs by Halophilic bacteria reducing nitrate to nitrite. Front. Microbiol. 8:1164. doi: 10.3389/fmicb.2017.01164
Anders, H. J., Kaetzke, A., Kaempfer, P., Ludwig, W., and Fuchs, G. (1995). Taxonomic position of aromatic-degrading denitrifying pseudomonad strains K 172 and KB 740 and their description as new members of the genera Thauera, as Thauera aromatica sp. nov., and Azoarcus, as Azoarcus evansii sp. nov., respectively, members of the beta subclass of the Proteobacteria. Int. J. Syst. Bacteriol. 45, 327–333.
Baumann, B., van deer Meer, J. R., Snozzi, M., and Zehnder, A. J. B. (1997). Inhibition of denitrification activity but not of mRNA induction in Paracoccus denitrificans by nitrite at a suboptimal pH. Antonie Leeuwenhoek 72, 183–189.
Bergaust, L., Mao, Y., Bakken, L., and Frostegard, A. (2010). Denitrification response patterns during the transition to anoxic respiration and posttranscriptional effects of suboptimal pH on nitrous oxide reductase in Paracoccus denitrificans. Appl. Environ. Microbiol. 76, 6387–6396. doi: 10.1128/AEM.00608-10
Betlach, M. R., and Tiedje, J. M. (1981). Kinetic explanation for accumulation of nitrite, nitric oxide, and nitrous oxide during bacterial denitrification. Appl. Environ. Microbiol. 42, 1074–1084.
Braker, G., Fesefeldt, A., and Witzel, K.-P. (1998). Development of PCR primer systems for amplification of nitrite reductase genes (nirK and nirS) to detect denitrifying bacteria in environmental samples. Appl. Environ. Microbiol. 64, 3769–3775.
Bustin, S. A., Benes, V., Garson, J. A., Hellemans, J., Huggett, J., Kubista, M., et al. (2009). The MIQE guidelines: minimum information for publication of quantitative real-time PCR experiments. Clin. Chem. 55, 611–622. doi: 10.1373/clinchem.2008.112797
Callbeck, C. C., Agrawal, A., and Voordouw, G. (2013). Acetate production from oil under sulfate-reducing conditions in bioreactors injected with sulfate and nitrate. Appl. Environ. Microbiol. 79, 5059–5068. doi: 10.1128/AEM.01251-13
Capua, F. D., Pirozzi, F., Lens, P. N. L., and Esposito, G. (2019). Electron donors for autotrophic denitrification. Chem. Eng. J. 362, 922–937. doi: 10.1016/j.cej.2019.01.069
Chakraborty, R., and Coates, J. D. (2004). Anaerobic degradation of monoaromatic hydrocarbons. Appl. Microbiol. Biotechnol. 64, 437–446.
Chen, C., Shen, Y., An, D., and Voordouw, G. (2017). Use of acetate, propionate, and butyrate for reduction of nitrate and sulfate and methanogenesis in microcosms and bioreactors simulating an oil reservoir. Appl. Environ. Microbiol. 83:e02983-16. doi: 10.1128/AEM.02983-16
Evans, P. J., Mang, D. T., Kim, K. S., and Young, L. Y. (1991). Anaerobic degradation of toluene by a denitrifying bacterium. Appl. Environ. Microbiol. 57, 1139–1145.
Fida, T. T., Chen, C., Okpala, G., and Voordouw, G. (2016). Implications of limited thermophilicity of nitrite reduction for control of sulfide. Appl. Environ. Microbiol. 82, 4190–4199. doi: 10.1128/AEM.00599-16
Foss, S., and Harder, J. (1998). Thauera linaloolentis sp. nov. and Thauera terpenica sp. nov., isolated on oxygen containing monoterpenes (linalool, menthol, and eucalyptol) nitrate. Syst. Appl. Microbiol. 21, 365–373.
Gallagher, K. L., Kading, T. J., Braissant, O., Dupraz, C., and Visscher, P. T. (2012). Inside the alkalinity engine: the role of electron donors in organomineralization potential of sulfate-reducing bacteria. Geobiology 10, 518–530. doi: 10.1111/j.1472-4669.2012.00342.x
Gassara, F., Suri, N., Stanislav, P., and Voordouw, G. (2015). Microbially enhanced oil recovery by sequential injection of light hydrocarbon and nitrate in low- and high-pressure bioreactors. Environ. Sci. Technol. 49, 12594–12601. doi: 10.1021/acs.est.5b03879
Gieg, L. M., Jack, T. R., and Foght, J. M. (2011). Biological souring and mitigation in oil reservoirs. Appl. Microbiol. Biotechnol. 92, 263–282. doi: 10.1007/s00253-011-3542-6
Glass, C., and Silverstein, J. (1998). Denitrification kinetics of high nitrate concentration water: pH effect on inhibition and nitrite accumulation. Water Res. 32, 831–839. doi: 10.1016/S0043-1354(97)00260-1
Granger, J., and Ward, B. B. (2003). Accumulation of nitrogen oxides in copper-limited cultures of denitrifying bacteria. Limnol. Oceanogr. 48, 313–318. doi: 10.4319/lo.2003.48.1.0313
Greene, E. A., Hubert, C., Nemati, M., Jenneman, G. E., and Voordouw, G. (2003). Nitrite reductase activity of sulphate-reducing bacteria prevents their inhibition by nitrate-reducing, sulphide-oxidizing bacteria. Environ. Microbiol. 5, 607–617. doi: 10.1046/j.1462-2920.2003.00446.x
Han, H., Song, B., Song, M. J., and Yoon, S. (2019). Enhanced nitrous oxide production in denitrifying Dechloromonas aromatica strain RCB under salt or alkaline stress conditions. Front. Microbiol. 10:1203. doi: 10.3389/fmicb.2019.01203
Henry, S., Bru, D., Stres, B., Hallet, S., and Philippot, L. (2006). Quantitative detection of the nosZ gene, encoding nitrous oxide reductase, and comparison of the abundances of 16S rRNA, narG, nirK, and nosZ genes in soils. Appl. Environ. Microbiol. 72, 5181–5189. doi: 10.1128/AEM.00231-06
Huno, S. K. M., Rene, E. R., van Hullebusch, E. D., and Annachhatre, A. P. (2018). Nitrate removal from groundwater: a review of natural and engineered processes. J. Water Suppl. Res. Tech. Aqua 67, 885–902. doi: 10.2166/aqua.2018.194
Kim, H., Park, D., and Yoon, S. (2017). pH control enables simultaneous enhancement of nitrogen retention and N2O reduction in Shewanella loihica strain PV-4. Front. Microbiol. 8:1820. doi: 10.3389/fmicb.2017.01820
Korom, S. F. (1992). Natural denitrification in the saturated zone: a review. Water Resour. Res. 28, 1657–1688.
Lazar, I., Petrisor, I. G., and Yen, T. F. (2007). Microbial enhanced oil recovery (MEOR). Pet. Sci. Technol. 25, 1353–1366. doi: 10.1080/10916460701287714
Liu, B., Frostegard, A., and Bakken, L. R. (2014). Impaired reduction of N2O to N2 in acid soils is due to a posttranscriptional interference with the expression of nosZ. mBio 5:e01383-14. doi: 10.1128/mBio.01383-14
Liu, B., Mao, Y., Bergaust, L., Bakken, L. R., and Frostegard, A. (2013). Strains in the genus Thauera exhibit remarkably different denitrification regulatory phenotypes. Environ. Microbiol. 15, 2816–2828. doi: 10.1111/1462-2920.12142
Liu, B., Mørkved, P. T., Frostegård, Å, and Bakken, L. R. (2010). Denitrification gene pools, transcription and kinetics of NO, N2O and N2 production as affected by soil pH. FEMS Microbiol. Ecol. 72, 407–417. doi: 10.1111/j.1574-6941.2010.00856.x
Löffler, F. E., Sanford, R. A., and Ritalahti, K. M. (2005). Enrichment, cultivation, and detection of reductively dechlorinating bacteria. Method Enzymol. 397, 77–111. doi: 10.1016/S0076-6879(05)97005-5
Londry, K. L., and Suflita, J. M. (1999). Use of nitrate to control sulfide generation by sulfate-reducing bacteria associated with oily waste. J. Ind. Microbiol. Biotechnol. 22, 582–589. doi: 10.1038/sj.jim.29006
Mechichi, T., Stackebrandt, E., Gad’on, N., and Fuchs, G. (2002). Phylogenetic and metabolic diversity of bacteria degrading aromatic compounds under denitrifying conditions, and description of Thauera phenylacetica sp. nov., Thauera aminoaromatica sp. nov., and Azoarcus buckelii sp. nov. Arch. Microbiol. 178, 26–35. doi: 10.1007/s00203-002-0422-6
Meijer, E. M., van der Zwaan, J. W., Wever, R., and Stouthamer, A. H. (1979). Anaerobic respiration and energy conservation in Paracoccus denitrificans. Functioning of iron sulfur centers and the uncoupling effect of nitrite. Eur. J. Biochem. 96, 69–76. doi: 10.1111/j.1432-1033.1979.tb13014.x
Montzka, S. A., Dlugokencky, E. J., and Butler, J. H. (2011). Non-CO2 greenhouse gases and climate change. Nature 476, 43–50. doi: 10.1038/nature10322
Okpala, G. N., Chen, C., Fida, T., and Voordouw, G. (2017). Effect of thermophilic nitrate reduction on sulfide production in high temperature oil reservoir samples. Front. Microbiol. 8:1573. doi: 10.3389/fmicb.2017.01573
Okpala, G. N., and Voordouw, G. (2018). Comparison of nitrate and perchlorate in controlling sulfidogenesis in heavy oil-containing bioreactors. Front. microbiol. 9:2423. doi: 10.3389/fmicb.2018.02423
Philippot, L., Mirleau, P., Mazurier, S., Siblot, S., Hartmann, A., Lemanceau, P., et al. (2001). Characterization and transcriptional analysis of Pseudomonas fluorescens denitrifying clusters containing the nar, nir, nor and nos genes. Biochim. Biophys. Acta 16, 436–440. doi: 10.1016/S0167-4781(00)00286-4
Philips, S., Laanbroek, H. J., and Verstraete, W. (2002). Origin, causes and effects of increased nitrite concentrations in aquatic environments. Rev. Environ. Sci. Biotechnol. 1, 115–141.
Ravishankara, A. R., Daniel, J. S., and Portmann, R. W. (2009). Nitrous oxide (N2O): the dominant ozone-depleting substance emitted in the 21st century. Science 326, 123–125. doi: 10.1126/science.1176985
Reinsel, M. A., Sears, J. T., Stewart, P. S., and McInerney, M. J. (1996). Control of microbial souring by nitrate, nitrite or glutaraldehyde injection in a sandstone column. J. Ind. Microbiol. 17, 128–136.
Rocca, C. D., Belgiorno, V., and Meric, S. (2007). Overview of in-situ applicable nitrate removal processes. Desalination 204, 46–62. doi: 10.1016/j.desal.2006.04.023
Safdel, M., Anbaz, M. A., Daryasafar, A., and Jamialahmadi, M. (2017). Microbial enhanced oil recovery, a critical review on worldwide implemented field trials in different countries. Renew. Sustain. Energy Rev. 74, 159–172. doi: 10.1016/j.rser.2017.02.045
Sander, R. (2015). Compilation of Henry’s law constants (version 4.0) for water as solvent. Atmos. Chem. Phys. 15, 4399–4981. doi: 10.5194/acp-15-4399-2015
Schmittgen, T. D., and Livak, K. J. (2008). Analyzing real-time PCR data by the comparative CT method. Nature Protoc. 3, 1101–1108. doi: 10.1038/nprot.2008.73
Schumpe, A. (1993). The estimation of gas solubilities in salt solutions. Chem. Eng. Sci. 48, 153–158. doi: 10.1016/0009-2509(93)80291-W
Schumpe, A., Quicker, G., and Deckwer, W.-D. (1982). Gas solubilities in microbial culture media. Adv. Biochem. Eng. Biotechnol. 24, 1–38.
Shen, Y., Agrawal, A., Suri, N. K., An, D., Voordouw, J. K., Clark, R. G., et al. (2018). Control of microbial sulphate production by limiting sulfate dispersal in a water-injected oil field. J. Biotechnol. 266, 14–16. doi: 10.1016/j.jbiotec.2017.11.016
Soares, M. I. M. (2000). Biological denitrification of groundwater. Water Air Soil Pollut. 123, 183–193. doi: 10.1023/A:1005242600186
Sørensen, J., Tiedje, J. M., and Firestone, R. B. (1980). Inhibition by sulfide of nitric and nitrous oxide by denitrifying Pseudomonas fluorescens. Appl. Environ. Microbiol. 39, 105–110.
Spormann, A. M., and Widdel, F. (2000). Metabolism of alkylbenzenes, alkanes, and other hydrocarbons in anaerobic bacteria. Biodegradation 11, 85–105. doi: 10.1023/A:1011122631799
Stouthamer, A. H. (1991). Metabolic regulation including anaerobic metabolism in Paracoccus denitrificans. J. Bioenerg. Biomembr. 23, 163–185. doi: 10.1007/BF00762216
Suri, N., Gassara, F., Stanislav, P., and Voordouw, G. (2019). Microbially enhanced oil recovery by alkylbenzene-oxidizing nitrate-reducing bacteria. Front. Microbiol. 10:1243. doi: 10.3389/fmicb.2019.01243
Suri, N., Voordouw, J., and Voordouw, G. (2017). The effectiveness of nitrate mediated control of the oil field sulfur cycle depends on the toluene content of the oil. Front. Microbiol. 8:956. doi: 10.3389/fmicb.2017.00956
Tschech, A., and Fuchs, G. (1987). Anaerobic degradation of phenol by pure cultures of newly isolated denitrifying pseudomonads. Arch. Microbiol. 148: 213–217. doi: 10.1007/BF00414814
Van Spanning, R. J. M., Richardson, D., and Ferguson, S. J. (2007). “Introduction to the biochemistry and molecular biology of denitrification,” in Biology of the Nitrogen Cycle, eds H. Bothe, S. Ferguson, and W. E. Newton (Amsterdam: Elsevier), 4–20.
Voordouw, G., Grigoryan, A. A., Lambo, A., Lin, S., Park, H. S., Jack, T. R., et al. (2009). Sulfide remediation by pulsed injection of nitrate into a low temperature Canadian heavy oil reservoir. Environ. Sci. Technol. 43, 9512–9518. doi: 10.1021/es902211j
Widdel, F., and Bak, F. (1992). “Gram-negative mesophilic sulfate-reducing bacteria,” in The Prokaryotes, eds A. Balows, H. Truuper, M. Dworkin, W. Harder, and K. H. Schleifer (New York, NY: Springer-Verlag), 3352–3378.
Wilks, J. C., and Slonczewski, J. L. (2007). pH of the cytoplasm and periplasm of Escherichia coli: rapid measurement by green fluorescent protein fluorimetry. J. Bacteriol. 189, 5601–5607. doi: 10.1128/jb.00615-07
Zhou, Y., Oehmen, A., Lim, M., Vadivelu, V., and Ng, W. J. (2011). The role of nitrite and free nitrous acid (FNA) in wastewater treatment plants. Water Res. 45, 4672–4682. doi: 10.1016/j.watres.2011.06.025
Zhu, I., and Getting, T. (2012). A review of nitrate reduction using inorganic materials. Environ. Technol. Rev. 1, 46–58. doi: 10.1080/09593330.2012.706646
Keywords: denitrification, Thauera, NO3– concentration, NO2– accumulation, pH, denitrification gene transcripts, souring, MEOR
Citation: Suri N, Zhang Y, Gieg LM and Ryan MC (2021) Denitrification Biokinetics: Towards Optimization for Industrial Applications. Front. Microbiol. 12:610389. doi: 10.3389/fmicb.2021.610389
Received: 25 September 2020; Accepted: 18 March 2021;
Published: 05 May 2021.
Edited by:
Hans Karl Carlson, Lawrence Berkeley National Laboratory, United StatesReviewed by:
Ang Li, Harbin Institute of Technology, ChinaCopyright © 2021 Suri, Zhang, Gieg and Ryan. This is an open-access article distributed under the terms of the Creative Commons Attribution License (CC BY). The use, distribution or reproduction in other forums is permitted, provided the original author(s) and the copyright owner(s) are credited and that the original publication in this journal is cited, in accordance with accepted academic practice. No use, distribution or reproduction is permitted which does not comply with these terms.
*Correspondence: Navreet Suri, bmtzdXJpQHVjYWxnYXJ5LmNh
Disclaimer: All claims expressed in this article are solely those of the authors and do not necessarily represent those of their affiliated organizations, or those of the publisher, the editors and the reviewers. Any product that may be evaluated in this article or claim that may be made by its manufacturer is not guaranteed or endorsed by the publisher.
Research integrity at Frontiers
Learn more about the work of our research integrity team to safeguard the quality of each article we publish.