
94% of researchers rate our articles as excellent or good
Learn more about the work of our research integrity team to safeguard the quality of each article we publish.
Find out more
ORIGINAL RESEARCH article
Front. Microbiol. , 26 February 2021
Sec. Evolutionary and Genomic Microbiology
Volume 12 - 2021 | https://doi.org/10.3389/fmicb.2021.598060
 Yao Yu1,2,3†
 Wenjuan Mo1,2†Haiyan Ren1,2Xianmei Yang1,2Wanlin Lu1,2Tongyu Luo1,2Junyuan Zeng1,2Jungang Zhou1,2,3
 Ji Qi1*Hong Lu1,2,3*
Kluyveromyces marxianus is a promising host for producing bioethanol and heterologous proteins. It displays many superior traits to a conventional industrial yeast species, Saccharomyces cerevisiae, including fast growth, thermotolerance and the capacity to assimilate a wider variety of sugars. However, little is known about the mechanisms underlying the fast-growing feature of K. marxianus. In this study, we performed a comparative genomic analysis between K. marxianus and other Saccharomycetaceae species. Genes involved in flocculation, iron transport, and biotin biosynthesis have particularly high copies in K. marxianus. In addition, 60 K. marxianus specific genes were identified, 45% of which were upregulated during cultivation in rich medium and these genes may participate in glucose transport and mitochondrion related functions. Furthermore, the transcriptomic analysis revealed that under aerobic condition, normalized levels of genes participating in TCA cycles, respiration chain and ATP biosynthesis in the lag phase were higher in K. marxianus than those in S. cerevisiae. Levels of highly copied genes, genes involved in the respiratory chain and mitochondrion assembly, were upregulated in K. marxianus, but not in S. cerevisiae, in later time points during cultivation compared with those in the lag phase. Notably, during the fast-growing phase, genes involved in the respiratory chain, ATP synthesis and glucose transport were co-upregulated in K. marxianus. A few shared motifs in upstream sequences of relevant genes might result in the co-upregulation. Specific features in the co-regulations of gene expressions might contribute to the fast-growing phenotype of K. marxianus. Our study underscores the importance of genome-wide rewiring of the transcriptional network during evolution.
For decades, microorganisms have been used as cell factories to produce industrial compounds, including biofuels, bulk chemicals, pharmaceuticals, and heterologous proteins. Saccharomyces cerevisiae is the most commonly used eukaryotic cell factory, thanks to its safe status, ease of genetic manipulation and a wealth of genomic, genetic, and biochemical knowledge (Nielsen and Jewett, 2008). However, other non-conventional yeasts possess desirable features for niche applications and can provide several advantages over S. cerevisiae. Such yeasts have the potential to become the next-generation cell factories. Kluyveromyces marxianus is one such alternative yeast.
Kluyveromyces marxianus is a homothallic, hemiascomycete yeast commonly isolated in dairy products and fruits. It belongs to the Saccharomycetaceae family and is phylogenetically related to S. cerevisiae with many superior traits. For examples, K. marxianus can assimilate inulin, lactose and pentose sugars such as xylose and arabinose, which can not be utilized by S. cerevisiae. K. marxianus is more thermotolerant, as it can grow at a temperature up to 52 degrees (Lane and Morrissey, 2010; Gombert et al., 2016). Notably, K. marxianus is the fastest-growing eukaryote known so far (Groeneveld et al., 2009). The fastest growth rate of K. marxianus is 0.80 h–1, that of K. lactis is 0.50 h–1 (Lane and Morrissey, 2010), that of S. cerevisiae is 0.37 h–1 (Lane and Morrissey, 2010), and that of Pichia pastoris is 0.18 h–1 (Gao et al., 2012). Given its GRAS status and desirable traits, K. marxianus emerges as a promising host for producing bioethanol and heterologous proteins (Zoppellari and Bardi, 2013; Gombert et al., 2016; Mo et al., 2019). However, less is known about mechanisms underlying the desirable traits of K. marxianus, especially mechanisms of the fast-growing feature.
Kluyveromyces marxianus strains show a high level of genetic and phenotypic variation (Ortiz-Merino et al., 2018). Two K. marxianus strains have been completely sequenced and annotated, including DMKU 3-1042 (Lertwattanasakul et al., 2015), and NBRC1777 (Inokuma et al., 2015), while genomes of KCTC 17555 (Jeong et al., 2012), DMB1 (Suzuki et al., 2014), and CCT 7735 (Silveira et al., 2014) were draft sequences. Transcriptomic studies of K. marxianus were mainly focused on its physiological properties, such as xylose catabolism (Schabort du et al., 2016), high-temperature resistance (Lertwattanasakul et al., 2015), and ethanol tolerance (Mo et al., 2019). Few comparative transcriptomic studies have been performed between K. marxianus and other species in the Saccharomycetaceae family. For example, analysis of overall metabolic turnover and transcript dynamics in glycolysis and the TCA cycle revealed the difference in adaptive pyruvate metabolic response between K. marxianus and S. cerevisiae during aerobic growth (Sakihama et al., 2019).
FIM1 is a K. marxianus strain developed by for industrial applications. High yield of ethanol, vaccines and lignocellulolytic enzymes was achieved in the FIM1 strain (Zhou et al., 2018; Duan et al., 2019; Mo et al., 2019). In this study, we carried out a complete genome sequencing and annotation of the K. marxianus FIM1 strain. A comparative genomic analysis between K. marxianus and Saccharomycetaceae species was performed to characterize species-specific genes and particularly highly copied genes in K. marxianus. A comparative transcriptomic analysis was also performed between the K. marxianus and S. cerevisiae cells grown in the rich medium under aerobic condition. Results suggested that compared to S. cerevisiae, K. marxianus displayed increased expressions of genes participating in TCA cycles, respiration chain and ATP biosynthesis in the lag phase. During the exponential phase, K. marxianus exhibited a tighter co-upregulation of genes involved in the respiratory chain with those involved in ATP synthesis and glucose transport. The specific features of gene regulation in K. marxianus might shed light on the mechanisms underlying the fast growth feature of this species.
Kluyveromyces marxianus FIM1 strain used in this work was deposited at China General Microbiological Culture Collection Center (CGMCC, No 10621). S. cerevisiae S288c strain was used. FIM1 and S288c were growing in YPD liquid medium (2% glucose, 2% peptone, 1% yeast extract) under aerobic condition at 30°C.
Nuclear DNA was extracted from an overnight culture of K. marxianus FIM1 by a Yeast Genomic DNA Extraction Kit (D1900, Solarbio, China). Contigs were assembled using 300-bp pair-end reads by SOAPdenovo (Luo et al., 2012), then 3-kb and 8-kb mate-pair reads were used to construct scaffolds using program space, which resulted in eight scaffolds. The gaps in each scaffold were filled using long reads produced by PacBio RSII, and the low-quality bases were corrected by mapping 300-bp pair-end reads on the scaffolds. Protein-coding genes were predicted from the assembled genome by using the “Yeast Genome Annotation Pipeline” (Proux-Wera et al., 2012), and then blasted against NCBI non-redundant (nr) protein database with E-value cutoff as 10–5 for functional annotation. tRNAs were predicted by tRNAscan-SE (Lowe and Eddy, 1997). rRNAs were predicted by Barrnap1. Genome sequence and annotation GFF3 files of FIM1 were deposited in the NCBI with GenBank accession No. CP015054–CP015061 and assembly accession GCA_001854445.2.
Annotations of DMB1 (GenBank assembly accession GCA_000747785.1), KCTC 17555 (GenBank assembly accession GCA_000299195.2), and CCT 7735 (GenBank accession CP009303–CP009311) were performed as described above. Annotation GFF files of DMB1, KCTC 17555, and CCT 7735 genome were provided as Supplementary Files 1–3.
Genome of Kluyveromyces lactis NRRL Y-1140 (GenBank assembly accession GCA_000002515.1), Kluyveromyces aestuarii ATCC18862 (GCA_000179355.1), Eremothecium cymbalariae DBVPG7215 (GCA_000235365.1), Eremothecium gossypii ATCC10895 (GCA_000091025.4), Lachancea thermotolerans CBS6340 (GCA_000142805.1), Naumovozyma castellii CBS4309 (GCA_000237345.1), Naumovozyma dairenensis CBS421 (GCA_000227115.2), Kazachstania africana CBS2517 (GCA_000304475.1), Saccharomyces cerevisiae S288c (GCA_000146045.2), Tetrapisispora phaffii CBS4417 (GCA_000236905.1), Torulaspora delbrueckii CBS1146 (GCA_000243375.1), Zygosaccharomyces rouxii CBS732 (GCA_000026365.1), Pichia pastoris GS115 (GCA_001708105.1), and Yarrowia lipolytica CLIB122 (GCA_000002525.1) were downloaded from NCBI and protein sequences were extracted. First, an all-against-all BLAST was applied to these protein sequences with E-values < 10–5. Second, global protein similarities were calculated using InParanoid (O’Brien et al., 2005), and those matched with both sufficient gene coverage (>75%) and alignment identity (>50%) were left for further analyses. Third, ortholog groups, i.e., the ‘gene families,’ were identified by comparing protein alignments using OrthoMCL (Li et al., 2003). Multiple sequence alignment of proteins in each gene family was obtained using MUSCLE with default parameters (Edgar, 2004), and was further trimmed with trimAL (Capella-Gutierrez et al., 2009). Gene families containing a single copy of genes within each genome were concatenated into a supergene for the reconstruction of a phylogenetic tree, using the maximum likelihood method with 100 bootstrap replicates.
In a gene family of K marxianus, genes with the same functional annotation were considered as replicated genes and the copy number was counted. Functional annotation was performed by using the “Yeast Genome Annotation Pipeline” as described above. After families containing replicated genes were identified in K. marxianus, copy numbers of replicated genes in the corresponding families of other Saccharomycetales species were determined.
Kluyveromyces marxianus and Saccharomyces cerevisiae cells were grown in 50 mL YPD liquid medium overnight. Cells were transferred into 50 mL fresh YPD liquid medium to start an OD600 of 0.1. After that, cells from 1 to 5 mL cultures were collected at 1, 4, 6, 12, 24, 48, and 72 h after culturing in rich medium. Samples were collected from separate cultures for biologic repeats. Total RNA was extracted using the ZR Fungal/Bacterial RNA MiniPrepTM (Zymo Research, CA). RNAseq was performed in Genergy Biotechnology company (Shanghai, China).
15.1 million pair-end reads on average for each RNA sample were obtained. After initial QC, short 150 bp reads were mapped to the reference genomes of K. marxianus FIM1 and S. cerevisiae S288c (Saccharomyces Genome Database) using HISAT2.1 (Kim et al., 2015). The expression level of a family was the sum of FPKM values of genes in the family. The level of a gene family at a different time point after the culturing was compared with that at 1 h and the change was calculated by using the GFOLD algorithm. GFOLD algorithm is roughly equivalent to the raw fold change log2ratio value but takes into account the uncertainty of gene expression measurement by RNA-seq, thus is more reliable than the raw fold change (Feng et al., 2012). Two-fold or more changes, i.e., |GFOLD| ≥1, were defined as significantly differentially expressed. A change with GFOLD > = 1 was defined as up-regulation and a change with GFOLD ≤ –1 was referred to as downregulation.
To analyze mRNA levels in lag phase, an overnight culture of K. marxianus or S. cerevisiae was transferred into 50 mL fresh YPD liquid medium to start an OD600 of 0.1 and cells were collected after 1 h. To analyze changes in mRNA levels upon heat stress, an overnight culture of K. marxianus was transferred into 50 mL fresh YPD liquid medium to start an OD600 of 0.1 and cells were collected after growing at 45 degrees or 30 degrees for 8 h. Total RNAs were isolated from three independent cultures and reverse-transcribed into cDNA by PrimeScript RT (RR037A, Takara). qPCR was performed on a LightCycler 480 (Roche Applied Science, Germany) with the SYBR Premix Ex Taq II (RR820A, Takara). The mRNA level of the individual gene was normalized against the average level of MPE1, TRK1, and SWC4. Primers used for RT-qPCR were listed in Supplementary Table 1.
Inspired by the idea of using gene co-expression network to predict the function of hypothetical genes in Aspergillus niger (Schape et al., 2019), Pearson correlation coefficient (denoted as r) was applied to infer the function of KMS families. For each gene family, its expression level was the sum of FPKM values of genes contained in the family. Value of r was calculated between a KMS family and a gene with known function at different time points after culturing. If r > 0.8, the function of the known gene can be considered as the candidate function of the KMS family. The known gene with the highest r value was chosen for the predicted function.
A genome sequencing of the K. marxianus FIM1 strain was performed in this study. Eight nuclear chromosome sequences were obtained with a total size of 10.9 Mbp. The genome was annotated via “Yeast Genome Annotation Pipeline” for gene identification and via non-redundant (nr) database for functional annotation (Proux-Wera et al., 2012). Five thousand two hundred and two genes were systematically identified in the FIM1 strain, higher than previously reported 4952 genes identified in the DMKU 3-1042 strain (Lertwattanasakul et al., 2015). Two copies of rRNA were located in chromosome 5. The correlations between the systematic gene names in both strains were listed in Supplementary Table 2. Coding sequences of genes in FIM1 were listed in Supplementary Table 3. GFF3 files were uploaded in the NCBI Genome database (accession numbers CP015054–CP015061 and assembly accession GCA_001854445.2).
To identify K. marxianus-specific genes, a concept of “gene family” was introduced. Each gene family is a set of homologous genes among 15 yeast Saccharomycetales species, including 13 species in Saccharomycetaceae, one in Phaffomycetaceae and one in Dipodascaceae as outgroups. Totally, 636 gene families contain a single copy of a gene in each species. Single-copy genes were concatenated in each species into a supergene, followed by reconstructing a phylogenetic tree using the maximum likelihood method (Figure 1A). Our results are consistent with a previous report (Wolfe et al., 2015).
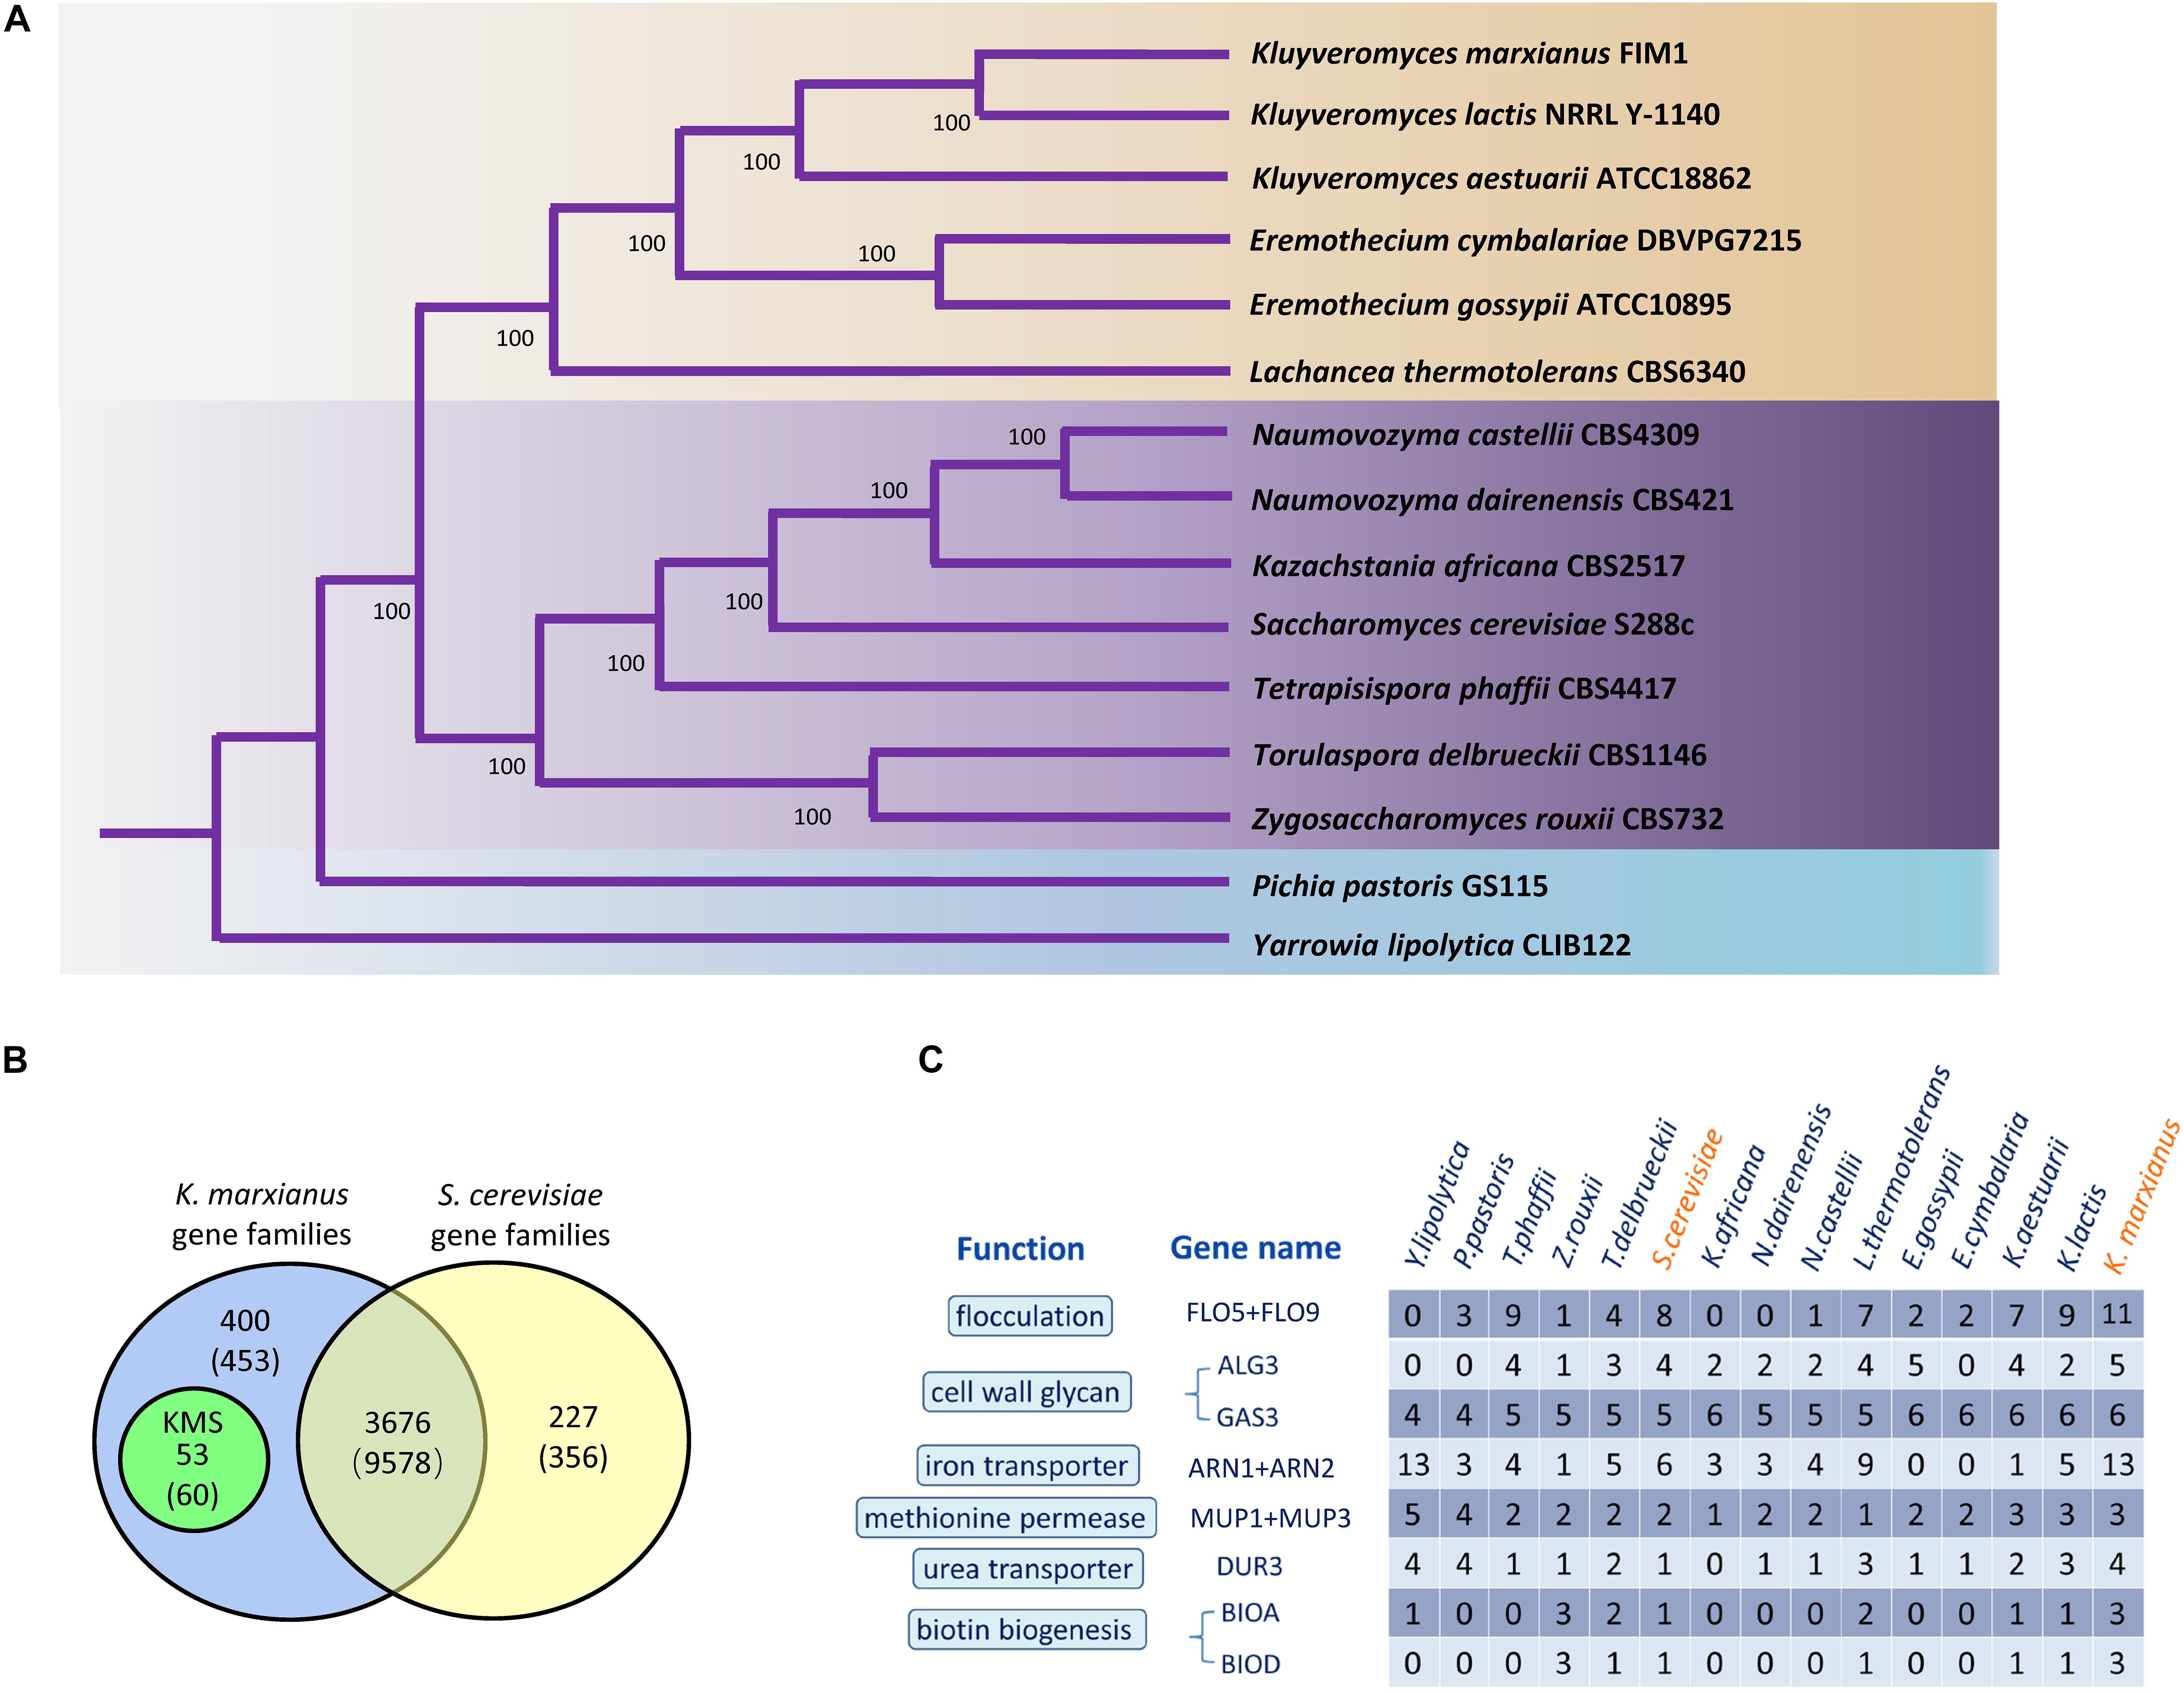
Figure 1. Gene families and highly copied genes of K. marxianus. (A) Phylogenetic tree of K. marxianus evolution in Saccharomycetales. The tree was generated based on the concatenated sequence of 636 single-copy genes without long-branch score heterogeneity. The bootstrap value 100 at each node point indicates the correctness of inferred topology. The blue part contains Y. lipolytica in Dipodascaceae and P. pastoris in Phaffomycetaceae as outgroups. The purple and the brown parts represent two major clades in Saccharomycetaceae, respectively, i.e., the one close to Saccharomyces and the one close to Kluyveromyces. (B) Gene families in K. marxianus FIM1 and S. cerevisiae S288C. Genomes of 15 yeast species in Figure 1A was used to identify gene families as described in methods. The number of genes included in the families is given in parentheses. Genes included in the families in K. marxianus and S. cerevisiae were shown in Supplementary Table 4. (C) Comparison of gene copy numbers among 15 Saccharomycetales species.
There are 4076 families in K. marxianus and 3903 families in S. cerevisiae, in which 3676 gene families contain genes from both species (Figure 1B and Supplementary Table 4). Notably, 53 gene families only contain K. marxianus genes and no gene from other species in Saccharomycetale. These 53 families contained 60 genes in total and these genes were named as KMS (K. marxianus-specific) genes (Figure 1B and Supplementary Table 5). Four KMS families contain more than one gene, and the rest 49 KMS families contained a single gene. Five KMS genes were located inside 10 kb from the telomere.
The existence of KMS genes in other K. marxianus strains, including DMKU3-1042, NBRC1777, DMB1, CCT 7735 and KCTC17555 was investigated (Supplementary Table 5). Briefly, 36 and 47 KMS genes were systematically annotated in DMKU3-1042 and NBRC1777 strains respectively. Sequences of the rest KMS genes could be found in the genome of these strains, but they were not annotated. Genomes of DMB1, CCT 7735, and KCTC 17555 were draft sequences. Annotations of these genomes were performed in this study as described in methods. Briefly, 56, 58, and 58 KMS genes were annotated in KCTC17555, DMB1 and CCT 7735 strains respectively, while the rest of KMS genes could be found without annotation. FIM1_4308 was missing in CCT 7735 genome and FIM1_2658 was missing in DMB1, presumably due to sequencing error. In sum, a complete set of KMS genes exists in different K. marxianus strains, except two cases mentioned above. Therefore, KMS genes are not FIM1-specific genes but are truly species-specific genes of K. marxianus.
The copy number of genes in different yeast species were compared (Figure 1C). Genes involved in flocculation, iron transport and biotin biosynthesis have particularly high copies in K. marxianus, i.e., 11, 13, and 3, respectively (Supplementary Table 6). One copy of FLO5/FLO9 gene, two copies of ARN1/ARN2 gene, two copies of BIOA and two copies of BIOD were located inside 10 kb from a telomere in FIM1. Highly copied genes may contribute to specific features of K. marxianus.
Out of the 53 KMS families, 49 families have not been functionally annotated. The function of each KMS family was predicted based on the similarity between its expression and the expressions of genes with known functions. K. marxianus cells were collected at 1, 4, 6, 12, 24, 48, and 72 h after culturing in a rich YPD medium and subjected to RNA-seq. The expression level of a gene family is the sum of FPKM values of the gene(s) in the family. By using the expression level of a gene family at 1 h as control, changes of the expression level of the family at later time points were calculated using the GFOLD algorithm. Expression levels of 22 KMS families were upregulated and those of 5 KMS families were downregulated at later time points (Figure 2 and Supplementary Table 7). Upregulated KMS families contained 29 genes, which occupied approximately 48% of total KMS genes. Pearson correlation coefficient (denoted as r) was calculated between a KMS family and a gene with known function, based on the hypothesis that strongly co-expressed genes are likely to function in the same or closely related biological pathways (Dutkowski et al., 2013; Schape et al., 2019). The known gene with the highest r value (at least above 0.8) were used to infer the possible function of a KMS family. The predicted functions of KMS families and corresponding r values were listed in Figure 2A. Results suggested that upregulated KMS families mainly participated in glycogen metabolism, glucose transport and mitochondrial related function, while the downregulated KMS families might be involved in ergosterol, leucine, and purine biosynthesis.
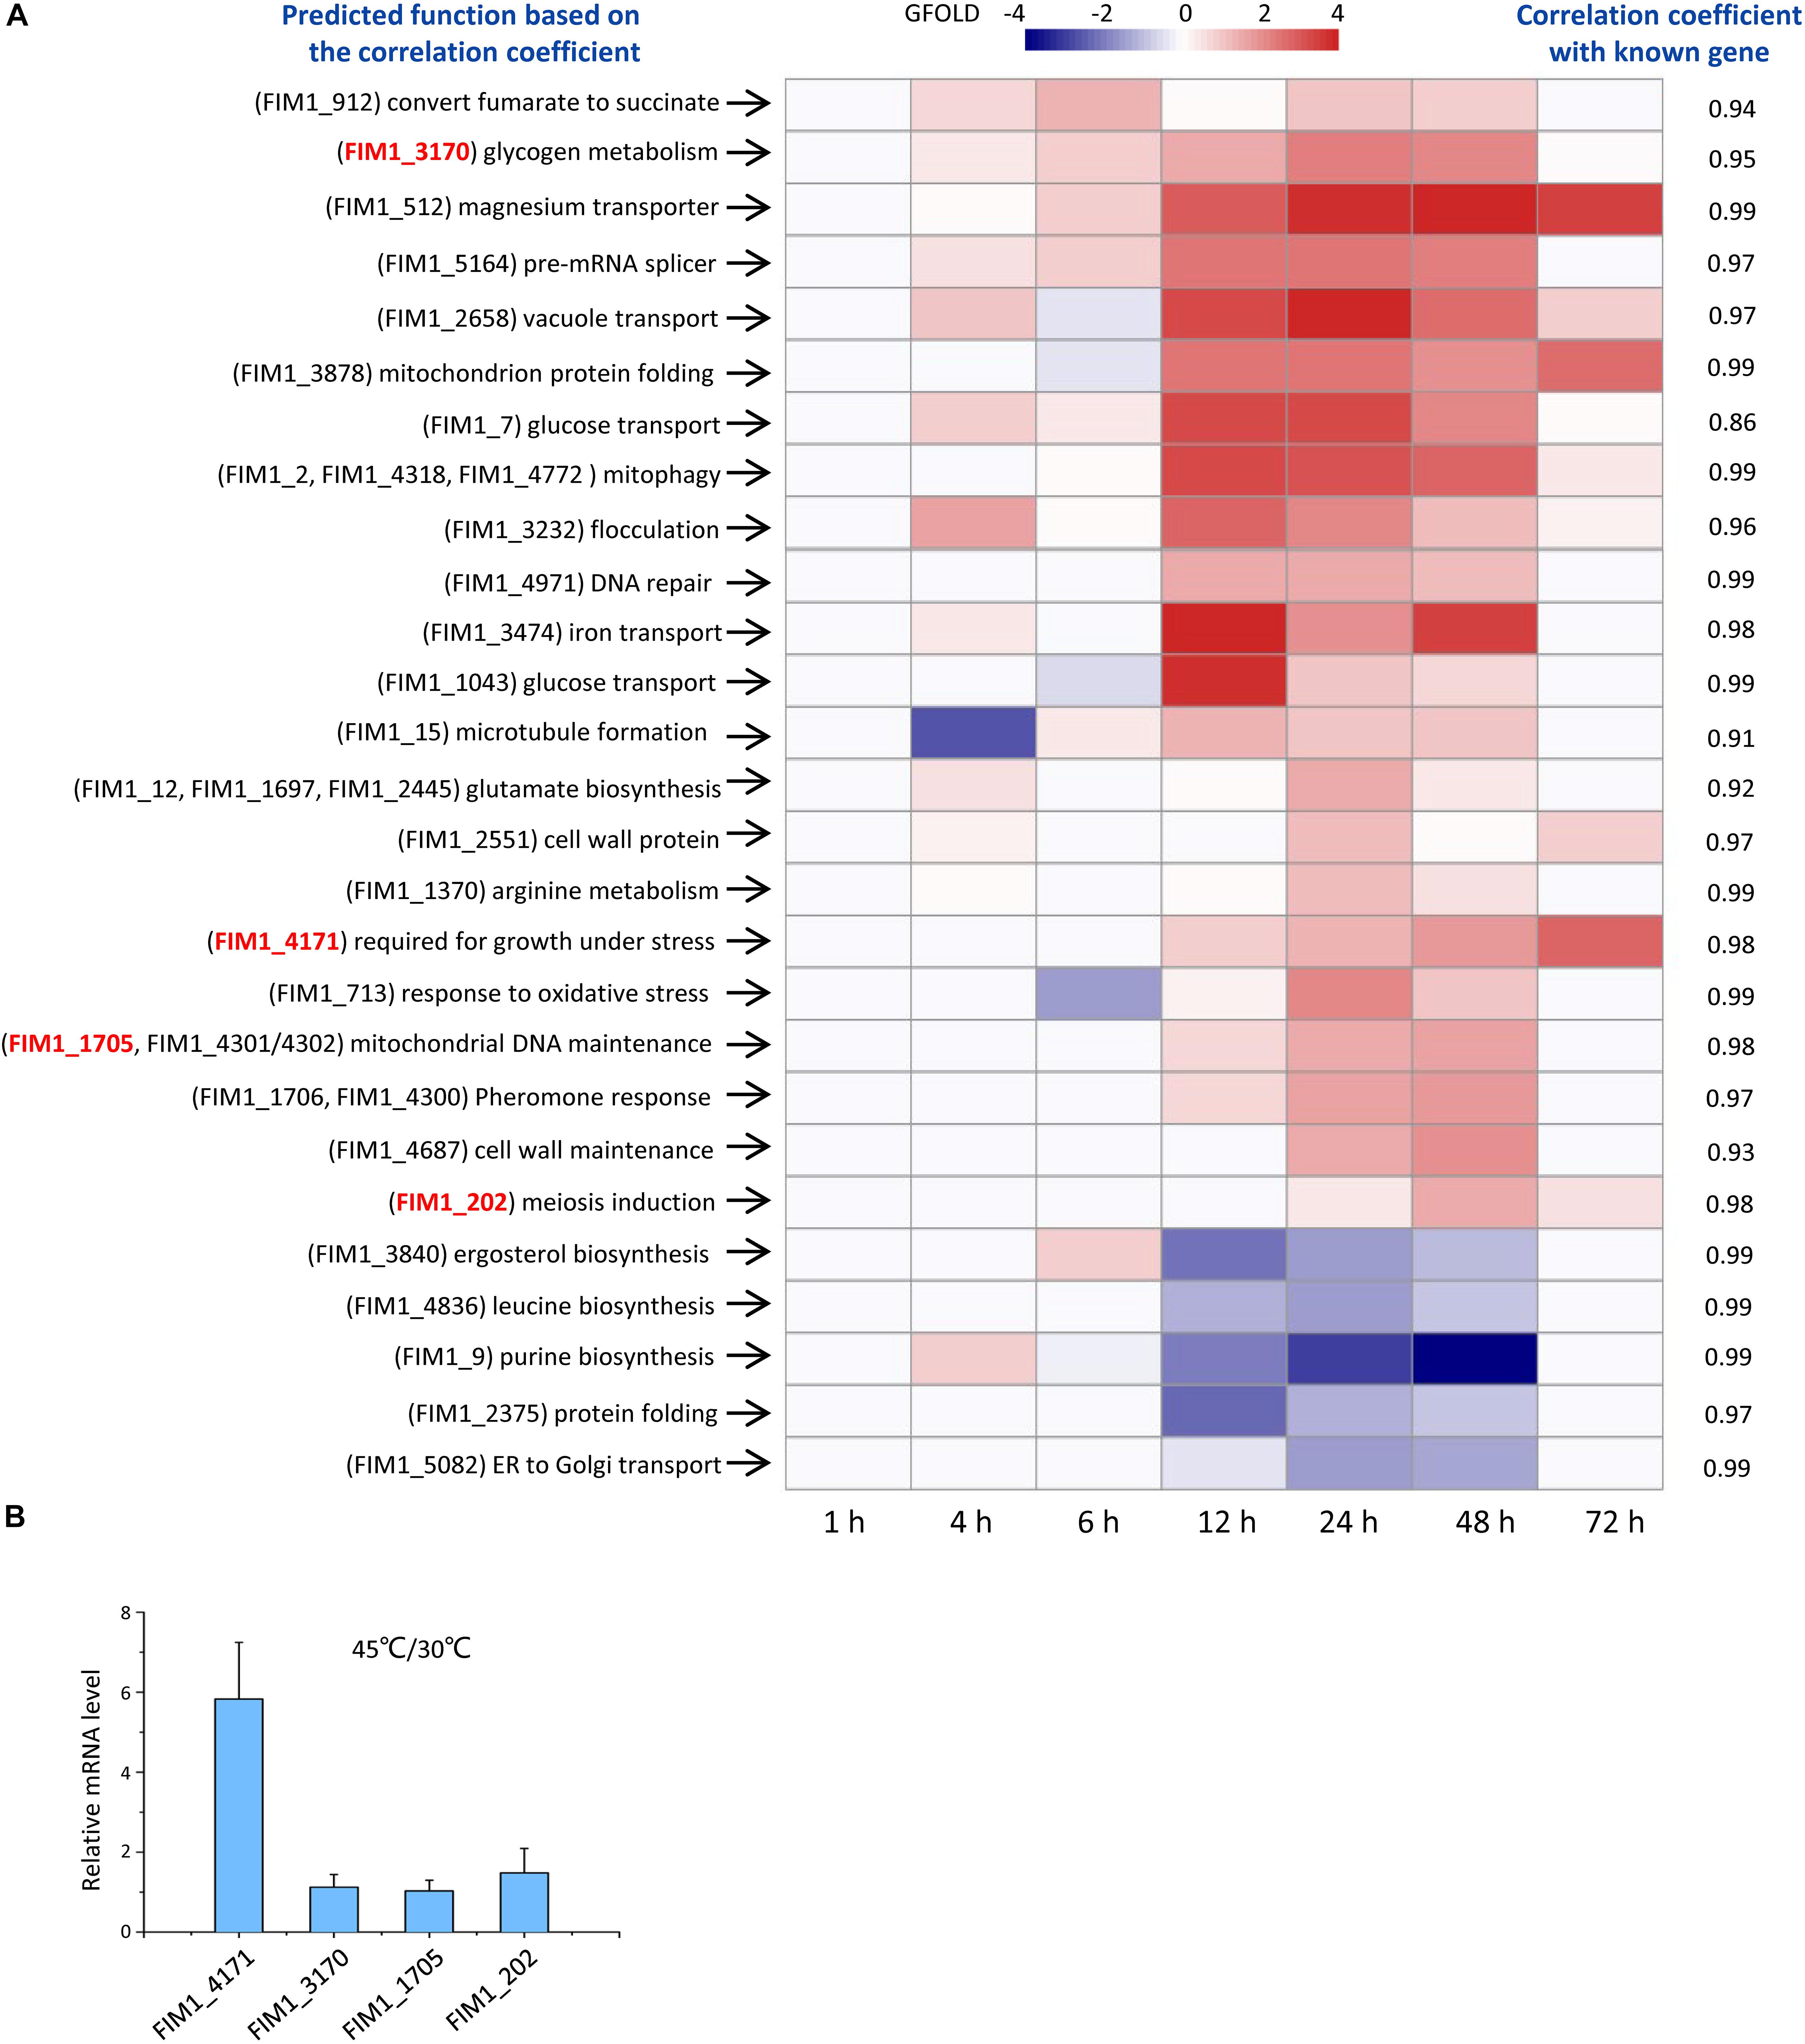
Figure 2. Functions of KMS genes. (A) Expressions and predicted functions of KMS genes. K. marxianus cells were collected at 1, 4, 6, 12, 24, 48, and 72 h after culturing in the YPD medium. Expression levels of KMS families at later time points were compared with those at 1 h. KMS families that exhibited twofold or more changes were shown here. A color bar corresponding to GFOLD values was shown on the top. Predicted functions of KMS families were listed on the left and corresponding correlation coefficients were on the right. Genes inside the family were shown in the parentheses. Genes selected for investigation upon heat stress in (B) were highlighted in red. (B) Changes in the mRNA levels of selected KMS genes upon heat stress. mRNA level of a KMS gene in cells grown at 45 degrees was compared with the average mRNA level in cells grown at 30 degrees. The value represents the mean ± SD from three independent repeats.
To demonstrate the reliability of prediction based on co-expression, changes in mRNA levels of selected KMS genes upon heat stress were investigated. FIM1_4171 was predicted to be required for the growth under stress. The mRNA level of FIM1_4171 increased by fivefold after growing in 45 degrees (Figure 2B). On the other hand, the mRNA levels of FIM1_3170, FIM1_1705 and FIM1_202, which were predicted to play role in irrelevant pathways, were kept constant upon heat stress (Figure 2B).
To perform a comparative transcriptomic analysis between K. marxianus and S. cerevisiae, S. cerevisiae cells were also collected at 1, 4, 6, 12, 24, 48, and 72 h after culturing in the YPD, and then subjected to the RNA-seq. Gene family contains a set of homologous genes and is suitable for many-to-many comparison between K. marxianus and S. cerevisiae. There were 3676 gene families that contained both K. marxianus and S. cerevisiae genes (Figure 1B). Out of them, 2535 gene families were identified as differentially expressed in at least one time points after 1 h in either K. marxianus or S. cerevisiae, by using the expression values of families at respective 1 h as control. These 2535 families were then grouped into 12 clusters according to their expression patterns (C1∼C12) (Figure 3), using the k-means method calculated on Euclidean distance. Relative expression levels of gene families in each cluster were listed in Supplementary Table 8. A summary of significantly enriched GO terms (p-value < 0.05) in each cluster was listed in Table 1.
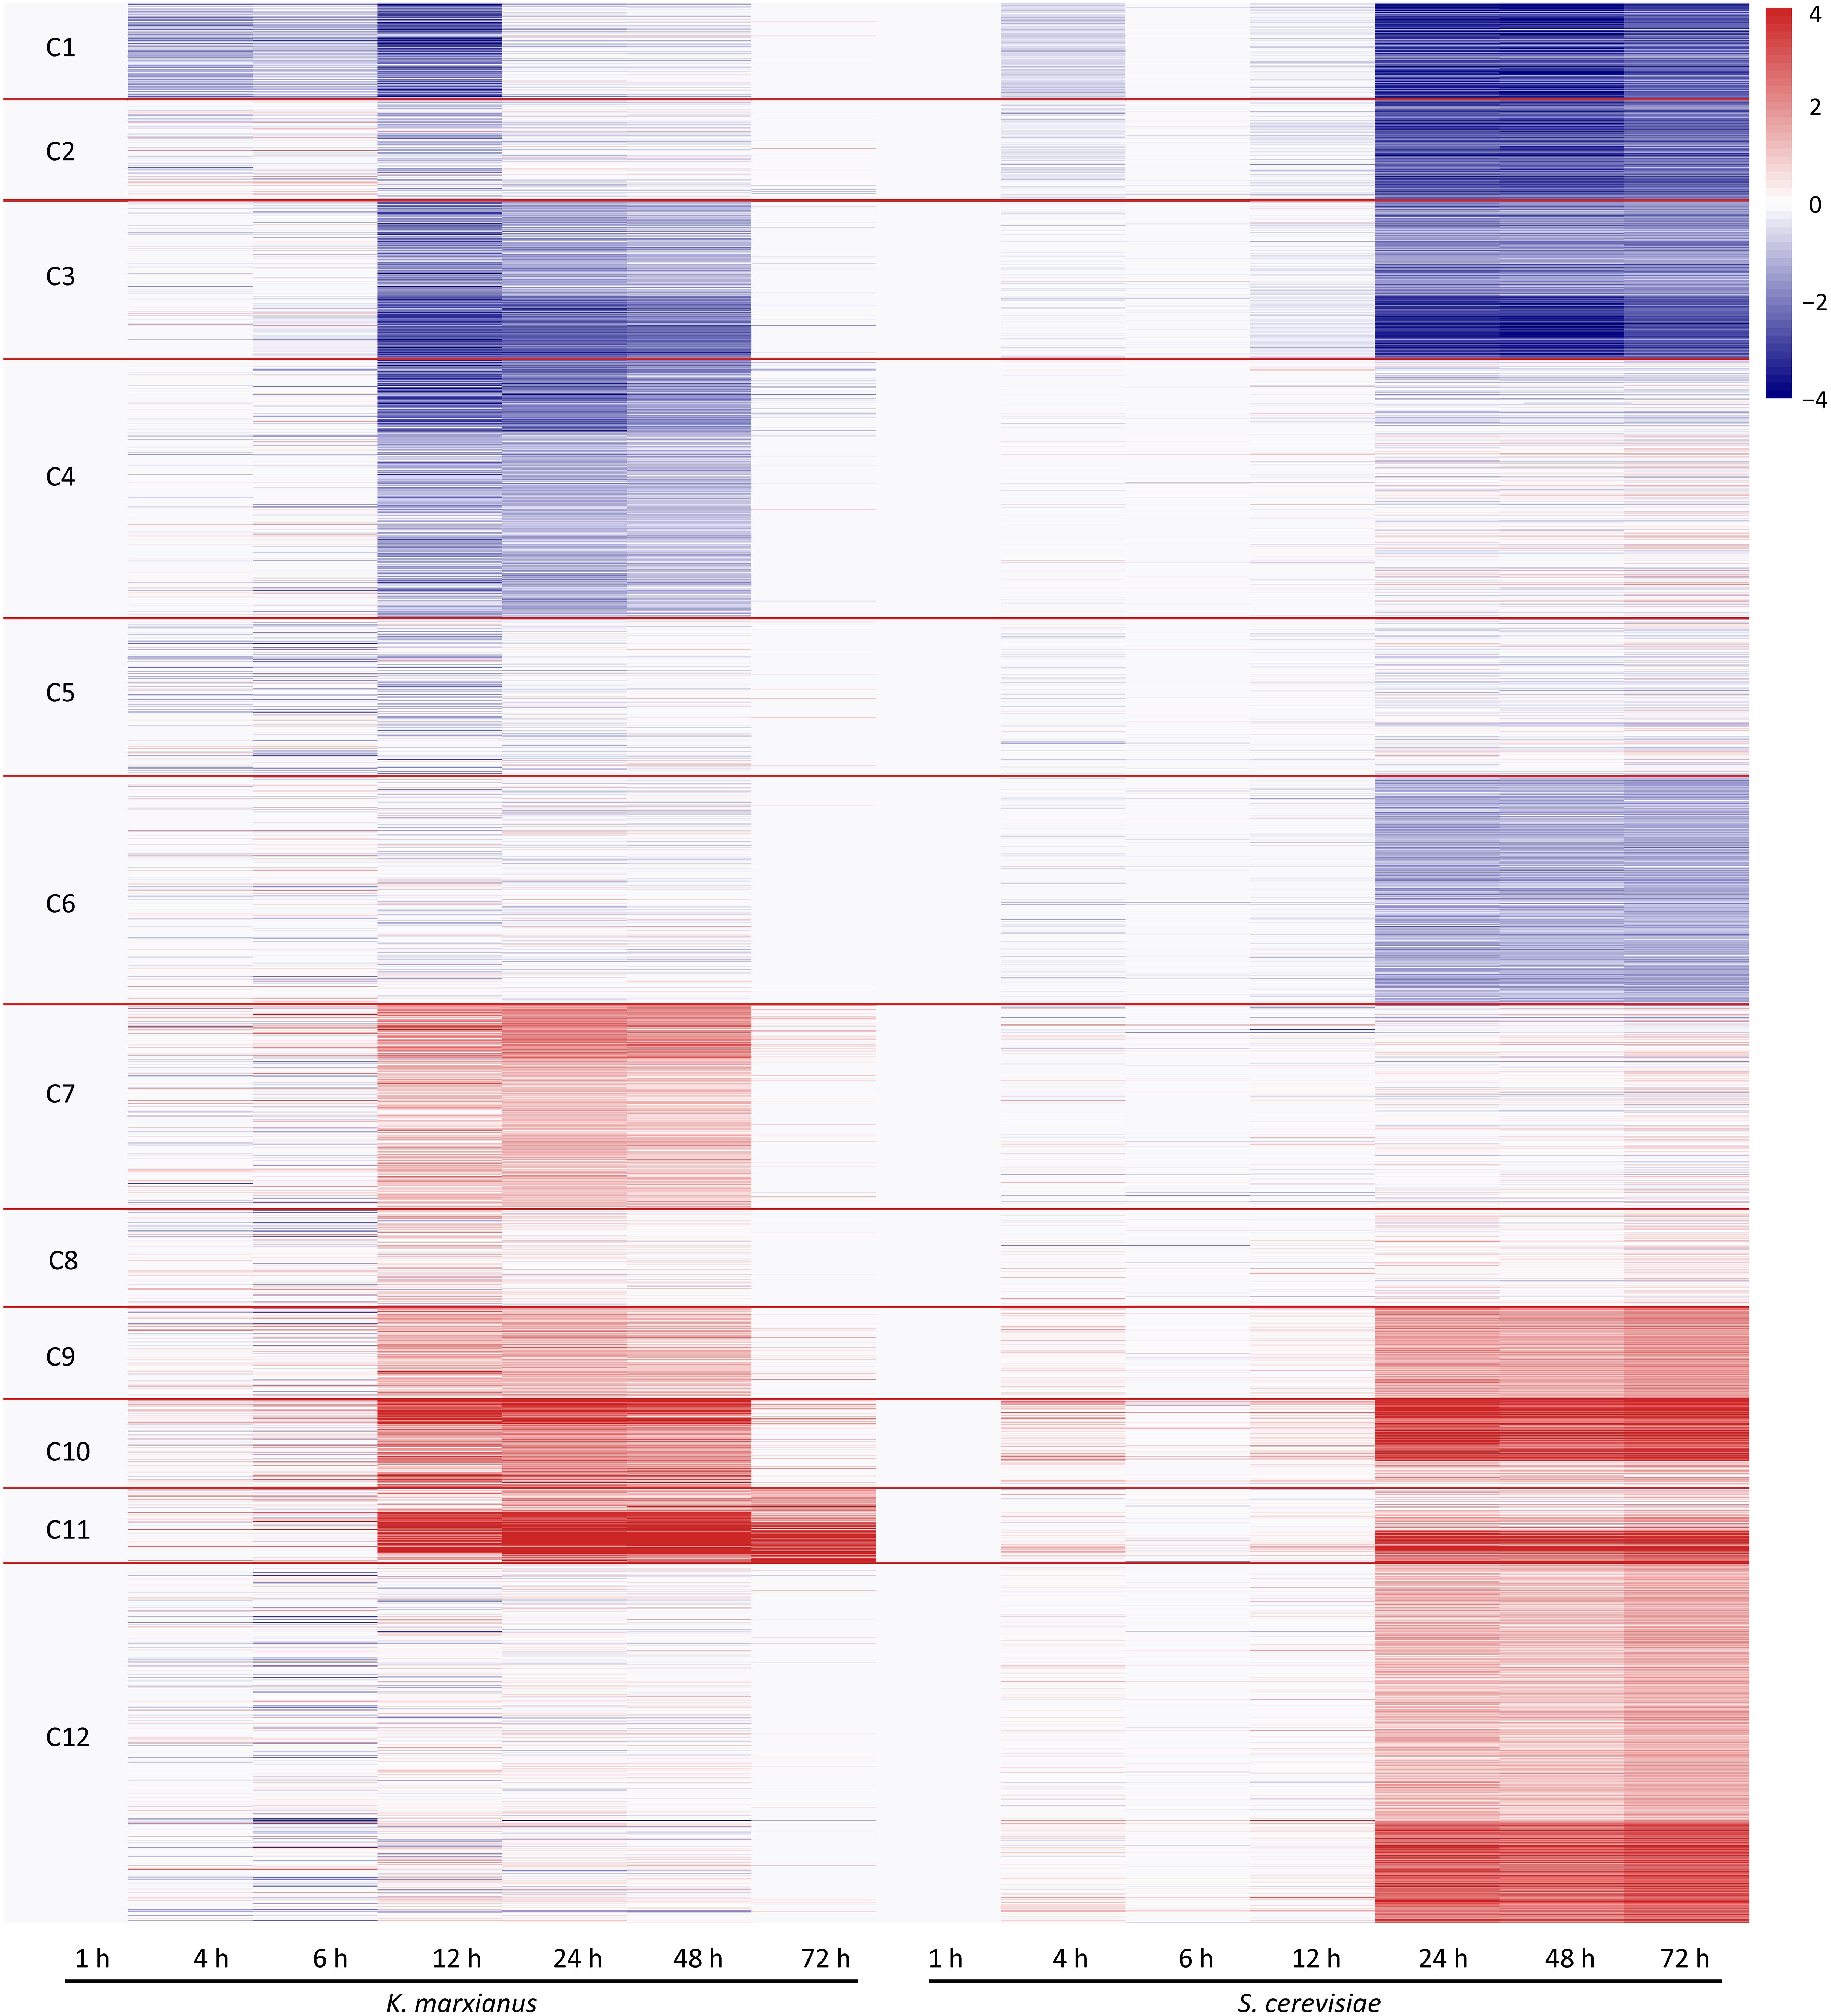
Figure 3. Clustering of differentially expressed families of K. marxianus and S. cerevisiae by their expression patterns. Each horizontal line represents a gene family shared by K. marxianus and S. cerevisiae. The color of a segment of a line is corresponding to the GFOLD value of a gene family at each time point respective to the value at 1 h. Using k-means based on Euclidean distance, gene families were grouped into 12 clusters (C1∼C12) by their expression patterns.
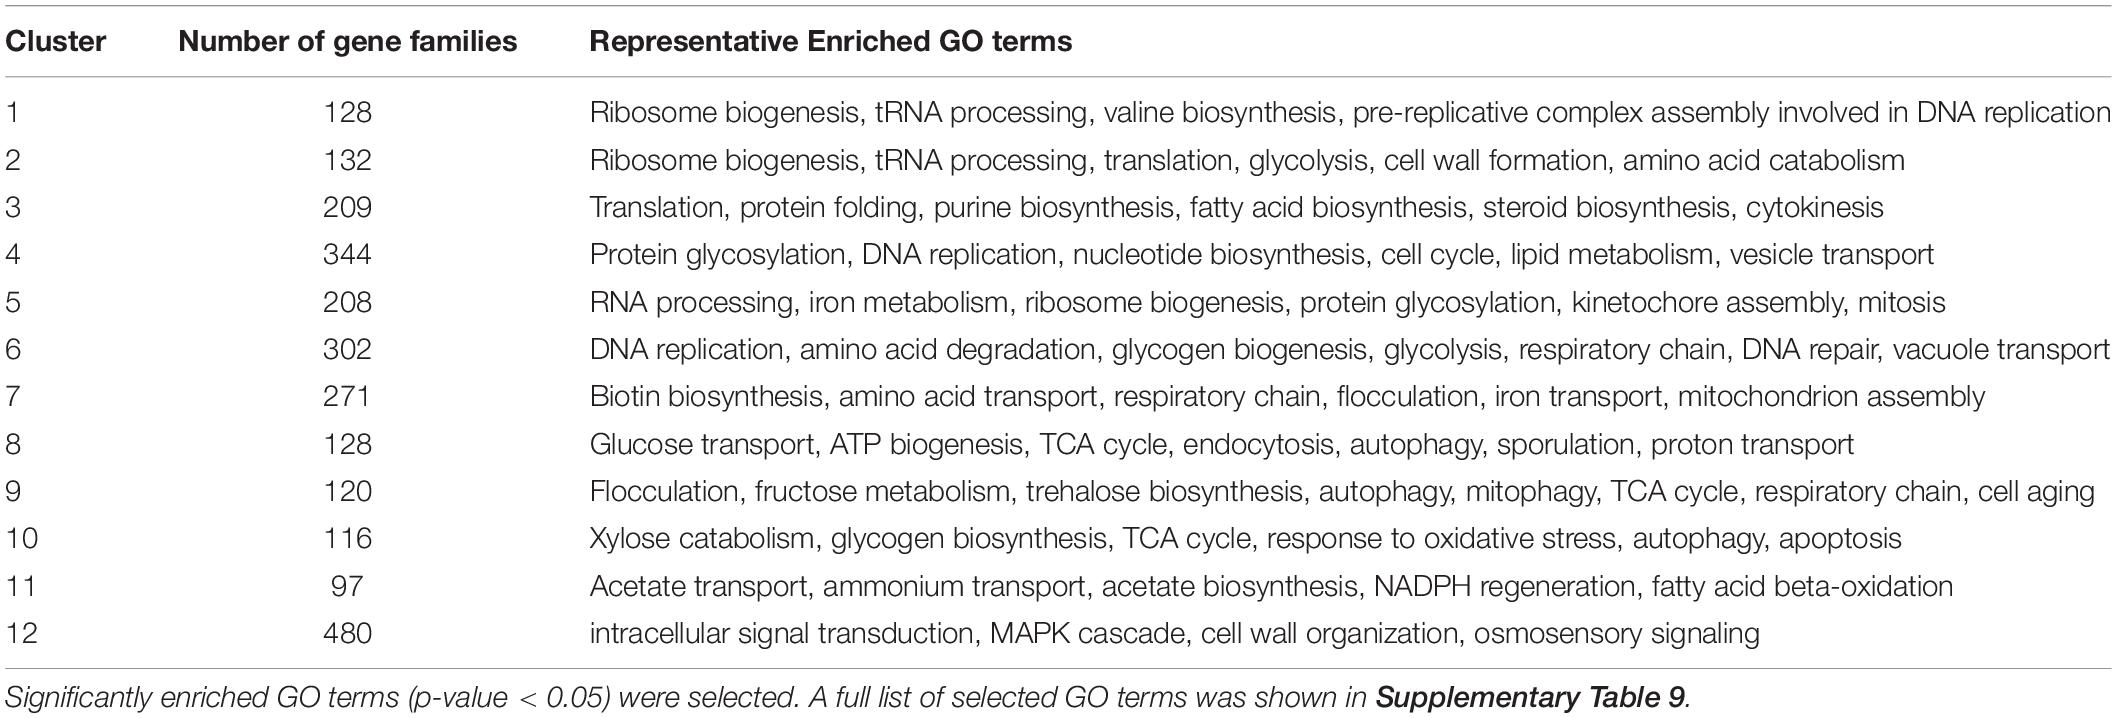
Table 1. Summary of significantly enriched GO terms in 12 clusters in which differentially expressed families of K. marxianus and S. cerevisiae were grouped by their expression patterns.
As illustrated in Figure 3, at the early stage of cultivation (4 and 6 h), there was no dramatic change of expression in the clusters. Expressions of K. marxianus and S. cerevisiae families showed dramatic changes since 12 and 24 h, respectively. The time points were in line with the late exponential phase, as showed by the growth curves of K. marxianus and S. cerevisiae (Supplementary Figure 1).
Several clusters displayed similar patterns of expressions in K. marxianus and S. cerevisiae. The expression levels of genes involved in ribosome biogenesis and protein translation, clustered in C1∼C3, were substantially downregulated in both species at later time points comparing to those at 1 h (Figure 3 and Table 1). Genes participating in trehalose biosynthesis, TCA cycle, respiratory chain and autophagy, clustered in C9∼C11, were upregulated after 1 h in both species (Figure 3 and Table 1). However, the expression patterns in the clusters of C4, C6, C7, and C12 were different between K. marxianus and S. cerevisiae. In C12, genes implicated in the intracellular signal transduction and MAPK cascade were kept unchanged in K. marxianus, while they were upregulated in S. cerevisiae (Figure 3 and Table 1). In C4, genes involved in DNA replication and cell cycle were downregulated in K. marxianus and were hardly changed in S. cerevisiae (Figure 3 and Table 1).
One major difference between S. cerevisiae and K. marxianus is their different Crabtree characters. S. cerevisiae, a Crabtree-positive species, produces ethanol under aerobic conditions when glucose is in excess (Pronk et al., 1996). As an inherent Crabtree-negative species, K. marxianus grows faster under aerobic conditions without ethanol fermentation (Fonseca et al., 2008). K. marxianus enhances metabolic turnover in the TCA cycle during aeration, which was proposed to promote efficient electron flux and respiration (Sakihama et al., 2019). Consistent with this idea, as shown in the C7 group in this study, genes involved in the respiratory chain and mitochondrion assembly, were upregulated in K. marxianus but kept unchanged in S. cerevisiae (Figure 3 and Table 1). In addition, genes involved in biotin biosynthesis, iron transport, flocculation were also specifically upregulated in K. marxianus (Figure 3 and Table 1). Interestingly, these genes were overlapped with highly copied genes in K. marxianus (Figure 1C), suggesting that increased expressions of highly copied genes during cultivation might contribute to specific traits of K. marxianus.
Saccharomyces cerevisiae and Kluyveromyces marxianus cells were in the lag phase after being cultivated in the rich medium for 1 h. At this time point, 357 and 437 gene families in K. marxianus displayed higher and lower levels of expressions, respectively comparing to the equivalent families in S. cerevisiae (Supplementary Table 10). Representative GO terms enriched in differentially expressed families were listed in Table 2 and a full list of enriched GO terms was shown in Supplementary Table 11. Compared to S. cerevisiae, K. marxianus displayed enhanced expressions of genes implicated in TCA cycle, respiratory chain and ATP synthesis, meanwhile displayed reduced expressions of genes involved in the amino acid transport and cellular drug response. Enhanced expressions of K. marxianus genes involved in the respiratory chain and ATP synthesis during lag phase were validated by RT-qPCR analysis (Figure 4). The result was consistent with a strong tendency for respiration in Crabtree-negative K. marxianus (Gombert et al., 2016).
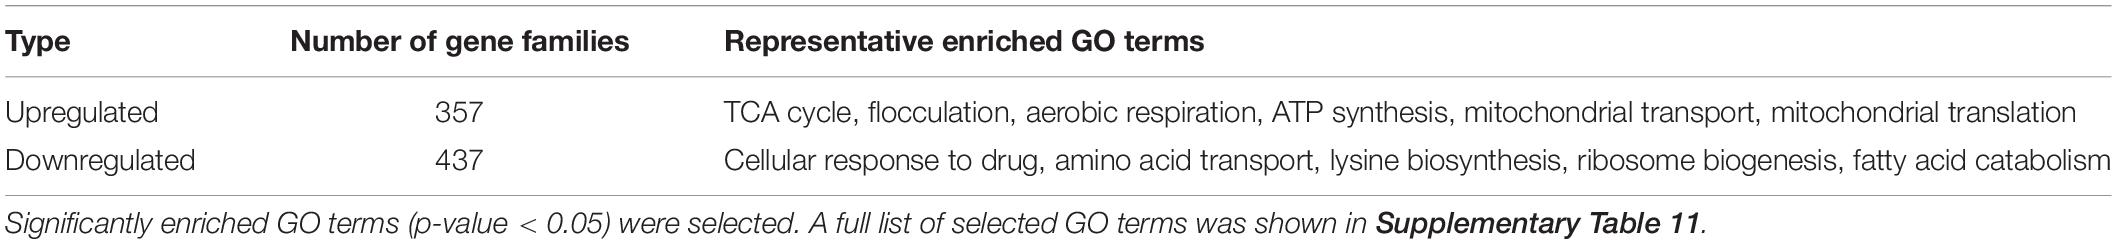
Table 2. Summary of significantly enriched GO terms in the families of K. marxianus whose expressions levels at 1 h were different from those of equivalent families of S. cerevisiae.
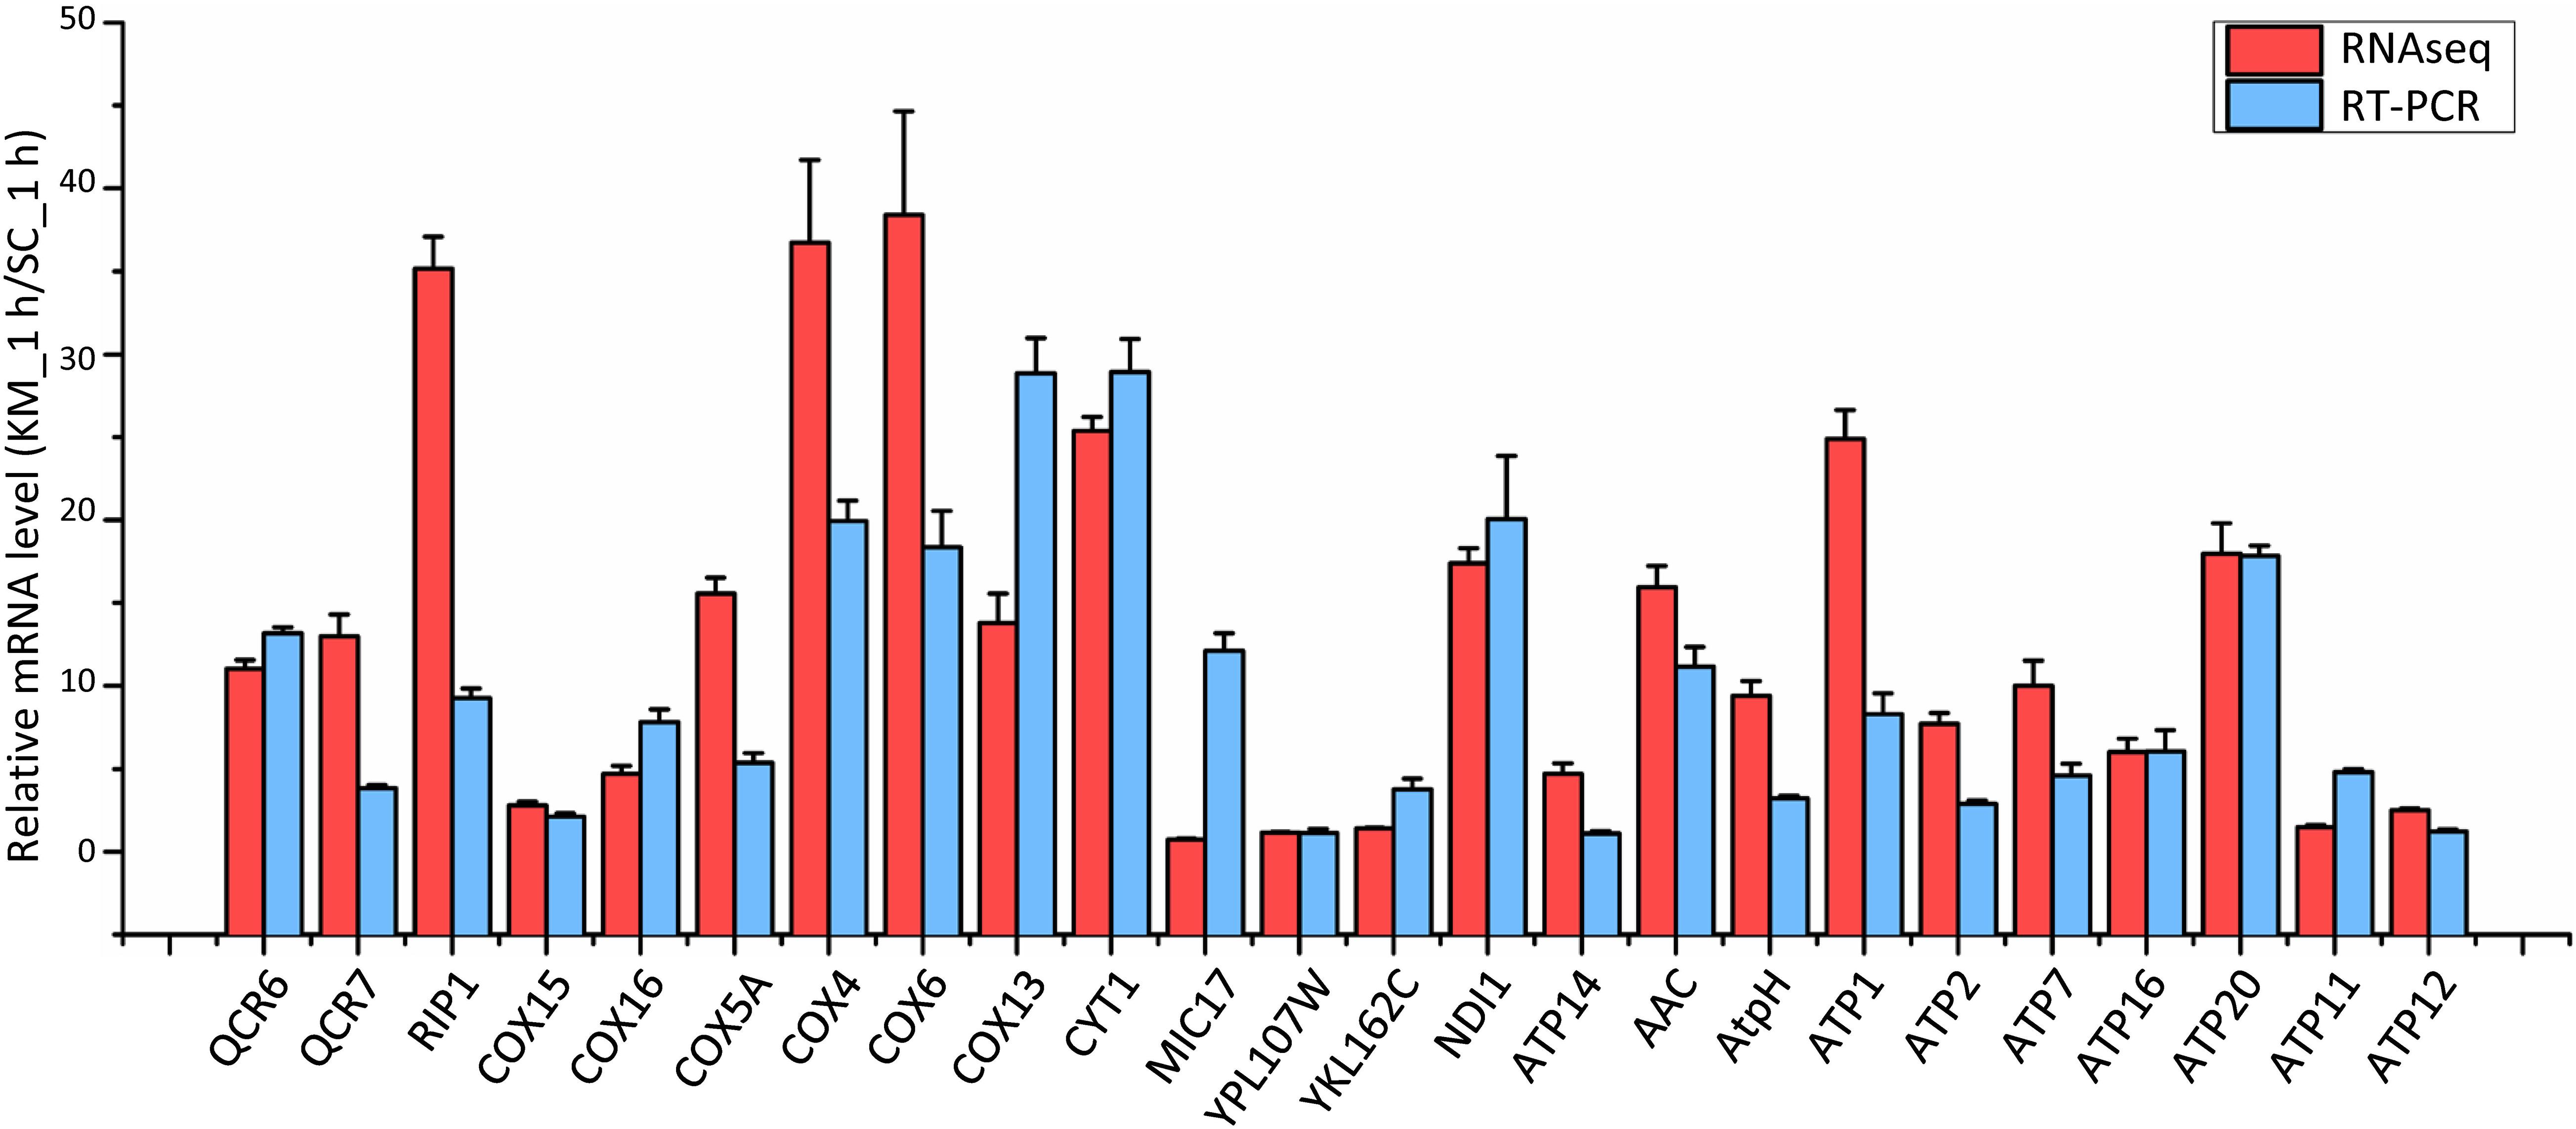
Figure 4. Comparison of mRNA levels of the respiratory chain and ATP synthesis genes in K. marxianus and S. cerevisiae after growing 1 h. The mRNA level of an indicated K. marxianus gene was normalized by the average mRNA level of three housekeeping genes, including MPE1, TRK1, and SWC4. Similarly, the mRNA level of an indicated S. cerevisiae gene was normalized. Normalized mRNA level of a K. marxianus gene was compared with the average of normalized mRNA levels of the S. cerevisiae gene from three repeats. Relative mRNA level (KM_1 h/SC_1 h) was shown by a red column (data obtained by RNAseq) or a blue column (data obtained by RT-PCR). The value represents the mean ± SD from three independent repeats.
The fast-growing phase of K. marxianus was between 6 and 12 h, and that of S. cerevisiae was between 12 and 24 h (Supplementary Figure 1). The comparison of changes in gene expressions during this phase between two species was performed. In the case of K. marxianus, expression levels of the families at 12 h were compared with those at 6 h and changes in expression levels were calculated as GFOLD values. Similarly, expression levels of the families in S. cerevisiae at 24 h were compared with those at 12 h. When GFOLD values of K. marxianus families were ordered from high to low, GFOLD values of corresponding S. cerevisiae families also displayed a generally high-to-low pattern (Figure 5A and Supplementary Table 12). Vice versa, when the families of S. cerevisiae were ordered by their GFOLD values, GFOLD values of corresponding K. marxianus families followed a generally high-to-low pattern (Figure 5B and Supplementary Table 12). Results suggested that two species shared a generally similar tendency of changes in the expressions of homologous families during the fast-growing phase. Genes from the upregulated families and downregulated families were subjected to a GO analysis individually (Supplementary Table 13). Representative enriched GO terms of K. marxianus and S. cerevisiae families were shown in the boxes of Figures 5A,B, respectively. The comparison of enriched GO terms between two species was listed in Table 3. Genes involved in the TCA cycle and respiratory chain were both upregulated in K. marxianus and S. cerevisiae, while cell cycle-related genes exhibited little expression change in either species. Genes involved in glucose transport, iron homeostasis and ATP biosynthesis were upregulated in K. marxianus, while they were kept unchanged in S. cerevisiae. Genes involved in protein folding and response to heat were kept unchanged in K. marxianus, while they were upregulated in S. cerevisiae.
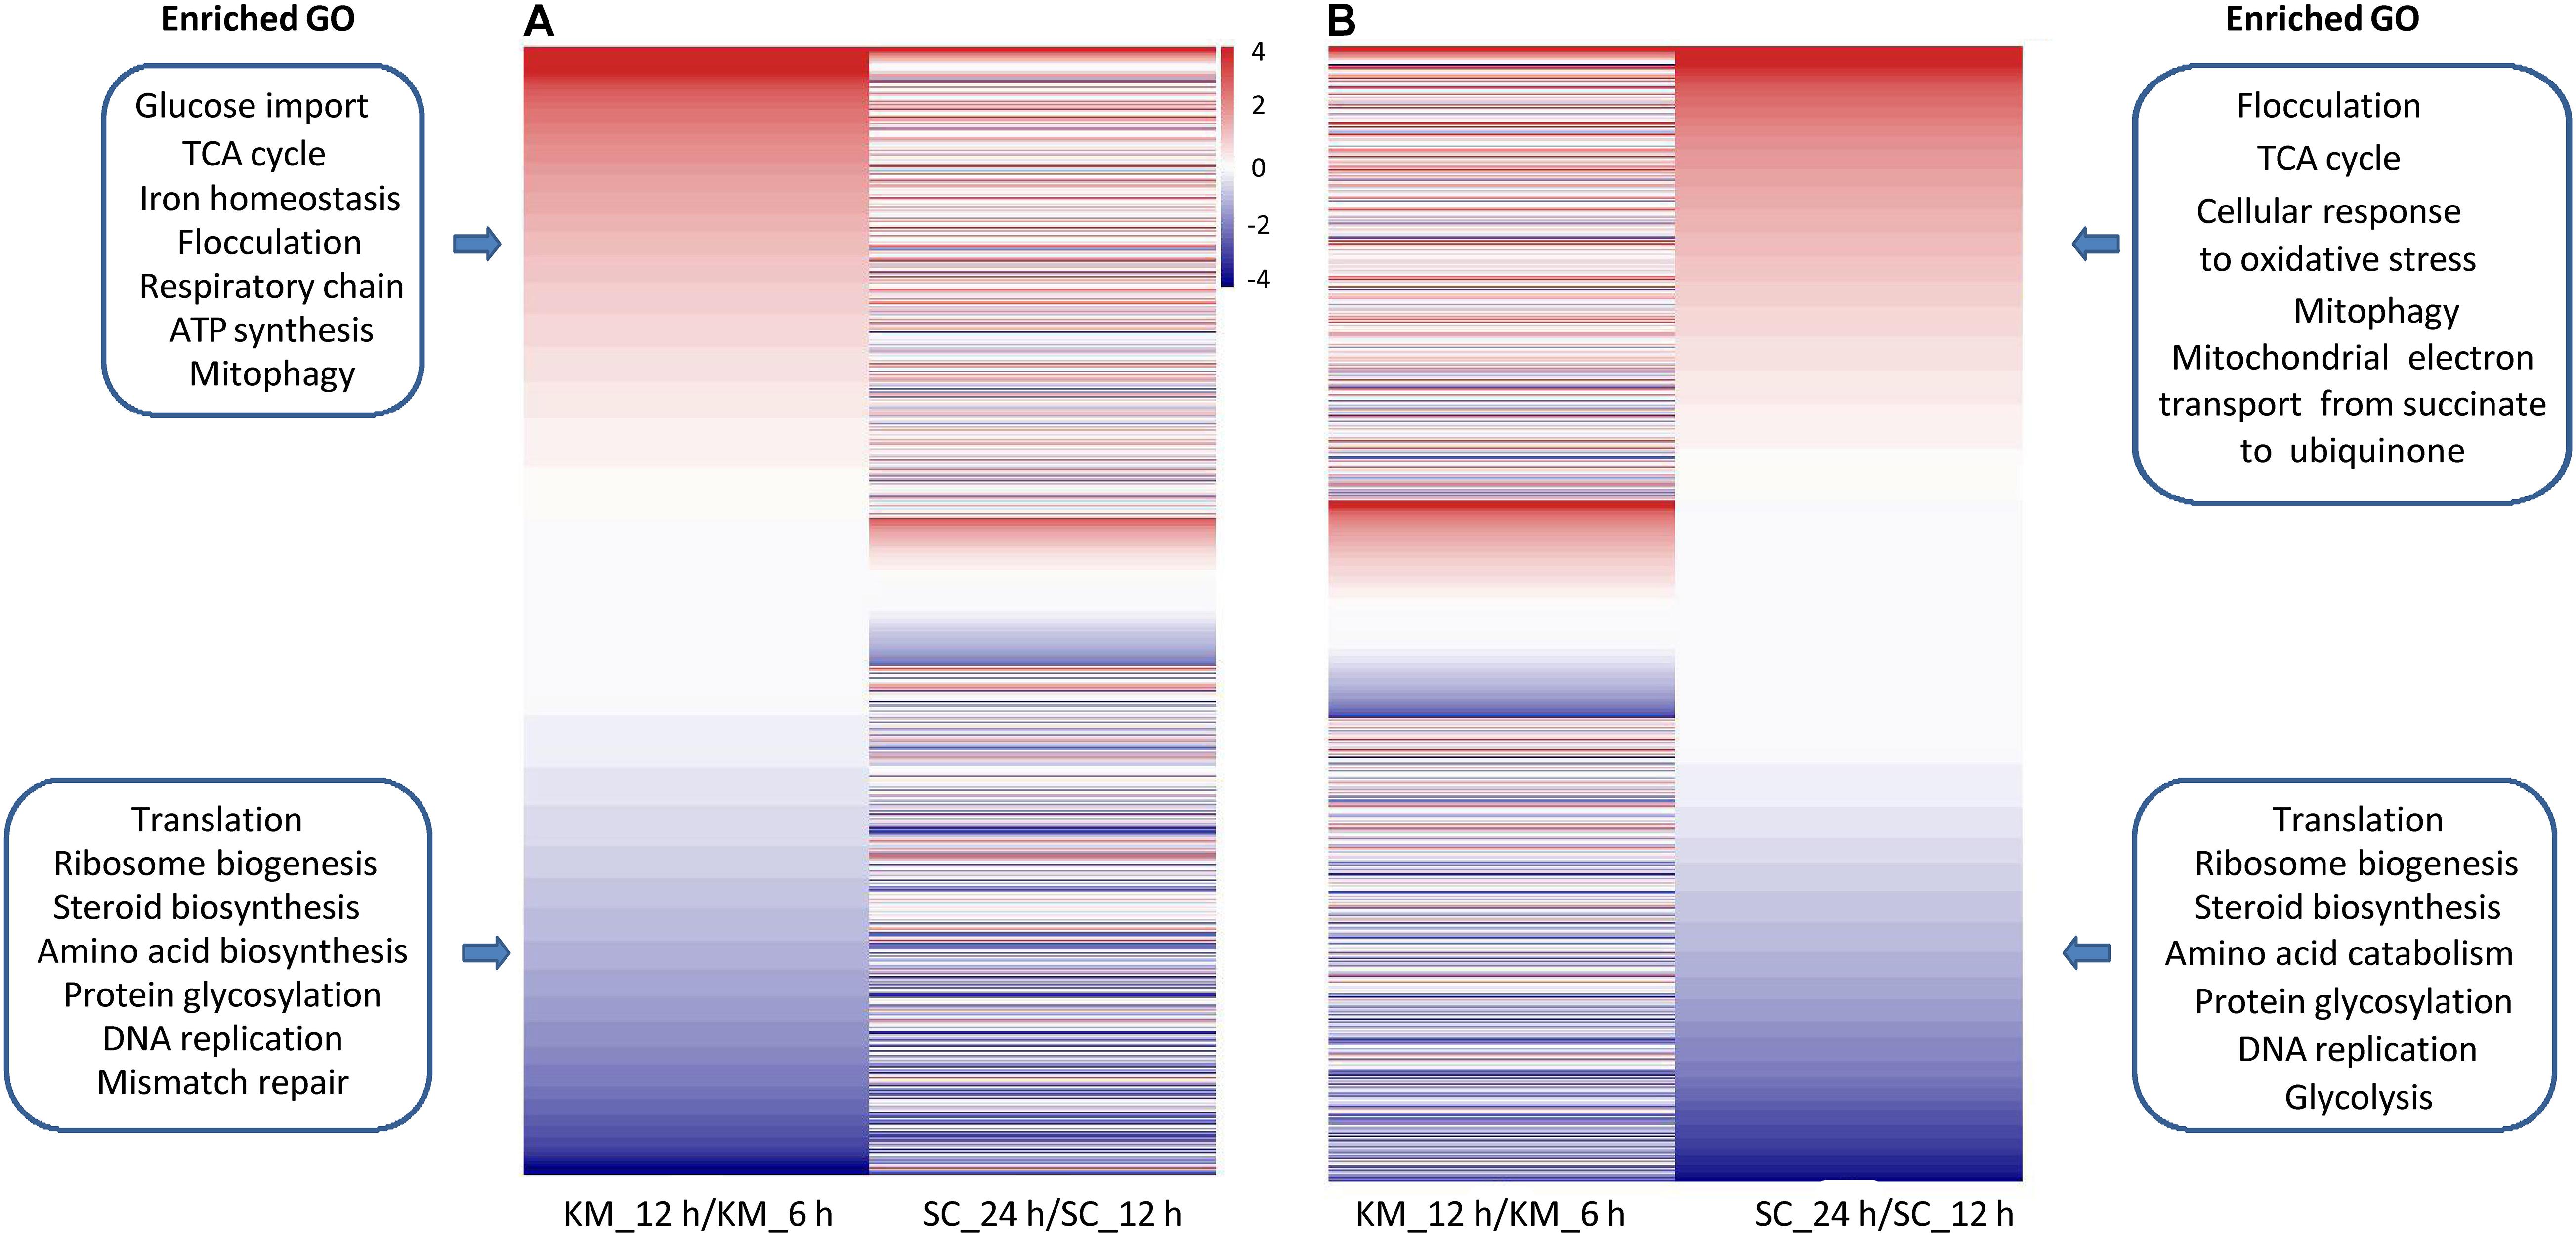
Figure 5. Comparison of changes in gene expression during the fast-growing phase in K. marxianus and S. cerevisiae (A) Families of K. marxianus ordered by GFOLD values. Corresponding families of S. cerevisiae were listed aside. GFOLD values of K. marxianus families indicate relative expression levels at 12 h after culturing comparing to those at 6 h (KM_12 h/KM_6 h). GFOLD values of S. cerevisiae families indicate relative expression levels at 24 h comparing to those at 6 h (SC_24 h/SC_12 h). Representative enriched GO terms in upregulated families and downregulated families of K. marxianus were shown in the upper box and lower box respectively. (B) Families of S. cerevisiae ordered by GFOLD values. Corresponding families of K. marxianus were listed aside. Representative enriched GO terms in S. cerevisiae families were shown in the boxes as (A).
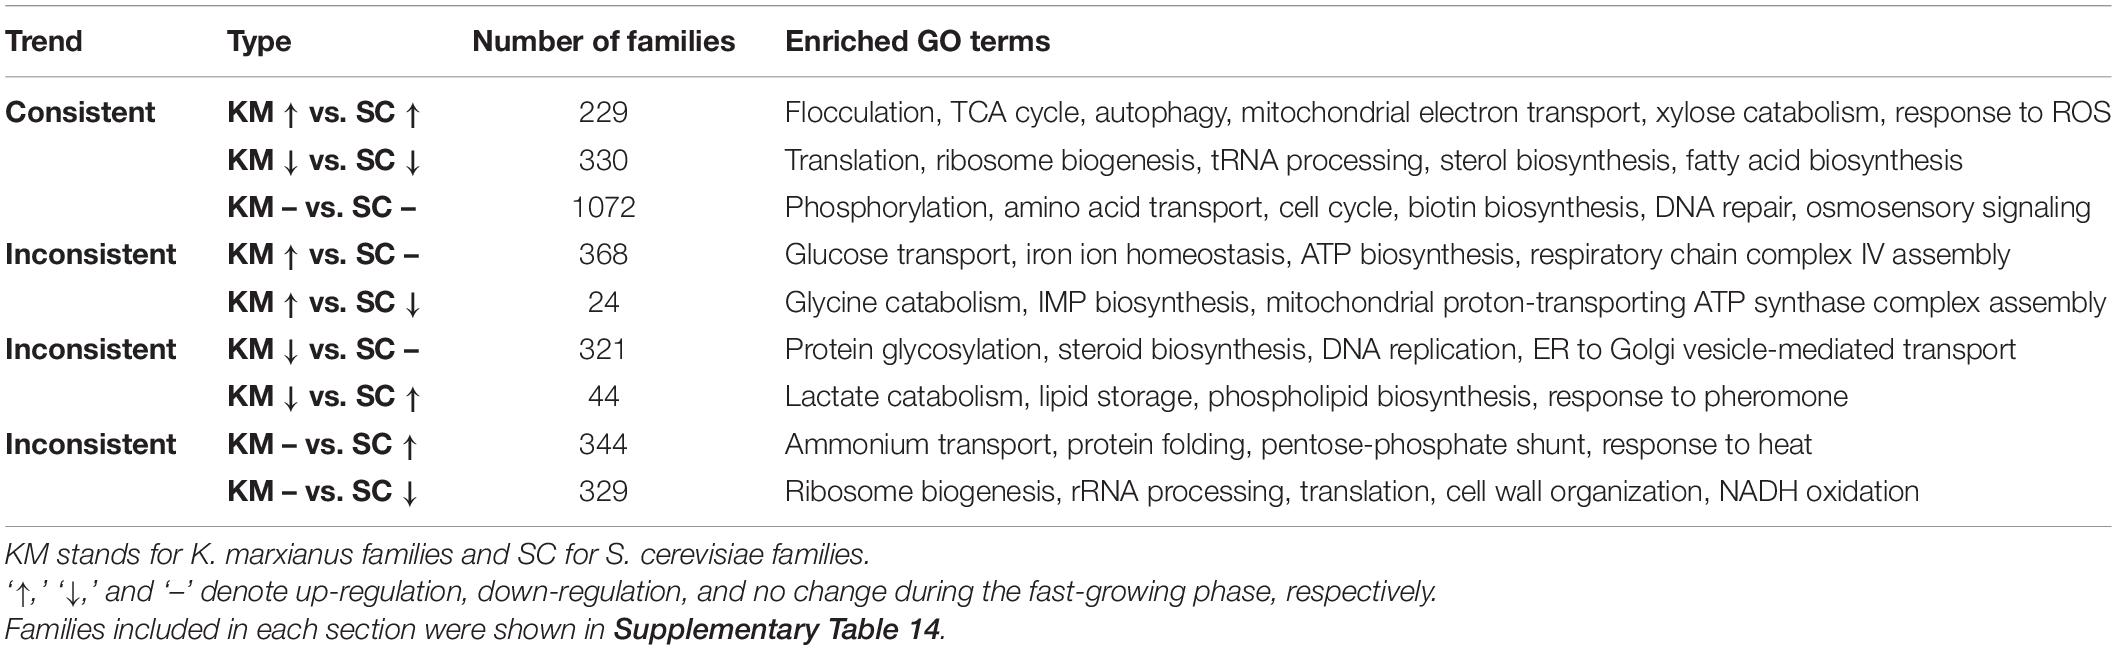
Table 3. Comparison of changes in gene expressions during the fast-growing phase in K. marxianus and S. cerevisiae.
The difference between two species in the regulation of central metabolic genes during the fast-growing phase was investigated in detail. As shown in Figure 6, the central metabolism was divided into material metabolism (left part, including glucose transport, glycolysis, and TCA cycle) and energy metabolism (right part, including respiratory chain, ATP synthesis, iron transport, and heme biosynthesis). In material metabolism, out of 10 genes involved in glucose transport, nine genes were upregulated in K. marxianus, while they were kept unchanged in S. cerevisiae. Meanwhile, six out of 12 genes in glycolysis and 14 out of 24 genes in TCA cycle were simultaneously regulated in K. marxianus and S. cerevisiae, reflecting a general consistency of regulation. In the energy metabolism, 15 out of 16 genes in iron transport and all five genes in heme biosynthesis were upregulated in K. marxianus, while they were kept unchanged in S. cerevisiae. The results suggested that iron transport and heme biosynthesis were specifically co-upregulated in K. marxianus. Out of 47 genes directly involved in the respiratory chain, excluding the genes in ATP synthesis, 14 genes were simultaneously upregulated in K. marxianus and S. cerevisiae, eight genes were specifically upregulated in S. cerevisiae and 18 genes were specifically upregulated in K. marxianus. Meanwhile, 14 out of 18 genes involved in the FOF1 ATPase-mediated ATP synthesis were specifically upregulated in K. marxianus. The results suggested that glucose transport, respiratory chain and ATP biogenesis were particularly co-upregulated in K. marxianus during the fast-growing phase.
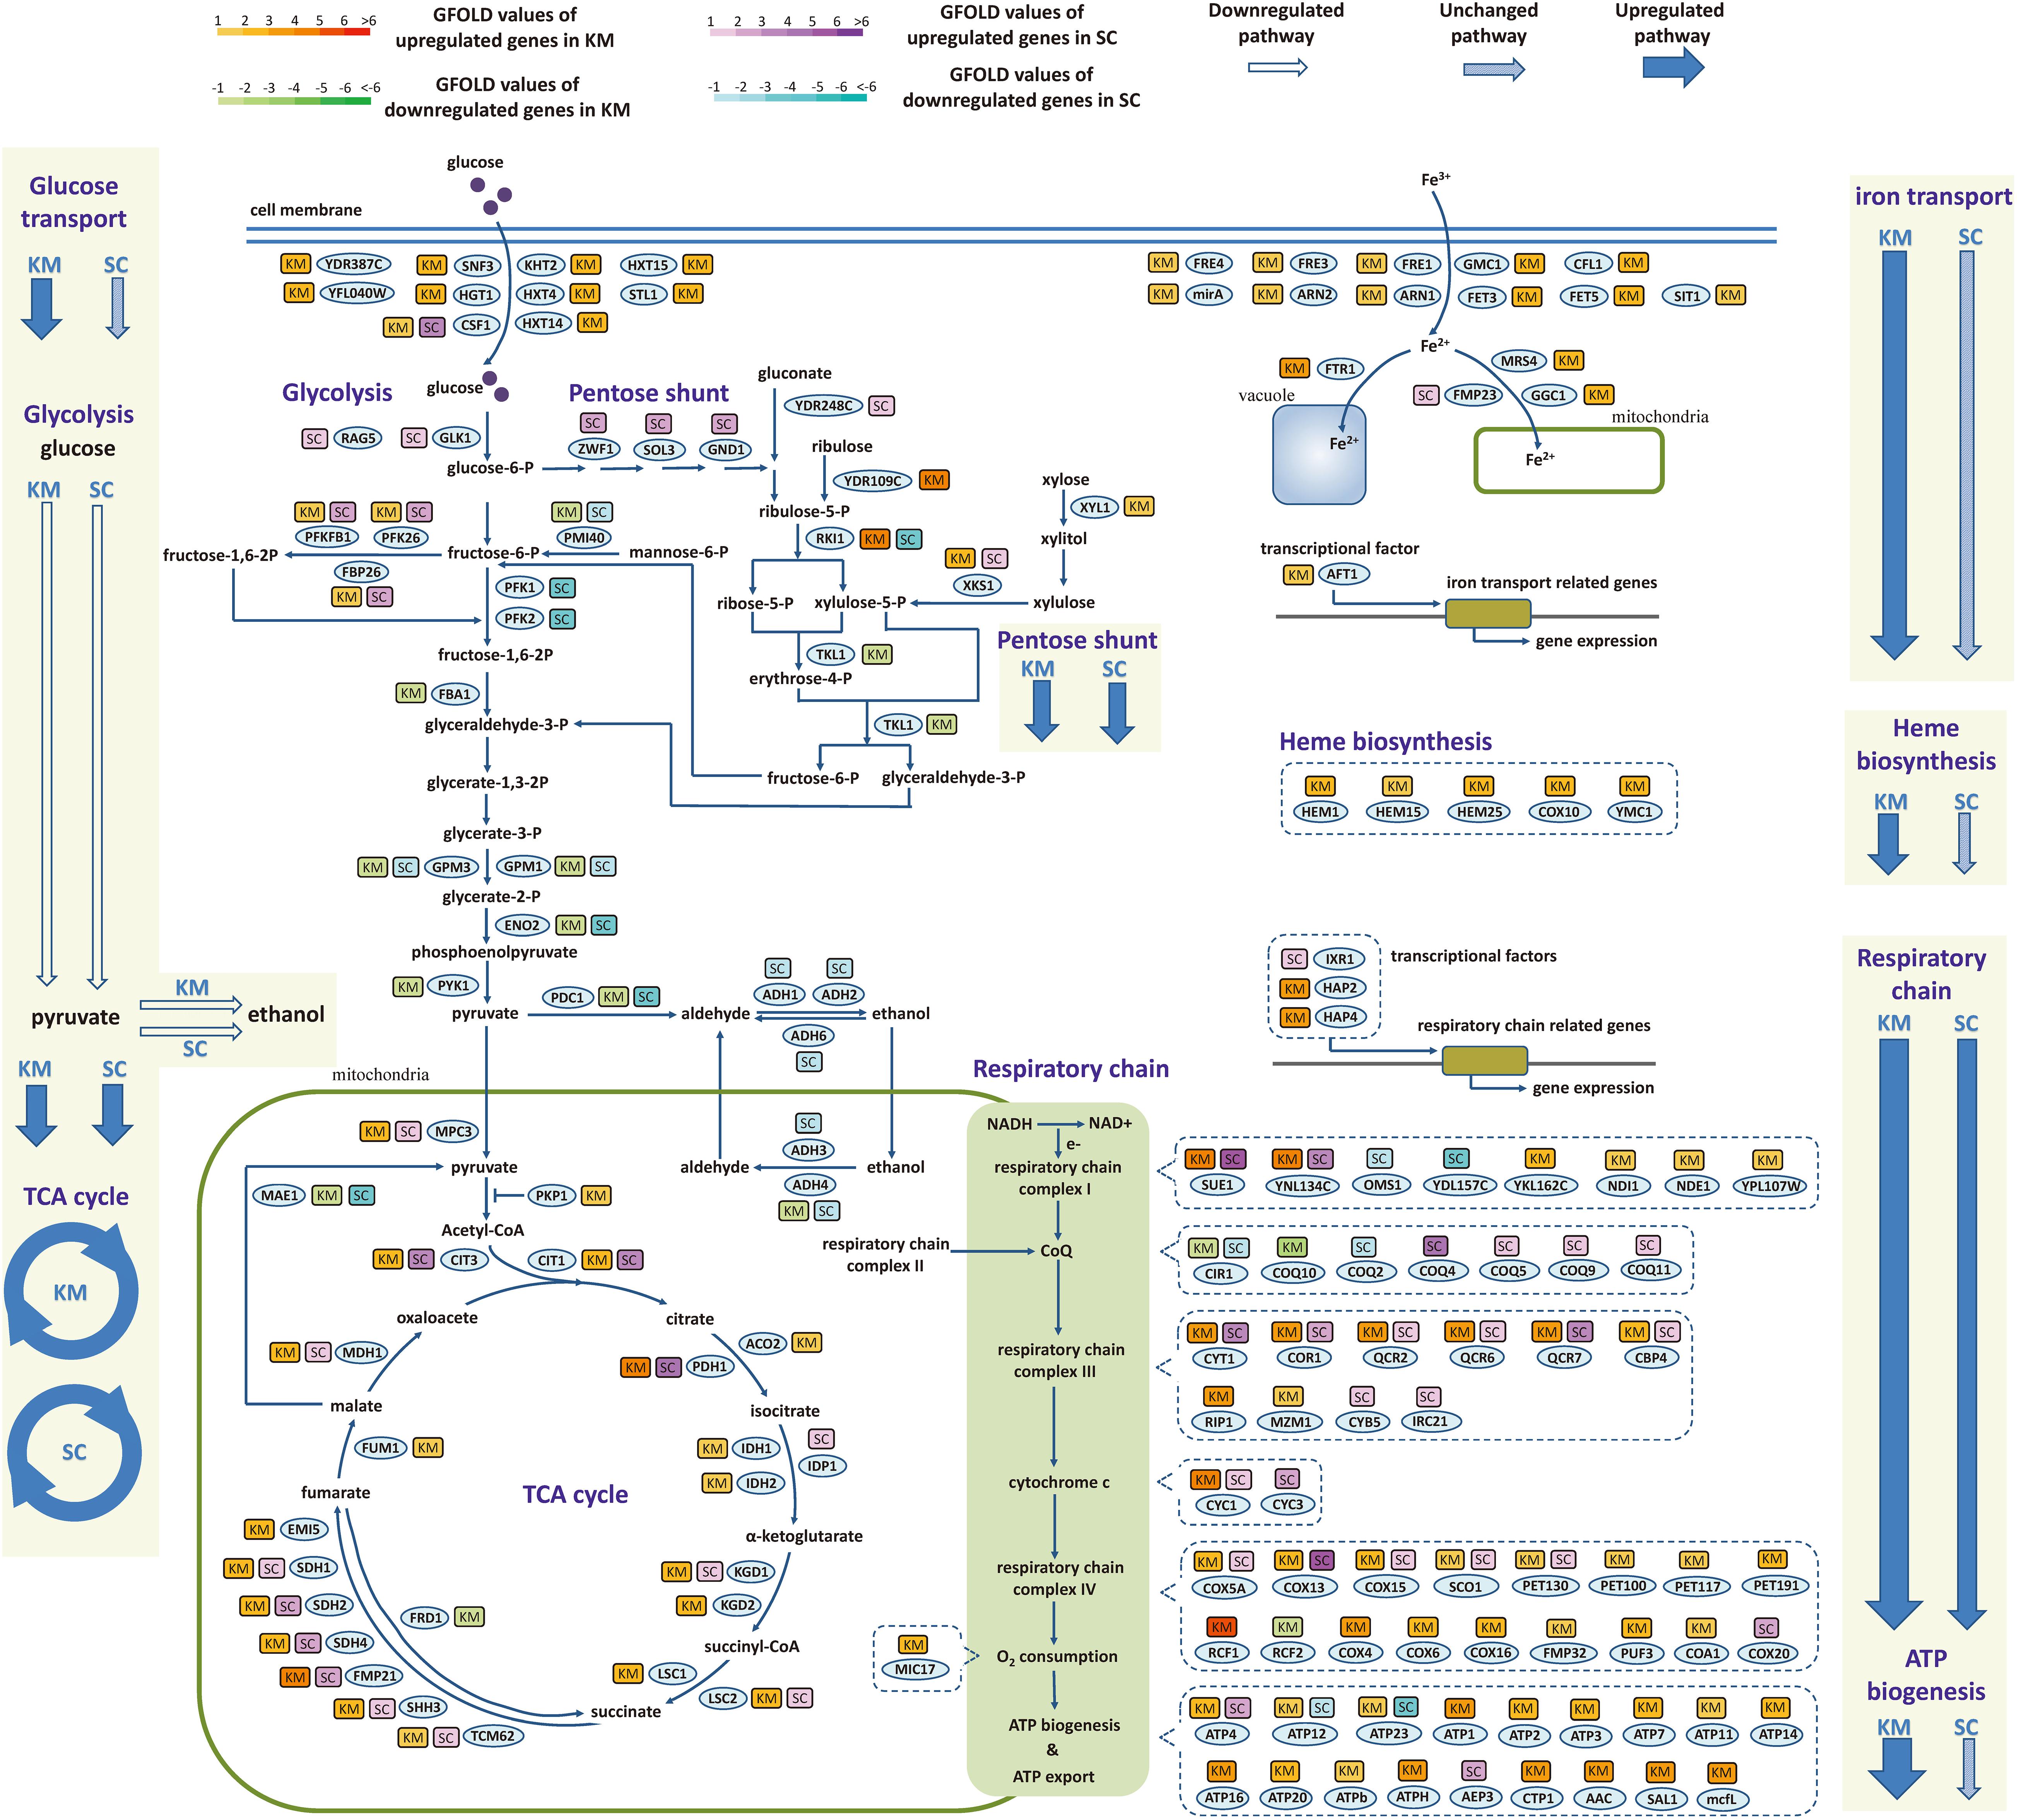
Figure 6. Expression changes of genes involved in central metabolic pathways during the fast-growing phase in K. marxianus and S. cerevisiae. The color of a box nearby a gene indicates the change of its expression during the fast-growing phase in K. marxianus (KM) and S. cerevisiae (SC). In the case of K. marxianus, expression levels of genes at 12 h after culturing were compared with those at 6 h and changes in expression levels were calculated as GFOLD values. Similarly, expression levels of S. cerevisiae genes at 24 h were compared with those at 12 h. Color bars corresponding to GFOLD values were shown on the top. Hollow arrow, arrow filled with slant pattern and blue solid arrow represent generally downregulated pathway, unchanged pathway and upregulated pathway, respectively.
In a comparison of transcriptomic data of FIM1 cells grown in the medium containing 0 and 4% ethanol (Mo et al., 2019), 14 out of 24 genes in TCA cycles and 13 out of 47 genes in the respiratory chain were upregulated in 4% ethanol, suggesting a weak upregulation of TCA cycle and respiration during ethanol tolerance. In 4% ethanol, 9 out of 17 genes in iron transport and three out of five genes in heme biosynthesis were upregulated, suggesting a weak co-upregulation of both processes (Supplementary Table 15). However, only one out of nine genes involved in glucose transport and 7 out of 17 genes involved in the FOF1 ATPase-mediated ATP synthesis were upregulated in 4% ethanol, suggesting a lacking of a general upregulation of both processes (Supplementary Table 15). Therefore, co-upregulation of glucose transport and ATP biogenesis might be a specific feature during the exponential phase in K. marxianus.
To investigate the underlying mechanism for the simultaneous upregulation of genes in K. marxianus during the fast-growing phase, 1 kb upstream sequences of 27 genes in the respiratory chain and those of 14 genes in ATP synthesis from K. marxianus and S. cerevisiae were analyzed by MEME software online for motif discovery (Bailey et al., 2009). Six significant motifs (E-value < 0.05) were located in upstream regions in K. marxianus (Figure 7A), and one significant motif was found in S. cerevisiae (Figure 7B). Similarly, 1 kb upstream sequence of respiratory chain genes and those of nine genes in glucose transport were analyzed. Three significant motifs were detected in K. marxianus (Figure 7D), and only one motif was identified in S. cerevisiae (Figure 7E). K. lactis is the closest relative of K. marxianus in evolution and it also exhibits a fast growth rate comparing to S. cerevisiae (Lane and Morrissey, 2010). In K. lactis, three significant motifs were detected in upstream sequences of the respiratory chain and ATP synthesis genes (Figure 7C), and one motif was detected in upstream sequences of respiratory chain and glucose transport genes (Figure 7F). Comparing to S. cerevisiae, K. marxianus, and K. lactis harbor increased amount of enriched motifs in upstream sequences of respiratory chain and ATP synthesis genes, suggesting the existence of sequence for the co-regulation of both processes. However, except an A-rich motif, no other consensus motif was found in K. marxianus and K. lactis. The A-rich motif seemed to be a general feature of upstream sequences in K. marxianus and K. lactis, as it could also be detected in upstream sequences of glycolysis and TCA cycle genes (Supplementary Figure 2). Therefore, the exact motif or sequence responsible for the co-regulation of respiratory chain and ATP synthesis genes, if it does exist, needs further investigation.
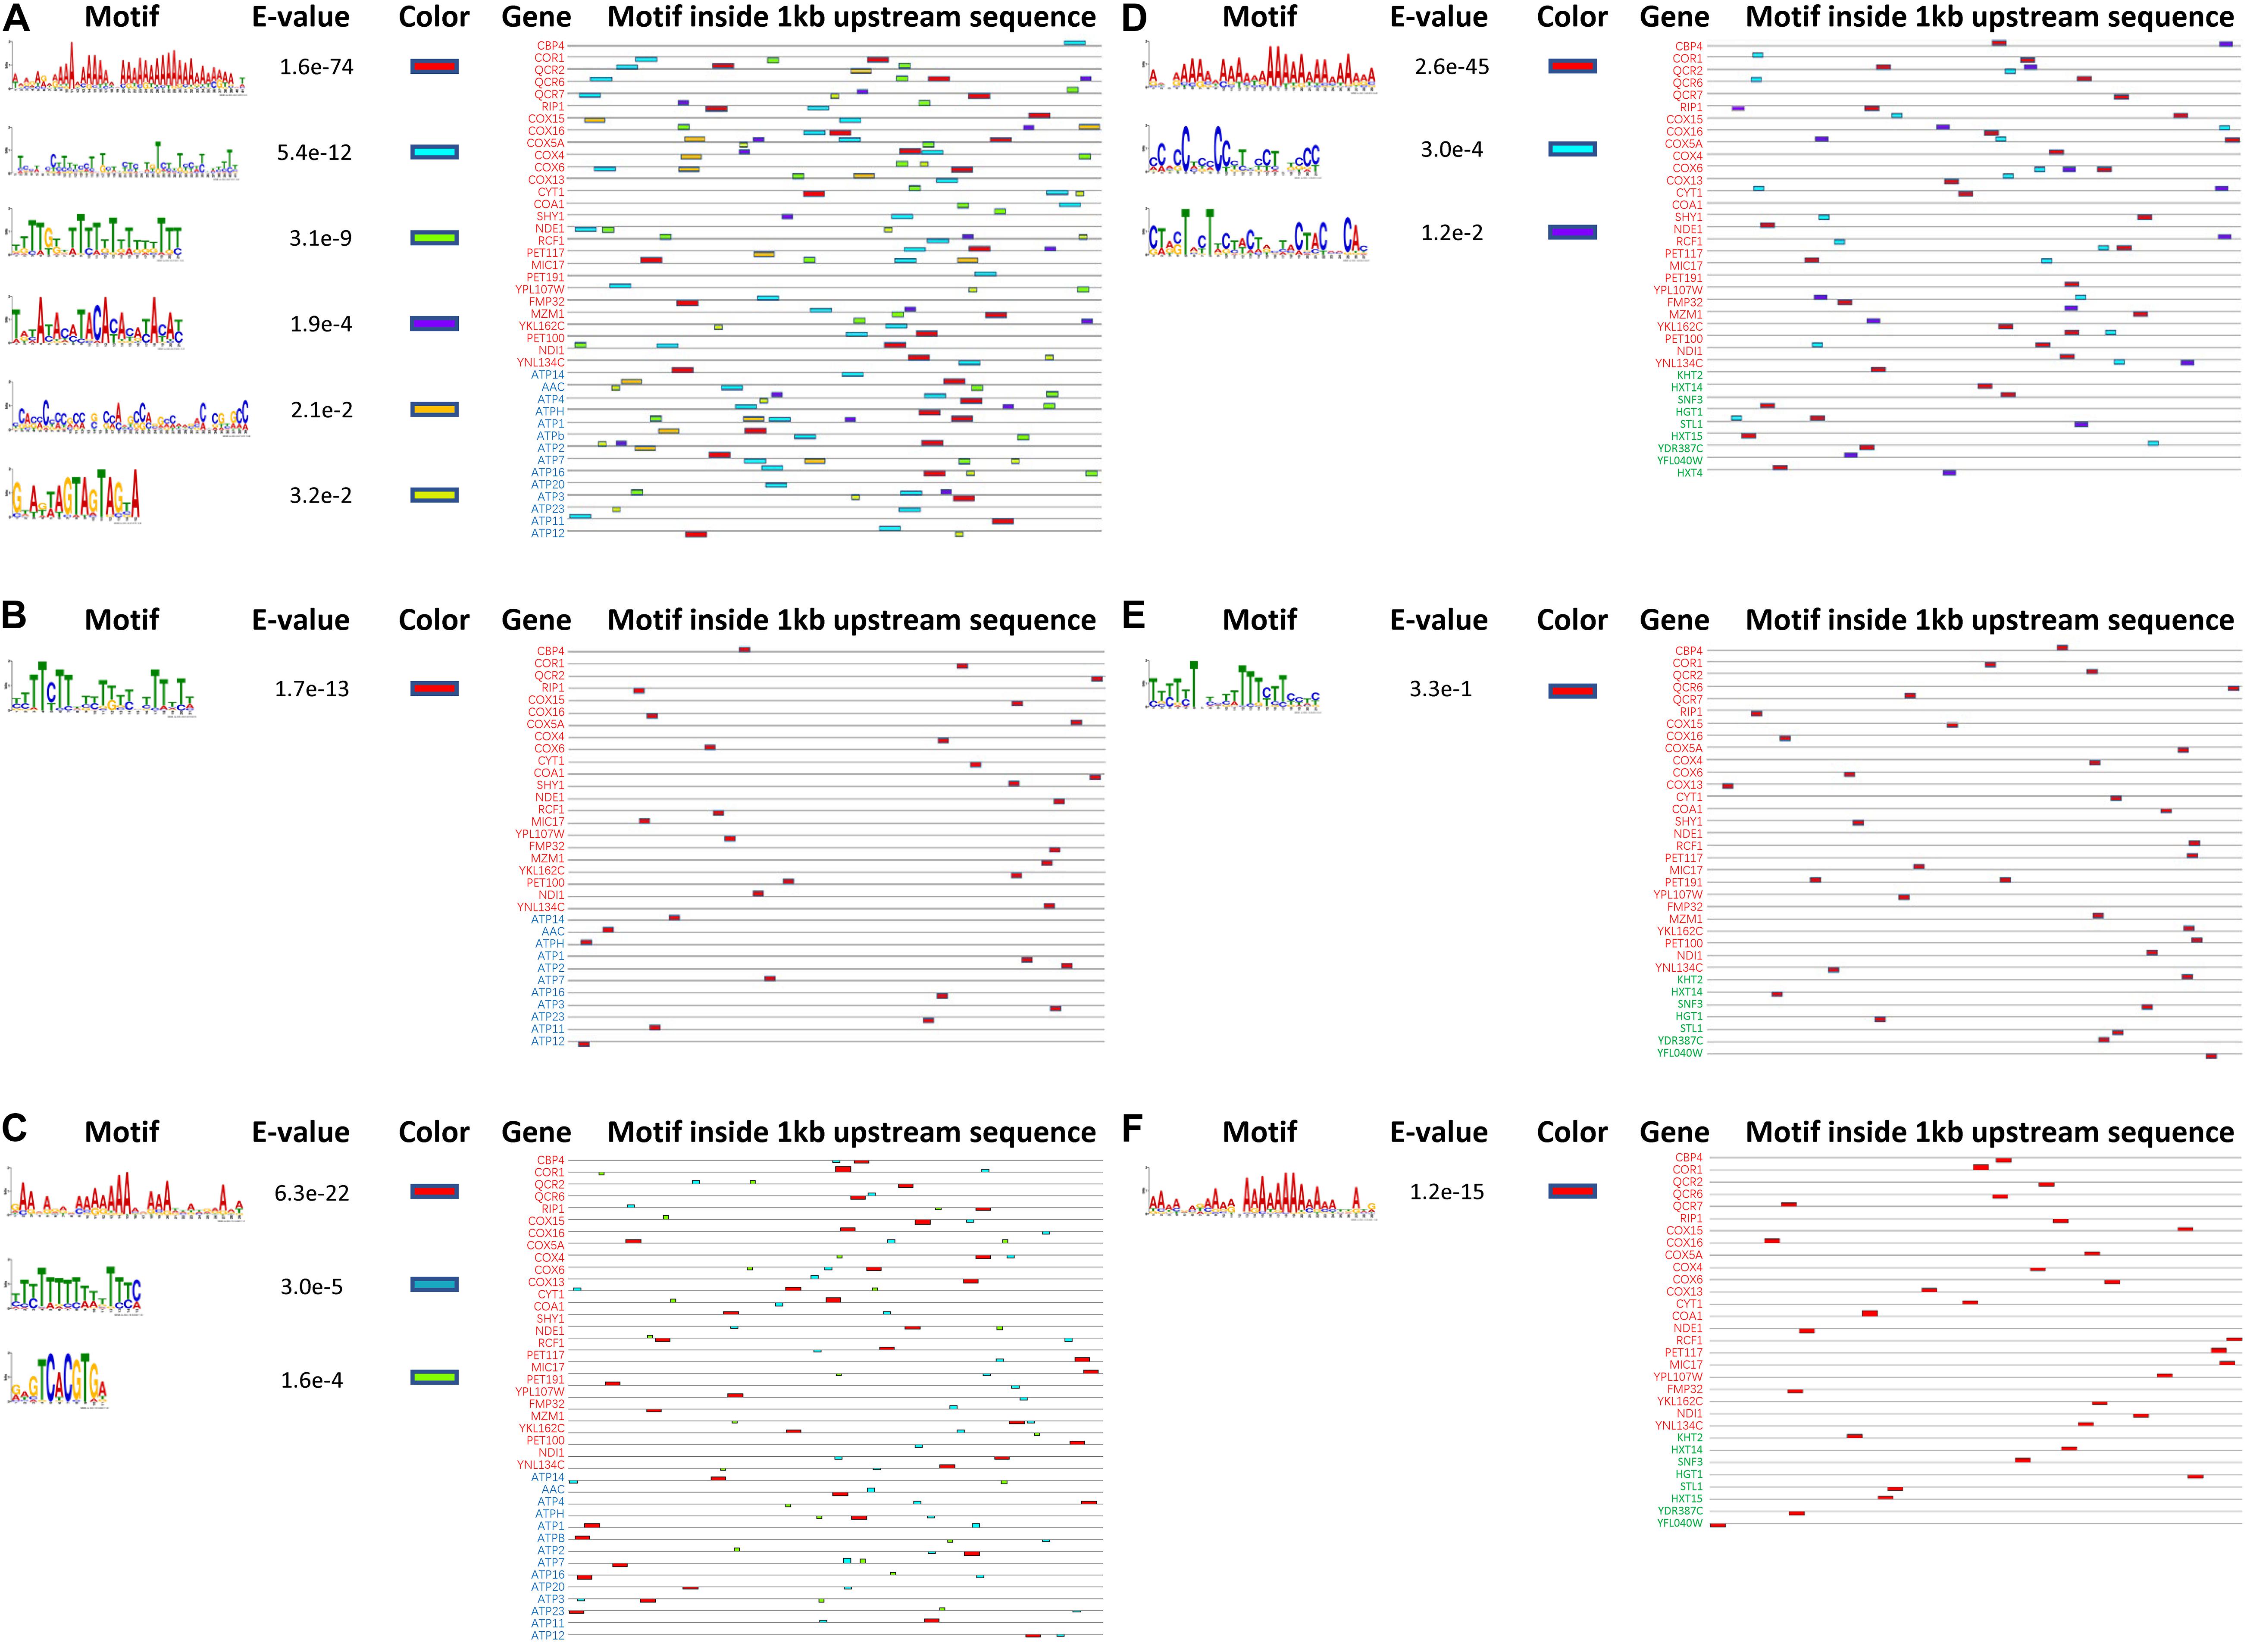
Figure 7. Predicted motifs inside upstream sequences of genes involved in the respiratory chain, ATP synthesis and glucose transport in K. marxianus, S. cerevisiae, and K. lactis. Motifs inside 1 kb upstream sequences of 27 respiratory chain genes (in red) and 14 ATP biosynthesis genes (in blue) are detected in K. marxianus (A), S. cerevisiae (B), and K. lactis (C). Motifs inside 1 kb upstream sequences of 27 respiratory chain genes (in red) and 9 glucose transport genes (in green) were identified in K. marxianus (D), S. cerevisiae (E), and K. lactis (F). Genes without any identified motif were not shown.
In this study, the comparative genomic and transcriptomic analysis revealed specific features of gene regulation in K. marxianus, comparing with S. cerevisiae. For example, genes participating in TCA cycles, respiration chain and ATP biosynthesis were specifically upregulated in K. marxianus during lag phase (Table 2). Meanwhile, genes involved in glucose transport, including 2 KMS genes (FIM1_7, FIM1_1043) were specifically upregulated in K. marxianus during the fast-growing phase (Figures 2, 6). These features might provide some clues to explain the mechanism underlying the well-known fast-growing phenotype of this species.
Generally, a higher growth rate relies on higher yield and production rate of ATP (Chen and Nielsen, 2019). However, heterotrophic organisms usually have to face the trade-off between yield and rate of ATP production (Pfeiffer et al., 2001). When substrates with higher free energy are degraded into products with lower free energy, the free energy difference between substrates and products can be partially converted into ATP and be partially used to drive the degradation reaction. For example, if one molecule of glucose is catabolized through the “glycolysis-respiratory chain” route (Figure 8A, blue arrow), 32 molecules of ATPs are generated. In this case, the free energy difference between substrates and products is almost totally preserved in ATPs. The reaction is in thermodynamic equilibrium and low rate of ATP production results in a slow rate of substrate degradation and other reactions such as glucose transport, which hinders the competition with other species for shared resources. If cells adopt the route of “glycolysis-fermentation” for substrate degradation (Figure 8A, red arrow), two molecules of ATPs are produced. The other part of free energy difference can be used to promote the degradation reaction and thus increase the rate of ATP production and glucose transport. This route gains an advantage in the resource competition but low yield ATP can hardly supply sufficient energy for cell growth.
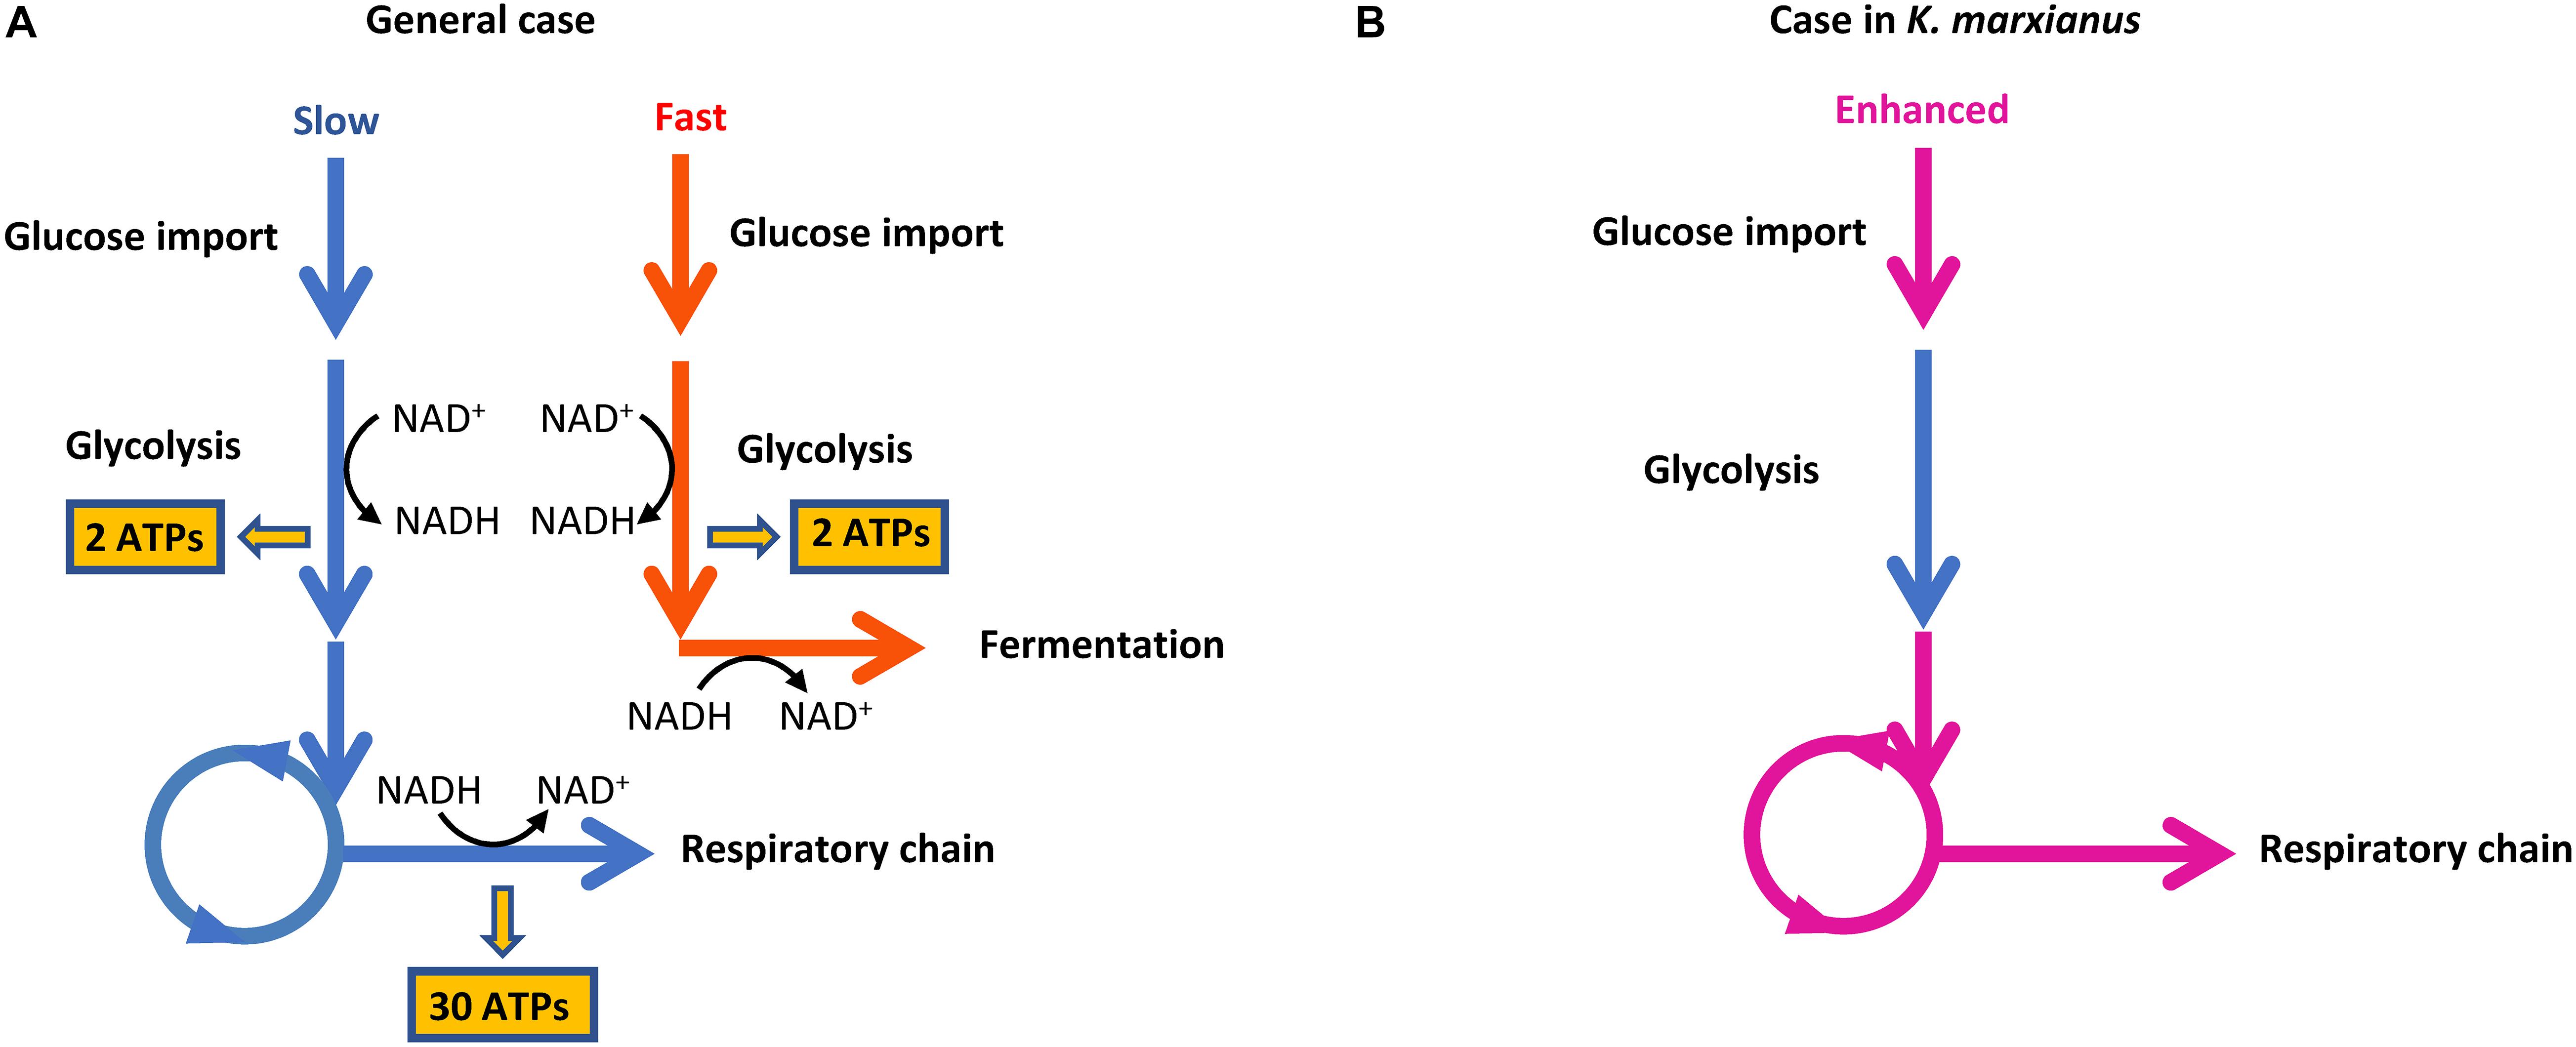
Figure 8. Routes of ATP production in cells. (A) The trade-off between ATP production yield and rate. (B) Coupling of enhanced glucose transport and respiration chain in K. marxianus.
Since K. marxianus was considered as the fastest-growing eukaryote on earth (Groeneveld et al., 2009), it must have evolved efficient strategies to reconcile the trade-off between yield and rate of ATP production. We proposed two strategies here that KM complies to improve the efficiency of ATP production, which is required to guarantee its fast growth.
(1) Kluyveromyces marxianus simultaneously upregulated respiratory chain and glucose transport, which did not exist in S. cerevisiae (Figures 6, 8B). Two KMS genes (FIM1_7, FIM1_1043) proposed to play a role in glucose transport were upregulated during late exponential phase (12 h) (Figure 2). Regarding homologous genes, genes involved in the respiratory chain and glucose transport were co-upregulated in K. marxianus, while they were kept unchanged in S. cerevisiae during the fast-growing phase (Figure 6). The co-upregulation in K. marxianus might be supported by some shared motifs upstream of genes involved in the respiratory chain and glucose transport (Figure 7D). Therefore, upon the reduced rate of glucose transport caused by the low rate of ATP production through respiration pathways, K. marxianus might intentionally upregulate the expression of glucose transport genes to promote the absorbance of glucose from the environment. This strategy might alleviate the disadvantage of K. marxianus cells in the competition for shared resources during respiration.
(2) Kluyveromyces marxianus tightly co-upregulated genes involved in respiratory chain and FOF1 ATPase-mediated ATP biosynthesis during the fast-growing phase (Figure 6). In contrast, during the fast-growing phase in S. cerevisiae, genes involved in the respiratory chain were upregulated but genes encoding FOF1 ATPase were unchanged (Figure 6). The result suggested a relax coupling of the respiratory chain and ATP synthesis in S. cerevisiae. The number of shared motifs upstream of the respiratory chain and FOF1 ATPase genes in K. marxianus (Figure 7A) was greater than that in S. cerevisiae (Figure 7B), suggesting that K. marxianus optimized the transcriptional regulatory elements to ensure the co-upregulation and coupling of the respiratory chain and ATP synthesis. The coupling improved the efficiency of transformation from free energy difference derived from electron transport chain into ATP and reduced the amount of residual free energy difference which is commonly transformed into heat (Nakamura and Matsuoka, 1978). Heat leads to the stress response and the overexpression of molecular chaperones for protein folding (Gage and Neidhardt, 1993). Consistent with this idea, genes involved in the response to heat and protein folding were upregulated in S. cerevisiae, while they were kept unchanged in K. marxianus (Table 3).
It should be noted that specific features of gene regulation in K. marxianus proposed here was based on the transcriptome of cells cultured in the rich YPD medium under aerobic condition. Rich media supported the fast growth of K. marxianus (Rodrussamee et al., 2011), but were not generally applied in industrial fermentation, given the concern of cost reduction. In contrast, fermentation of K. marxianus in some poor media was regarded as promising industrial applications. For example, K. marxianus was utilized in bioethanol production from cheese whey permeate (Silveira et al., 2005; Zafar and Owais, 2006), and lignocellulosic biomass (Sivarathnakumar et al., 2019). K. marxianus was developed to remove copper(II) ions from wastewater in the presence of molasses (Skountzou et al., 2003). The specific growth rates of K. marxianus under these conditions reduced dramatically compared with those in rich media. In the future, it will be worthwhile to perform the transcriptomic analysis of K. marxianus cells grown in poor media to reveal their specific patterns of gene regulation.
Comparative genomic analysis revealed 60 KMS genes, grouped in 53 families. 48% of KMS genes were upregulated during cultivation in rich medium and may participate in glucose transport and mitochondrion related functions. Comparative transcriptomic analysis revealed that, during the fast-growing phase of K. marxianus, genes participating in respiration chain were specifically co-upregulated with those involved in glucose transport and ATP biosynthesis, which might be attributed to the shared motifs upstream of relevant genes. Specific features in the gene regulation might underly the fast-growing trait of K. marxianus. Our study underscores the importance of genome-wide rewiring of the transcriptional network during evolution and proposes a practicable means to explain complex phenotype by combining genome evolution and homologous gene expression analysis.
The datasets presented in this study can be found in online repositories. The names of the repository/repositories and accession number(s) can be found below: https://www.ncbi.nlm.nih.gov/assembly/GCA_001854445.2; https://www.ncbi.nlm.nih.gov/bioproject/prjna658204.
WM, YY, JZh, and JQ performed the genome sequencing and assembly. WM, TL, and JQ carried out the genome annotation and upload to NCBI. XY, HR, and TL carried out the strain cultivation and RNA-seq sample preparation. WL and JQ reconstructed the phylogenetic tree. WM and JQ analyzed the gain/lost genes and high-copied genes. WM, JQ, HL, JZe, and YY analyzed the RNA-seq data. HR performed the RT-qPCR analysis. WM analyzed the motifs of the upstream sequences. YY, WM, and HL prepared the manuscript. HL, JQ, and YY organized this research project. All the authors have read and approved the final version of the manuscript.
This work was supported by the National Natural Science Foundation of China (Nos. 31970068 and 31770094 to HL, No. 31970549 to YY, and No. 31770244 to JQ), the Science and Technology Research Program of Shanghai (Grant Numbers 19395800600, 18391901800, 19DZ2282100 to HL), Tianjin Synthetic Biotechnology Innovation Capacity Improvement Project (TSBICIP-KJGG-006), and the Open Research Funds of the State Key Laboratory of Genetic Engineering, Fudan University.
The authors declare that the research was conducted in the absence of any commercial or financial relationships that could be construed as a potential conflict of interest.
The Supplementary Material for this article can be found online at: https://www.frontiersin.org/articles/10.3389/fmicb.2021.598060/full#supplementary-material
Supplementary Figure 1 | Growth curves of K. marxianus and S. cerevisiae.
Supplementary Figure 2 | Predicted motifs inside upstream sequences of glycolysis and TCA cycle genes in K. marxianus and K. lactis.
Supplementary Table 1 | Primers used in this study.
Supplementary Table 2 | Correlation between the systematic gene name in FIM1 and DMKU 3-1042 strain.
Supplementary Table 3 | Coding sequences of genes in FIM1.
Supplementary Table 4 | Gene families in K. marxianus and S. cerevisiae.
Supplementary Table 5 | K. marxianus-specific (Kms) genes and families.
Supplementary Table 6 | Highly copied genes in K. marxianus.
Supplementary Table 7 | GFOLD values between expression levels of KMS families at later time points and levels at 1 h.
Supplementary Table 8 | Clusters of families which were grouped according to their expression patterns during cultivation.
Supplementary Table 9 | Significantly enriched GO terms in the cluster of families.
Supplementary Table 10 | GFOLD between expression levels of K. marxianus families and those of S. cerevisiae families after being cultivated for 1 h.
Supplementary Table 11 | Significantly enriched GO terms in relatively upregulated or downregulated families in K. marxianus during the lag phase.
Supplementary Table 12 | Families ordered by the changes in their expression levels during the fast-growing phase.
Supplementary Table 13 | Enriched GO terms in upregulated and downregulated families of K. marxianus or S. cerevisiae during the fast-growing phase.
Supplementary Table 14 | Gene families grouped with changes of expression levels during the fast-growing phase.
Supplementary Table 15 | Changes of mRNA levels during cultivation with ethanol in K. marxianus.
Supplementary File 1 | GFF file of DMB1 genome.
Supplementary File 2 | GFF file of KCTC 17555 genome.
Supplementary File 3 | GFF file of CCT 7735 genome.
Bailey, T. L., Boden, M., Buske, F. A., Frith, M., Grant, C. E., Clementi, L., et al. (2009). Meme Suite: tools for motif discovery and searching. Nucleic Acids Res. 37, W202–W208. doi: 10.1093/nar/gkp335
Capella-Gutierrez, S., Silla-Martinez, J. M., and Gabaldon, T. (2009). trimAl: a tool for automated alignment trimming in large-scale phylogenetic analyses. Bioinformatics 25, 1972–1973. doi: 10.1093/bioinformatics/btp348
Chen, Y., and Nielsen, J. (2019). Energy metabolism controls phenotypes by protein efficiency and allocation. Proc. Natl. Acad. Sci. U.S.A. 116, 17592–17597. doi: 10.1073/pnas.1906569116
Duan, J., Yang, D., Chen, L., Yu, Y., Zhou, J., and Lu, H. (2019). Efficient production of porcine circovirus virus-like particles using the nonconventional yeast Kluyveromyces marxianus. Appl. Microbiol. Biotechnol. 103, 833–842. doi: 10.1007/s00253-018-9487-2
Dutkowski, J., Kramer, M., Surma, M. A., Balakrishnan, R., Cherry, J. M., Krogan, N. J., et al. (2013). A gene ontology inferred from molecular networks. Nat. Biotechnol. 31, 38–45. doi: 10.1038/nbt.2463
Edgar, R. C. (2004). MUSCLE: a multiple sequence alignment method with reduced time and space complexity. BMC Bioinformatics 5:113. doi: 10.1186/1471-2105-5-113
Feng, J., Meyer, C. A., Wang, Q., Liu, J. S., Shirley Liu, X., and Zhang, Y. (2012). GFOLD: a generalized fold change for ranking differentially expressed genes from RNA-seq data. Bioinformatics 28, 2782–2788. doi: 10.1093/bioinformatics/bts515
Fonseca, G. G., Heinzle, E., Wittmann, C., and Gombert, A. K. (2008). The yeast Kluyveromyces marxianus and its biotechnological potential. Appl. Microbiol. Biotechnol. 79, 339–354. doi: 10.1007/s00253-008-1458-6
Gage, D. J., and Neidhardt, F. C. (1993). Adaptation of Escherichia coli to the uncoupler of oxidative phosphorylation 2,4-dinitrophenol. J. Bacteriol. 175, 7105–7108. doi: 10.1128/jb.175.21.7105-7108.1993
Gao, M. J., Zheng, Z. Y., Wu, J. R., Dong, S. J., Li, Z., Jin, H., et al. (2012). Improvement of specific growth rate of Pichia pastoris for effective porcine interferon-alpha production with an on-line model-based glycerol feeding strategy. Appl. Microbiol. Biotechnol. 93, 1437–1445. doi: 10.1007/s00253-011-3605-8
Gombert, A. K., Madeira, J. V. Jr., Cerdan, M. E., and Gonzalez-Siso, M. I. (2016). Kluyveromyces marxianus as a host for heterologous protein synthesis. Appl. Microbiol. Biotechnol. 100, 6193–6208. doi: 10.1007/s00253-016-7645-y
Groeneveld, P., Stouthamer, A. H., and Westerhoff, H. V. (2009). Super life–how and why ‘cell selection’ leads to the fastest-growing eukaryote. FEBS J. 276, 254–270. doi: 10.1111/j.1742-4658.2008.06778.x
Inokuma, K., Ishii, J., Hara, K. Y., Mochizuki, M., Hasunuma, T., and Kondo, A. (2015). Complete genome sequence of Kluyveromyces marxianus NBRC1777, a nonconventional thermotolerant yeast. Genome Announc 3:e00389-15. doi: 10.1128/genomeA.00389-15
Jeong, H., Lee, D. H., Kim, S. H., Kim, H. J., Lee, K., Song, J. Y., et al. (2012). Genome sequence of the thermotolerant yeast Kluyveromyces marxianus var. marxianus KCTC 17555. Eukaryot Cell 11, 1584–1585. doi: 10.1128/EC.00260-12
Kim, D., Langmead, B., and Salzberg, S. L. (2015). HISAT: a fast spliced aligner with low memory requirements. Nat. Methods 12, 357–360. doi: 10.1038/nmeth.3317
Lane, M. M., and Morrissey, J. P. (2010). Kluyveromyces marxianus: a yeast emerging from its sister’s shadow. Fung. Biol. Rev. 24, 17–26. doi: 10.1016/j.fbr.2010.01.001
Lertwattanasakul, N., Kosaka, T., Hosoyama, A., Suzuki, Y., Rodrussamee, N., Matsutani, M., et al. (2015). Genetic basis of the highly efficient yeast Kluyveromyces marxianus: complete genome sequence and transcriptome analyses. Biotechnol. Biofuels 8:47. doi: 10.1186/s13068-015-0227-x
Li, L., Stoeckert, C. J. Jr., and Roos, D. S. (2003). OrthoMCL: identification of ortholog groups for eukaryotic genomes. Genome Res. 13, 2178–2189. doi: 10.1101/gr.1224503
Lowe, T. M., and Eddy, S. R. (1997). tRNAscan-SE: a program for improved detection of transfer RNA genes in genomic sequence. Nucleic Acids Res. 25, 955–964. doi: 10.1093/nar/25.5.955
Luo, R., Liu, B., Xie, Y., Li, Z., Huang, W., Yuan, J., et al. (2012). SOAPdenovo2: an empirically improved memory-efficient short-read de novo assembler. Gigascience 1:18. doi: 10.1186/2047-217X-1-18
Mo, W., Wang, M., Zhan, R., Yu, Y., He, Y., and Lu, H. (2019). Kluyveromyces marxianus developing ethanol tolerance during adaptive evolution with significant improvements of multiple pathways. Biotechnol. Biofuels 12:63. doi: 10.1186/s13068-019-1393-z
Nakamura, T., and Matsuoka, I. (1978). Calorimetric studies of heat of respiration of mitochondria. J. Biochem. 84, 39–46. doi: 10.1093/oxfordjournals.jbchem.a132117
Nielsen, J., and Jewett, M. C. (2008). Impact of systems biology on metabolic engineering of Saccharomyces cerevisiae. FEMS Yeast Res. 8, 122–131. doi: 10.1111/j.1567-1364.2007.00302.x
O’Brien, K. P., Remm, M., and Sonnhammer, E. L. (2005). Inparanoid: a comprehensive database of eukaryotic orthologs. Nucleic Acids Res. 33, D476–D480. doi: 10.1093/nar/gki107
Ortiz-Merino, R. A., Varela, J. A., Coughlan, A. Y., Hoshida, H., da Silveira, W. B., Wilde, C., et al. (2018). Ploidy variation in Kluyveromyces marxianus separates dairy and non-dairy isolates. Front. Genet. 9:94. doi: 10.3389/fgene.2018.00094
Pfeiffer, T., Schuster, S., and Bonhoeffer, S. (2001). Cooperation and competition in the evolution of ATP-producing pathways. Science 292, 504–507. doi: 10.1126/science.1058079
Pronk, J. T., Yde Steensma, H., and Van Dijken, J. P. (1996). Pyruvate metabolism in Saccharomyces cerevisiae. Yeast 12, 1607–1633. doi: 10.1002/(sici)1097-0061(199612)12:16<1607::aid-yea70<3.0.co;2-4
Proux-Wera, E., Armisen, D., Byrne, K. P., and Wolfe, K. H. (2012). A pipeline for automated annotation of yeast genome sequences by a conserved-synteny approach. BMC Bioinformatics 13:237. doi: 10.1186/1471-2105-13-237
Rodrussamee, N., Lertwattanasakul, N., Hirata, K., Suprayogi, Limtong, S., Kosaka, T., et al. (2011). Growth and ethanol fermentation ability on hexose and pentose sugars and glucose effect under various conditions in thermotolerant yeast Kluyveromyces marxianus. Appl. Microbiol. Biotechnol. 90, 1573–1586. doi: 10.1007/s00253-011-3218-2
Sakihama, Y., Hidese, R., Hasunuma, T., and Kondo, A. (2019). Increased flux in acetyl-CoA synthetic pathway and TCA cycle of Kluyveromyces marxianus under respiratory conditions. Sci. Rep. 9:5319. doi: 10.1038/s41598-019-41863-1
Schabort du, T. W., Letebele, P. K., Steyn, L., Kilian, S. G., and du Preez, J. C. (2016). Differential RNA-seq, multi-network analysis and metabolic regulation analysis of Kluyveromyces marxianus reveals a compartmentalised response to xylose. PLoS One 11:e0156242. doi: 10.1371/journal.pone.0156242
Schape, P., Kwon, M. J., Baumann, B., Gutschmann, B., Jung, S., Lenz, S., et al. (2019). Updating genome annotation for the microbial cell factory Aspergillus niger using gene co-expression networks. Nucleic Acids Res. 47, 559–569. doi: 10.1093/nar/gky1183
Silveira, W. B., Diniz, R. H., Cerdan, M. E., Gonzalez-Siso, M. I., Souza Rde, A., Vidigal, P. M., et al. (2014). Genomic sequence of the yeast Kluyveromyces marxianus CCT 7735 (UFV-3), a highly lactose-fermenting yeast isolated from the brazilian dairy industry. Genome Announc. 2:e01136-14. doi: 10.1128/genomeA.01136-14
Silveira, W. B., Passos, F., Mantovani, H. C., and Passos, F. M. L. (2005). Ethanol production from cheese whey permeate by Kluyveromyces marxianus UFV-3: a flux analysis of oxido-reductive metabolism as a function of lactose concentration and oxygen levels. Enzy. Microb. Technol. 36, 930–936. doi: 10.1016/j.enzmictec.2005.01.018
Sivarathnakumar, S., Jayamuthunagai, J., Baskar, G., Praveenkumar, R., Selvakumari, I. A. E., and Bharathiraja, B. (2019). Bioethanol production from woody stem Prosopis juliflora using thermo tolerant yeast Kluyveromyces marxianus and its kinetics studies. Bioresour. Technol. 293:122060. doi: 10.1016/j.biortech.2019.122060
Skountzou, P., Soupioni, M., Bekatorou, A., Kanellaki, M., Koutinas, A. A., Marchant, R., et al. (2003). Lead(II) uptake during baker’s yeast production by aerobic fermentation of molasses. Proces. Biochem. 38, 1479–1482. doi: 10.1016/S0032-9592(03)00023-2
Suzuki, T., Hoshino, T., and Matsushika, A. (2014). Draft genome sequence of Kluyveromyces marxianus strain DMB1, isolated from sugarcane bagasse hydrolysate. Genome Announc 2:e00733-14. doi: 10.1128/genomeA.00733-14
Wolfe, K. H., Armisen, D., Proux-Wera, E., OhEigeartaigh, S. S., Azam, H., Gordon, J. L., et al. (2015). Clade- and species-specific features of genome evolution in the Saccharomycetaceae. FEMS Yeast Res. 15:fov035. doi: 10.1093/femsyr/fov035
Zafar, S., and Owais, M. (2006). Ethanol production from crude whey by Kluyveromyces marxianus. Biochem. Eng. J. 27, 295–298. doi: 10.1016/j.bej.2005.05.009
Zhou, J., Zhu, P., Hu, X., Lu, H., and Yu, Y. (2018). Improved secretory expression of lignocellulolytic enzymes in Kluyveromyces marxianus by promoter and signal sequence engineering. Biotechnol. Biofuels 11:235. doi: 10.1186/s13068-018-1232-7
Keywords: Kluyveromyces marxianus, Saccharomyces cerevisiae, fast growth, comparative analysis, ATP production, respiration chain, glucose transport
Citation: Yu Y, Mo W, Ren H, Yang X, Lu W, Luo T, Zeng J, Zhou J, Qi J and Lu H (2021) Comparative Genomic and Transcriptomic Analysis Reveals Specific Features of Gene Regulation in Kluyveromyces marxianus. Front. Microbiol. 12:598060. doi: 10.3389/fmicb.2021.598060
Received: 23 August 2020; Accepted: 10 February 2021;
Published: 26 February 2021.
Edited by:
Baolei Jia, Chung-Ang University, South KoreaReviewed by:
Graciela Liliana Garrote, National University of La Plata, ArgentinaCopyright © 2021 Yu, Mo, Ren, Yang, Lu, Luo, Zeng, Zhou, Qi and Lu. This is an open-access article distributed under the terms of the Creative Commons Attribution License (CC BY). The use, distribution or reproduction in other forums is permitted, provided the original author(s) and the copyright owner(s) are credited and that the original publication in this journal is cited, in accordance with accepted academic practice. No use, distribution or reproduction is permitted which does not comply with these terms.
*Correspondence: Hong Lu, aG9uZ2x2QGZ1ZGFuLmVkdS5jbg==; Ji Qi, cWlqQGZ1ZGFuLmVkdS5jbg==
†These authors have contributed equally to this work
Disclaimer: All claims expressed in this article are solely those of the authors and do not necessarily represent those of their affiliated organizations, or those of the publisher, the editors and the reviewers. Any product that may be evaluated in this article or claim that may be made by its manufacturer is not guaranteed or endorsed by the publisher.
Research integrity at Frontiers
Learn more about the work of our research integrity team to safeguard the quality of each article we publish.