
95% of researchers rate our articles as excellent or good
Learn more about the work of our research integrity team to safeguard the quality of each article we publish.
Find out more
ORIGINAL RESEARCH article
Front. Microbiol. , 21 December 2020
Sec. Aquatic Microbiology
Volume 11 - 2020 | https://doi.org/10.3389/fmicb.2020.560102
This article is part of the Research Topic Microbial Response to a Rapidly Changing Marine Environment: Global Warming and Ocean Acidification View all 10 articles
 Jae Joong Kang1
 Hyo Keun Jang1
 Jae-Hyun Lim2
 Dabin Lee1
 Jae Hyung Lee3
 Hyeonji Bae1
 Chang Hwa Lee1
 Chang-Keun Kang4
 Sang Heon Lee1*
The current phytoplankton community structure is expected to change, with small phytoplankton becoming dominant under ongoing warming conditions. To understand and evaluate the ecological roles of small phytoplankton in terms of food quantity and quality, the carbon uptake rates and intracellular biochemical compositions (i.e., carbohydrates, CHO; proteins, PRT; and lipids, LIP) of phytoplankton of different sizes were analyzed and compared in two different regions of the western East/Japan Sea (EJS): the Ulleung Basin (UB) and northwestern East/Japan Sea (NES). The average carbon uptake rate by the whole phytoplankton community in the UB (79.0 ± 12.2 mg C m–2 h–1) was approximately two times higher than that in the NES (40.7 ± 2.2 mg C m–2 h–1), although the average chlorophyll a (chl a) concentration was similar between the UB (31.0 ± 8.4 mg chl a m–2) and NES (28.4 ± 7.9 mg chl a m–2). The main reasons for the large difference in the carbon uptake rates are believed to be water temperature, which affects metabolic activity and growth rate, and the difference in euphotic depths. The contributions of small phytoplankton to the total carbon uptake rate were not significantly different between the regions studied. However, the rate of decrease in the total carbon uptake with increasing contributions from small phytoplankton was substantially higher in the UB than in the NES. This result suggests that compared to other regions in the EJS, the primary production in the UB could decrease rapidly under ongoing climate change. The calorific contents calculated based on biochemical compositions were similar between the small (1.01 ± 0.33 Kcal m–3) and large (1.14 ± 0.36 Kcal m–3) phytoplankton in the UB, whereas the biochemical contents were higher in the large phytoplankton (1.88 ± 0.54 Kcal m–3) than in the small phytoplankton (1.06 ± 0.18 Kcal m–3) in the NES. The calorific values per unit of chl a were higher for the large phytoplankton than for the small phytoplankton in both regions, which suggests that large phytoplankton could provide a more energy efficient food source to organisms in higher trophic levels in the western EJS.
Phytoplankton, as primary producers, play an important role in the food web as well as the biogeochemical cycling of aquatic ecosystems. Primary production by the phytoplankton community is an important factor in controlling the quantity of food sources for higher trophic level organisms and subsequently could affect the recruitment, biomass, and production of fishery resources (Whyte, 1987; Kleppel and Burkart, 1995; Kang et al., 2017). Intracellular biochemical compositions (i.e., carbohydrates, CHO; proteins, PRT; and lipids, LIP) of phytoplankton could provide helpful information related to their physiological status and the nutritional value of food available to grazers (Lee et al., 2020). According to previous studies, the different biochemical compositions of phytoplankton are closely connected with the nutritional status and survival strategies of zooplankton communities (Scott, 1980; Sterner et al., 1993; Hessen et al., 1997; Lindqvist and Lignell, 1997; Yun et al., 2015; Jo et al., 2017). The quantity and quality of food provided by phytoplankton can be largely affected by various environmental conditions, such as light conditions, major nutrient availability, and phytoplankton species composition (Morris et al., 1974; Mortensen et al., 1988; Kilham et al., 1997; Lee et al., 2017a). In particular, phytoplankton size structure is one of the major factors controlling the efficiency of the transfer of energy fixed by photosynthesis toward upper trophic levels or into the ocean’s interior (Legendre and Rassoulzadegan, 1996; Falkowski and Oliver, 2007; Finkel et al., 2010; Marañón et al., 2012). Marine ecosystems dominated by small phytoplankton have low carbon export rates due to slow sinking rates and intense microbial decomposition of organic matter, whereas high downward export fluxes and efficient transfer of food material (FM) through short food chains appear in systems dominated by large phytoplankton (Marañón et al., 2012). Several studies have reported that recent climate change could lead to an increase in the contribution of small phytoplankton to the total phytoplankton biomass; thus, determining the ecological role of small phytoplankton as primary producers providing basic food sources in marine ecosystems is important under ongoing warming conditions (Agawin et al., 2000; Morán et al., 2010; Hilligsøe et al., 2011; Mousing et al., 2014).
The East/Japan Sea (EJS), located in the northwestern Pacific Ocean, is one of the highly productive oceanic regions and is regarded as a “miniature ocean” due to its dynamic environmental conditions (i.e., upwelling, eddies, and fronts) (Kwak et al., 2014; Lee et al., 2017b). The EJS includes three deep (>2000 m) basins: the Ulleung Basin, Yamato Basin, and Japan Basin. Among these basins, the most productive region is the Ulleung Basin (UB), which is located in the southwestern part of the EJS (Kwak et al., 2014; Lee et al., 2017b). Recently, the EJS, including the UB, has experienced notable changes in its physicochemical properties, such as drastic increases in sea surface temperature and rapid ocean acidification (Kim et al., 2001; Kang et al., 2003). These changes could accompany variations in biological characteristics, especially in phytoplankton communities and, subsequently, upper trophic levels (Chiba et al., 2012; Kang et al., 2017; Lee et al., 2017b). Indeed, remarkable changes in the duration and intensity of the phytoplankton spring bloom in the EJS (Lee et al., 2014) and a significant decline in the annual primary production in the UB (Joo et al., 2014) were reported by previous studies. In addition, Lee et al. (2017b) found decreasing trends in primary productivity with increasing contributions from small phytoplankton to the total community in the northern EJS. However, few studies have focused on the role of small phytoplankton as primary producers and basic food sources in the EJS, especially in the UB, which is considered a biological hotspot in the EJS.
In this research, differences in primary production and biochemical compositions by phytoplankton size were analyzed at two regions in the western EJS (i.e., the UB and northwestern East/Japan Sea – NES) during the spring bloom season. The primary objective in this study was to evaluate the effect of contributions from small phytoplankton on the total primary production in the western EJS. The other objective was to compare the difference in the physiological status and energy efficiency of the small and large phytoplankton in the western EJS.
Sampling of the carbon uptake rates of phytoplankton in the western EJS was carried out at 10 stations (UB: five stations and NES: five stations) selected from a total of 34 stations sampled during a joint Korean-Russian cruise conducted from 05 to 15 April 2016 (Figure 1 and Table 1). Temperature, salinity and density data were obtained using a CTD tool (conductivity, temperature, and depth tool; SBE 911 plus, Seabird Electronics Inc., Bellevue, WA, United States). The mixed layer depth (MLD) at each station was defined as the depth with a difference of 0.125 σt from the surface value (Gardner et al., 1995; Kwak et al., 2014). Water samples were collected to assess nutrient levels (nitrate, NO3; ammonium, NH4; phosphate, PO4; and silicate, SiO4) from three light depths (100, 30, and 1% penetration of surface photosynthetically active radiation, PAR) using Niskin bottles (12 L) attached to a CTD/rosette sampler at all the stations at which productivity was sampled. After the seawater samples were filtered through Whatman GF/F filters, each sample was immediately transferred into high-density polyethylene bottles (50 mL) and kept frozen at –80°C until analysis. The samples were returned to the home laboratory at Pusan National University, South Korea, and then nutrient concentrations were determined using an automated nutrient analyzer (Auto analyzer, Quaatro, Germany).
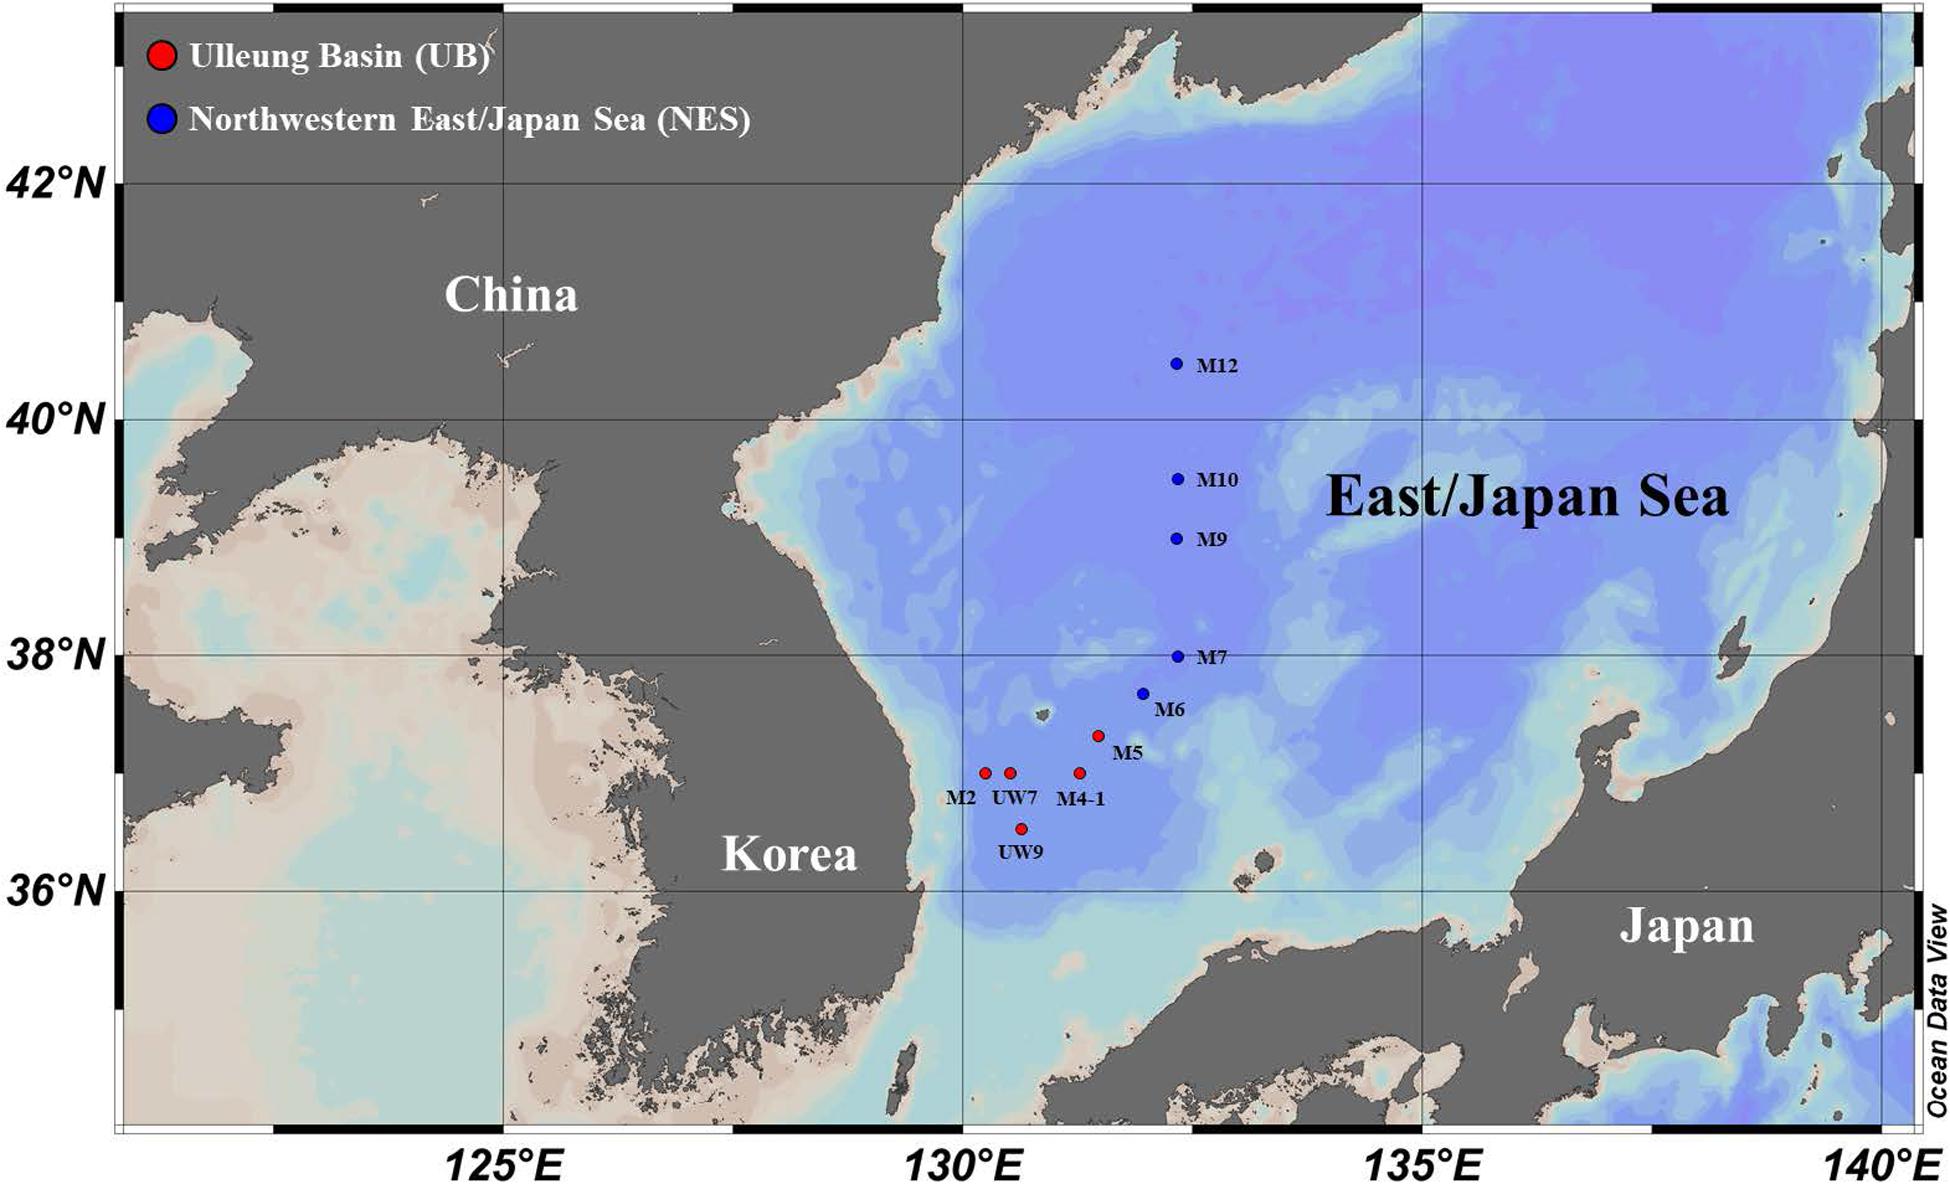
Figure 1. Locations of sampling stations for primary productivity and biochemical composition measurements in the western EJS in 2016.
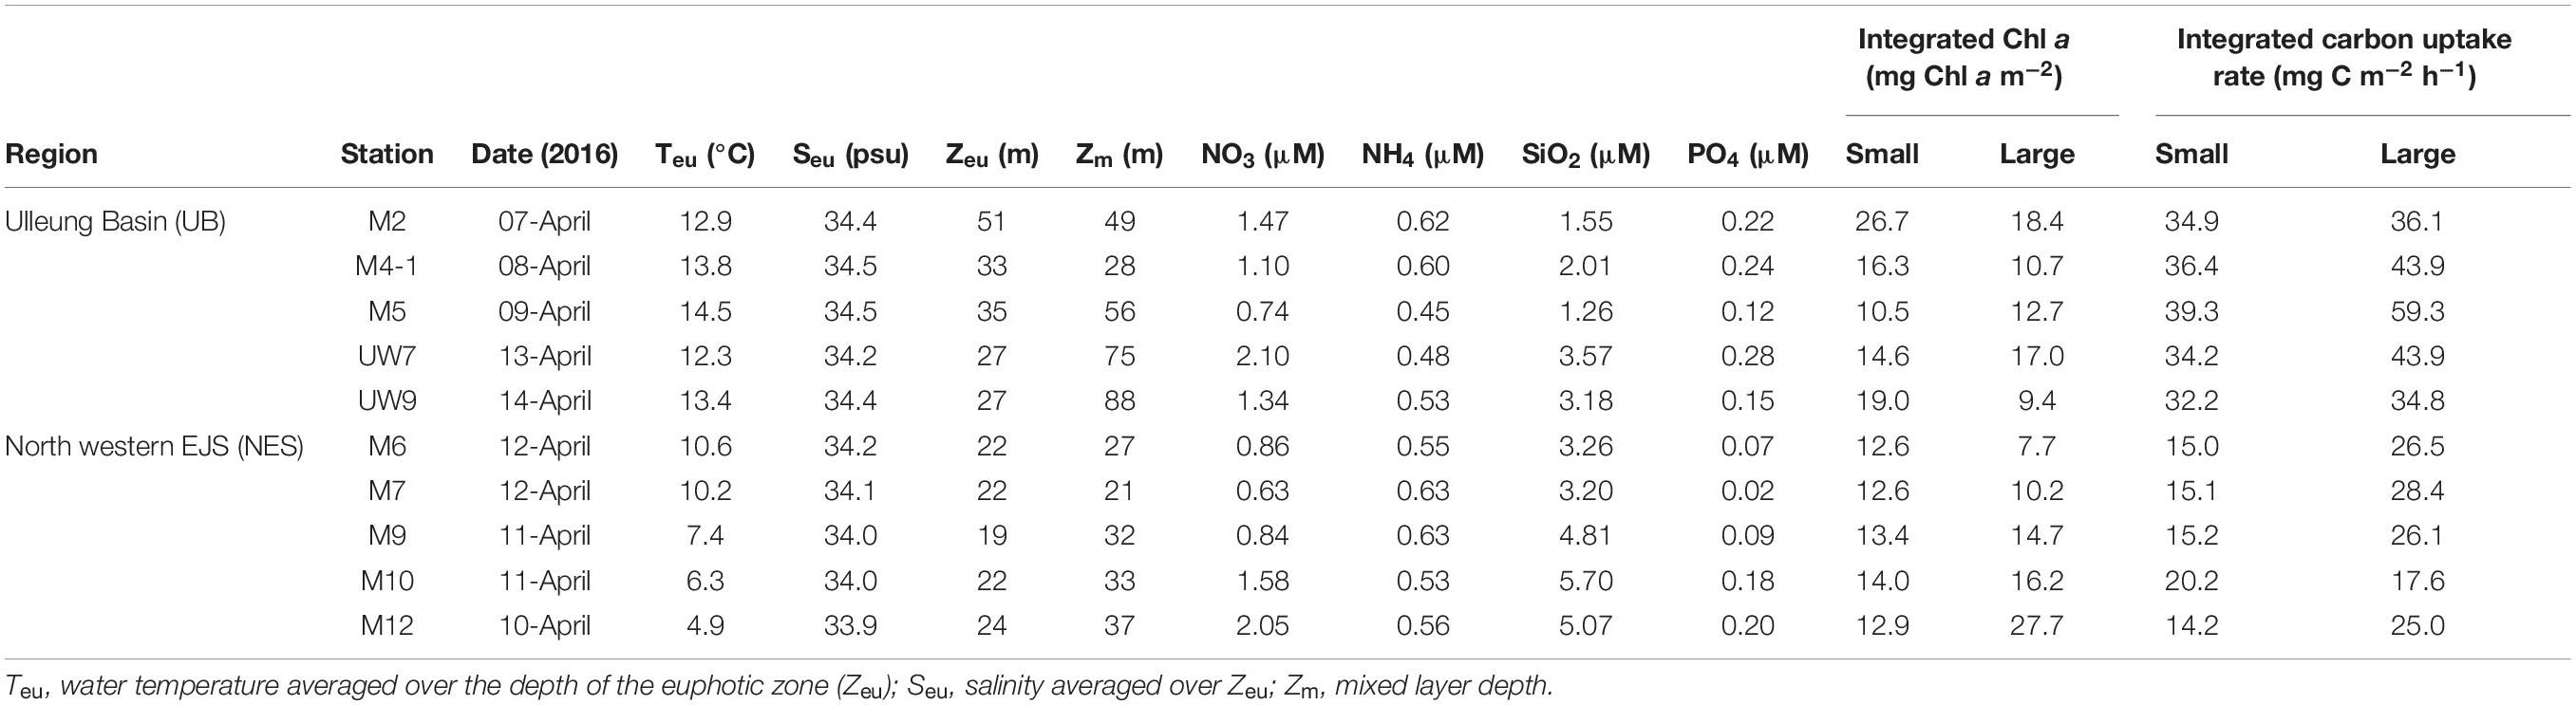
Table 1. Environmental variables, euphotic depth-integral chl a concentration and carbon uptake rates in the western EJS during the 2016 cruise.
Seawater samples for small (0.7–2.0 μm) and large (>2.0 μm) size-fractionated chlorophyll a (chl a) molecules were obtained from the three depths at which light was measured (i.e., 100, 30, and 1% PAR penetration). To estimate the size composition of the phytoplankton assemblages, the seawater samples were passed sequentially through a 2 μm (large chl a) Nuclepore membrane filter (47 mm) and then a 0.7 μm (small chl a) Whatman GF/F paper (47 mm). The filters were frozen immediately for further analysis in the laboratory. After extraction in 90% acetone, the concentrations of the size-fractionated chl a were determined with a previously calibrated fluorometer (Turner Designs model 10-AU) based on methods described by Kim et al. (2015).
The carbon uptake rates of small (0.7–2.0 μm) and large (>2.0 μm) phytoplankton in the western EJS were measured with a 13C stable isotope technique. Seawater samples for carbon uptake rate measurement were obtained from six light depths (100, 50, 30, 12, 5, and 1%) at the selected productivity stations where incubation was available on deck under natural light conditions. A water sample from each of the different light depths was transferred into a polycarbonate incubation bottle (1 L) with a screen filter that created conditions corresponding to each light depth. A labeled carbon (NaH13CO3) solution, which corresponded to approximately 10% of the ambient concentration, was injected into all the incubation bottles to determine the carbon uptake rates of the phytoplankton (Dugdale and Goering, 1967; Hama et al., 1983; Lee et al., 2007, 2017b). The bottles were cultured in an acrylic incubator cooled by circulating surface seawater on deck for 4–5 h. To estimate the carbon uptake rate of the large phytoplankton, which was calculated as the difference in the carbon uptake rates of the total and small phytoplankton, the seawater samples used to assess the total phytoplankton carbon uptake rate from each incubation bottle were filtered through 25 mm GF/F filters after incubation. To assess the carbon uptake rate of the small phytoplankton, the seawater samples were first passed through a 2 μm Nuclepore filter (47 mm) to remove the large cells, and then the filtrate was passed through a 25 mm GF/F filter. The filters were immediately stored in a deep freezer for later mass spectrometer analysis. At the laboratory, acid fuming was applied overnight to all the samples for carbonate removal. The carbon stable isotope (13C) of the treated samples was measured using a Finnigan Delta + XL mass spectrometer at the stable isotope laboratory of the University of Alaska Fairbanks, United States. The carbon uptake rate was calculated following methods described by Hama et al. (1983).
To determine the biochemical compositions (carbohydrates, CHO; proteins, PRT; and lipids, LIP) of the phytoplankton, seawater samples were collected from three light depths (100, 30, and 1%) at seven stations selected from the 10 productivity stations (UB: three stations and NES: four stations). Each sample for the analysis of the total phytoplankton biochemical composition was filtered through 0.7 μm Whatman GF/F filters (47 mm). To evaluate the biochemical compositions of the small phytoplankton, additional water samples were passed sequentially through 2 μm Nucleopore membrane filters (47 mm) and 0.7 μm Whatman GF/F filters (47 mm). The biochemical compositions of the large phytoplankton were estimated as the difference in the compositions between the total and small phytoplankton. The filters were frozen immediately and preserved for further analysis at the laboratory. Each biochemical compound (CHO, PRT, and LIP) was analyzed at the laboratory based on the methods of Lowry et al. (1951); Dubois et al. (1956), and Bligh and Dyer (1959), respectively. The detailed methods used for analyzing each biochemical compound are described in Bhavya et al. (2019). FM represented the sum of the three biochemical components (CHO, PRT, and LIP), and calorific contents were calculated following Winberg (1971).
The hydrographic conditions were different between the UB and NES during the spring season in 2016. The MLD (derived from the density difference) at the UB stations had a relatively wide range, from 28 to 88 m (mean ± SD = 59.2 m ± 23.3 m), whereas the MLD at the NES stations ranged from 21 to 37 m, with a mean of 30.0 m (SD = ±6.2 m) (Figure 2 and Table 1). The MLDs at all the stations in the UB [except for station M4-1 (28 m)] were deeper (t-test, p < 0.05) than the those in the NES (Figure 2 and Table 1). The euphotic depths (i.e., the depth receiving 1% of the surface PAR) were also relatively deeper (t-test, p < 0.05) in the UB stations (range = 27–51 m; mean ± SD = 34.6 ± 9.8 m) than in the NES stations (range = 19–24 m; mean ± SD = 21.8 ± 1.8 m) (Table 1). Overall, the MLD was similar to the euphotic depth or deeper than the euphotic depth in both regions (Table 1), which indicates that the euphotic water columns were well mixed during our observation period (Figure 2). The water temperatures averaged over the depths of the euphotic zone in the UB ranged from 12.3 to 14.5°C (13.6 ± 0.9°C), whereas the average temperature within the euphotic zone in the NES ranged from 4.9 to 10.6°C (7.9 ± 2.5°C) (Table 1). The salinity ranged from 34.2 to 34.5 psu in the UB (34.4 ± 0.1 psu) and 33.9 to 34.2 psu in the NES (34.0 ± 0.1 psu) (Table 1). Temperature and salinity were higher (t-test, p < 0.01) in the UB than in the NES during the study period (Table 1).
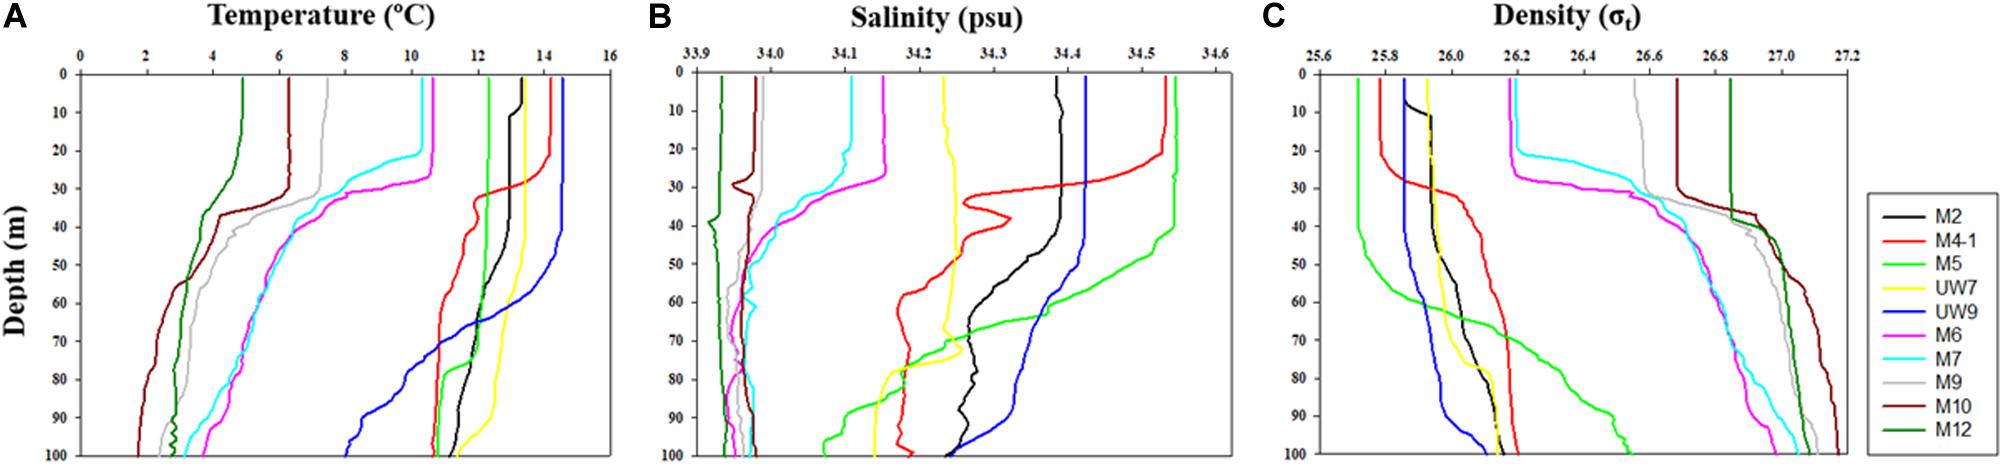
Figure 2. Vertical structures of (A) temperature, (B) salinity, and (C) density at all the experimental stations in the western EJS in 2016.
No noticeable differences in any of the major nutrient (NH4, NO3, PO4, and SiO2) concentrations were found at the different light depths (100, 30, and 1%) (one-way ANOVA, p > 0.05) in either region (Figure 3) since the water column within the euphotic zone was well mixed. The mean concentrations of all the major nutrients (NH4, NO3, and PO4) except for SiO2 averaged over the euphotic zone were not significantly different (t-test, p > 0.05) between the UB (NH4 = 0.54 ± 0.08 μM; NO3 = 1.35 ± 0.50 μM; PO4 = 0.20 ± 0.07 μM) and the NES (NH4 = 0.58 ± 0.05 μM; NO3 = 1.19 ± 0.60 μM; PO4 = 0.11 ± 0.07 μM) (Table 1). In contrast, the averaged SiO2 concentration was lower (t-test, p < 0.05) in the UB (mean ± SD = 2.31 ± 1.01 μM) than in the NES (mean ± SD = 4.41 ± 1.37 μM) (Table 1).
Figure 3. Concentrations of (A) ammonium (NH4), (B) nitrate (NO3), (C) phosphate (PO4), and (D) silicate (SiO4) within euphotic depth (100, 30, and 1% light depth) in 2016.
No distinct vertical differences in the concentrations of the total (sum of the small and large chl a concentrations), small or large chl a molecules were found within the euphotic depth at each station (one-way ANOVA, p > 0.05; Figures 4A,B) in this study. The total chl a concentration integrated from the surface to a depth with 1% light penetration in the UB ranged from 23.2 to 45.1 mg chl a m–2, with an average of 31.0 mg chl a m–2 (SD = ± 8.4 mg chl a m–2), and that in the NES ranged from 20.3 to 40.7 mg chl a m–2, with an average of 28.4 mg chl a m–2 (SD = ± 7.9 mg chl a m–2) (Figure 5A and Table 1). In the UB region, the average values of the concentrations of chl a from small and large phytoplankton integrated over depths with light penetration ranging from 100 to 1% were 17.4 ± 6.0 mg chl a m–2 (range: 10.5–26.7 mg chl a m–2) and 13.6 ± 3.9 mg chl a m–2 (range: 9.4–18.4 mg chl a m–2), which contributed 55.6 ± 9.5% and 44.4 ± 9.5% to the total chl a concentration, respectively (Figure 5A and Table 1). In contrast, the average chl a concentrations of the small and large phytoplankton over the same depth in the NES were 13.1 ± 0.6 mg chl a m–2 (range: 12.6–14.0 mg chl a m–2) and 15.3 ± 7.7 mg chl a m–2 (range: 7.7–27.7 mg chl a m–2), which contributed 48.6 ± 11.3% and 51.4 ± 11.3% to the total chl a concentration, respectively (Figure 5A and Table 1).
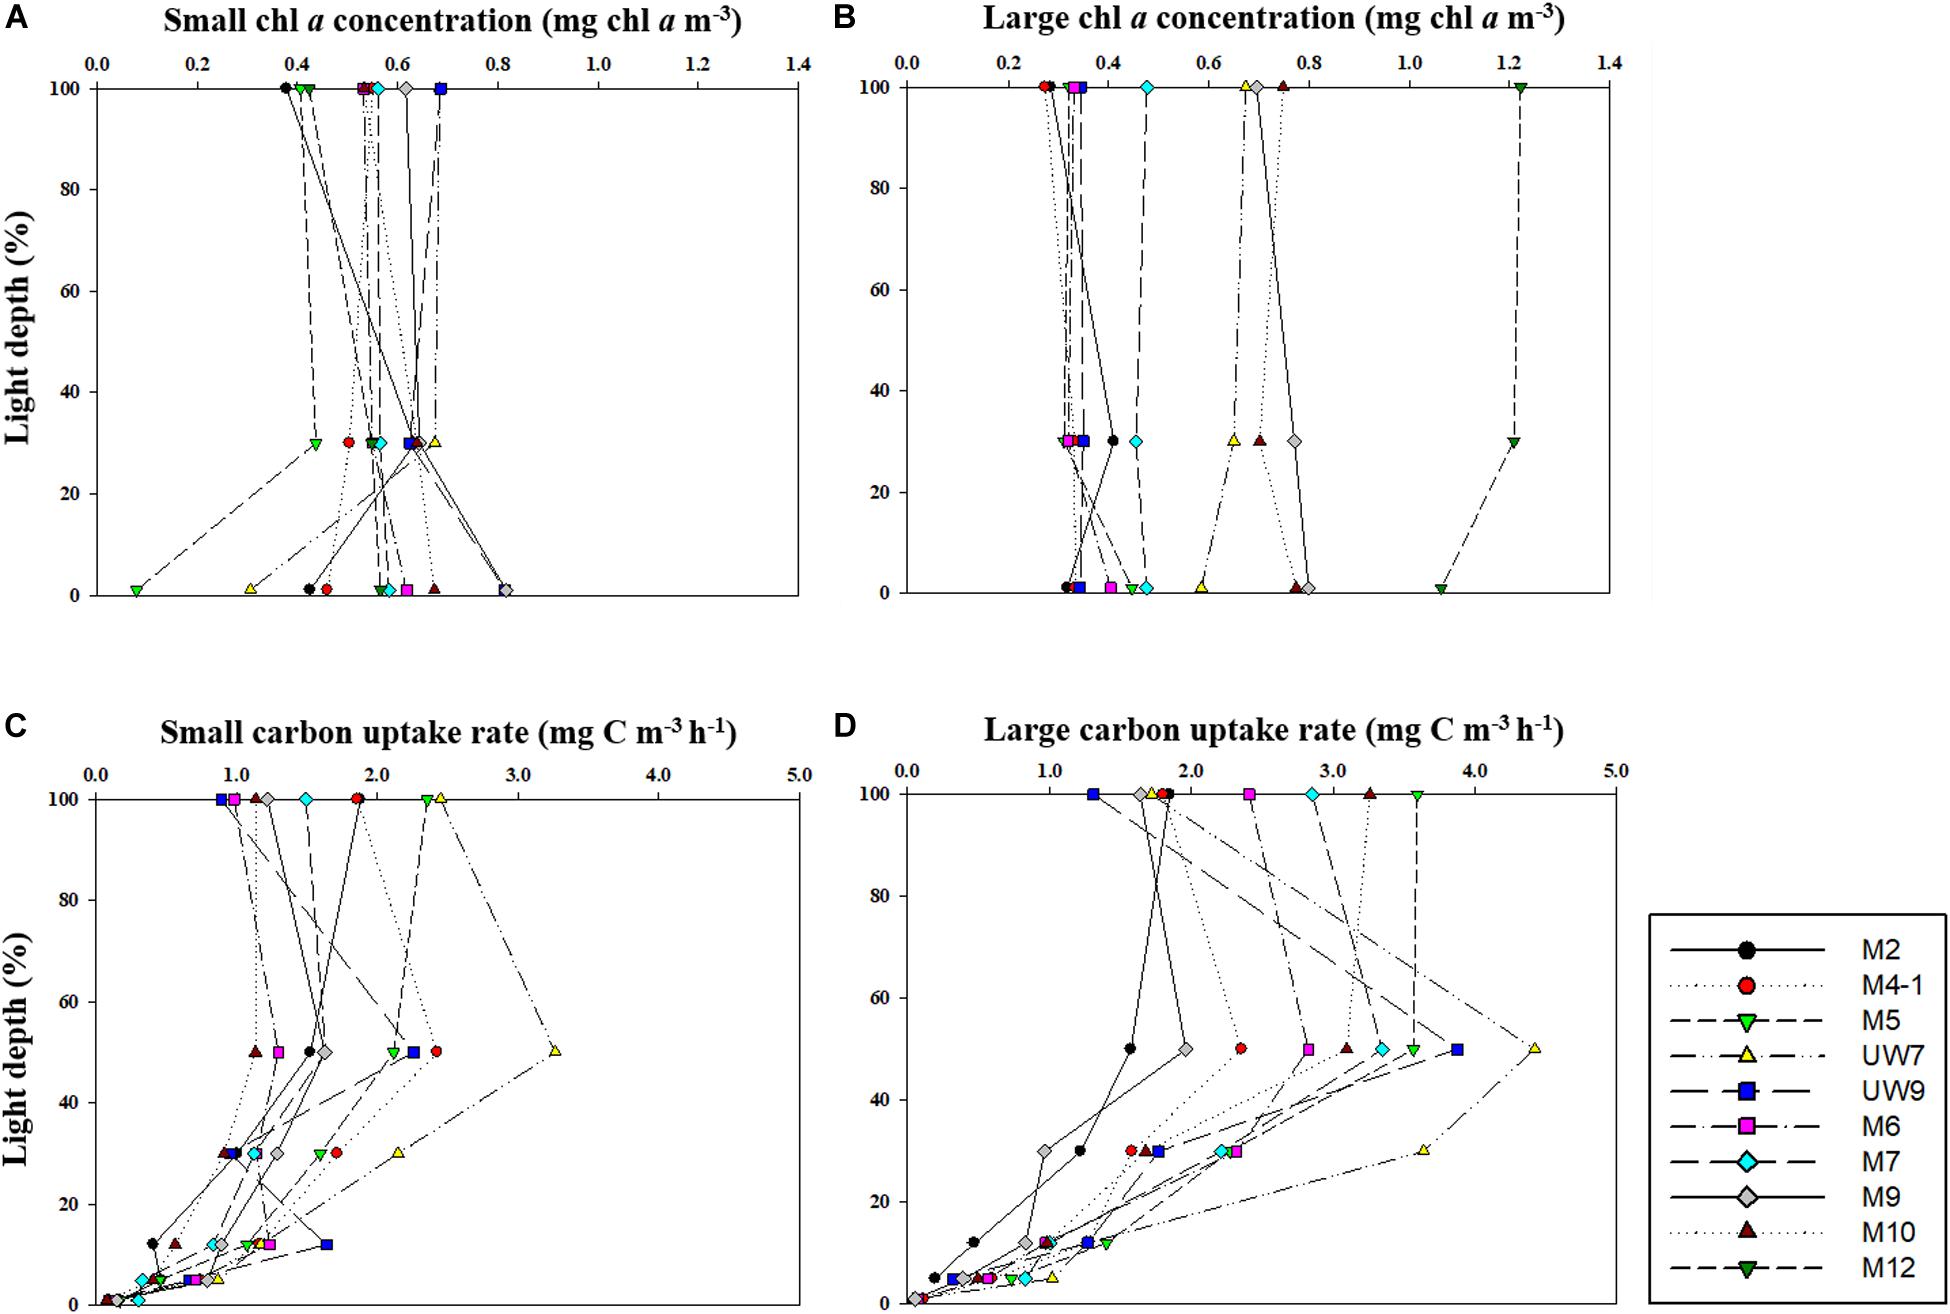
Figure 4. Vertical distributions of chl a concentration for (A) small and (B) large size phytoplankton and carbon uptake rates for (C) small and (D) large size phytoplankton at different light depths in 2016.
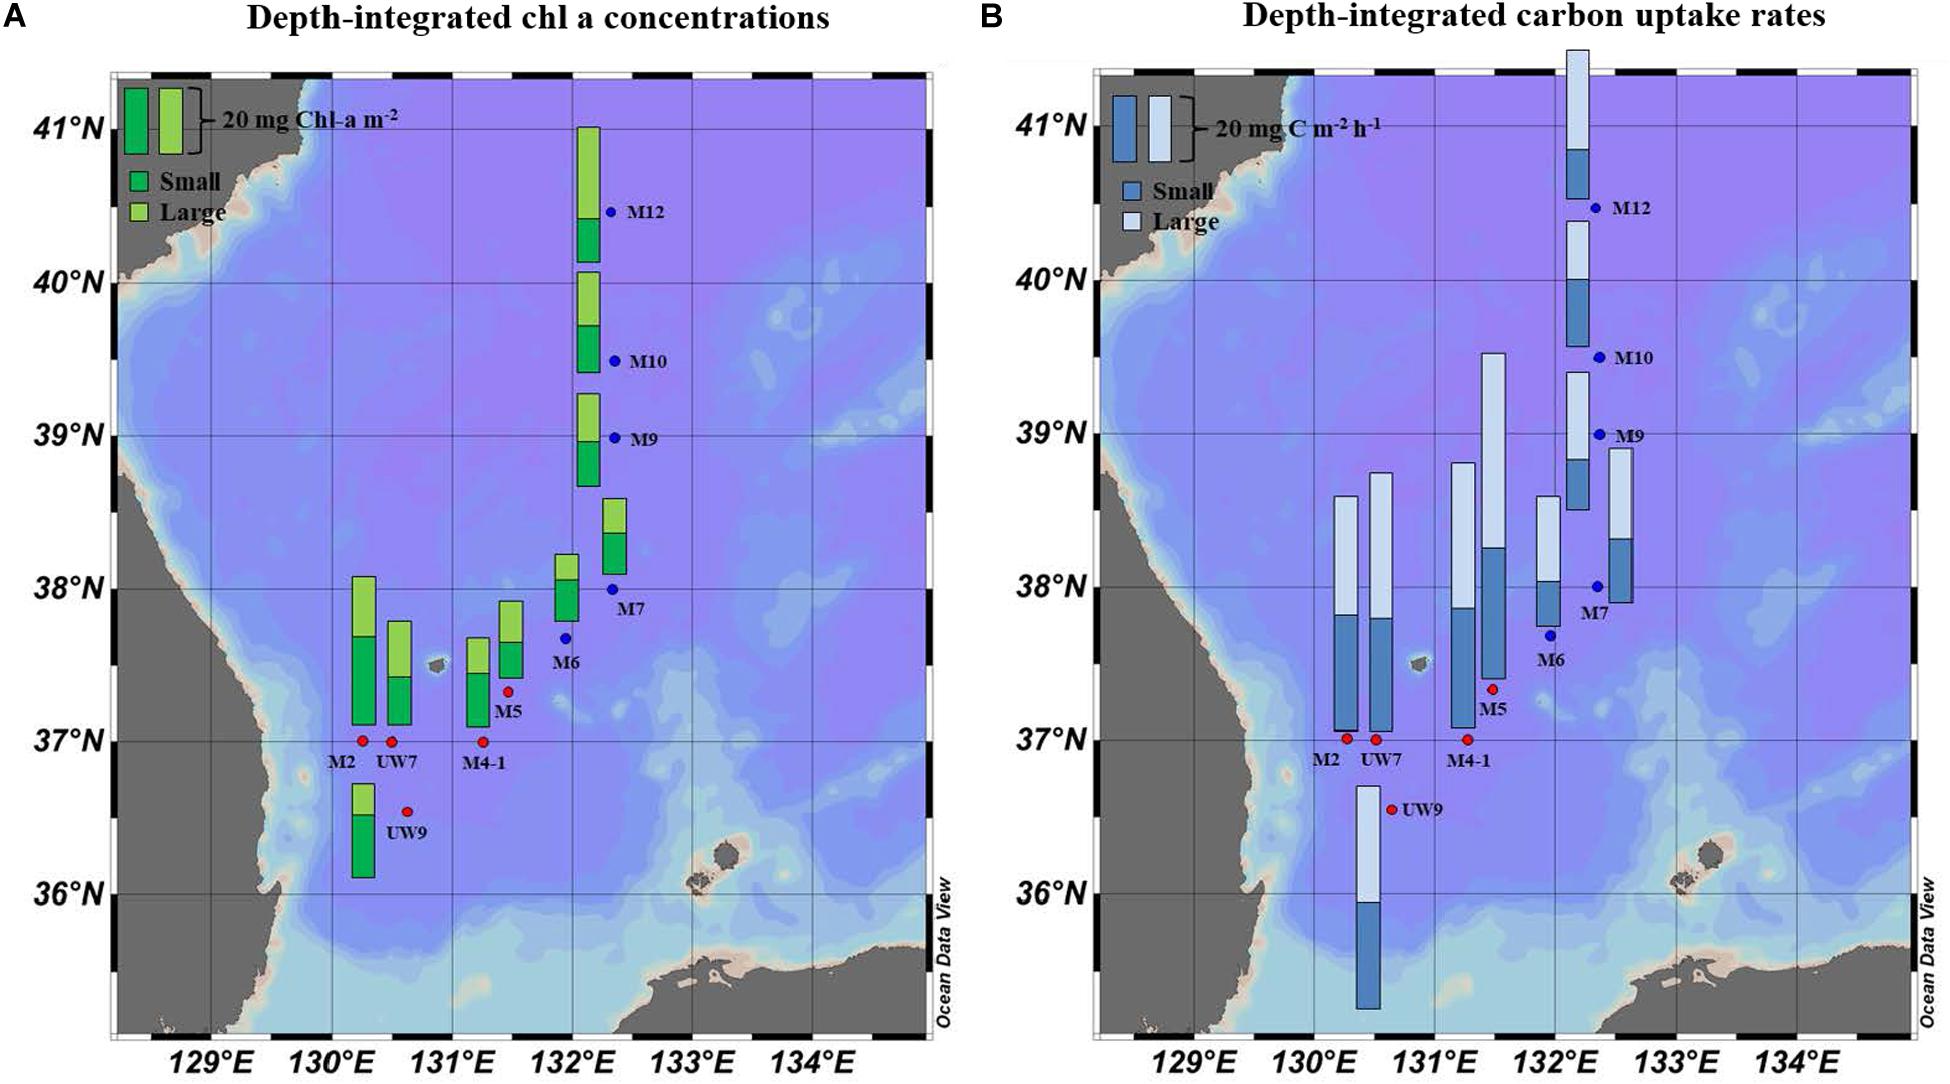
Figure 5. Spatial distributions of (A) chl a concentration and (B) hourly carbon uptake rates for small and large size phytoplankton integrated within the euphotic depths from 100 to 1% light depth at the productivity stations in 2016.
The hourly carbon uptake rates of the total, small and large phytoplankton communities within the euphotic water column differed at each light depth in the UB and the NES (Figures 4C,D). In general, the maximum hourly carbon uptake rates of the phytoplankton were observed in the surface layer (within a water depth of 10 m), which corresponded to a light depth of 50% (Figures 4C,D). The hourly carbon uptake rates of the total phytoplankton community integrated from the surface to the 1% light depth were approximately two times higher in the UB than in the NES during the observation period (Table 1). The range of the total carbon uptake rates from the surface to the 1% light depth was from 67.0 to 98.7 mg C m–2 h–1, with a mean of 79.0 mg C m–2 h–1 (SD = ± 12.2 mg C m–2 h–1) in the UB, whereas the range of the total hourly carbon uptake rates over the same depth in the NES was from 37.7 to 43.6 mg C m–2 h–1, with a mean of 40.7 mg C m–2 h–1 (SD = ± 2.2 mg C m–2 h–1) during the study period (Figure 5B and Table 1). The hourly carbon uptake rates of the small and large phytoplankton communities integrated from the surface to the 1% light depth in the UB ranged from 32.2 to 39.3 mg C m–2 h–1 (35.4 ± 2.7 mg C m–2 h–1) and from 34.8 to 59.3 mg C m–2 h–1 (43.6 ± 9.8 mg C m–2 h–1), respectively (Figure 6 and Table 1). In contrast, the integrated carbon uptake rates by the small and large phytoplankton communities in the NES ranged from 14.2 to 20.2 (15.9 ± 2.4 mg C m–2 h–1) and from 17.6 to 28.4 (24.7 ± 4.2 mg C m–2 h–1), respectively (Figure 6 and Table 1). The average carbon uptake rates (t-test, p < 0.05) of the small and large phytoplankton communities were higher in the UB than in the NES during our observation period (Figure 6 and Table 1). The contributions of small phytoplankton in the UB to the total carbon uptake rate ranged from 39.9 to 49.2%, with an average of 45.2% (SD = ± 3.7%), whereas those of large phytoplankton in the UB ranged from 50.8 to 60.1%, with an average of 54.8% (SD = ± 3.7%). In the NES, the small phytoplankton contributed 39.5 ± 7.8% (range: 34.8–53.4%) to the total phytoplankton carbon uptake rate, while the large phytoplankton contributed 60.5 ± 7.8% (range: 46.6–65.2%) (Figure 5B and Table 1).
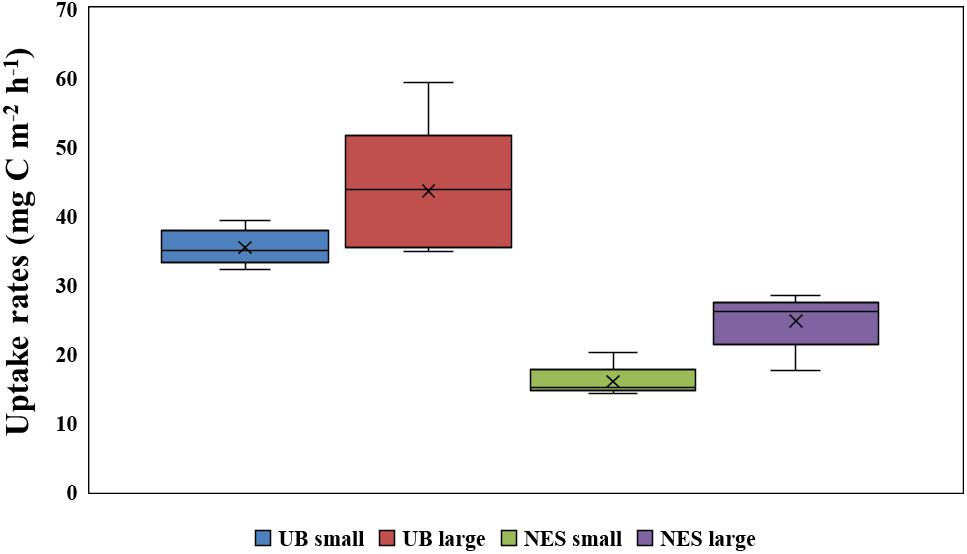
Figure 6. Comparison of depth-integral carbon uptake rates for small and large size phytoplankton in the UB and NES.
Principal component analysis (PCA; SPSS 12.0) was conducted to evaluate the relationship between the environmental conditions and carbon uptake rates of the phytoplankton. The first two ordination axes of the PCA explained 79.8% of the carbon uptake rates of the total, small and large phytoplankton communities relative to the environmental conditions during our research period (Figure 7). Water temperature, salinity, and euphotic depth were positively correlated with the carbon uptake rates of the total, small, and large phytoplankton communities (Figure 7). The effect of nutrients on the carbon uptake rates of the entire phytoplankton group was not significant during the study period (Figure 7).
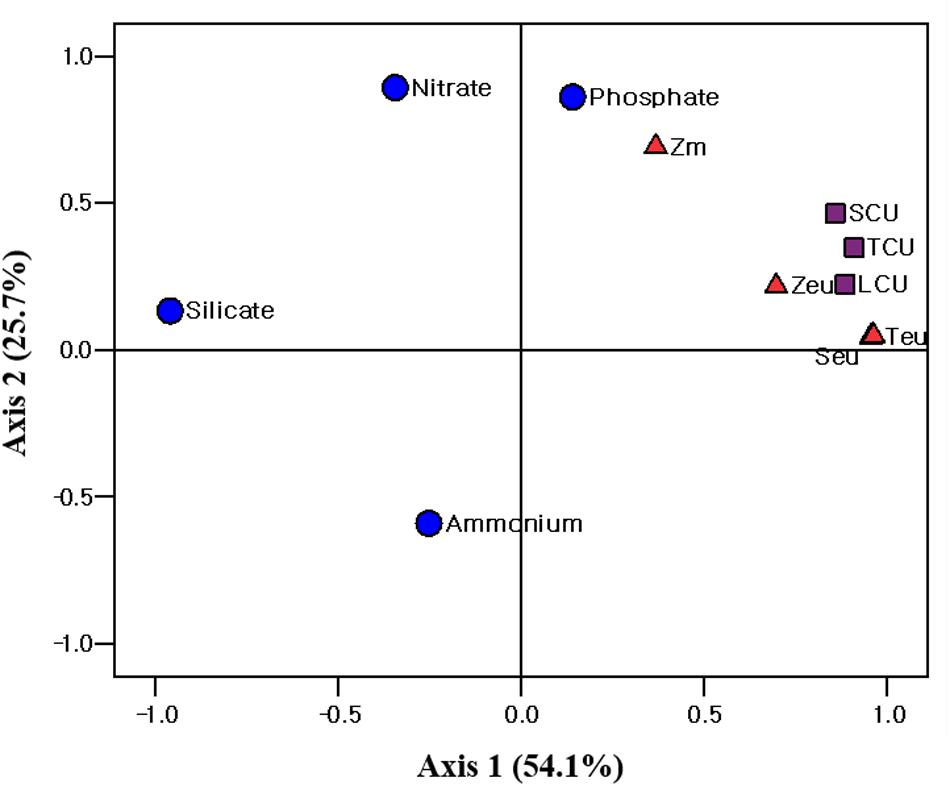
Figure 7. Principle component analysis (PCA) ordination plots of axes 1 and 2 showing carbon uptake rate of different size phytoplankton in relation to environmental variables in the western EJS during the 2016 cruise. Teu, water temperature averaged over the depth of the euphotic zone (Zeu); Seu, salinity averaged over Zeu; Zm, mixed layer depth; TCU, total carbon uptake rate; SCU, small carbon uptake rate; LCU, large carbon uptake rate.
The concentrations of the biochemical components (CHO, PRT, and LIP) in both regions are summarized in Table 2. The relative abundances of the biochemical components in the small and large phytoplankton communities in the UB and NES were averaged from the surface to 1% light depth to detect their spatial variation (Figure 8). In the UB, the average compositions of CHO, PRT, and LIP in the small phytoplankton were 52.7 ± 7.9% (range: 41.8–63.0%), 9.2 ± 4.8% (range: 2.3–17.1%), and 38.1 ± 4.3% (range: 33.0–44.2%), respectively, whereas those of the large phytoplankton were 33.4 ± 16.9% (range: 8.8–54.5%), 30.8 ± 10.5% (range: 19.4–49.4%), and 35.8 ± 19.5% (range: 17.8–71.8%) (Figure 8 and Table 2), respectively. In the NES, the CHO, PRT, and LIP contents in the small phytoplankton comprised 42.8 ± 7.6% (range: 28.3–55.5%), 17.5 ± 4.0% (range: 10.7–22.8%), and 39.7 ± 6.5% (range: 31.1–49.4%), respectively, while the average proportions of three biochemical components (CHO, PRT, and LIP) within the large phytoplankton were 28.2 ± 16.3% (range: 6.1–53.3%), 19.6 ± 7.3% (range: 4.3–28.0%), and 52.2 ± 18.9% (range: 18.7–74.3%), respectively (Figure 8 and Table 2).
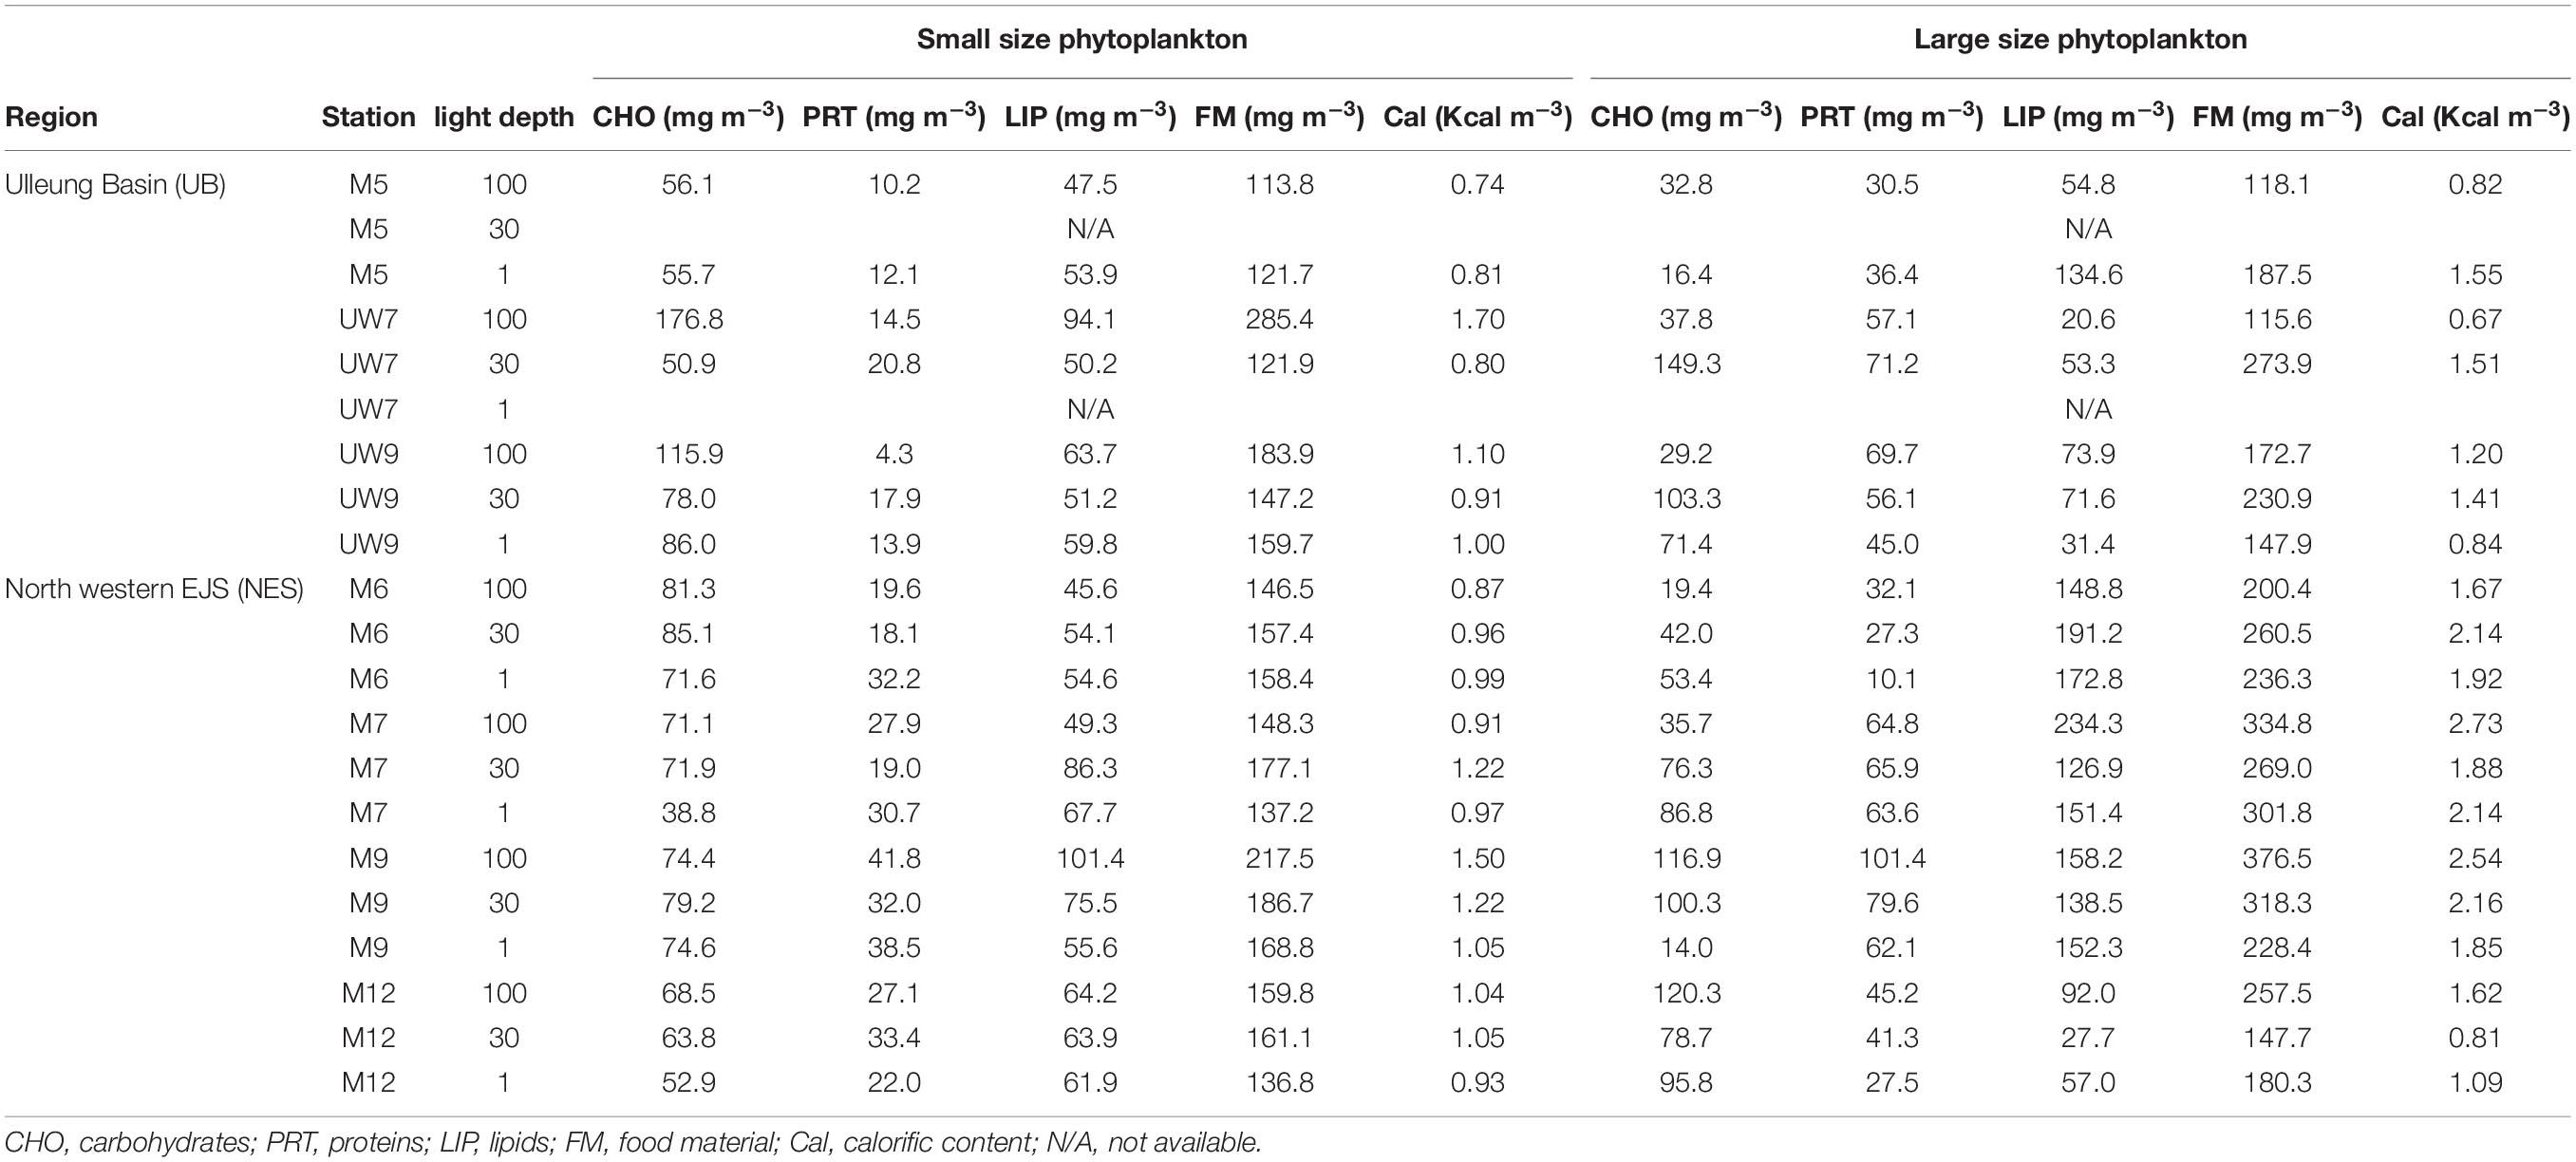
Table 2. Concentrations of biochemical compositions, food materials, and calorific contents in the western EJS during the 2016 cruise.
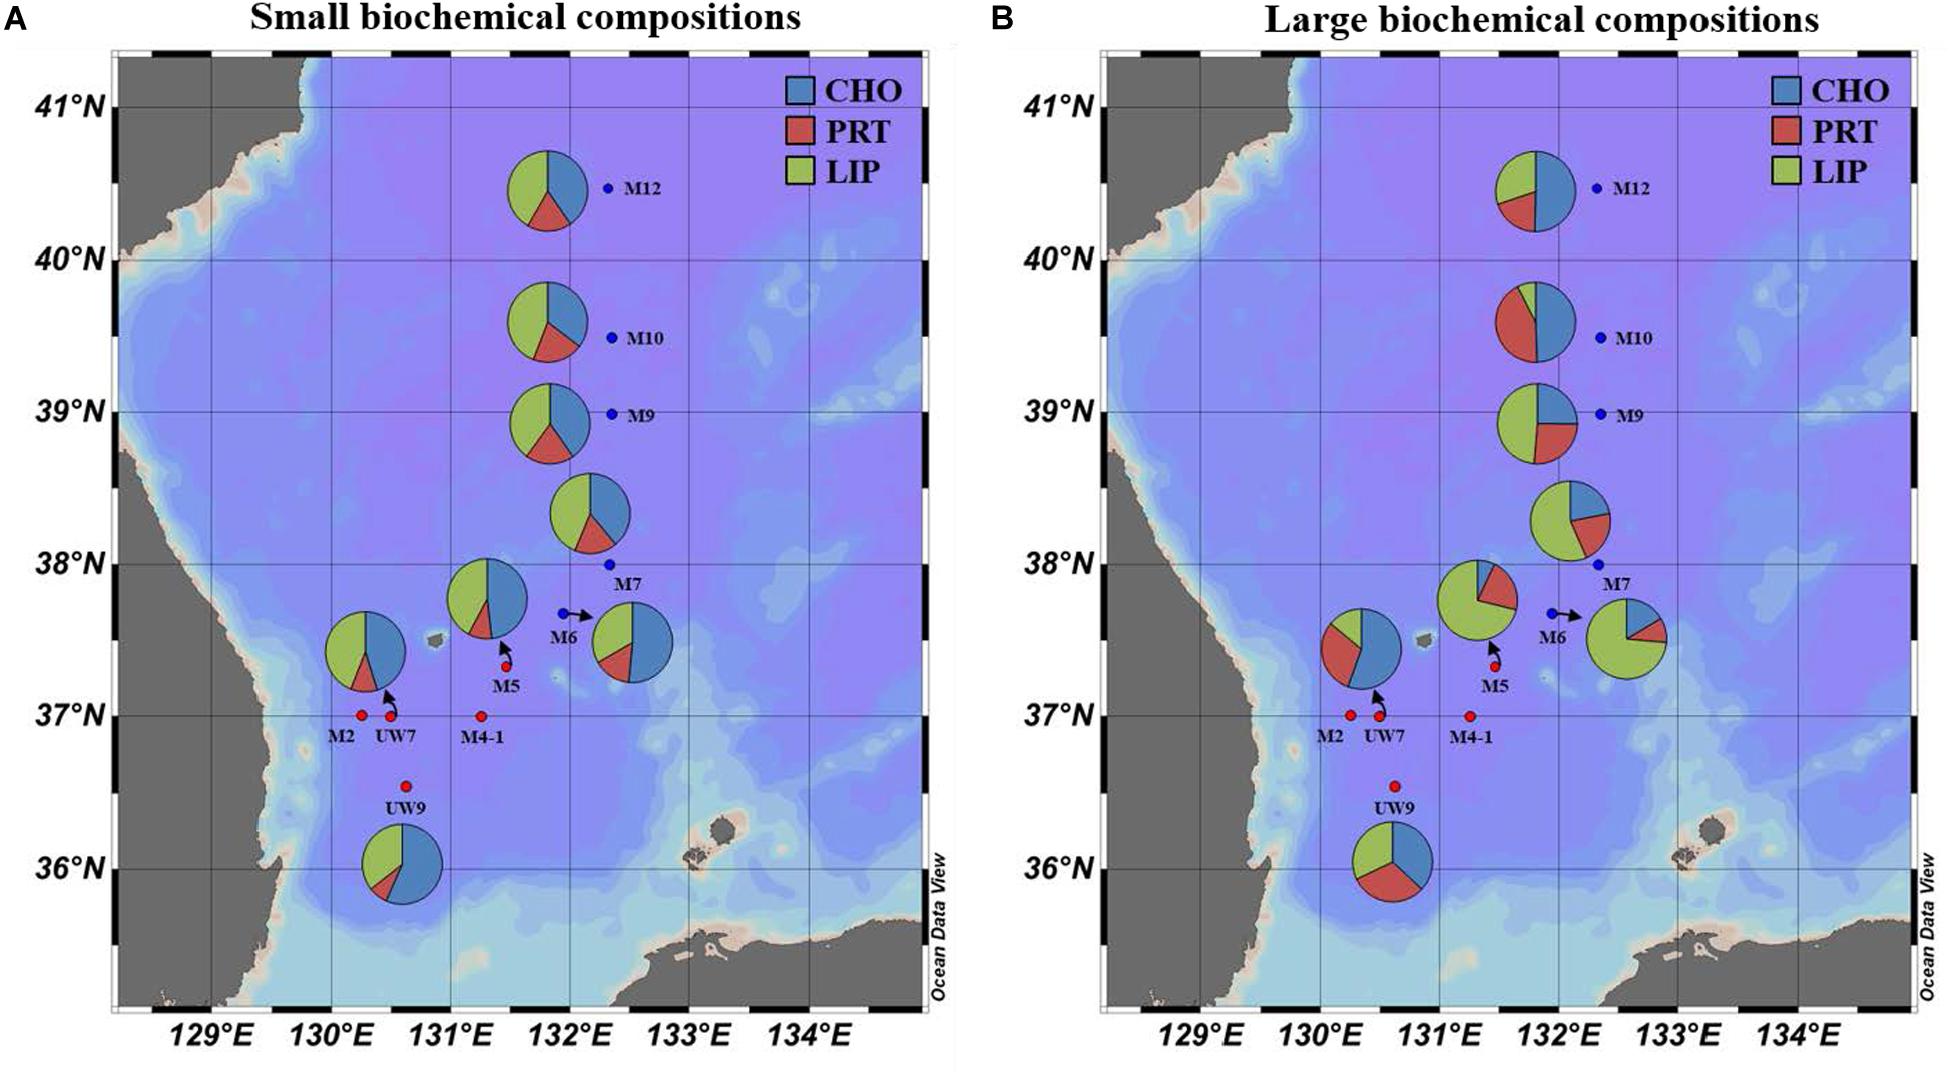
Figure 8. Spatial distributions of biochemical compositions (carbohydrates, proteins, and lipids) for (A) small and (B) large size phytoplankton in the western EJS in 2016. CHO, carbohydrates; PRT, proteins; LIP, lipids.
The calorific contents averaged from the euphotic depths in the UB ranged from 0.74 to 1.70 Kcal m–3, with a mean of 1.01 ± 0.33 Kcal m–3, for the small phytoplankton and from 0.67 to 1.55 Kcal m–3, with a mean of 1.14 ± 0.36 Kcal m–3, for the large phytoplankton (Table 2). The average calorific contents in the NES ranged from 0.87 to 1.50 Kcal m–3 (1.06 ± 0.18 Kcal m–3) for the small phytoplankton and from 0.81 to 2.73 Kcal m–3 (1.88 ± 0.54 Kcal m–3) for the large phytoplankton (Table 2).
The average total chl a concentrations in both regions were similar; the phytoplankton community compositions differed slightly by size between the UB and the NES (Figure 5A and Table 1), although no significant difference was found. Based on the size-fractionated chl a concentration, small phytoplankton (55.6 ± 9.6%) had a relatively higher contribution to the total biomass in the UB, whereas the contribution of large phytoplankton (51.4 ± 11.3%) was slightly higher than that of small phytoplankton in the NES (Table 1).
Noticeable patterns in the spatial distributions of the chl a concentrations of small and large phytoplankton integrated over the depths sampled were not found in the UB, whereas the integrated chl a concentration of the large phytoplankton in the NES increased with latitude, with the lowest value at M6 (7.7 mg chl a m–2) and the highest value at M12 (27.7 mg chl a m–2) (Figure 5A and Table 1). The spatial variations in the concentration of chl a from the large phytoplankton integrated from the surface to a light depth of 1% in the NES were mostly related to temperature (Pearson’s r = –0.93, p < 0.05) and nitrate concentration (Pearson’s r = 0.90, p < 0.05) during the study period. Phytoplankton community size structure is sensitive to environmental conditions. According to previous studies, the size compositions of phytoplankton assemblages in the ocean can be affected by water temperature (Morán et al., 2010; Mousing et al., 2014) and nutrient availability (Agawin et al., 2000; Finkel et al., 2005, 2007; Marañón et al., 2012). Increasing water temperature increases the metabolic rate of phytoplankton (Gillooly et al., 2001), which increases resource requirements and, therefore, competition for nutrients (Mousing et al., 2014). In addition, warming temperatures increase the development of water stratification, resulting in nutrient depletion in the euphotic layer (Calvo-Díaz and Morán, 2006; Marañón et al., 2012). In other words, both the increasing cellular nutrient demands due to high metabolic rates as a function of temperature and a reduction in upward nutrient concentration in the euphotic layer due to water stratification can be expected to cause increasing resource competition and a smaller community mean cell size (Mousing et al., 2014). Among the major inorganic nutrients in the ocean, source of nitrogen (e.g., nitrate and ammonium) are the main factors controlling phytoplankton cell size (Stolte et al., 1994; Stolte and Riegman, 1995). In general, large phytoplankton tend to prefer nitrate, which is abundant in upwelling areas, in coastal areas in early spring, and on continental shelves, whereas ammonium is favored by small phytoplankton (Dauchez et al., 1996; Stolte and Riegman, 1995). Indeed, relatively low temperatures and high nitrate concentrations were generally observed in the higher latitudes of the NES during our research period (Table 1).
Overall, the average total chl a concentrations in the UB (31.0 mg chl a m–2) and NES (28.4 mg chl a m–2) during the spring season of 2016 were lower than those reported previously in the EJS (Kang et al., 2004; Lee et al., 2017b). During the spring bloom in the UB during April 2001, a high chl a concentration (43.8 mg chl a m–2) was observed (Kang et al., 2004). During this period, autotrophic nanoflagellates and picoeukaryotes were the main components of the total chl a (Kang et al., 2004). This finding was similar to our results, which showed that the contribution of small phytoplankton to the total chl a was high (55.6%) in the UB. In the northern EJS, including the NES region in spring 2015, Lee et al. (2017b) reported significantly higher chl a concentrations (84.6 mg chl a m–2), which were predominantly (47.7–72.5%) due to large phytoplankton. In contrast, the chl a concentration (28.8 mg chl a m–2) in the shelf region of the southern East China Sea (Chen, 2000) is similar to those in the UB and NES during our research period, and the size compositions (small: 57.4% and large: 42.6%) in the shelf region are close to those in the UB in this study. Currently experiencing rapid environmental changes, the northern Chukchi Sea in the Arctic Ocean also had similar chl a concentrations (30.5 mg chl a m–2) and size compositions (small: 55.1% and large: 44.9%) (Yun et al., 2015) as those found in this study. The relatively high contributions of small phytoplankton to the total community in the shelf regions of the southern East China Sea and the northern Chukchi Sea are known to result from depleted nitrogen sources, especially nitrate (Chen, 2000; Yun et al., 2015).
Based on the chl a concentration, the total phytoplankton biomass was not significantly different between the UB (31.0 ± 8.4 mg chl a m–2) and NES (28.4 ± 7.9 mg chl a m–2) during our research period. However, the hourly carbon uptake rate of the total phytoplankton community in the UB (79.0 ± 12.2 mg C m–2 h–1) was approximately two times higher (t-test, p < 0.01) than that in the NES (40.7 ± 2.2 mg C m–2 h–1) (Figure 6 and Table 1). Primary production can be affected by various physicochemical and biological factors, such as temperature, light availability, ambient nutrient concentrations, phytoplankton community structure, and grazing pressure (Kwak et al., 2014; Lee et al., 2020). Based on the PCA, temperature and euphotic depth were major controlling factors for the total and size-fractionated carbon uptake rates in both regions during the observation period (Figure 7). Lewandowska et al. (2012) found strong relationships between primary production by phytoplankton and temperature. Primary production had positive correlations with water temperature when nutrient concentrations and light availability were not limiting, whereas increased water temperature under unsaturated light conditions, which limits the carbon incorporation process, led to decreased primary production due to the enhancement of grazing activity and community respiration (Lewandowska et al., 2012). Other studies have also reported similar results on the positive effects of temperature on the photosynthesis (Andersson et al., 1994) and growth rate (Rhee and Gotham, 1981) of phytoplankton. In general, phytoplankton spring blooms start when light intensity increases in the upper water column through the development of stratification after well-mixed conditions during the winter (Huisman et al., 1999; Jo et al., 2007). This means that the main controlling factor for phytoplankton blooms in the spring season is not nutrients but light, since the major nutrients required for photosynthesis are made available by the mixing of the water column by wind in the winter season. Light availability might also not be a main limiting factor for photosynthesis during the peak timing of spring blooms. Indeed, the maximum carbon uptake rates during the study period were observed at the surface layer (100%–50% light depth: 0–8 m; Table 1). Therefore, the colder water temperature in the NES (7.9 ± 2.5°C) compared to that in the UB (13.4 ± 0.8°C) could have a negative effect on the phytoplankton community in terms of photosynthesis (i.e., carbon uptake rate). During the study period, the deeper euphotic depth in the UB than in the NES could have enabled the light to penetrate deeper, allowing more phytoplankton within the euphotic water column to photosynthesize. This can be another reason for the higher integrated carbon uptake rate of phytoplankton in the UB than in the NES.
Based on the average daily carbon uptake rate in this study, the estimated annual primary production in the UB and NES was 284 g C m–2 y–1 and 147 g C m–2 y–1, respectively. The annual production in both regions during our research period is consistent with previous studies in the UB (273 g C m–2 y–1 and 280 g C m–2 y–1) (Kwak et al., 2013; Joo et al., 2014) and in the northern EJS (159 g C m–2 y–1), including the NES regions (Lee et al., 2017b). The annual primary production in the UB (a deep basin with a water depth > 2,000 m) was markedly higher than that in oceanic regions and other basins deeper than 200 m, whereas the annual primary production in the NES was similar to that in these regions. The annual primary production in oceanic regions was generally low, with a range from 55 to 102 g C m–2 y–1, whereas upwelling regions had considerably higher primary production rates (300–398 g C m–2 y–1) (Joo et al., 2014; references therein). In the eastern and western basins of the Mediterranean Sea, which have environmental conditions similar to those in the EJS, the annual carbon uptake rates were 109 g C m–2 y–1 and 158 g C m–2 y–1, respectively (Estrada, 1996). Because of its high productivity compared to those in other oceanic regions, the UB is considered a prominent biologically productive region and is referred to as a “hotspot” in the EJS (Kwak et al., 2013; Joo et al., 2014). This hot-spot is sustained by several potential mechanisms, such as different types of subpolar fronts (Chiba et al., 2008), frequent eddies (Hyun et al., 2009; Kim et al., 2012; Lim et al., 2012), and coastal upwellings (Yoo and Park, 2009).
The contributions of small and large phytoplankton to the total carbon uptake rate were different from their contributions to the chl a in both regions. The large phytoplankton (mean ± SD = 54.8 ± 3.7%) had a higher contribution than the small phytoplankton (45.2 ± 3.7%) to the total carbon uptake rate of the total phytoplankton in the UB. In the NES, the contribution of large phytoplankton (60.5 ± 7.8%) to the total carbon uptake rate was significantly higher (t-test, p < 0.01) than that of small phytoplankton (39.5 ± 7.8%) (Figure 5 and Table 1). The different contributions of small and large phytoplankton to the total chl a and carbon uptake rate during spring 2016 could have been caused by several environmental conditions (i.e., temperature and euphotic depth), as mentioned above. In the UB, the contribution of small phytoplankton to the total primary production for our cruise period (45.2%; spring season) was higher than that in July (35%; summer season) (Kwak et al., 2014). In general, small phytoplankton are predominant under warming conditions (Morán et al., 2010; Mousing et al., 2014). The low contribution of small phytoplankton observed in the UB, even in the summer season (Kwak et al., 2014), could be the result of dynamic environmental conditions (i.e., upwelling, eddies, and fronts), which allow the UB to have higher primary productivity than other oceanic regions and relatively constant primary production among different months and years (Lee et al., 2017b). Indeed, Kwak et al. (2014) measured a relatively high primary production rate (716 mg C m–2 d–1) even in the summer season (June–August), when phytoplankton are not normally actively growing at other temperate locations (Lee et al., 2017b). The value observed in summer by Kwak et al. (2014) is comparable to the primary production rate observed during the spring bloom in this study (790 mg C m–2 d–1).
According to previous studies (Agawin et al., 2000; Morán et al., 2010; Hilligsøe et al., 2011; Mousing et al., 2014), recent climate changes, especially warming temperatures, are expected to increase the contribution of small phytoplankton to the total phytoplankton community, which enhances the importance of small phytoplankton as a basic food source in marine ecosystems. Indeed, negative correlations between total primary production and small phytoplankton contributions were consistently observed in the Chukchi Sea (unpublished data) and the Amundsen Sea (Lee et al., 2017c), which have experienced rapid climate change. Lee et al. (2017b) reported a negative relationship between the small phytoplankton contribution and the total primary production in the northern EJS, which has been experiencing a drastic increase in sea surface temperature for several decades (Kim et al., 2001). We also found a marked decreasing trend in the total carbon uptake rates with increasing contributions of small phytoplankton in the UB (Figure 9). In addition, our data points observed in the NES are consistent with the regression line reported in Lee et al. (2017b). An interesting feature is that the rate of decrease in the total carbon uptake rate with increasing contributions of small phytoplankton is considerably faster (by approximately three times) in the UB than in the northern EJS (Figure 9). This is very meaningful, as it could indicate that the primary production in the UB, a biological hotspot in the EJS, might respond more sensitively to ongoing warming conditions.
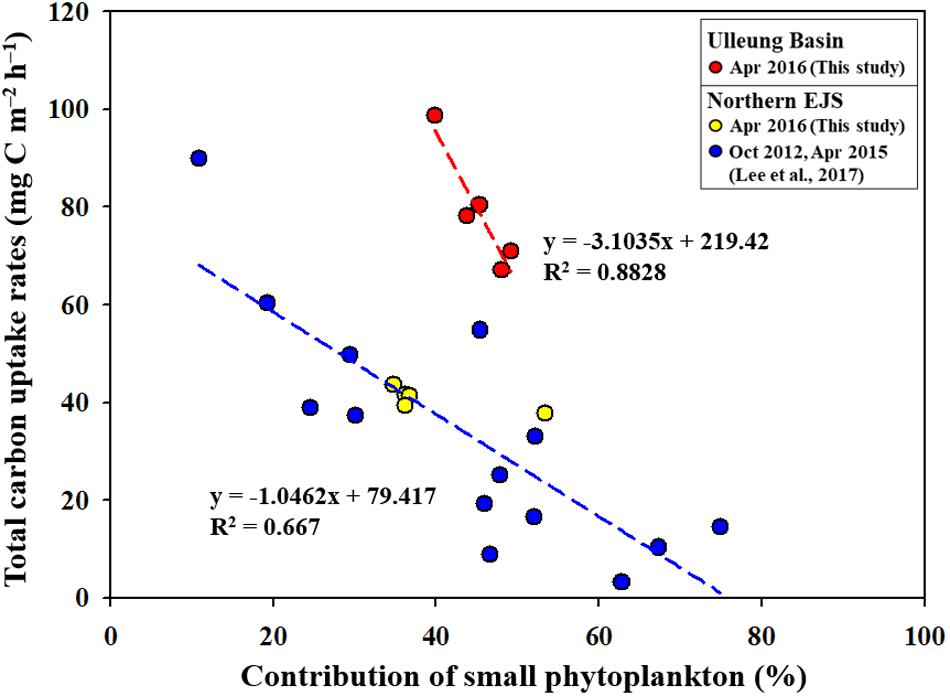
Figure 9. Relationships between productivity contributions of small phytoplankton and the total primary productions in the UB and northern EJS.
The biochemical compositions of phytoplankton provide important information about their physiological status (Kang et al., 2017; Lee et al., 2020). According to previous studies, biochemical compositions are affected by environmental factors, such as nutrient concentrations (Morris et al., 1974; Kilham et al., 1997) and growth stages (Smith et al., 1987; Kang et al., 2017). The relative proportions of LIP and CHO, known as storage compounds, tend to be high under nutrient deficient conditions (especially when nitrogen sources are limiting) (Yun et al., 2015; Kim et al., 2016; Kang et al., 2017) and during stationary growth phases (Morris, 1981; Ríos et al., 1998; Kang et al., 2017), whereas the allocation of PRT increases when there are abundant nutrient resources (DiTullio and Laws, 1983; Palmisano et al., 1988). Overall, the biochemical composition of the small phytoplankton during the study period as dominated by CHO (UB: 52.7 ± 7.9%; CE: 42.8 ± 7.6%), followed by LIP (UB: 38.1 ± 4.3%; CE: 39.7 ± 6.5%) in both regions (Figure 8A and Table 2). The small phytoplankton in the UB may have experienced a limitation in nutrient uptake due to competition with large phytoplankton during the study period. Large phytoplankton, such as diatoms, have a competitive advantage over small cells in nutrient-sufficient conditions due to their higher nutrient uptake rate (Litchman et al., 2007; Marañón et al., 2012) and accumulation ability (Thingstad et al., 2005; Marañón et al., 2012). In a parallel study on the species compositions of phytoplankton (unpublished data), the major classes for large phytoplankton in the UB were diatoms (28.5%) and cryptophytes (25.6%) which are known to assimilate significantly higher biochemical components during the active growth period with sufficient nutrients (Moal et al., 1987); small phytoplankton in the UB consisted of the prasinophytes (19.5%), prymnesiophytes (13.6%), and cyanophytes (7.2%) during our study period. Roy (2018) also reported that the contribution of large phytoplankton to the biochemical components is higher in coastal regions, which generally have sufficient nutrient conditions due to river input and coastal upwelling. In the NES, the small phytoplankton which mostly consisted of prasinophytes (11.7%), prymnesiophytes (11.5%), and cyanophytes (13.3%) (unpublished data) may have had low metabolic rates (Gillooly et al., 2001) and been in a stationary growth phase (Rhee and Gotham, 1981) due to the cold water temperature, resulting in the high CHO and LIP contents observed during the study period. The physiological status of the large phytoplankton in the UB, except M5, appears to be better than that in NES (diatoms: 34.4% and cryptophytes: 16.5%), since the contributions of PRT contents to the total biochemical compositions were relatively high in UW7 (37.7 ± 10.0%) and UW9 (31.7 ± 12.3%) (Figure 8B and Table 2). A potential reason for the relatively large contribution of PRT by the large phytoplankton in the UB is that they were in an active growth phase with an increased nutrient uptake rate because of the warmer water temperature, contrary to large phytoplankton in the NES (Rhee and Gotham, 1981; Lee et al., 2009). On the other hand, the large phytoplankton in M5 had significantly higher LIP contents than those at other sites (Figure 8B and Table 2), although the highest carbon uptake rate was observed during our cruise period (Figure 5B and Table 1). This unexpected observation might have resulted from a deficiency in nitrogen and phosphate sources, as they had already been exhausted by phytoplankton photosynthesis. de Madariaga and Joint (1992) reported that phytoplankton under nitrogen- (nitrate and ammonium) and phosphate-limited conditions had high LIP concentrations. At station M5, nitrogen, especially nitrate, and phosphate concentrations were lower than those at the other stations in the UB (Table 1). However, we are uncertain whether consumption or other mechanisms drove this nutrient deficiency; therefore, more research and data are needed to understand the exact mechanism for the mismatch between the productivity and physiological status of the phytoplankton in M5 during our research period. In the NES, the large phytoplankton had relatively high lipid compositions, except at site M12, where the dominant component was CHO (Figure 8B and Table 2). The physiological status of these large phytoplankton seemed to suggest that they were in a stationary growth phase caused by cold water temperatures, as mentioned above (Rhee and Gotham, 1981; Lee et al., 2009; Kwak et al., 2014).
The average calorific contents in the UB were similar between the small (1.01 ± 0.33 Kcal m–3) and large (1.14 ± 0.36 Kcal m–3) phytoplankton, whereas those in the NES were higher (t-test, p < 0.01) for the large phytoplankton (1.88 ± 0.54 Kcal m–3) than the small phytoplankton (1.06 ± 0.18 Kcal m–3) (Table 2). There was no spatial difference in the calorific value for the small phytoplankton between the UB and the NES (Table 2). In contrast, the calorific values of the large phytoplankton in the UB were significantly lower (t-test, p < 0.01) than those in the NES, although the total primary production was approximately two times lower in the NES than in the UB (Table 2). This pattern was caused mainly by the difference in the amount of FM, especially LIP, in the large phytoplankton between the UB and the NES (Table 2). There was no significant difference in the average CHO (UB: 62.9 ± 48.3 mg m–3; NES: 70.0 ± 36.5 mg m–3) or PRT (UB: 52.3 ± 15.7 mg m–3; NES: 51.7 ± 25.8 mg m–3) concentrations in the large phytoplankton between the two regions (Table 2). In contrast, the average LIP concentration of the large phytoplankton was significantly higher (t-test, p < 0.01) in the NES (137.6 ± 56.6 mg m–3) than in the UB (62.9 ± 37.1 mg m–3) (Table 2). Moreover, the higher energy content of LIP compared to other components led to the significant difference in the calorific value between the UB and the NES. Therefore, the relatively low primary production rate in the NES can be compensated by high calorie LIP-dominant FM.
Considering the importance of small phytoplankton, which will contribute increasing amounts to the total biomass under warming conditions (Morán et al., 2010), we assessed the calorific value per small and large phytoplankton cell by dividing the calorific content by the chl a concentration (Table 3). Overall, the calorific content per unit of chl a (hereafter Cal/chl) was higher for the large phytoplankton than the small phytoplankton in both regions (Table 3). Furthermore, the contribution of the large phytoplankton to the Cal/chl of the total phytoplankton was higher than that of the small phytoplankton in both regions (Table 3). This means that large phytoplankton could be more efficient as a food source, providing a higher energy value per unit to organisms in higher trophic levels. This finding is in contrast to the previous results from Kang et al. (2017) and Kim et al. (2019), who observed that small phytoplankton assimilated more FMs and energy per unit of chl a concentration. These inconsistent results might be caused by different research regions and periods. Kang et al. (2017) conducted their research in the northern EJS during the post-spring bloom period in 2015, when the phytoplankton had entered a stationary growth phase, whereas our study was conducted during the peak of the spring bloom based on satellite ocean color data provided in a parallel study (unpublished data). Kim et al. (2019) carried out their study in Gwangyang Bay, South Korea, which is largely affected by river inputs.
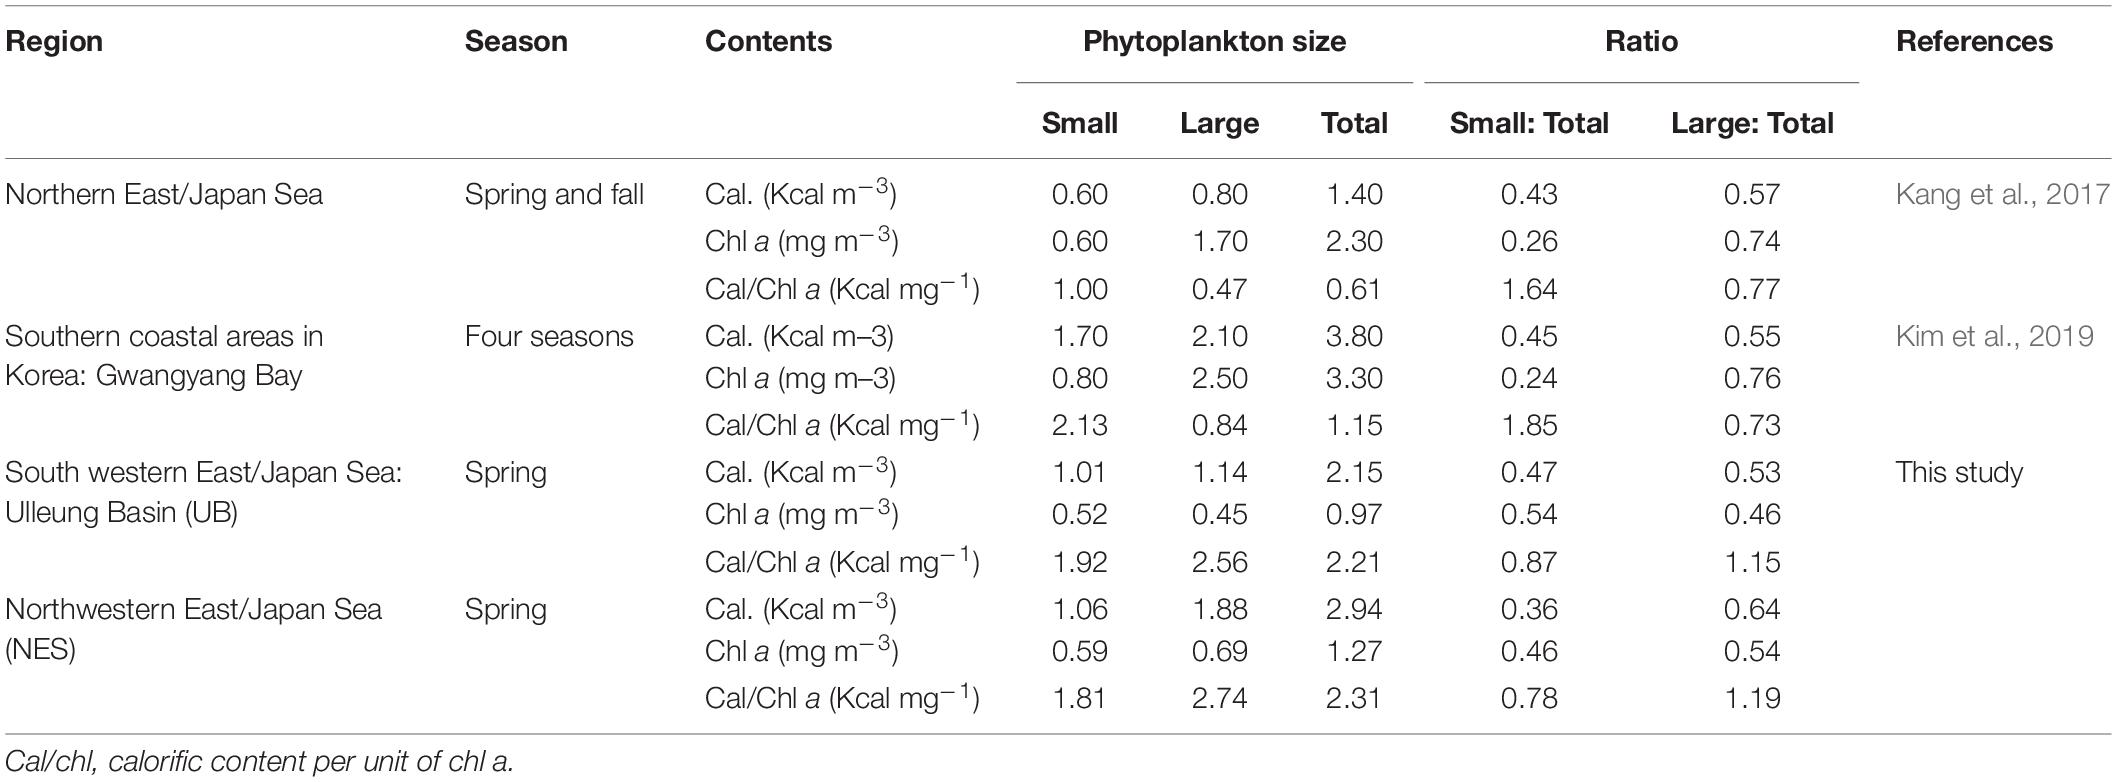
Table 3. Comparison of Cal/chl ratios between small and large phytoplankton.
Under current climate changes, an increase in the contribution of small phytoplankton to the total phytoplankton community has been observed in various oceans (Agawin et al., 2000; Li et al., 2009; Morán et al., 2010; Hilligsøe et al., 2011; Mousing et al., 2014; Joo et al., 2017), which indicates a growing importance of small size phytoplankton as a basic food source for higher trophic level organisms in the marine ecosystems. This study in the two different regions (i.e., UB and NES) of the western EJS reported the influence of small phytoplankton contribution to the primary production and different energy efficiencies between small and large phytoplankton based on their biochemical components. According to previous studies (Lee et al., 2017b,c), the total primary production could be decreased by the increase of small phytoplankton contribution. Indeed, this study also proved a negative correlation between the total carbon uptake rates and the contribution of small phytoplankton in the UB and NES (Figure 9). In particular, the decreasing trend of the total carbon uptake rates in the UB under increasing small phytoplankton contributions is more faster in this study (Figure 9) compared to previous studies in the polar regions (the Chukchi Sea–unpublished data; the Amundsen Sea–Lee et al., 2017c.) and the northern EJS (Lee et al., 2017b) which have been experiencing drastic environmental changes. It means that the primary production in the UB as a biological hot spot of the EJS could be responded sensitively to ongoing climate changes, especially warming water temperature. However, there are some uncertainties for that since only a few data points were available in the UB in this study. Further evaluation for the rapid decreasing trend in the total primary production with increasing small phytoplankton contribution should be conducted in the UB. Therefore, long term observations for the seasonal and annual primary productions and contributions of small phytoplankton in the EJS, including the UB, are needed for a better understanding of potential ecosystem change under ongoing climate change.
In terms of energy efficiency in differential size phytoplankton, large phytoplankton could provide higher energy value per unit cell than small phytoplankton based on the Cal/chl of the two different cell-sized of phytoplankton in the UB and NES during this study (Table 3). In contrast, previous studies found opposite results that small phytoplankton had relatively higher Cal/chl than large phytoplankton (Kang et al., 2017; Kim et al., 2019). This inconsistency between this and other studies might be resulted from different research regions and periods. Further studies for the contrasting patterns are necessary to understand the subsequent nutritional effects of small phytoplankton as a potential food source on higher trophic levels in a projected warmer oceanic condition.
The original contributions presented in the study are included in the article/supplementary material, further inquiries can be directed to the corresponding author/s.
SL conceived the ideas and designed the methodology. JK performed the field experiments, data analysis, and wrote the manuscript. HJ and JLe performed the field experiments and conducted the lab experiment. J-HLi and CL conducted the lab experiment. DL and HB analyzed the satellite data. C-KK critically reviewed the manuscript. All authors contributed to the article and approved the submitted version.
This research was supported by the project entitled “Long-term change of structure and function in marine ecosystems of Korea” and partly by the grant (R2020028) from the National Institute of Fisheries Science (NIFS), which were funded by the Ministry of Oceans and Fisheries, South Korea.
The authors declare that the research was conducted in the absence of any commercial or financial relationships that could be construed as a potential conflict of interest.
We thank the research project entitled “East Asian Seas Time series-I (EAST-I)” for providing a research opportunity in the EJS. We are grateful to the captain, all of the crews, and researchers for their outstanding assistance during the cruise.
Agawin, N. S., Duarte, C. M., and Agustí, S. (2000). Nutrient and temperature control of the contribution of picoplankton to phytoplankton biomass and production. Limnol. Oceanogr. 45, 591–600. doi: 10.4319/lo.2000.45.3.0591
Andersson, A., Haecky, P., and Hagström, Å. (1994). Effect of temperature and light on the growth of micro-nano-and pico-plankton: impact on algal succession. Mar. Biol. 120, 511–520. doi: 10.1007/BF00350071
Bhavya, P. S., Kim, B. K., Jo, N., Kim, K., Kang, J. J., Lee, J. H., et al. (2019). A review on the macromolecular compositions of phytoplankton and the implications for aquatic biogeochemistry. Ocean Sci. J. 54, 1–14. doi: 10.1007/s12601-018-0061-8
Bligh, E. G., and Dyer, W. J. (1959). A rapid method of total lipid extraction and purification. Can. J. Biochem. Phys. 37, 911–917. doi: 10.1139/y59-099
Calvo-Díaz, A., and Morán, X. A. G. (2006). Seasonal dynamics of picoplankton in shelf waters of the southern Bay of Biscay. Aquat. Microb. Ecol. 42, 159–174. doi: 10.3354/ame042159
Chen, Y. L. L. (2000). Comparisons of primary productivity and phytoplankton size structure in the marginal regions of southern East China Sea. Cont. Shelf Res. 20, 437–458. doi: 10.1016/S0278-4343(99)00080-1
Chiba, S., Aita, M. N., Tadokoro, K., Saino, T., Sugisaki, H., and Nakata, K. (2008). From climate regime shifts to lower-trophic level phenology: synthesis of recent progress in retrospective studies of the western North Pacific. Prog. Oceanogr. 77, 112–126. doi: 10.1016/j.pocean.2008.03.004
Chiba, S., Batten, S., Sasaoka, K., Sasai, Y., and Sugisaki, H. (2012). Influence of the Pacific Decadal Oscillation on phytoplankton phenology and community structure in the western North Pacific. Geophys. Res. Lett. 39:L15603. doi: 10.1029/2012GL052912
Dauchez, S., Legendre, L., Fortier, L., and Levasseur, M. (1996). Nitrate uptake by size-fractionated phytoplankton on the Scotian Shelf (Northwest Atlantic): spatial and temporal variability. J. Plankton Res. 18, 577–595. doi: 10.1093/plankt/18.4.577
de Madariaga, I., and Joint, I. (1992). A comparative study of phytoplankton physiological indicators. J. Exp. Mar. Biol. Ecol. 158, 149–165. doi: 10.1016/0022-0981(92)90223-W
DiTullio, G. R., and Laws, E. A. (1983). Estimates of phytoplankton N uptake based on 14CO2 incorporation into protein. Limnol. Oceanogr. 28, 177–185. doi: 10.4319/lo.1983.28.1.0177
Dubois, M., Gilles, K. A., Hamilton, J. K., Rebers, P. A., and Smith, F. (1956). Colorimetric method for determination of sugars and related substances. Anal. Chem. 28, 350–356. doi: 10.1021/ac60111a017
Dugdale, R. C., and Goering, J. J. (1967). Uptake of new and regenerated forms of nitrogen in primary productivity. Limnol. Oceanogr. 12, 196–206. doi: 10.4319/lo.1967.12.2.0196
Falkowski, P. G., and Oliver, M. J. (2007). Mix and match: how climate selects phytoplankton. Nat. Rev. Microbiol. 5, 813–819. doi: 10.1038/nrmicro1751
Finkel, Z. V., Beardall, J., Flynn, K. J., Quigg, A., Rees, T. A. V., and Raven, J. A. (2010). Phytoplankton in a changing world: cell size and elemental stoichiometry. J. Plankton Res. 32, 119–137. doi: 10.1093/plankt/fbp098
Finkel, Z. V., Katz, M. E., Wright, J. D., Schofield, O. M. E., and Falkowski, P. G. (2005). Climatically driven macroevolutionary patterns in the size of marine diatoms over the Cenozoic. Proc. Natl. Acad. Sci. U.S.A. 102, 8927–8932. doi: 10.1073/pnas.0409907102
Finkel, Z. V., Sebbo, J., Feist-Burkhardt, S., Irwin, A. J., Katz, M. E., Schofield, O. M. E., et al. (2007). A universal driver of macroevolutionary change in the size of marine phytoplankton over the Cenozoic. Proc. Natl. Acad. Sci. U.S.A. 104, 20416–20420. doi: 10.1073/pnas.0709381104
Gardner, W. D., Chung, S. P., Richardson, M. J., and Walsh, I. D. (1995). The oceanic mixed-layer pump. Deep Sea Res. II Top. Stud. Oceanogr. 42, 757–775. doi: 10.1016/0967-0645(95)00037-Q
Gillooly, J. F., Brown, J. H., West, G. B., Savage, V. M., and Charnov, E. L. (2001). Effects of size and temperature on metabolic rate. Science 293, 2248–2251. doi: 10.1126/science.1061967
Hama, T., Miyazaki, T., Ogawa, Y., Iwakuma, T., Takahashi, M., Otsuki, A., et al. (1983). Measurement of photosynthetic production of a marine phytoplankton population using a stable 13C isotope. Mar. Biol. 73, 31–36. doi: 10.1007/BF00396282
Hessen, D. A. G., De Lange, H., and Van Donk, E. (1997). UV-induced changes in phytoplankton cells and its effects on grazers. Freshw. Biol. 38, 513–524. doi: 10.1046/j.1365-2427.1997.00223.x
Hilligsøe, K. M., Richardson, K., Bendtsen, J., Sørensen, L. L., Nielsen, T. G., and Lyngsgaard, M. M. (2011). Linking phytoplankton community size composition with temperature, plankton food web structure and sea–air CO2 flux. Deep Sea Res. Part I Oceanogr. Res. Pap. 58, 826–838. doi: 10.1016/j.dsr.2011.06.004
Huisman, J. E. F., van Oostveen, P., and Weissing, F. J. (1999). Critical depth and critical turbulence: two different mechanisms for the development of phytoplankton blooms. Limnol. Oceanogr. 44, 1781–1787. doi: 10.4319/lo.1999.44.7.1781
Hyun, J. H., Kim, D., Shin, C. W., Noh, J. H., Yang, E. J., Mok, J. S., et al. (2009). Enhanced phytoplankton and bacterioplankton production coupled to coastal upwelling and an anticyclonic eddy in the Ulleung Basin, East Sea. Aquat. Microb. Ecol. 54, 45–54. doi: 10.3354/ame01280
Jo, C. O., Lee, J. Y., Park, K. A., Kim, Y. H., and Kim, K. R. (2007). Asian dust initiated early spring bloom in the northern East/Japan Sea. Geophys. Res. Lett. 34:L05602. doi: 10.1029/2006GL027395
Jo, N., Kang, J. J., Park, W. G., Lee, B. R., Yun, M. S., Lee, J. H., et al. (2017). Seasonal variation in the biochemical compositions of phytoplankton and zooplankton communities in the southwestern East/Japan Sea. Deep Sea Res. II Top. Stud. Oceanogr. 143, 82–90. doi: 10.1016/j.dsr2.2016.12.001
Joo, H., Park, J. W., Son, S., Noh, J. H., Jeong, J. Y., Kwak, J. H., et al. (2014). Long-term annual primary production in the Ulleung Basin as a biological hot spot in the East/Japan Sea. J. Geophys. Res. Oceans 119, 3002–3011. doi: 10.1002/2014JC009862
Joo, H., Son, S., Park, J. W., Kang, J. J., Jeong, J. Y., Kwon, J. I., et al. (2017). Small phytoplankton contribution to the total primary production in the highly productive Ulleung Basin in the East/Japan Sea. Deep Sea Res. II Top. Stud. Oceanogr. 143, 54–61. doi: 10.1016/j.dsr2.2017.06.007
Kang, D. J., Park, S., Kim, Y. G., Kim, K., and Kim, K.-R. (2003). A moving-boundary box model (MBBM) for oceans in change: an application to the East/Japan Sea. Geophys. Res. Lett. 30:1299. doi: 10.1029/2002GL016486
Kang, J. H., Kim, W. S., Chang, K. I., and Noh, J. H. (2004). Distribution of plankton related to the mesoscale physical structure within the surface mixed layer in the southwestern East Sea, Korea. J. Plankton Res. 26, 1515–1528. doi: 10.1093/plankt/fbh140
Kang, J. J., Joo, H., Lee, J. H., Lee, J. H., Lee, H. W., Lee, D., et al. (2017). Comparison of biochemical compositions of phytoplankton during spring and fall seasons in the northern East/Japan Sea. Deep Sea Res. II Top. Stud. Oceanogr. 143, 73–81. doi: 10.1016/j.dsr2.2017.06.006
Kilham, S. S., Kreeger, D. A., Goulden, C. E., and Lynn, S. G. (1997). Effects of nutrient limitation on biochemical constituents of Ankistrodesmus falcatus. Freshw. Biol. 38, 591–596. doi: 10.1046/j.1365-2427.1997.00231.x
Kim, B. K., Joo, H., Song, H. J., Yang, E. J., Lee, S. H., Hahm, D., et al. (2015). Large seasonal variation in phytoplankton production in the Amundsen Sea. Polar Biol. 38, 319–331. doi: 10.1007/s00300-014-1588-5
Kim, B. K., Lee, J. H., Joo, H., Song, H. J., Yang, E. J., Lee, S. H., et al. (2016). Macromolecular compositions of phytoplankton in the Amundsen Sea, Antarctica. Deep Sea Res. II Top. Stud. Oceanogr. 123, 42–49. doi: 10.1016/j.dsr2.2015.04.024
Kim, D., Yang, E. J., Kim, K. H., Shin, C. W., Park, J., Yoo, S., et al. (2012). Impact of an anticyclonic eddy on the summer nutrient and chlorophyll a distributions in the Ulleung Basin, East Sea (Japan Sea). ICES J. Mar. Sci. 69, 23–29. doi: 10.1093/icesjms/fsr178
Kim, K., Kim, K. R., Min, D. H., Volkov, Y., Yoon, J. H., and Takematsu, M. (2001). Warming and structural changes in the East (Japan) Sea: a clue to future changes in global oceans? Geophys. Res. Lett. 28, 3293–3296. doi: 10.1029/2001GL013078
Kim, Y., Lee, J. H., Kang, J. J., Lee, J. H., Lee, H. W., Kang, C. K., et al. (2019). River discharge effects on the contribution of small-sized phytoplankton to the total biochemical composition of POM in the Gwangyang Bay, Korea. Estuar. Coast. Shelf Sci. 226:106293. doi: 10.1016/j.ecss.2019.106293
Kleppel, G. S., and Burkart, C. A. (1995). Egg production and the nutritional environment of Acartia tonsa: the role of food quality in copepod nutrition. ICES J. Mar. Sci. 52, 297–304. doi: 10.1016/1054-3139(95)80045-X
Kwak, J. H., Lee, S. H., Hwang, J., Suh, Y. S., Park, H., Chang, K. I., et al. (2014). Summer primary productivity and phytoplankton community composition driven by different hydrographic structures in the East/Japan Sea and the Western Subarctic Pacific. J. Geophys. Res. Oceans 119, 4505–4519. doi: 10.1002/2014JC009874
Kwak, J. H., Lee, S. H., Park, H. J., Choy, E. J., Jeong, H. D., Kim, K. R., et al. (2013). Monthly measured primary and new productivities in the Ulleung Basin as a biological” hot spot” in the East/Japan Sea. Biogeosciences 10, 4405–4417. doi: 10.5194/bg-10-4405-2013
Lee, J. H., Kang, J. J., Jang, H. K., Jo, N., Lee, D., Yun, M., et al. (2020). Major controlling factors for spatio-temporal variations in the macromolecular composition and primary production by phytoplankton in Garolim and Asan bays in the Yellow Sea. Reg. Stud. Mar. Sci. 36:101269. doi: 10.1016/j.rsma.2020.101269
Lee, J. H., Lee, D., Kang, J. J., Joo, H. T., Lee, J. H., Lee, H. W., et al. (2017a). The effects of different environmental factors on the biochemical composition of particulate organic matter in Gwangyang Bay, South Korea. Biogeosciences 14, 1903–1917. doi: 10.5194/bg-14-1903-2017
Lee, S. H., Joo, H., Lee, J. H., Lee, J. H., Kang, J. J., Lee, H. W., et al. (2017b). Seasonal carbon uptake rates of phytoplankton in the northern East/Japan Sea. Deep Sea Res. II Top. Stud. Oceanogr. 143, 45–53. doi: 10.1016/j.dsr2.2017.04.009
Lee, S. H., Kim, B. K., Lim, Y. J., Joo, H., Kang, J. J., Lee, D., et al. (2017c). Small phytoplankton contribution to the standing stocks and the total primary production in the Amundsen Sea. Biogeosciences 14, 3705–3713. doi: 10.5194/bg-14-3705-2017
Lee, S. H., Kim, H. J., and Whitledge, T. E. (2009). High incorporation of carbon into proteins by the phytoplankton of the Bering Strait and Chukchi Sea. Cont. Shelf Res. 29, 1689–1696. doi: 10.1016/j.csr.2009.05.012
Lee, S. H., Son, S., Dahms, H.-U., Park, J. W., Lim, J.-H., Noh, J.-H., et al. (2014). Decadal changes of phytoplankton Chl-a-a in the East Sea/Sea of Japan. Oceanology 6, 771–779. doi: 10.1134/s0001437014060058
Lee, S. H., Whitledge, T. E., and Kang, S. H. (2007). Recent carbon and nitrogen uptake rates of phytoplankton in Bering Strait and the Chukchi Sea. Cont. Shelf Res. 27, 2231–2249. doi: 10.1016/j.csr.2007.05.009
Legendre, L., and Rassoulzadegan, F. (1996). Food-web mediated export of biogenic carbon in oceans: hydrodynamic control. Mar. Ecol. Prog. Ser. 145, 179–193. doi: 10.3354/meps145179
Lewandowska, A. M., Breithaupt, P., Hillebrand, H., Hoppe, H. G., Jürgens, K., and Sommer, U. (2012). Responses of primary productivity to increased temperature and phytoplankton diversity. J. Sea Res. 72, 87–93. doi: 10.1016/j.seares.2011.10.003
Li, W. K., McLaughlin, F. A., Lovejoy, C., and Carmack, E. C. (2009). Smallest algae thrive as the Arctic Ocean freshens. Science 326, 539–539. doi: 10.1126/science.1179798
Lim, J. H., Son, S., Park, J. W., Kwak, J. H., Kang, C. K., Son, Y. B., et al. (2012). Enhanced biological activity by an anticyclonic warm eddy during early spring in the East Sea (Japan Sea) detected by the geostationary ocean color satellite. Ocean Sci. J. 47, 377–385. doi: 10.1007/s12601-012-0035-1
Lindqvist, K., and Lignell, R. (1997). Intracellular partitioning of 14CO2 in phytoplankton during a growth season in the northern Baltic. Mar. Ecol. Prog. Ser. 152, 41–50. doi: 10.3354/meps152041
Litchman, E., Klausmeier, C. A., Schofield, O. M., and Falkowski, P. G. (2007). The role of functional traits and trade-offs in structuring phytoplankton communities: scaling from cellular to ecosystem level. Ecol. Lett. 10, 1170–1181. doi: 10.1111/j.1461-0248.2007.01117.x
Lowry, O. H., Rosebrough, N. J., Farr, A. L., and Randall, R. J. (1951). Protein measurement with the folin phenol reagent. J. Biol. Chem. 193, 265–275.
Marañón, E., Cermeño, P., Latasa, M., and Tadonléké, R. D. (2012). Temperature, resources, and phytoplankton community size structure in the ocean. Limnol. Oceanogr. 57, 1266–1278. doi: 10.4319/lo.2012.57.5.1266
Moal, J., Martin-Jezequel, V., Harris, R. P., Samain, J. F., and Poulet, S. A. (1987). Interspecific and intraspecific variability of the chemical composition of marine phytoplankton. Oceanol. Acta 10, 339–346.
Morán, X. A. G., López-urrutia, Á., Calvo-díaz, A., and Li, W. K. (2010). Increasing importance of small phytoplankton in a warmer ocean. Glob. Change Biol. 16, 1137–1144. doi: 10.1111/j.1365-2486.2009.01960.x
Morris, I. (1981). Photosynthetic products, physiological state, and phytoplankton growth. Can. Bull. Fish. Aquat. Sci. 210, 83–102.
Morris, I., Glover, H. E., and Yentsch, C. S. (1974). Products of photosynthesis by marine phytoplankton: the effect of environmental factors on the relative rates of protein synthesis. Mar. Biol. 21, 1–9. doi: 10.1007/BF00394754
Mortensen, S. H., Børsheim, K. Y., Rainuzzo, J., and Knutsen, G. (1988). Fatty acid and elemental composition of the marine diatom Chaetoceros gracilis Schütt. Effects of silicate deprivation, temperature and light intensity. J. Exp. Mar. Biol. Ecol. 122, 173–185. doi: 10.1016/0022-0981(88)90183-9
Mousing, E. A., Ellegaard, M., and Richardson, K. (2014). Global patterns in phytoplankton community size structure—evidence for a direct temperature effect. Mar. Ecol. Prog. Ser. 497, 25–38. doi: 10.3354/meps10583
Palmisano, A. C., Lizotte, M. P., Smith, G. A., Nichols, P. D., White, D. C., and Sullivan, C. W. (1988). Changes in photosynthetic carbon assimilation in Antarctic sea-ice diatoms during spring bloom: variation in synthesis of lipid classes. J. Exp. Mar. Biol. Ecol. 116, 1–13. doi: 10.1016/0022-0981(88)90241-9
Rhee, G. Y., and Gotham, I. J. (1981). The effect of environmental factors on phytoplankton growth: temperature and the interactions of temperature with nutrient limitation 1. Limnol. Oceanogr. 26, 635–648. doi: 10.4319/lo.1981.26.4.0635
Ríos, A. F., Fraga, F., Pérez, F. F., and Figueiras, F. G. (1998). Chemical composition of phytoplankton and particulate organic matter in the Ría de Vigo (NW Spain). Sci. Mar. 62, 257–271. doi: 10.3989/scimar.1998.62n3257
Roy, S. (2018). Distributions of phytoplankton carbohydrate, protein and lipid in the world oceans from satellite ocean colour. ISME J. 12, 1457–1472. doi: 10.1038/s41396-018-0054-8
Scott, J. M. (1980). Effect of growth rate of the food alga on the growth/ingestion efficiency of a marine herbivore. J. Mar. Biol. Assoc. U.K. 60, 681–702. doi: 10.1017/S0025315400040376
Smith, R. E. H., Clement, P., Cota, G. F., and Li, W. K. W. (1987). Intracellular photosynthate allocation and the control of Arctic marine ice algal production. J. Phycol. 23, 251–263. doi: 10.1111/j.1529-8817.1987.tb04434.x
Sterner, R. W., Hagemeier, D. D., Smith, W. L., and Smith, R. F. (1993). Phytoplankton nutrient limitation and food quality for Daphnia. Limnol. Oceanogr. 38, 857–871. doi: 10.4319/lo.1993.38.4.0857
Stolte, W., McCollin, T., Noordeloos, A. A., and Riegman, R. (1994). Effect of nitrogen source on the size distribution within marine phytoplankton populations. J. Exp. Mar. Biol. Ecol. 184, 83–97. doi: 10.1016/0022-0981(94)90167-8
Stolte, W., and Riegman, R. (1995). Effect of phytoplankton cell size on transient-state nitrate and ammonium uptake kinetics. Microbiology 141, 1221–1229. doi: 10.1099/13500872-141-5-1221
Thingstad, T. F., Øvreås, L., Egge, J. K., Løvdal, T., and Heldal, M. (2005). Use of non-limiting substrates to increase size; a generic strategy to simultaneously optimize uptake and minimize predation in pelagic osmotrophs? Ecol. Lett. 8, 675–682. doi: 10.1111/j.1461-0248.2005.00768.x
Whyte, J. N. (1987). Biochemical composition and energy content of six species of phytoplankton used in mariculture of bivalves. Aquaculture 60, 231–241. doi: 10.1016/0044-8486(87)90290-0
Winberg, G. G. (1971). Symbols, units and conversion factors in study of fresh waters productivity. Int. Biol. 23.
Yoo, S., and Park, J. (2009). Why is the southwest the most productive region of the East Sea/Sea of Japan? J. Mar. Syst. 78, 301–315. doi: 10.1016/j.jmarsys.2009.02.014
Keywords: primary production, biochemical compositions, small phytoplankton, large phytoplankton, calorific content, East/Japan Sea
Citation: Kang JJ, Jang HK, Lim J-H, Lee D, Lee JH, Bae H, Lee CH, Kang C-K and Lee SH (2020) Characteristics of Different Size Phytoplankton for Primary Production and Biochemical Compositions in the Western East/Japan Sea. Front. Microbiol. 11:560102. doi: 10.3389/fmicb.2020.560102
Received: 08 May 2020; Accepted: 01 December 2020;
Published: 21 December 2020.
Edited by:
Martin G. Klotz, Washington State University, United StatesReviewed by:
Hidetoshi Urakawa, Florida Gulf Coast University, United StatesCopyright © 2020 Kang, Jang, Lim, Lee, Lee, Bae, Lee, Kang and Lee. This is an open-access article distributed under the terms of the Creative Commons Attribution License (CC BY). The use, distribution or reproduction in other forums is permitted, provided the original author(s) and the copyright owner(s) are credited and that the original publication in this journal is cited, in accordance with accepted academic practice. No use, distribution or reproduction is permitted which does not comply with these terms.
*Correspondence: Sang Heon Lee, c2FuZ2xlZUBwdXNhbi5hYy5rcg==
Disclaimer: All claims expressed in this article are solely those of the authors and do not necessarily represent those of their affiliated organizations, or those of the publisher, the editors and the reviewers. Any product that may be evaluated in this article or claim that may be made by its manufacturer is not guaranteed or endorsed by the publisher.
Research integrity at Frontiers
Learn more about the work of our research integrity team to safeguard the quality of each article we publish.