
94% of researchers rate our articles as excellent or good
Learn more about the work of our research integrity team to safeguard the quality of each article we publish.
Find out more
ORIGINAL RESEARCH article
Front. Microbiol., 30 October 2019
Sec. Aquatic Microbiology
Volume 10 - 2019 | https://doi.org/10.3389/fmicb.2019.02474
This article is part of the Research TopicMicrobial Ecology in Reservoirs and Lakes View all 22 articles
Microcystis biomass remineralization after blooming represents a hotspot of nutrient recycling in eutrophic lakes. Because Microcystis blooms are massively deposited on lake sediments, resulting in anoxic conditions, it is important to understand the response and role of benthic microbial communities during the anoxic decomposition of Microcystis in freshwater lakes. In the present study, we employed a microcosm method, combined with high-throughput sequencing, functional prediction, and network analysis, to investigate microbial succession during the short-term (30 days) anaerobic decomposition of Microcystis in a eutrophic sediment. Continuous accumulation of CH4 and CO2 and increasing relative abundance of methanogens were observed during the incubation. The microbial community composition (MCC) significantly changed after addition of Microcystis biomass, with a shift in the community from a stochastic to a functional, deterministic succession. Families, including Clostridiaceae, Rhodocyclaceae, Rikenellaceae, Peptostreptococcaceae, Syntrophomonadaceae, Lachnospiraceae, and Methanosarcinaceae, were predominantly enriched and formed diverse substitution patterns, suggesting a synergistic action of these family members in the decomposition of Microcystis biomass. Importantly, intense species-to-species interactions and weak resistance to disturbance were observed in the microbial community after Microcystis biomass addition. Collectively, these results suggest that the addition of Microcystis induce phylogenetic clustering and structure instability in the sediment microbial community and the synergistic interactions among saprotrophic bacteria play a key role in Microcystis biomass remineralization.
Cyanobacterial blooms have become a widespread phenomenon in freshwater habitats (Zhang et al., 2010; Zhai et al., 2013) as one of the harmful consequences of eutrophication, which mainly results from intensive human activities affecting freshwater lakes and reservoirs worldwide (Paerl et al., 2001). As the primary producer, Cyanobacteria contribute 0.05% of the global carbon biomass, causing high product accumulation during blooms and making eutrophic lakes extremely active sites for the transport, transformation, and storage of a considerable amount of carbon and nutrients (Wilms et al., 2006). In bloom seasons, high microbial activity leads to oxygen depletion within the uppermost few millimeters of the sediment and even the overlying water (Karlson et al., 2008; Chen et al., 2010). In this scenario, accumulated bloom biomass is primarily mineralized through anaerobic processes in the surface sediment (Bastviken et al., 2008). Furthermore, anaerobic mineralization in the sediments contributes to massive CH4 emission from inland water bodies on a global scale (Cole et al., 1994; Schink, 1997; Krinner, 2003; Bastviken et al., 2004a). Thus, it is important to comprehensively understand the microbial transformation process and relevant prerequisite conditions, constituting the basis for the estimation of local and global CH4 contribution by anaerobic decomposition of cyanobacterial blooms in inland waters.
Some studies addressing the associated microbial communities during cyanobacterial blooms have been reported, mainly focusing on microbial community dynamics in freshwater environments during the blooms (Li et al., 2012) or bacterial communities associated with certain algae species (Shi et al., 2009). These studies have revealed the influence of algal blooms on the planktonic bacterial community and have also provided important information about the microorganisms involved in algal biomass transformation (Tang et al., 2015).
However, the knowledge of which and how microbes participate in the anaerobic degradation of cyanobacterial blooms in the eutrophic lakes and reservoirs is limited. On the one hand, the involvement of microbial taxa, as well as the interactions between them, are not clear; on the other hand, the limitations of analysis methods have hampered the investigations of the phylogenetic diversity (PD), composition, and dynamics of the microbial community participating in the decomposition of sedimentary algae. In general, the anaerobic decomposition of organic material includes sequential hydrolytic, homoacetogenic, and methanogenic processes (Schink, 1997). Non-representative microbial taxa have been identified for each key step during the anaerobic degradation of cyanobacterial biomass. However, such research has been lagging far behind the analogous research in artificial anaerobic digestion, such as in wastewater treatment plants, where the different types of microorganisms involved have been extensively studied (Li et al., 2014; Narihiro et al., 2015; Shu et al., 2015). Using 13C-labeled Spirulina biomass and denaturing gradient gel electrophoresis (DGGE), Graue et al. (2012) found that Psychrilyobacter atlanticus and some Propionigenium-like taxa participated in Spirulina biomass anoxic degradation. In situ Microcystis scums were incubated for 90 days to simulate the degradation of Microcystis biomass in an anoxic water column, and subsequent T-RFLP analysis revealed the predominance of a few novel Clostridium spp. during this process (Xing et al., 2011). Shao et al. (2013) investigated the effect of Microcystis bloom decomposition on sediment bacterial communities using DGGE in the 100 L mesocosms. The relative abundance of Bacteroidetes and Verrucomicrobia strongly increased after 14 days. However, it is remarkable that (i) the scenarios of cyanobacterial biomass mineralization in anoxic sediments have been less touched in the available studies; (ii) because of being restricted by the resolution of fingerprinting methods, the important processes in decomposition and the associated microbial groups remain undefined; (iii) greenhouse gas effect of decomposition in the sediment, which is even crucial for the CH4 formation in eutrophic aquatic environments, has not been studied well.
The objective of the present study was to determine how sediment microbial communities respond and participate in Microcystis anaerobic decomposition after the massive deposition of Microcystis into freshwater sediment. Microcosms with sediment slurry and supplemental Microcystis biomass under anoxic conditions were generated to examine the sediment microbial communities after incubation for 30 days. Illumina MiSeq sequencing was applied to the sequential samples to elucidate the differential patterns with high taxonomic resolution. To further depict the inherent response of the microbial community to Microcystis addition, the relationship among co-occurring species was evaluated, and the community function profiles were also predicted based on the structural data. We observed distinct microbial succession during the anoxic decomposition of Microcystis in freshwater sediment, characterized by enhanced species-species interaction and low resistance to disturbance. Such works are helpful for a better understanding of algae biomass transformation and greenhouse gas production, constituting the center of carbon cycling in eutrophic lakes.
The Microcystis strain used was Microcystis sp. FACH-B 7806 (obtained from Freshwater Algae Culture Collection at the Institute of Hydrobiology, Chinese Academy of Sciences). Microcystis biomass was collected in the lab, cultivated in BG11 medium1 under a luminance of 1200 Lux and 12 h dark: 12 h light photoperiod for 15 days, then collected by centrifugation and dried using a freeze dryer (ALPHA 1-2, CHRIST, Osterode am Harz, Germany). The Microcystis powder was UV sterilized for 20 min and stored at −80°C before adding to the microcosms. The sediment slurry used for the anaerobic Microcystis biodegradation tests were collected from Meiliang Bay (31.28946° N, 120.812905° E) of Lake Taihu in October 2012. Prior to the experiment, the sediments (1–5 cm deep) were sieved using a 0.6-mm mesh to remove the macrofauna and debris and subsequently incubated at room temperature (20–25°C) for 2 weeks to decrease the organic carbon content.
More than 60 microcosms built up in the sterile 100-mL air-tight glass bottles (100-mL capacity; CNW Technologies GmbH, Düsseldorf, Germany), which were divided into two groups. Each bottle in the control group contained 12.5 g homogenized sediment slurry +10 mL of sterile water, and in the treatment group, 12.5 g homogenized sediment slurry +10 mL of sterile water +25 mg freeze-dried Microcystis biomass. All the bottles were sealed with rubber stoppers and aluminum seals and wrapped with a silver paper to keep them in the dark. The headspace in the bottles was vacuumed for 10 s and filled with purified N2 gas four times to maintain the anoxic conditions. All the microcosms were incubated in an incubator at 25°C.
During the incubation, six bottles from the treatment group and two bottles from the control group were randomly selected at each time point of (0, 1, 3, 10, 17, 23, and 30) days. The headspace in each jar was sampled with a 500 μL syringe (Part Number/REF: 81256, HAMILTON, Romania) after vigorously shaking to remove the gas bubbles trapped in the sediment slurry. The concentrations of H2, CO2, and CH4 in the headspace were measured on a gas chromatograph equipped with a packed column TDX-01 (Techcomp, Shanghai, China), a flame ionization detector (FID), and a thermal conductivity detector (TCD). The gas concentration was calibrated using H2, CH4, and CO2 standards purchased from the National Institute of Metrology P. R. China Standard Gas Testing Center. The bottles were sacrificed after gas measurement. A pH meter (METTLER TOLEDO FE20, Shanghai, China) was used to measure the pH of the slurry.
The sediment slurry samples were collected and stored at −20°C after freeze-drying. Genomic DNA was extracted from 0.25 g of freeze-dried sediment slurry using the FastDNA SPIN Kit (MP Biomedicals, Santa Ana, CA, United States) according to the manufacturer’s instructions. The genomic DNA was quantified using a spectrophotometer (GE, Pittsburgh, United States) and stored at −20°C until subsequent procedures.
The 16S rRNA genes of the total bacteria were quantified by real-time PCR using the primer set 341F and 534R (Bru et al., 2008). Total Archaea were quantified using the 16S rRNA gene primer set Arch 333F and Arch 554R (Suzuki et al., 2000). Methanogens were quantified using the primer set ME1 and mlas (Steinberg and Regan, 2008), which targets the mcrA gene. The PCR conditions were as described by Nunoura et al. (2006). To construct standard curves for quantitative PCR, the PCR products for the partial bacterial 16S rRNA (341F and 534R), archaeal 16S rRNA (Arch333F and Arch554R), and mcrA (ME1 and mlas) genes (Supplementary Table S1) were purified and cloned into the pMD18-T vector (Takara, Dalian, China), and subsequently transformed into Escherichia coli DH5α competent cells (Takara, Dalian, China). The successfully inserted plasmids were extracted using a Plasmid Mini-Prep Kit (Axygen Biosciences, Union City, CA, United States), and the concentrations were determined by spectrophotometry using a NanoVue (GE, Pittsburgh, United States). The standard curves were prepared from linearized plasmid serial dilutions of 100 to 108 gene copies directly calculated from the concentration of the extracted plasmid. Quantitative PCR was performed in a 20 μL reaction comprising 10 μL of SYBR Premix ExTaqTM (Takara, Dalian, China), 0.25 μM each primer, 1 μL of 1/10 diluted DNA, and RNase-free water. The thermocycling program for quantitative PCR comprised an initial cycle at 95°C for 30 s, followed by 40 cycles at 95°C for 5 s and 60°C for 34 s. All measurements were obtained in triplicate. The standard curves were used as the references to calculate the copy number of bacterial 16S rRNA, archaeal 16S rRNA, and methanogens mcrA genes (correlation coefficient r2 = 0.993, 0.993, and 0.993, respectively). The efficiencies of the qPCR amplification for the bacteria, archaea, and mcrA were 105.8, 96.6, and 97.1%, respectively.
Genomic DNA was extracted from six replicates in the treatment group and two replicates in the control group at (0, 1, 3, 10, 17, 23, and 30) days. To analyze the bacterial diversity during cultivation, the V4-V6 region of the bacterial 16S rRNA genes was amplified and sequenced on an Illumina MiSeq platform. The V4-V6 region of the 16S rRNA gene was amplified using the primers 515F (5′- GTGCCAGCMGCCGCGGTAA-3′) and 907R (5′- CCGTCAATTCCTTTRAGTTT-3′) (Zhou X. et al., 2015). PCR amplification was performed using an ABI GeneAmp® 9700 thermal cycler (Applied Biosystems, Waltham, MA, United States). The PCR reaction was performed in a 20-μL reaction volume containing 10 μL of Trans Start Fast pfu DNA Polymerase Super Mix (Trans Gen AP221-02), 0.2 μM of forward and reverse primers, and 10 ng of template DNA. The thermal cycling parameters were denaturation at 95°C for 1 min, followed by 30 cycles at 94°C for 10 s, 55°C for 30 s, and 72°C for 45 s, with a final step at 72°C for 5 min. The PCR products were analyzed on a 2% agarose gel, purified using the AxyPrepTM DNA Gel Extraction Kit (Axygen Biosciences, Union City, CA, United States) according to the manufacturer’s instructions, and quantified using QuantiFluorTM -ST (Promega, Fitchburg, WI, United States). The purified amplicons were pooled in equal molar ratios and paired-end sequenced (2 × 250 bp) on an Illumina MiSeq platform according to the standard protocols of the Major Bio Co., Ltd. (Shanghai, China).
The raw sequencing reads were de-multiplexed, quality-filtered, and analyzed using QIIME v1.17 (Caporaso et al., 2010). Sequence quality management and operational taxonomic units (OTUs) analysis were conducted using the UPARSE pipeline according to Edgar (2013). Briefly, reads <250 bp, with an average quality score (Q score) of <25 in a sliding window of 50 bp, with mismatched primer sequences, or containing ambiguous bases (Ns) were removed from downstream analyses. Both the forward and reverse primers were truncated from the reads. Chimeric sequences were removed using USEARCH software (Edgar, 2010) based on the UCHIME algorithm (Edgar et al., 2011). After quality and chimera filtering, 1.73 million reads with an average read length of 395 bp in 56 samples were obtained. The lowest number of sequences was 13,628. Therefore, the sequences in the samples were randomly normalized to 13,628 prior to conducting subsequent analyses. All the reads were clustered into OTUs at 97% pairwise identity using UCLUST (Edgar, 2013). Representative OTUs were aligned to the Greengenes database (gg_13_8_otus).
Alpha diversity was estimated according to the Shannon index, Chao1, observed species, and PD for all the samples by using QIIME v1.17. Beta diversity was based on Bray–Curtis algorithm of the OTU table to identify the clustering patterns in the microbial communities among the samples across the incubation times (R-vegan function vegdist). In addition, the null model Raup-Crick index (βRC) was used to assess whether the null-expected number of shared species between any two communities was different from the observed number of shared species (Chase et al., 2011). The null community was generated by randomly shuffling the original community 199 times with the independent swap algorithm by holding the number of OTUs in each sample and the number of samples, in which each OTU appears constant. The PAST program (Hammer et al., 2001) was used for these analyses. Both the Bray–Curtis and Raup-Crick algorithms were visualized on the 2D non-metric multidimensional scaling (NMDS) plots using the program PRIMER v7 (Clarke and Gorley, 2015).
The functional profiles of the microbial communities were predicted by using PICRUSt (Phylogenetic Investigation of Communities by Reconstruction of Unobserved States2; Langille et al., 2013) based on our 16S rRNA data. The 6,763 close-reference OTUs were picked up with Greengenes 13.5 in Galaxy3 and their functional profiles were predicted from the Kyoto Encyclopedia of Genes and Genomes (KEGG) pathways (Kanehisa et al., 2014). The average nearest sequenced taxon index (NSTI, 0.182 ± 0.02 SD) of these samples was near that reported for soil communities (0.17 ± 0.02) (Langille et al., 2013). To identify functional and metabolic subsystems, whose relative frequencies (rel. freq. %) in treatments differed significantly from that in control samples based on KEGG, two-sided Welch’s t-test (p-value) was used in the STAMP v2.01 software (Parks et al., 2014).
Potential interactions between co-occurring microbial taxa in control and treatment were determined by molecular ecological networks (MENs), which were constructed by using a random matrix theory (RMT)-based approach on an open-accessible comprehensive pipeline (Molecular Ecological Network Analysis Pipeline, MENAP4, Deng et al., 2012). In the construction of the MENs, data standardization, Spearman’s correlation estimation, adjacency matrix determination by RMT-based approach, network characterization, module detection, eigengene network analysis, and network comparisons were accomplished in order (Zhou et al., 2010). For each network, 100 corresponding random networks were then generated with the same network size and an average number of links. A Z-test was applied to determine the differences in the indices between the constructed and random networks. Cytoscape 3.4.0 was used for the network visualization.
One-way ANOVA was used to identify the statistical significance of the pH value within each group along the incubation time. The differences of alpha diversity index, as well as the q-PCR abundance of bacteria, archaea, and methanogens, between the control and treatment groups was evaluated by Independent-Samples t-test (SPSS v20.0) at a single time point. Heatmaps representing the relative sequence abundances of bacterial OTUs among the samples were constructed using the “pheatmap” and “gplots” packages. Significantly enriched microbial taxa during the treatment was evaluated by Independent-Samples t-test (SPSS v20.0) at each time point. The relationships between relative abundance and incubation time for each group were then explored with four models, linear, quadratic, exponential, and logarithmic regression. The best models were selected based on Akaike’s information criterion (AIC, Bozdogan, 1987). Permutational multivariate analysis of variance (PERMANOVA) (Anderson, 2001) was performed using the adonis function in the Vegan package (R studio, version 2.14.1, R Development Core Team, 2011) to evaluate the two-sided effects of Microcystis addition and incubation time on microbial community dynamics. The correlation between methane concentration and methanogen abundance was measured by Pearson correlation coefficient (r-value, SPSS v20.0).
All the DNA sequences retrieved from the control and treatment groups at different sampling times were deposited at the European Nucleotide Archive and can be found under the Accession number PRJEB210145.
Production of CO2 and CH4 is an indicator of Microcystis decomposition, and they continuously accumulated after Microcystis addition, with final concentrations of 27.10 ± 2.28 μmol cm–3 sediment and 21.87 ± 2.29 μmol cm–3 sediment, respectively (Figures 1A,B). The CH4 production exhibited a sigmoidal curve with a lag phase (from day 0 to day 7), an exponential phase (from day 7 to day 17), and a stationary phase (from day 23 to day 30). CO2 rapidly accumulated from the beginning to the stationary phase (day 17) and remained stable throughout the experiment. In the control group, the production of CO2 and CH4 was not detectable. The addition of Microcystis biomass caused no significant pH difference in the treatment group (one-way ANOVA, p > 0.5), which seemed more stable (6.66–7.06) than the control (6.19–7.30) throughout the 30-day period (Figure 1C).
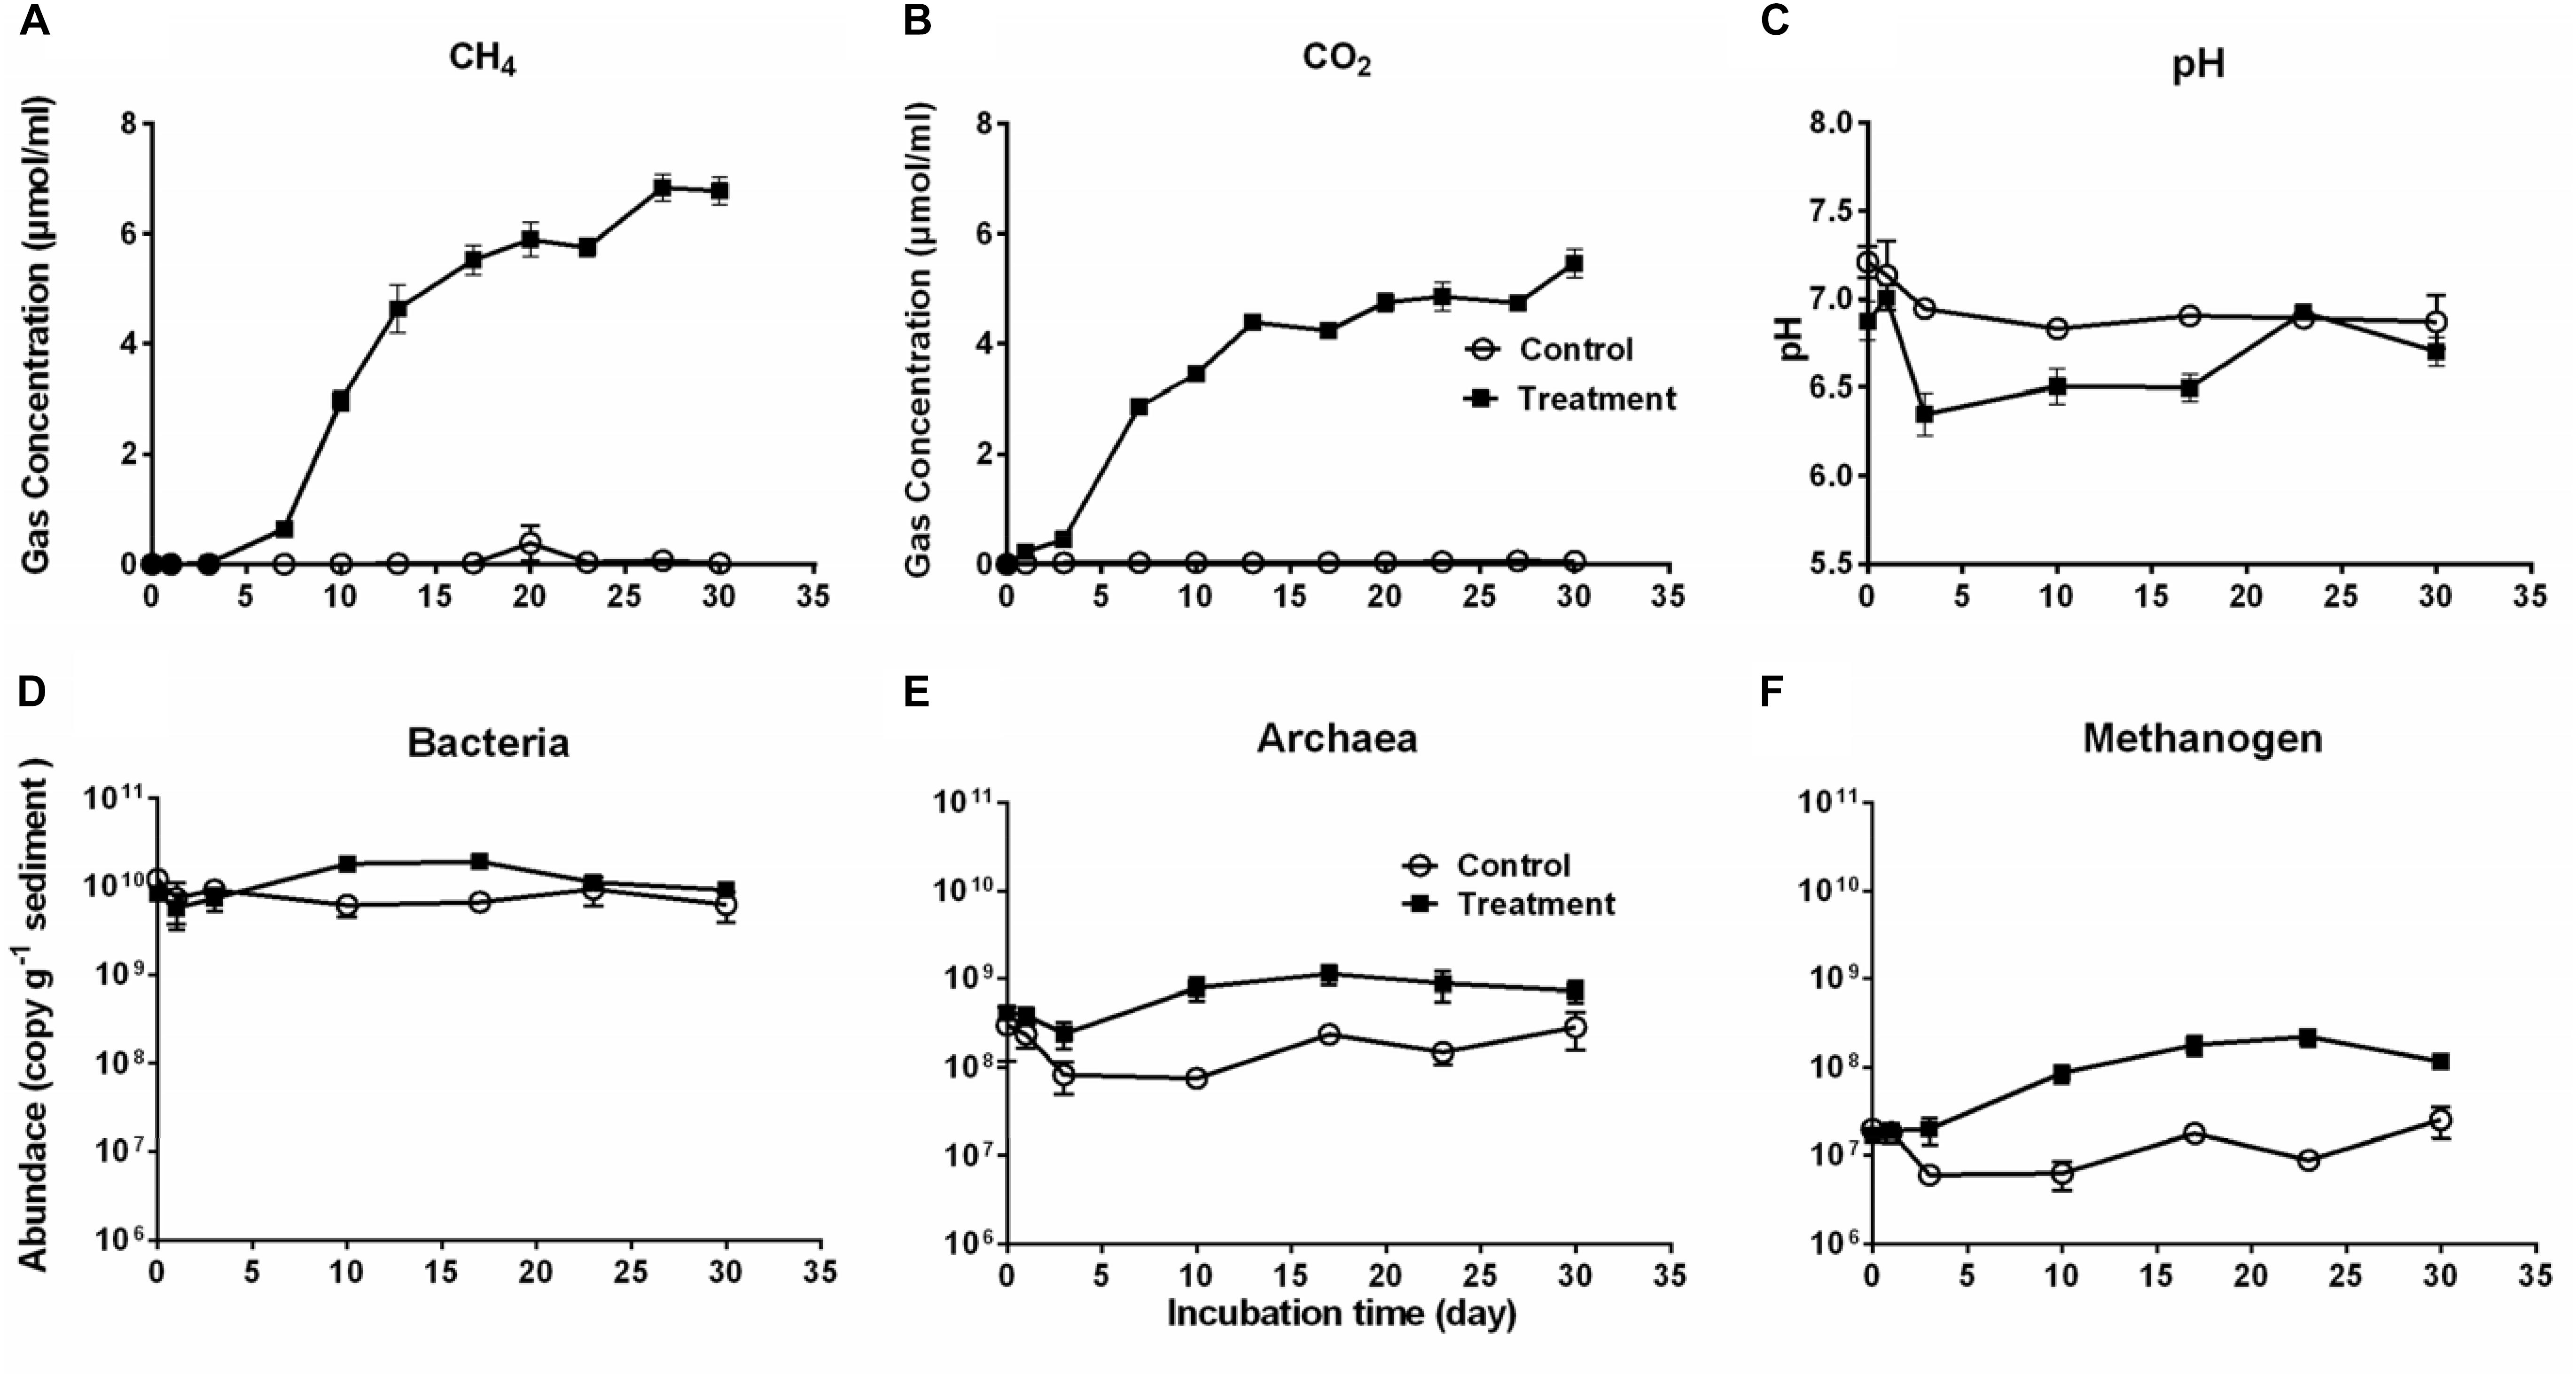
Figure 1. The cumulative CH4 (A) and CO2 (B) production, pH (C) in the microcosms, and the abundances of Bacteria (D), Archaea (E), and Methanogens (F) during 30-day cultivation in the microcosm without (Control, open circles) or with (Treatment, solid squares) Microcystis addition. Microbial abundances were determined by qPCR method.
Accordingly, the bacterial abundance increased in the treatment group from day 1 to day 17, followed by a slight decrease, whereas it remained stable in the control group (Figure 1D). The abundance of Archaea and methanogens were significantly higher in the treatment group than in the control group (for both, Independent-Samples t-test, p = 0.001) (Figures 1E,F). As a subgroup of the total archaeal population, methanogens accounted for approximately 2–47% of the total Archaea. There was a close correlation between the abundance of methanogens and CH4 production in the treatment group (Pearson’s correlation r = 0.88, p = 0.009) but not in the control group (Pearson’s correlation r = −0.04, p = 0.931).
In total, 18,540 OTUs were detected and classified into 73 phyla and 1,011 genera. We observed significantly lower OTU numbers, Shannon index, and PD value in the treatment group than in the control group (Table 1). For the Chao1 estimates of microbial communities component, the treatment group was significantly lower than the control during the first 10 days of the incubation and then no significant difference was observed between the two groups (Table 1).

Table 1. Comparison of microbial community diversity between microcosms without (Control) or with Microcystis (Treatment) addition during the incubation course.
Non-metric multidimensional scaling analysis with whole samples revealed a clear separation of the microbial community composition (MCC) between the control and treatment groups (Figure 2A). The MCC in the treatment group significantly changed after Microcystis biomass addition (Figure 2D and Supplementary Figure S1, PERMANOVA, F1,42 = 17.02, p < 0.001), whereas in the control group, the MCC remained almost undisturbed (Figure 2B). Random sampling effects were primarily observed in the control samples during incubation, and there was no difference in βRC before and after the incubation course (Figures 2B,C). However, the βRC values of the treatment samples indicated that the MCC after Microcystis biomass addition was more similar to the start-point samples than expected by chance (Figures 2D,E). This observation suggests that the changes in β-diversity did not reflect the random influence of incubation on the microbial species and that the input organic matter provided a systematic ecological filter for the removal of some species from each community exposed to the substrate.
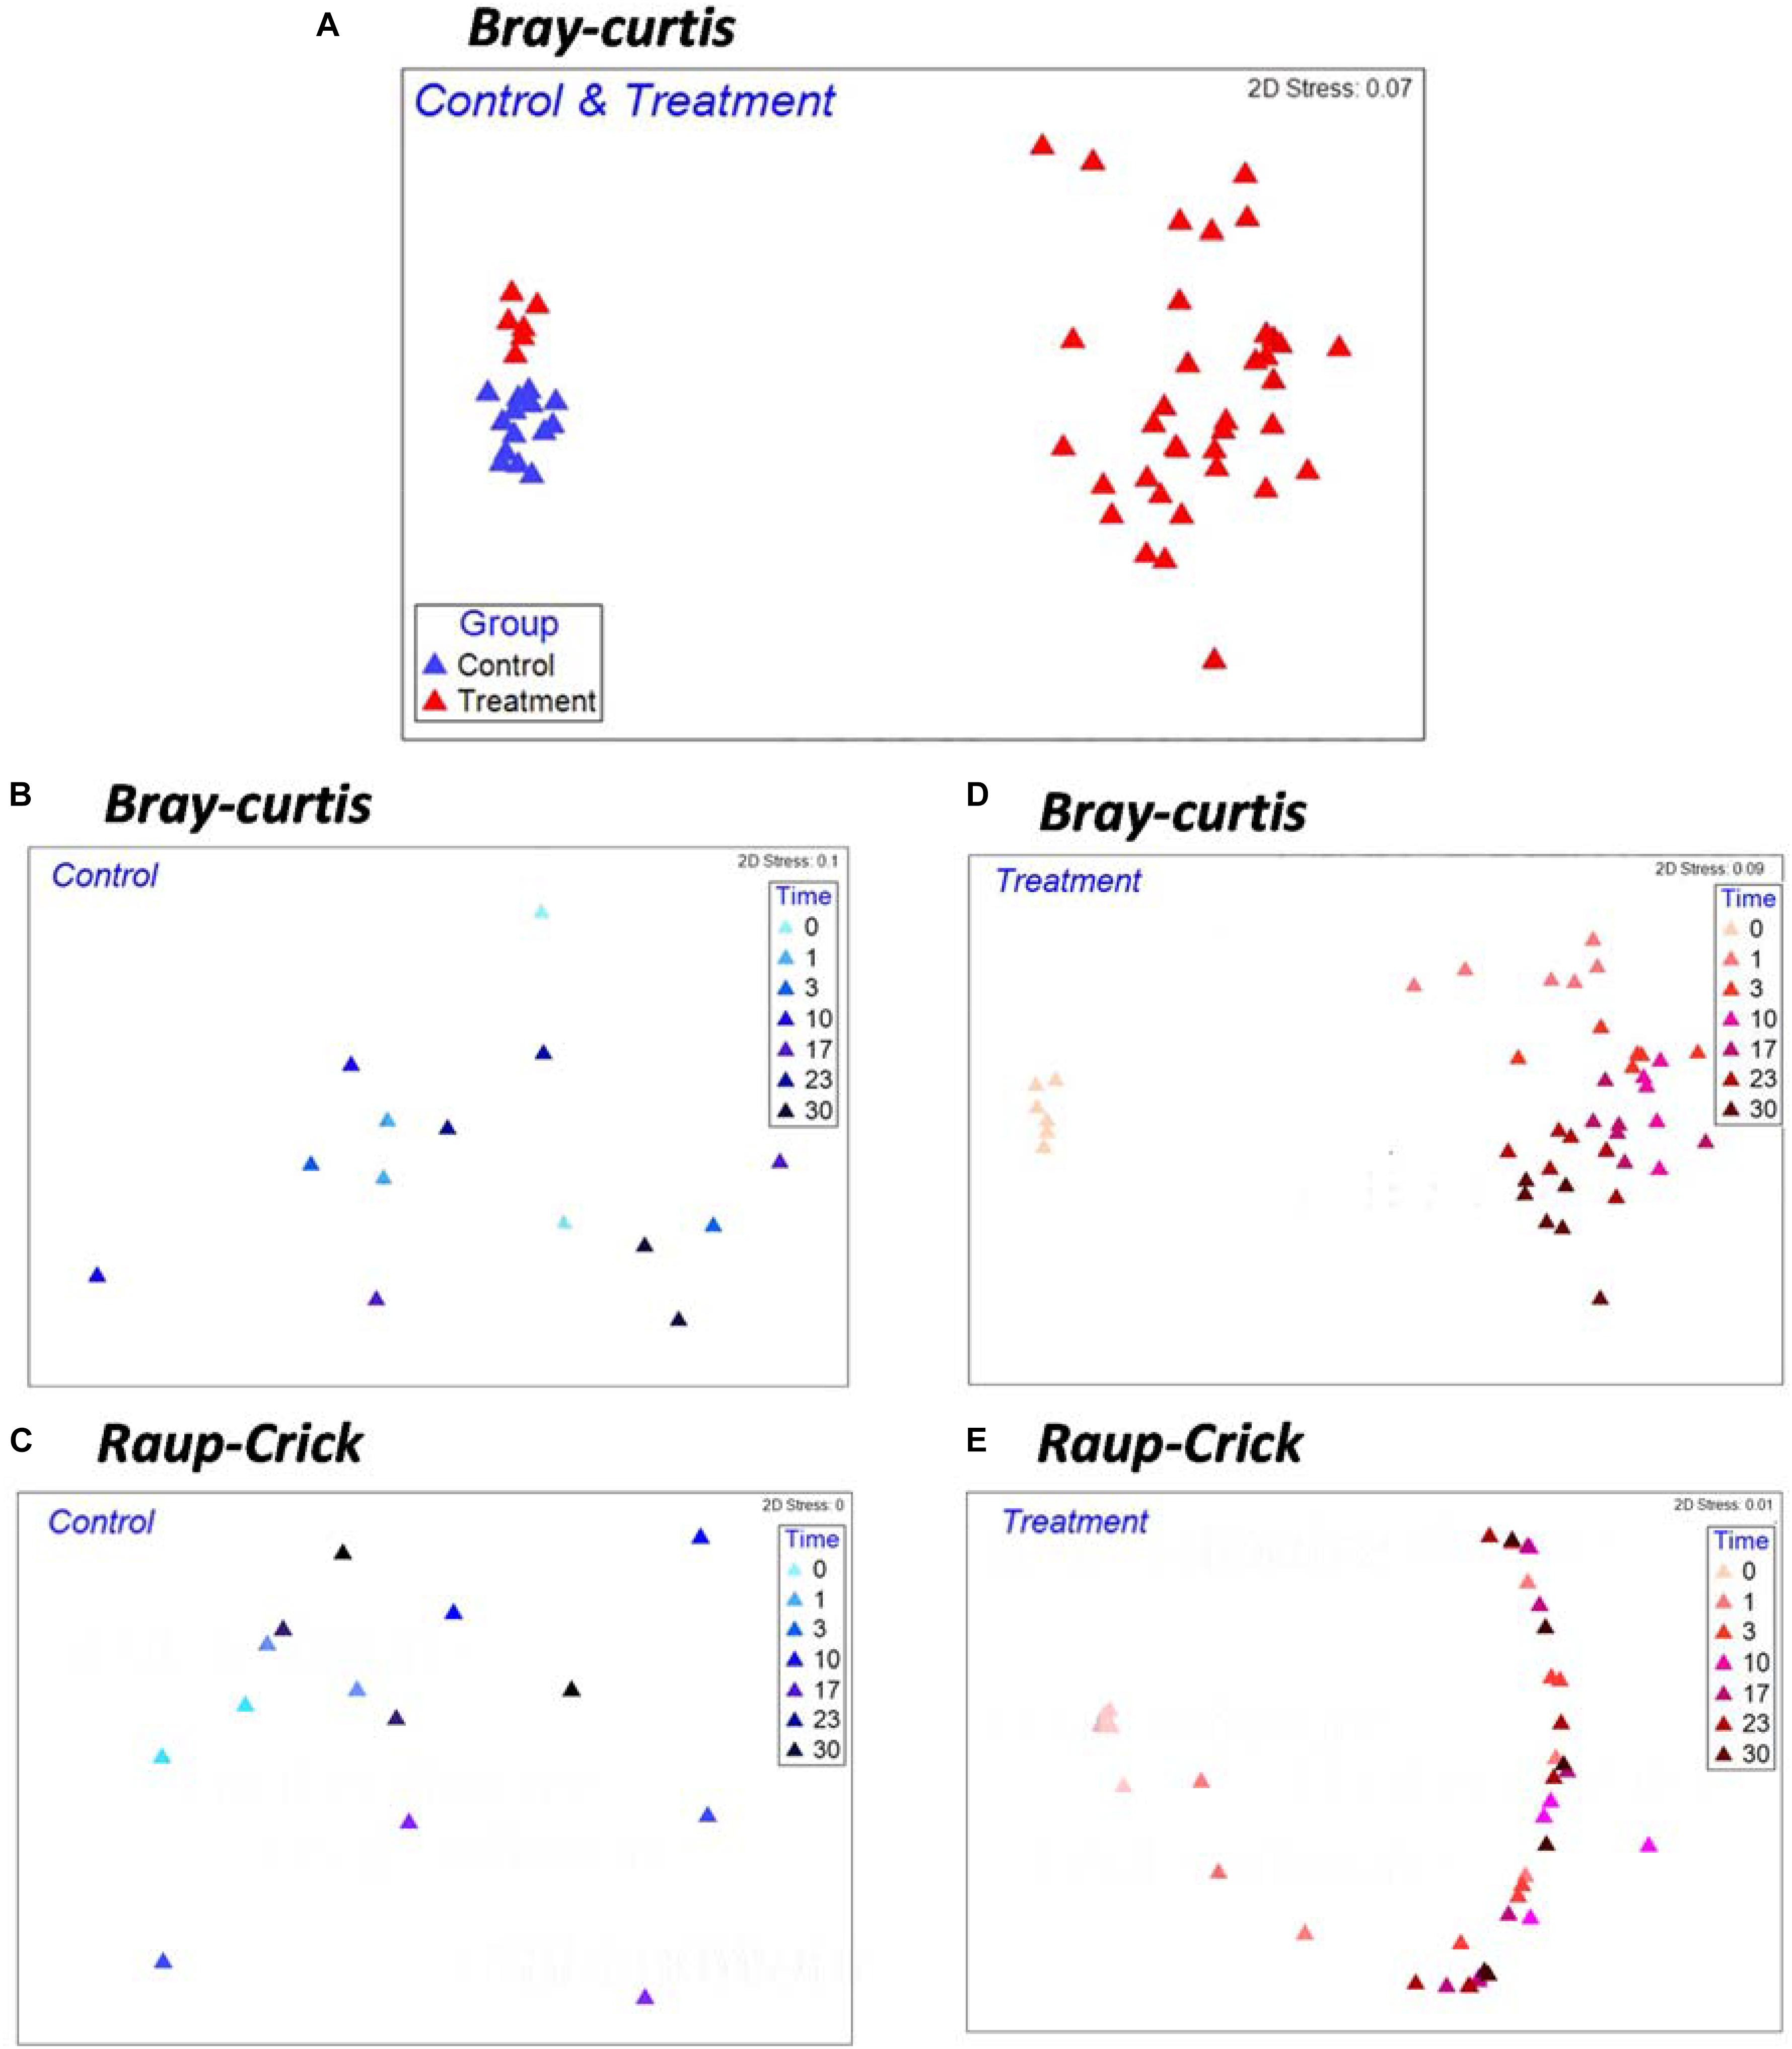
Figure 2. Non-metric multi-dimensional scaling (NMDS) ordinations based on Bray–Curtis Index (A,B,D) and βRC (C,E) for Control and Treatment examining the effects of Microcystis biomass addition on patterns of microbial community compositions. Each symbol in the NMDS plot represents a sample collected during the incubation.
We observed systematic successions of the relative abundances of dominant OTUs (Figure 3A) during Microcystis degradation (Figure 3B). Based on the AIC test, microbial successions can be classified into three distinct types (Figure 3C and Table 2). (i) The type I group exhibited an exponential increase in abundance across time. Representative taxa included Bacteroides, Syntrophomonas, and unidentified genera from Bacteroidales and Methanobacteriaceae. (ii) The type II group exhibited a quadratic regression along time with positive binomial coefficients. Representative taxa included Tepidibacter, unidentified Fusobacteriales, Lachnospiriaceae and unidentified genera from Clostridiaceae. The relative abundance sharply increased after the addition of Microcystis and remained relatively stable during the incubation. (iii) The type III group exhibited a quadratic regression along time with negative binomial coefficients. Representative taxa included Clostridium, Dechloromonas, Methanosarcina, and Hydrogenophaga.
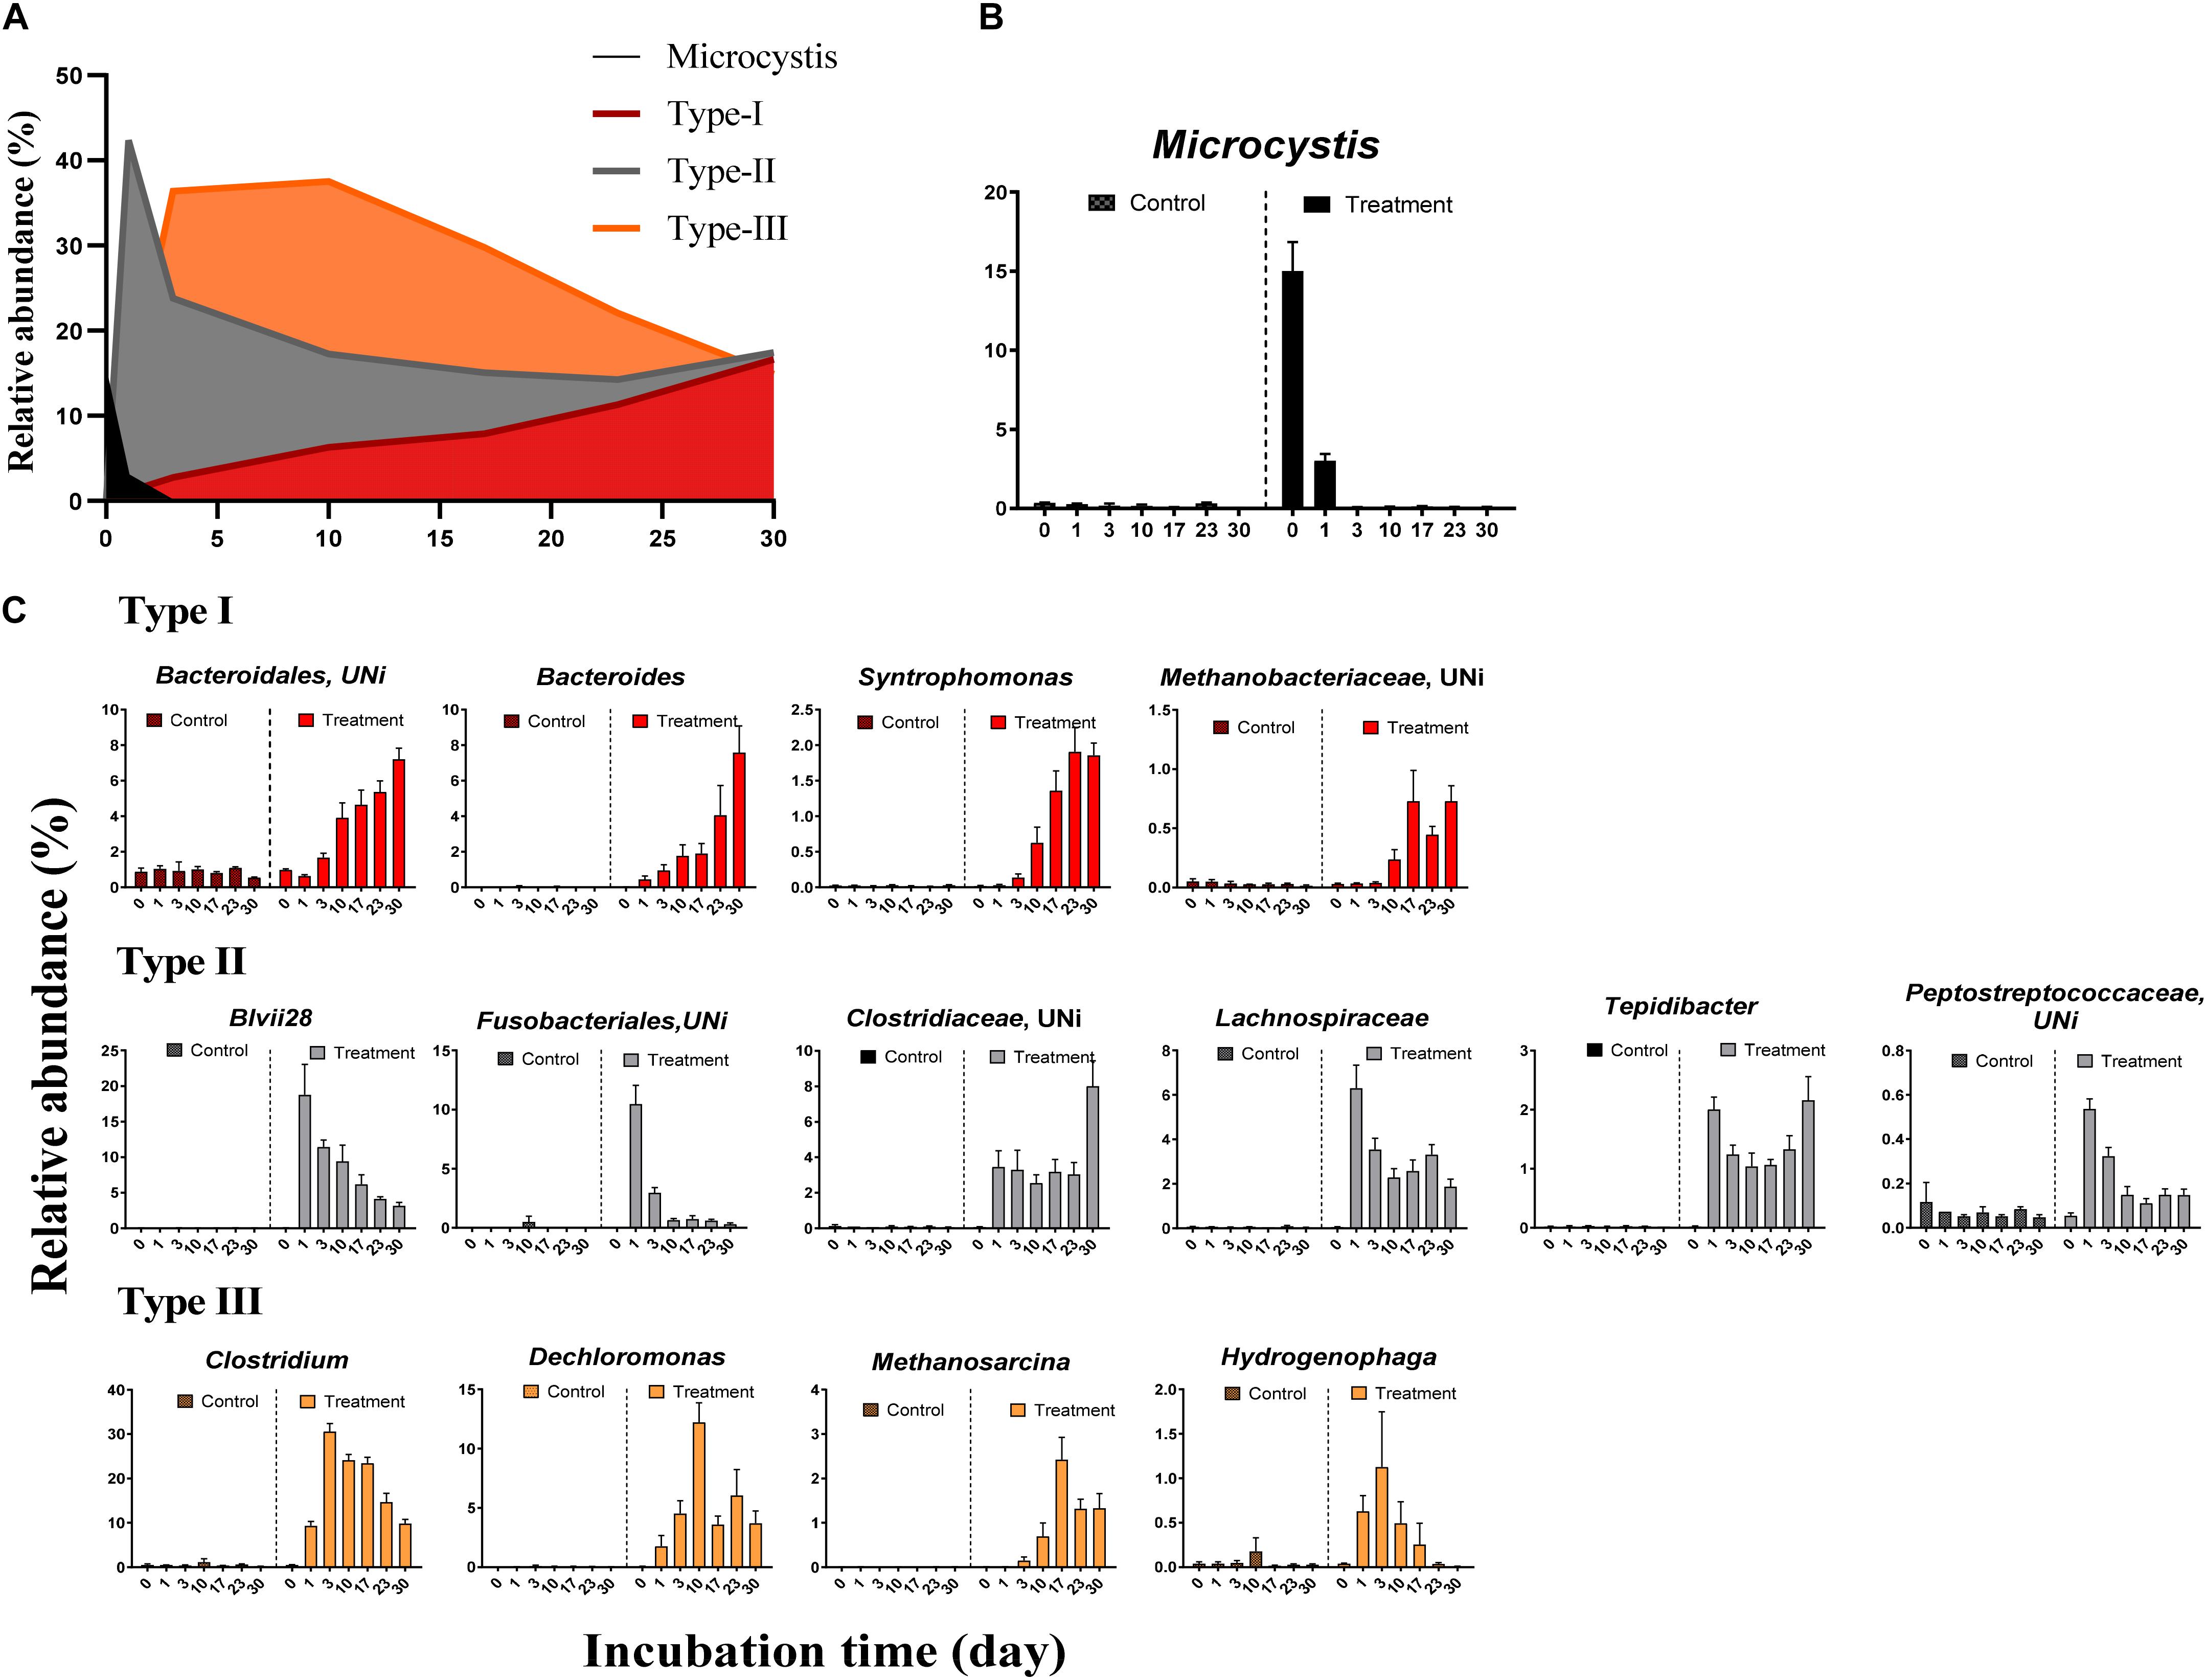
Figure 3. The relative abundance of Microcystis and three distinct microbial groups during the incubation. (A) The overview of relative abundance of Microcystis and three bacterial groups in Treatment samples; (B) the decay of Microcystis along the time; (C) variation of the relative abundance for representative genera in each group. The colors in subfigure of (C) are corresponding to those in panel (A).
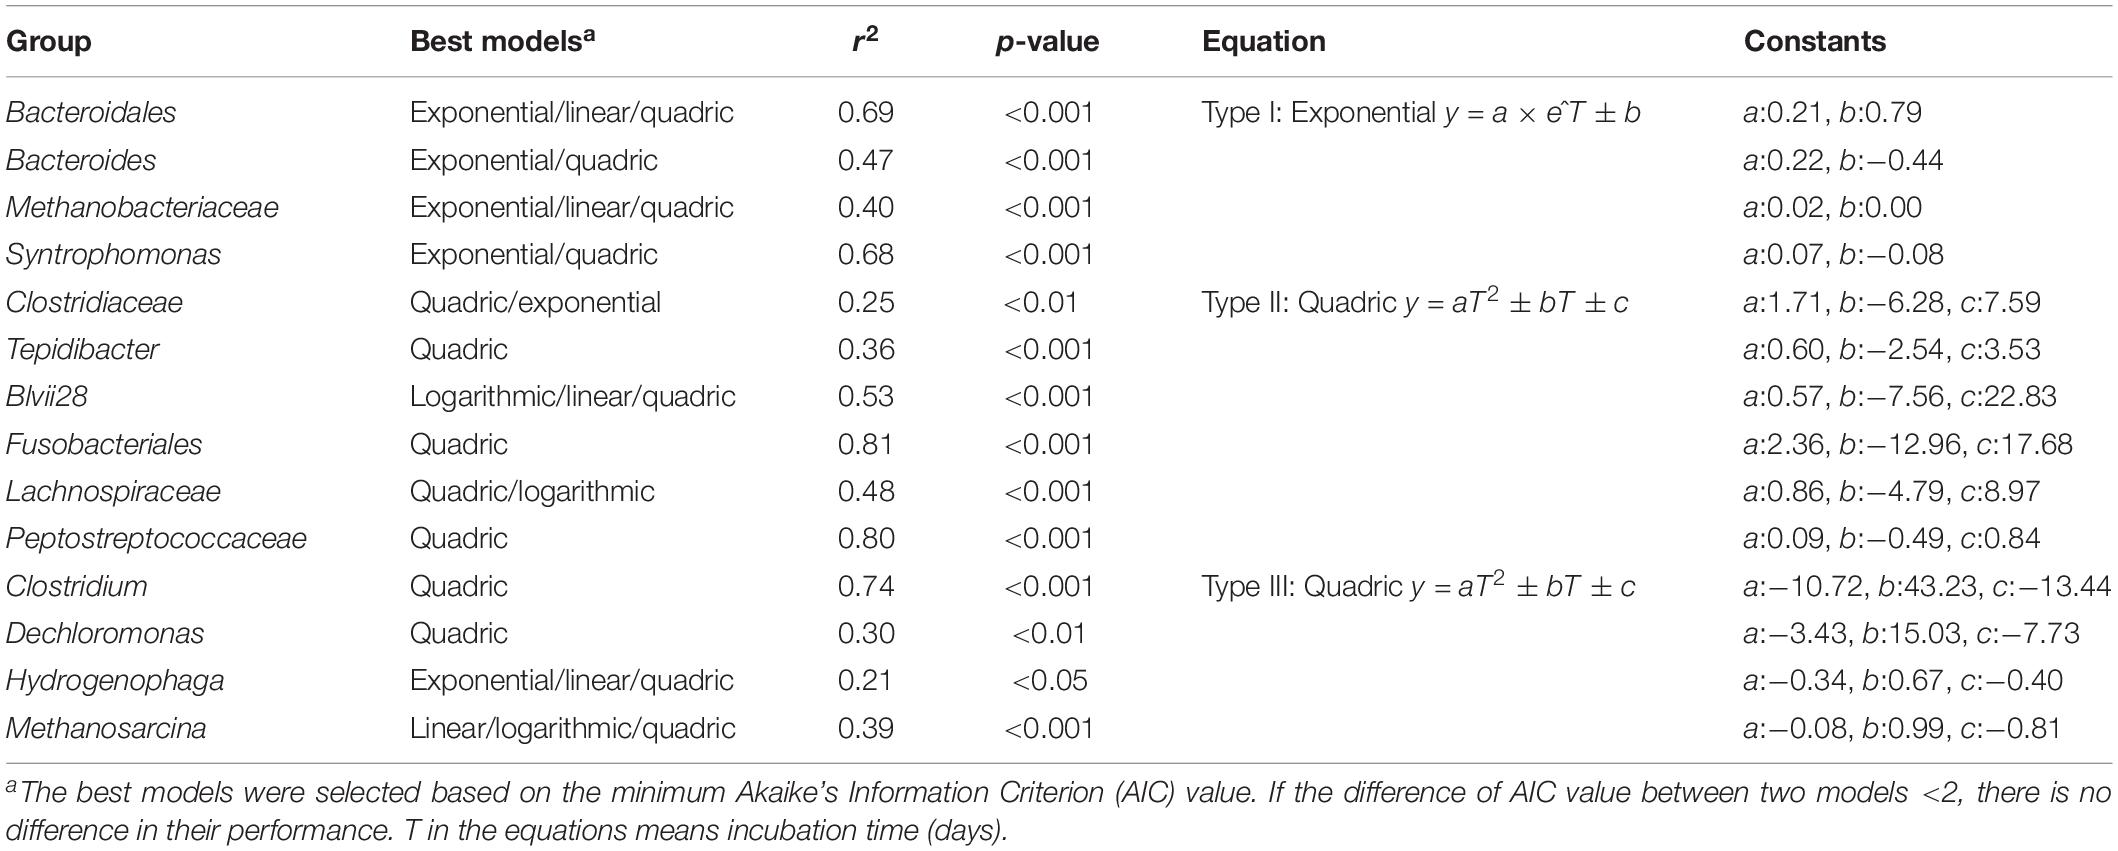
Table 2. The dynamics of the significantly enriched groups were simulated by the multiple regression models.
The differences in the MCC between the control and treatment groups were also significant at coarse taxonomic resolution. For example, at the phylum level, the relative abundances of the abundant phyla in the control group remained stable throughout the experiment. However, in the treatment group, the relative abundances of Firmicutes and Bacteroidetes immediately increased after Microcystis addition, whereas the relative abundances of Proteobacteria and Cyanobacteria (Microcystis) rapidly decreased (Supplementary Figure S2). At the family level, eight families in the treatment group, Clostridiaceae, Lachnospiraceae, Peptostreptococcaceae, Ruminococcaceae, Veillonellaceae, Bacteroidaceae, Rikenellaceae, and Aeromonadaceae immediately increased in abundance after Microcystis addition (Figure 4). Interestingly, five of these families belong to the same order of Clostridiales. The relative abundance of methanogens also steadily increased from 0.8% on day 0 to 3.8% on day 17 and remained stable thereafter (Supplementary Figure S3). In addition to the increasing abundance of methanogens, the families Anaerolinaceae, Spirochaetaceae, Peptococcaceae, and Syntrophomonadaceae also increased in abundance on day 17 (Figure 4).
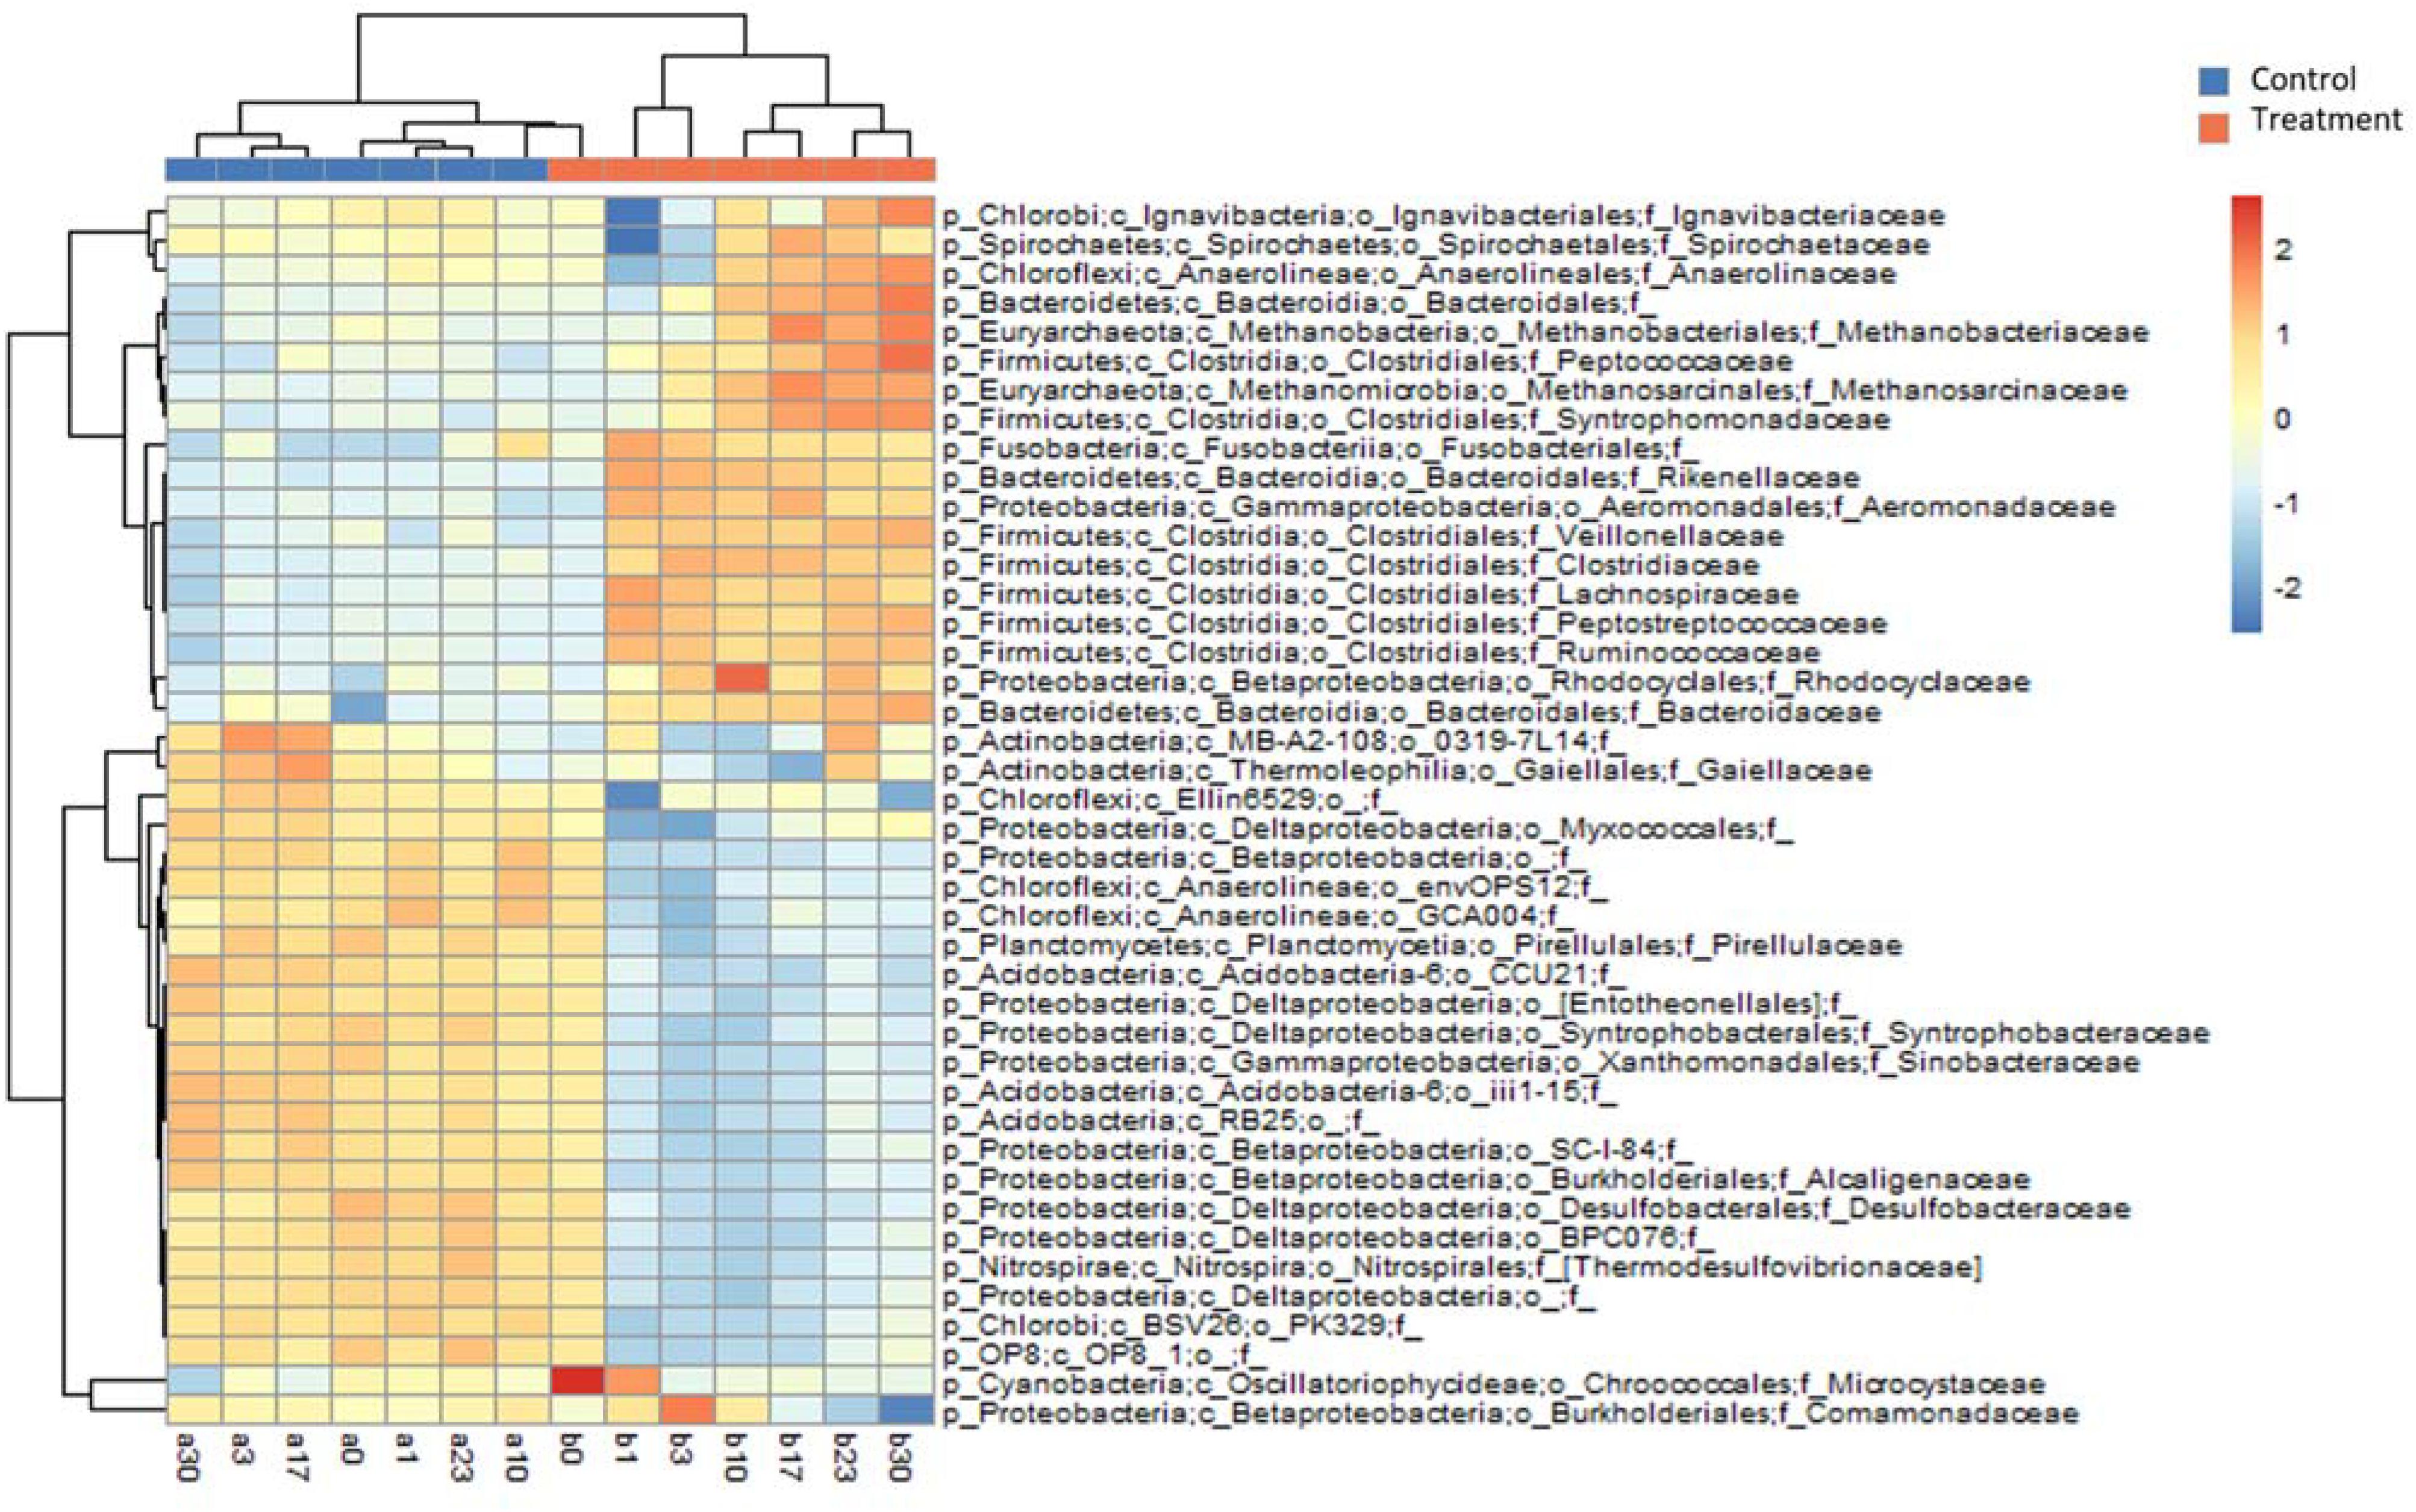
Figure 4. Heatmap diagram showing relative abundances of the top 25 families selected from Control and Treatment (a total of 42 families). Upper dendrogram shows community similarity among samples and left dendrogram depicts clustering of families by co-occurrence.
Based on the network analysis, 157 and 82 nodes were obtained from the control and Treatment, respectively. Positive correlations were predominant in both networks with rare negative correlations (Figure 5). The clustering coefficients and harmonic geodesic distance were significantly different from those of the corresponding random networks with the same network size and average number of links (Table 3), indicating that the MENs in both the control and the treatment showed small-world characteristics. In comparison with the control, MENs in the treatment generally had significantly higher connectivity, higher clustering efficiencies, and fewer modules (Table 3). Focusing on the microbial associations within the treatment group showed that three clusters were distinct in the treatment network (Figure 5). Cluster I, including OTUs affiliated with the phyla Proteobacteria-Acidobacteria-Chloroflexi, showed co-occurrence among most nodes within it, and Cluster II, including the phyla Bacteroidetes-Firmicutes, showed an overall negative connection with Cluster I. Furthermore, Microcystis formed a co-exclusive pattern with other bacterial taxa in Cluster II, and Cluster III, including methanogens, Syntrophomonas and Longilinea, was independent of Cluster I and II.
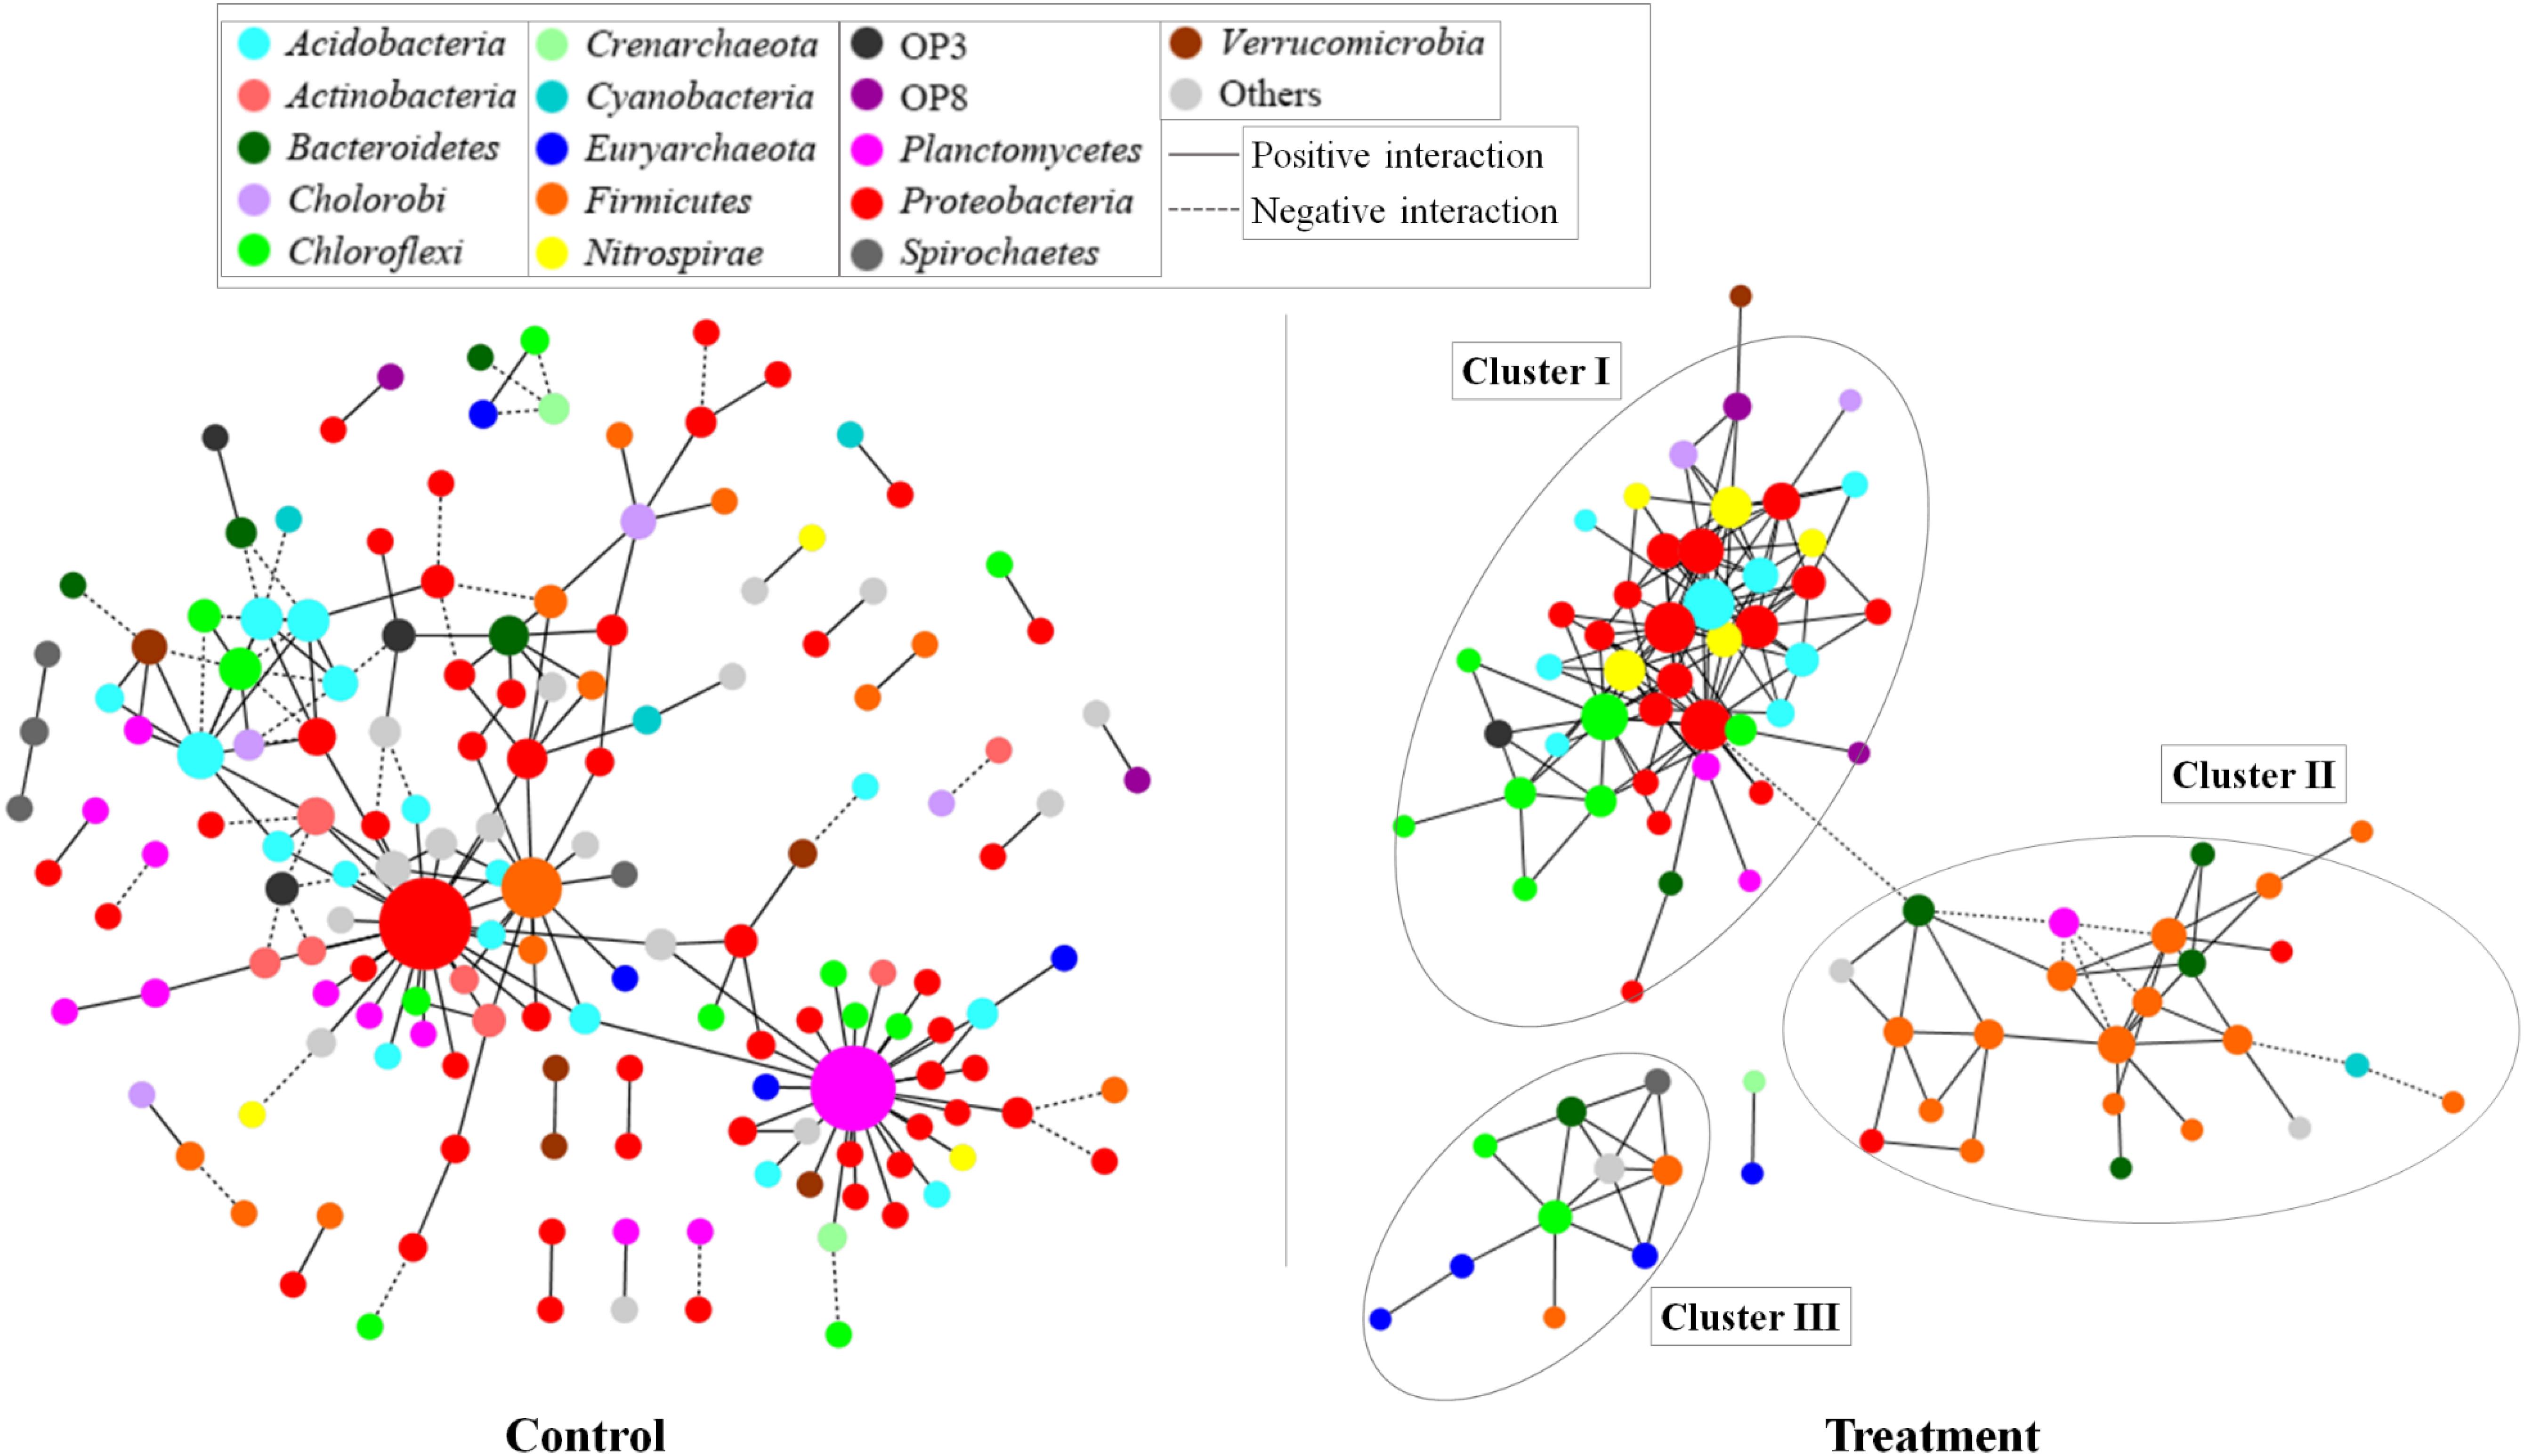
Figure 5. Networks based on correlation analysis of co-occurring bacterial and archaeal genera in a 30-day incubation with (treatment) or without (control) Microcystis addition. A connection between nodes stands for a statistically significant positive (a Spearman’s ρ > 0.8 and p < 0.01, red line) or negative (b Spearman’s ρ < -0.8 and p < 0.01, blue line) correlation. The size of each node is proportional to the number of connections (that is, degree). The nodes were colored by taxonomy, the top 20 abundant phyla are shown in different colors and all the others were in gray.
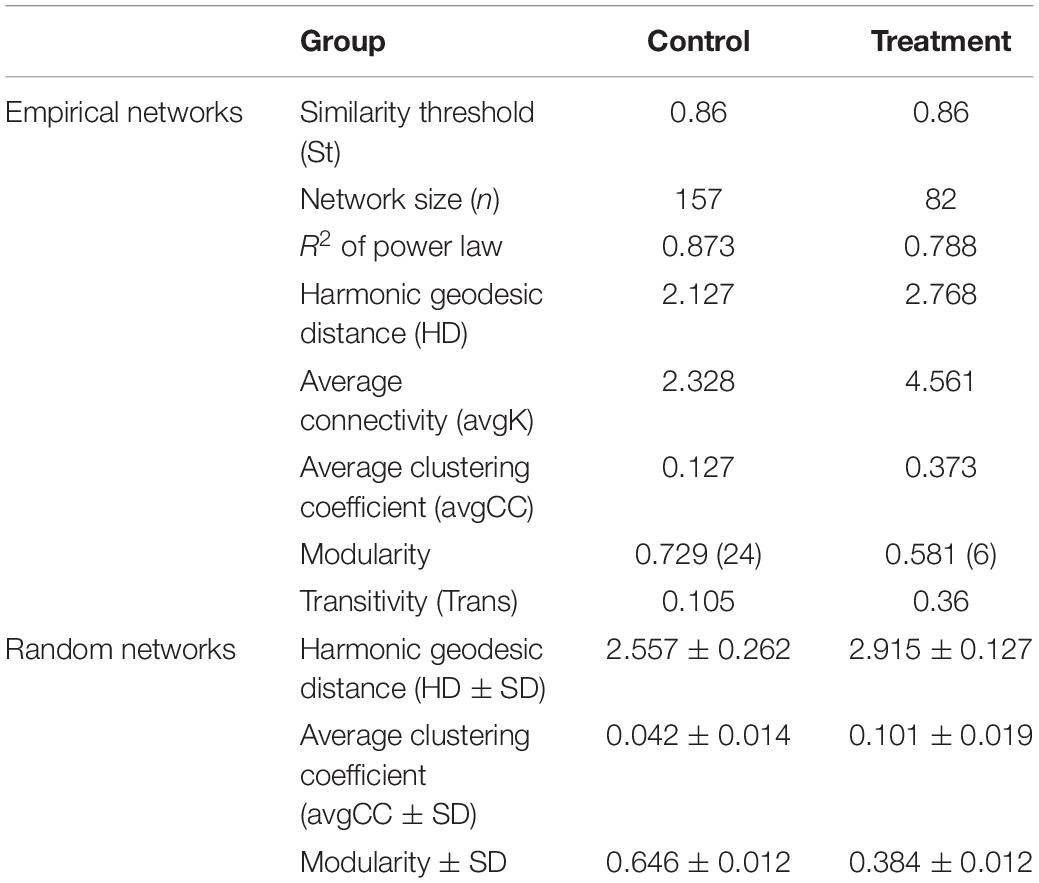
Table 3. Topological properties of the empirical molecular ecological networks (MENs) for the control and treatment group and their associated random MENs.
Functional prediction indicated that17 subpathways I belong to four major categories were significantly different between control and treatment (Figure 6A, p < 0.01). Nine of them were significantly enriched in the microcosms of the treatment group, including membrane transport, replication and repair, carbohydrate metabolism, amino acid metabolism, transcription, metabolism of cofactors and vitamins, nucleotide metabolism, enzyme families, and metabolism of other amino acids. The dynamics of relative frequencies along time are shown in Figure 6B. Five of the nine subpathways I belonged to the category metabolism. In subpathway II, we observed increased frequency of genes distributed in diverse pathways in the treatment group (Supplementary Figure S4). For example, within the carbohydrate metabolism, six metabolic pathways showed higher frequency in the treatment samples: fructose and mannose metabolism, galactose metabolism, starch and sucrose metabolism, the pentose phosphate pathway, pentose and glucuronate interconversions, and amino sugar and nucleotide sugar metabolism.
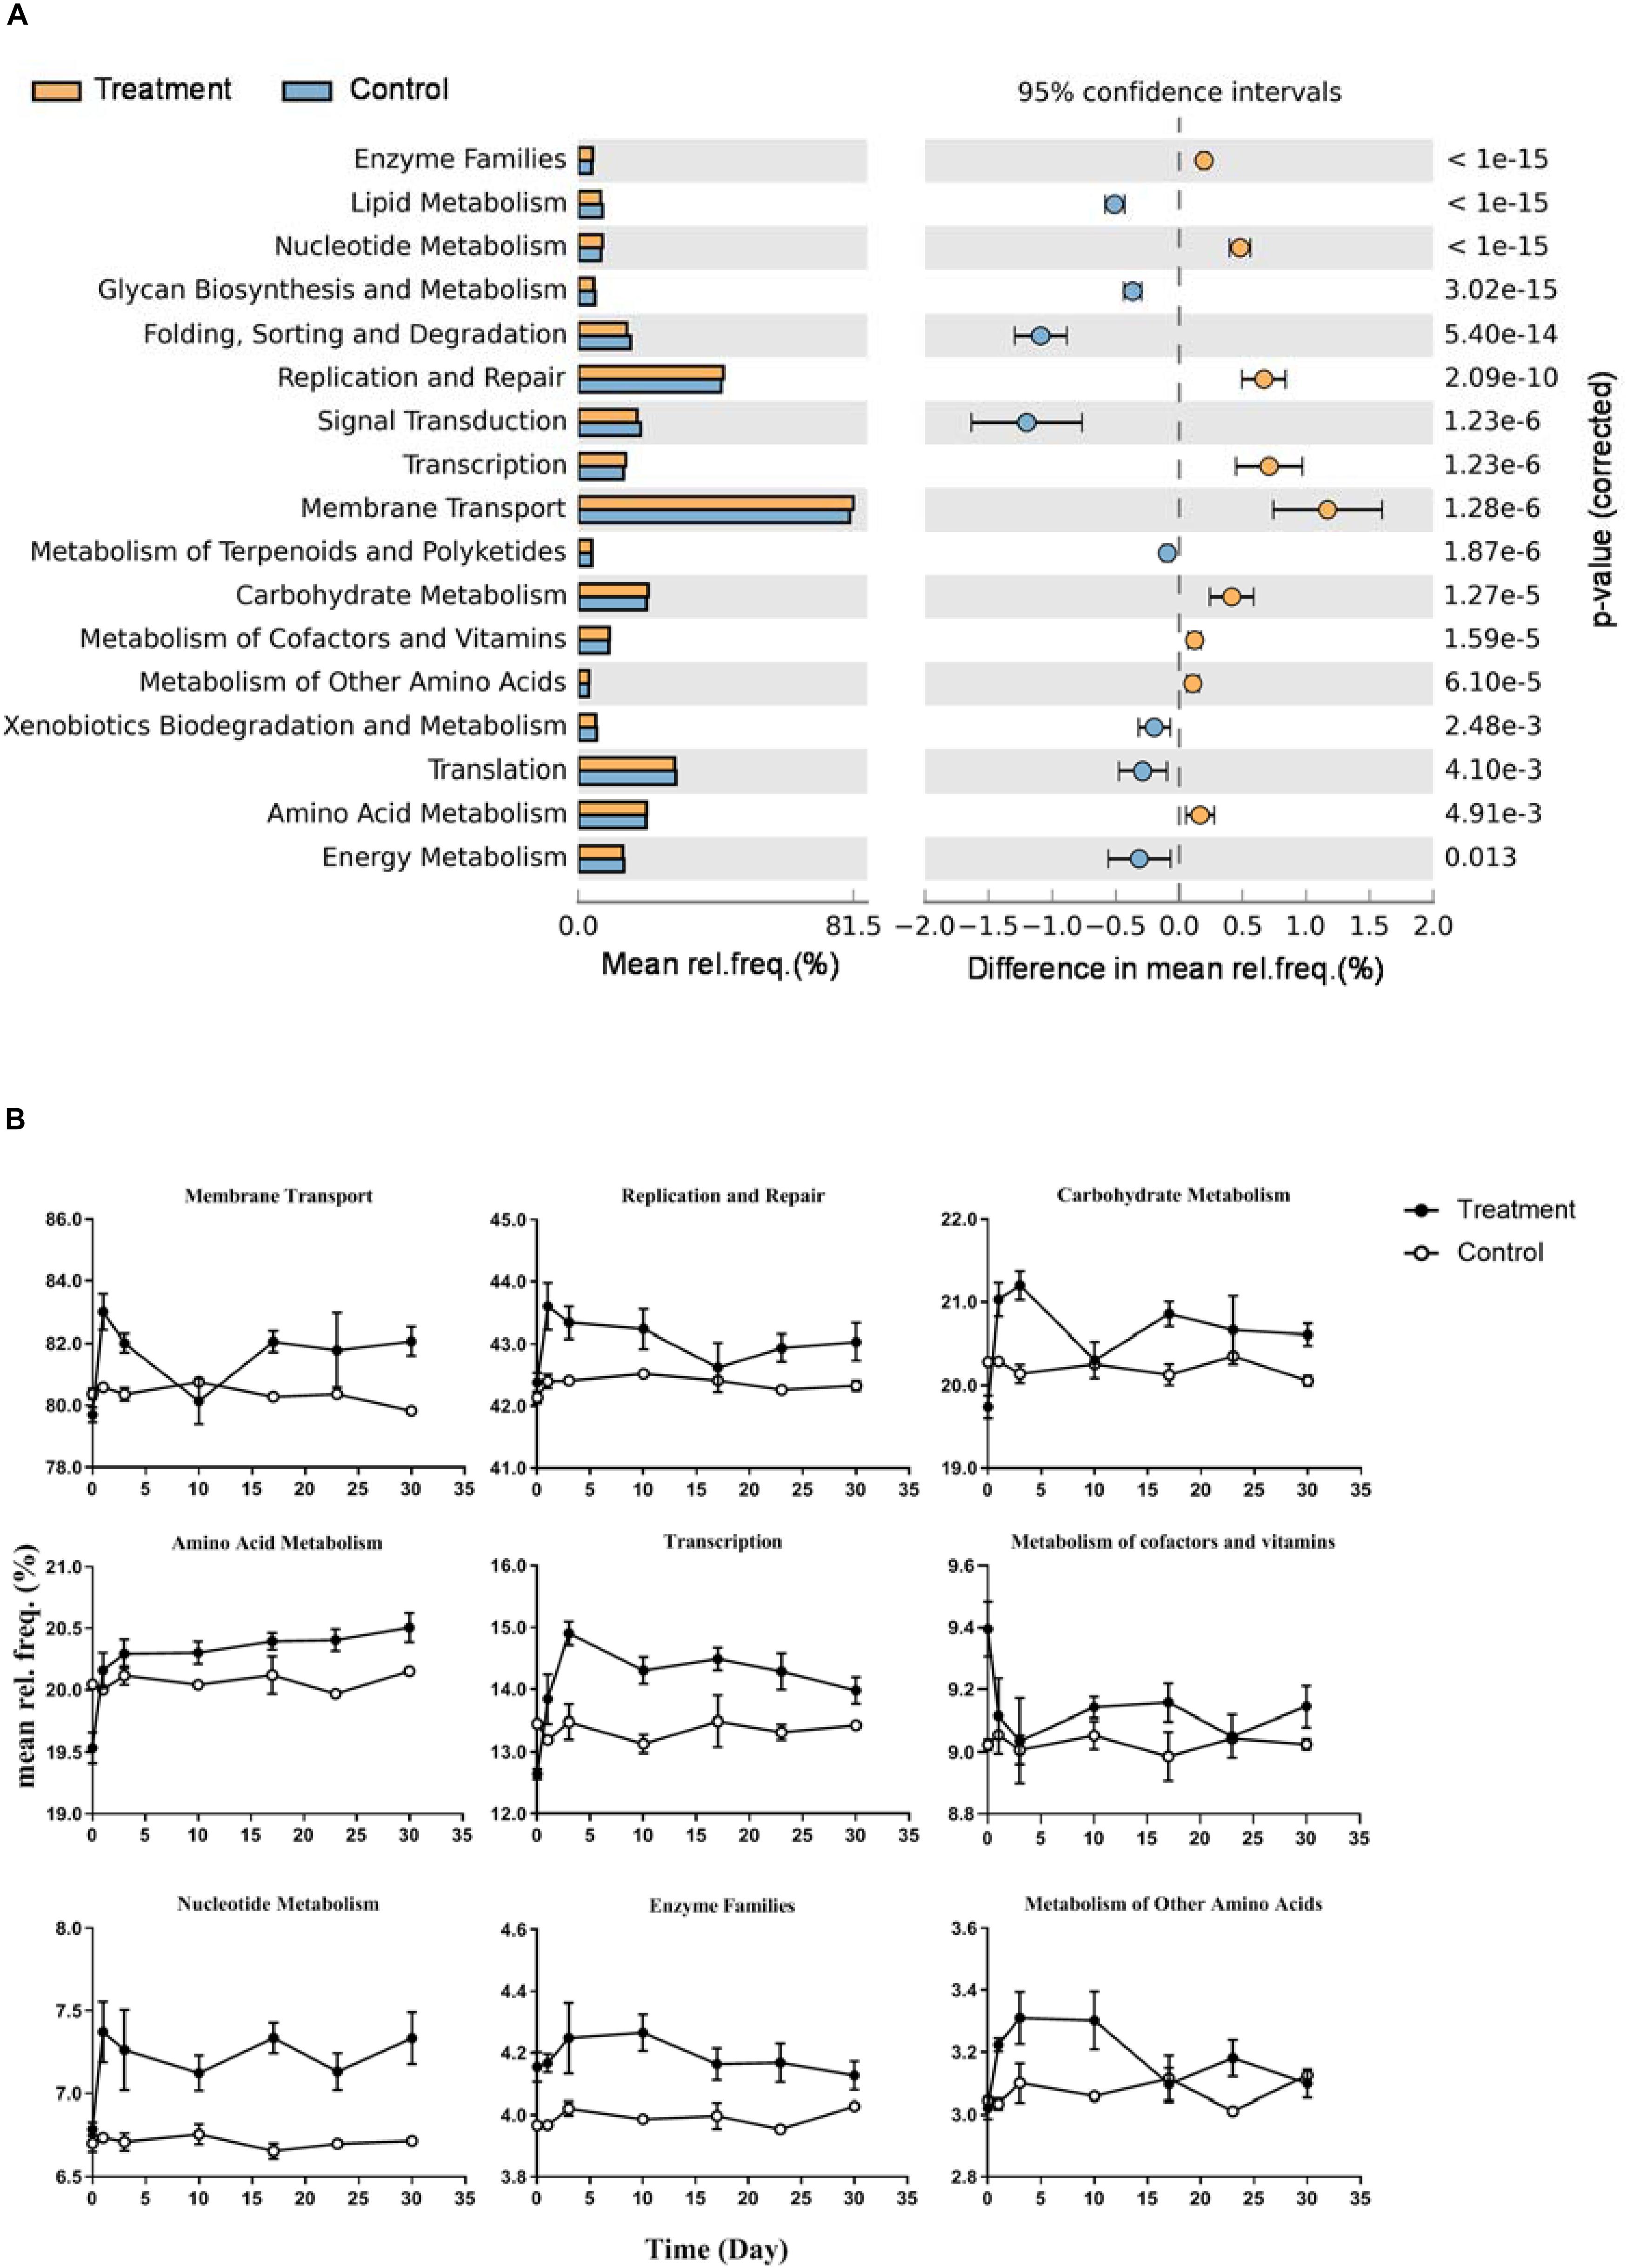
Figure 6. Differences of predicted microbial community function between Control and Treatment throughout the incubation. (A) KEGG subpathway I with significant different relative frequency (rel. freq. %) picked up by STAMP with a two-sided Welch’s t-test of a symptomatic confidence intervals (0.95). Subpathways overrepresented in the Treatment which have a positive value of proportions are indicated by orange filled circles and those overrepresented in the Control are indicated by blue filled circles. (B) Nine line charts showing specific dynamics of the overrepresented pathways in Treatment group (corresponding to orange filled circles in panel A) during the incubation.
Blooming Microcystis form scum, which is massively deposited onto lake sediments, resulting in rapid oxygen depletion on the surface sediment (Xing et al., 2011). A positive correlation between the biomass of Microcystis and CH4 production has been observed in the littoral zones of hypereutrophic Lake Taihu, suggesting that the biomass of Microcystis is actually transformed to CH4 in the field (Wang et al., 2006). The observations of this study further demonstrated that sedimentary Microcystis blooms could enhance the accumulation of CO2 and CH4 in the anaerobic sediment, and this process occurred instantly after Microcystis biomass addition.
In the present study, approximately 14.56 mL of CH4 (equivalent to 7.8 mg carbon, estimated with the gas density of 0.717 g/L at standard condition) was produced from the initial 25 mg dry-weight of Microcystis biomass (equivalent to 9.5 mg carbon with chemical formula C106H263O110N16P, molecular weight 3350 g/mol) during the 30-day anaerobic incubation, indicating an efficient transformation from algal organic carbon to greenhouse gases (∼82.5% conversion efficiency). Based on water content of 99% in living Microcystis cells, 1 kg of wet algal biomass could be degraded with ∼5.82 L of CH4 gas production. In Lake Taihu, cyanobacterial blooms might reproduce at a rate of at least 0.25 million kilograms (weight wet) per year during the whole bloom season (personal communication with Dr. Hongtao Duan). In this case, 1.46 million liters of CH4 (equivalent to 1043 kg) would be generated under anoxic or anaerobic conditions. Please note that this estimate does not take into account the contribution of other organic matter in sediments to the methane formation under anoxic and anaerobic conditions. The real lake ecosystems are much more complex and dynamic than the microcosms built up in this study; therefore, the conversion efficiency from cyanobacterial biomass to CH4 needs to be further evaluated before its application. In any case, methane accounts for approximately 20% of the greenhouse effect (Wuebbles and Hayhoe, 2002; Sessions et al., 2009), significantly contributing to global warming. The present study evidently demonstrates that, under hypertrophic conditions, accumulated CH4 induced by cyanobacterial blooms is an important component of methane budgets in local lakes as well as in the drainage basin (Bastviken et al., 2004b, 2008, 2011).
Although decomposition of organic material under anaerobic conditions is generally assumed to include hydrolysis, acidogenesis, syntrophic acetogenesis, and methanogenesis (Schink, 2002), the composition and dynamics of the microbial communities involved in Microcystis biodegradation is far from well-documented. In the present study, we investigated the MCC based on Illumina Miseq sequencing, enabling the detection of the distinct pattern of microbial successions during Microcystis degradation.
During the hydrolysis phase, Bacteroides spp. and an unidentified genus in Bacteroidales continuously increased in abundance (type I group). The superb ability of these bacteria for degradation of polymers, particularly various types of polysaccharides (Wexler, 2007; Ravcheev et al., 2013), initiated flourishing during Microcystis degradation. The bacteria taxa belong to type II, such as the Blvii28 group (Rikenellaceae), Fusobacteriales, Lachnospiraceae, and Peptostreptococcaceae, rapidly responded to Microcystis biomass addition and peaked at Day 1. Most of them were considered as hydrolytic fermenting bacteria in the degradation of complex polysaccharides (Tholozan et al., 1992; Bennett and Eley, 1993; Schink, 2002; Zhou L. et al., 2015). Some of the 16S rRNA sequences from Blvii28 were highly similar (∼99% identity) with that of Acetobacteroides hydrogenigenes, which is involved in the conversion of carbohydrates to acetate and CO2 (Su et al., 2014). Clostridium and Dechloromonas from the type III group also strongly increased in abundance during the initial days of incubation. Bacteria in the genus Clostridium are commonly known as hydrolytic (saccharolytic and proteolytic) and fermentative bacteria that can ferment various polysaccharides to volatile fatty acids, H2, and CO2 (Ruan et al., 2014; Deng et al., 2015). The importance of Clostridium species during the anaerobic degradation of organic material in freshwater environments has previously been identified (Mallet et al., 2004; Xing et al., 2011), and Dechloromonas is frequently detected in various degradation and nitrate reduction processes of monoaromatic compounds (Coates et al., 2001).
The increase in the abundance of syntrophic bacteria after Day 10 reflected the accumulation of fatty acid intermediates during Microcystis biomass decomposition. Syntrophic acetogens (in type I group), such as Syntrophomonas, was significantly promoted during Microcystis degradation, suggesting that these species are more likely to utilize the intermediates generated from Microcystis hydrolysis. Syntrophomonas species utilize a variety of fatty acids ranging from C4 to C8 or other longer fatty acids and coexist with butyrate-producing bacteria (McInerney et al., 1981, 2008).
Methanogens, such as Methanobacteriaceae and Methanosarcina species, were significantly enriched during the degradation. The most dominant Methanosarcina reached the highest abundance on day 17. Species within Methanosarcina can use all the methanogenic substrates, H2 and CO2, methanol, methylamine, methyl sulfides, and acetate, except for format (Galagan et al., 2002; Lambie et al., 2015). The increase in the abundance of these methanogens suggested that diverse substrates were available for CH4 synthesis.
Overall, hydrolytic-fermenting bacteria (such as Blvii28 group, Clostridium, and Bacteroidales species), syntrophic acetogens (Syntrophomonas), and methanogens (Methanobacteriaceae and Methanosarcina) were significantly enriched, and their succession patterns suggested that these microbial groups might possess unique substrate utilization preferences and could synergistically function during the degradation of Microcystis.
Studies have shown that ecosystem properties greatly depend on biodiversity due to differences in the functional characteristics of organisms present in the ecosystem (Bell et al., 2005; Hooper et al., 2005). Based on diversity-stability relationships (Naeem and Li, 1997), the lower α-diversity (Shannon and PD index) in the treatment group indicated a weaker anti-interference ability of the microbial community during Microcystis degradation. Moreover, good consistency was found between the realistic Bray–Curtis dissimilarity and the probabilistic βRC index for the treatment, which suggested the relative importance of deterministic (niche-related) processes in their microbial community assembly. Therefore, the input of organic matter imposed as a systematic ecological filtering to enhance partial members with specific functional characteristics in the community (Zhang et al., 2018).
During the anaerobic decomposition of Microcystis, the relative frequency and dominance of metabolic pathways significantly varied at each phase, uncovering the non-overlapping niches of the functional groups in the process. Mannose is one of the most abundant mono-saccharides within the Microcystis cells (Jürgens et al., 1989). The relative frequency of fructose and mannose metabolism pathways was significantly higher in the treatment group, which suggested that mannose in the biomass could be effectively transformed during the decomposition. Not only that, the enriched amino acid metabolism and secreted peptidases suggested that Microcystis biomass could provide plenty of carbon and nitrogen sources for the co-existing microbiomes. Furthermore, the phosphotransferase system plays an important role in the transportation and phosphorylation of numerous mono-saccharides, disaccharides, amino sugars, and other sugar derivatives through the bacterial cell membrane (Deutscher et al., 2006). The higher frequency of the phosphotransferase system in the treatment group indicated the transportation of those small-molecule intermediates following initial extracellular hydrolysis.
In the ecological processes, microorganisms interact with each other and therefore form a complex network within the communities. MENs construction is an ideal way to characterize the species co-occurring pattern in an ecosystem. In general, positive links could be attributed to niche overlap or cross-feeding, and negative links could be attributed to competition or antagonism (Faust and Raes, 2012). In the present study, co-existing taxa in the treatment group was much more connected and clustered than those in the control group, which implied that the decomposition of Microcystis or utilization of Microcystis substrates required inter-specific cooperation among various functional groups. The lower modularity in treatment group indicated a less resistance of the system to disturbance. Therefore, the enhanced connection in the community might be an adaptive mechanism in response to massive disturbance, i.e., the organic matter impulse.
Taken together, the community dynamics, predicted functions and network analysis reflected the transition of the microbial communities toward a low diverse, high connected and high effective situation for the nutrient assimilation during algal carbon/nitrogen transformation.
The datasets generated for this study can be found in NCBI, https://www.ncbi.nlm.nih.gov/bioproject/?term=PRJEB21014.
Y-FW did the experiment and data analysis. PX provided most of the idea of data treatment and wrote the manuscript. SL and QW did the experiment design and revised the manuscript.
This study was supported by the National Natural Science Foundation of China (41621002, 31670505, and 31722008), Key Research Program of Frontier Sciences, CAS (Grant Number QYZDJ-SSW-DQC030), and the Youth Innovation Promotion Association of CAS (Grant Number 2014273).
The authors declare that the research was conducted in the absence of any commercial or financial relationships that could be construed as a potential conflict of interest.
The Supplementary Material for this article can be found online at: https://www.frontiersin.org/articles/10.3389/fmicb.2019.02474/full#supplementary-material
Anderson, M. J. (2001). A new method for non-parametric multivariate analysis of variance. Austral. Ecol. 26, 32–46. doi: 10.1111/j.1442-9993.2001.01070.pp.x
Bastviken, D., Cole, J. J., Pace, M. L., and Tranvik, L. (2004a). Methane emissions from lakes: dependence of lake characteristics, two regional assessments, and a global estimate. Global. Biogeochem. Cycles 18:GB4009.
Bastviken, D., Persson, L., Odham, G., and Tranvik, L. (2004b). Degradation of dissolved organic matter in oxic and anoxic lake water. Limnol. Oceanogr. 49, 109–116. doi: 10.4319/lo.2004.49.1.0109
Bastviken, D., Cole, J. J., Pace, M. L., and Van de Bogert, M. C. (2008). Fates of methane from different lake habitats: connecting whole-lake budgets and CH4 emissions. J. Geophys. Res. 113:G02024.
Bastviken, D., Tranvik, L. J., Downing, J. A., Crill, P. M., and Enrich-Prast, A. (2011). Freshwater methane emissions offset the continental carbon sink. Science 331:50. doi: 10.1126/science.1196808
Bell, T., Newman, J. A., Silverman, B. W., Turner, S. L., and Lilley, A. K. (2005). The contribution of species richness and composition to bacterial services. Nature 436, 1157–1160. doi: 10.1038/nature03891
Bennett, K. W., and Eley, A. (1993). Fusobacteria - new taxonomy and related diseases. J. Med. Microbiol. 39, 246–254. doi: 10.1099/00222615-39-4-246
Bozdogan, H. (1987). Model selection and Akaike’s Information Criterion (AIC): the general theory and its analytical extensions. Psychometrika 52, 345–370. doi: 10.1007/bf02294361
Bru, D., Martin-Laurent, F., and Philippot, L. (2008). Quantification of the detrimental effect of a single primer-template mismatch by real-time PCR using the 16S rRNA gene as an example. Appl. Environ. Microbiol. 74, 1660–1663. doi: 10.1128/AEM.02403-07
Caporaso, J. G., Kuczynski, J., Stombaugh, J., Bittinger, K., Bushman, F. D., Costello, E. K., et al. (2010). QIIME allows analysis of high-throughput community sequencing data. Nat. Methods 7, 335–336.
Chase, J. M., Kraft, N. J. B., Smith, K. G., Vellend, M., and Inouye, B. D. (2011). Using null models to disentangle variation in community dissimilarity from variation in α-diversity. Ecosphere 2, 1–11.
Chen, M., Chen, F., Xing, P., Li, H., and Wu, Q. L. (2010). Microbial eukaryotic community in response to Microcystis spp. bloom, as assessed by an enclosure experiment in lake Taihu. FEMS Microbiol. Ecol. 74, 19–31. doi: 10.1111/j.1574-6941.2010.00923.x
Coates, J. D., Chakraborty, R., Lack, J. G., O’Connor, S. M., Cole, K. A., Bender, K. S., et al. (2001). Anaerobic benzene oxidation coupled to nitrate reduction in pure culture by two strains of Dechloromonas. Nature 411, 1039–1043. doi: 10.1038/35082545
Cole, J. J., Caraco, N. F., Kling, G. W., and Kratz, T. K. (1994). Carbon-dioxide supersaturation in the surface waters of lakes. Science 265, 1568–1570. doi: 10.1126/science.265.5178.1568
Deng, L., Mori, Y., Sermsathanaswadi, J., Apiwatanapiwat, W., and Kosugi, A. (2015). Cellulose hydrolysis ability of a Clostridium thermocellum cellulosome containing small-size scaffolding protein CipA. J. Biotechnol. 212, 144–152. doi: 10.1016/j.jbiotec.2015.08.016
Deng, Y., Jiang, Y. H., Yang, Y. F., He, Z. L., Luo, F., and Zhou, J. Z. (2012). Molecular ecological network analyses. BMC Bioinformatics 13:113. doi: 10.1186/1471-2105-13-113
Deutscher, J., Francke, C., and Postma, P. W. (2006). How phosphotransferase system-related protein phosphorylation regulates carbohydrate metabolism in bacteria. Microbiol. Mol. Biol. Rev. 70, 939–1031. doi: 10.1128/mmbr.00024-06
Edgar, R. C. (2010). Search and clustering orders of magnitude faster than BLAST. Bioinformatics 26, 2460–2461. doi: 10.1093/bioinformatics/btq461
Edgar, R. C. (2013). UPARSE: highly accurate OTU sequences from microbial amplicon reads. Nat. Methods 10, 996–998. doi: 10.1038/nmeth.2604
Edgar, R. C., Haas, B. J., Clemente, J. C., Quince, C., and Knight, R. (2011). UCHIME improves sensitivity and speed of chimera detection. Bioinformatics 27, 2194–2200. doi: 10.1093/bioinformatics/btr381
Faust, K., and Raes, J. (2012). Microbial interactions: from networks to models. Nat. Rev. Microbiol. 10, 538–550. doi: 10.1038/nrmicro2832
Galagan, J. E., Nusbaum, C., Roy, A., Endrizzi, M. G., Macdonald, P., FitzHugh, W., et al. (2002). The genome of M. acetivorans reveals extensive metabolic and physiological diversity. Genome Res. 12, 532–542. doi: 10.1101/gr.223902
Graue, J., Engelen, B., and Cypionka, H. (2012). Degradation of cyanobacterial biomass in anoxic tidal-flat sediments: a microcosm study of metabolic processes and community changes. ISME J. 6, 660–669. doi: 10.1038/ismej.2011.120
Hammer, Ø, Harper, D. A., and Ryan, P. D. (2001). PAST: paleontological statistics software package for education and data analysis. Palaeontol. Electron. 4, 1–9.
Hooper, D. U., Chapin, F. S. III, Ewel, J. J., Hector, A., Inchausti, P., Lavorel, S., et al. (2005). Effects of biodiversity on ecosystem functioning: a consensus of current knowledge. Ecol. Monogr. 75, 3–35. doi: 10.1111/brv.12110
Jürgens, U. J., Martin, C., and Weckesser, J. (1989). Cell-wall constituents of Microcystis sp. PCC 7806. FEMS Microbiol. Lett. 53, 47–51. doi: 10.1016/0378-1097(89)90364-9
Kanehisa, M., Goto, S., Sato, Y., Kawashima, M., Furumichi, M., and Tanabe, M. (2014). Data, information, knowledge and principle: back to metabolism in KEGG. Nucleic Acids Res. 42, D199–D205. doi: 10.1093/nar/gkt1076
Karlson, A. M. L., Nascimento, F. J. A., and Elmgren, R. (2008). Incorporation and burial of carbon from settling cyanobacterial blooms by deposit-feeding macrofauna. Limnol. Oceanogr. 53, 2754–2758. doi: 10.4319/lo.2008.53.6.2754
Lambie, S. C., Kelly, W. J., Leahy, S. C., Li, D., Reilly, K., McAllister, T. A., et al. (2015). The complete genome sequence of the rumen methanogen Methanosarcina barkeri CM1. Stand. Genomic Sci. 10:57. doi: 10.1186/s40793-015-0038-5
Langille, M. G., Zaneveld, J., Caporaso, J. G., McDonald, D., Knights, D., Reyes, J. A., et al. (2013). Predictive functional profiling of microbial communities using 16S rRNA marker gene sequences. Nat. Biotechnol. 31, 814–821. doi: 10.1038/nbt.2676
Li, H., Xing, P., and Wu, Q. L. (2012). Characterization of the bacterial community composition in a hypoxic zone induced by Microcystis blooms in lake Taihu. China. FEMS Microbiol. Ecol. 79, 773–784. doi: 10.1111/j.1574-6941.2011.01262.x
Li, Z., Haynes, R., Sato, E., Shields, M. S., Fujita, Y., and Sato, C. (2014). Microbial community analysis of a single chamber microbial fuel cell using potato wastewater. Water Environ. Res. 86, 324–330. doi: 10.2175/106143013x13751480308641
Mallet, C., Basset, M., Fonty, G., Desvilettes, C., Bourdier, G., and Debroas, D. (2004). Microbial population dynamics in the sediments of a eutrophic lake (Aydat. Microb. Ecol. 48, 66–77. doi: 10.1007/s00248-003-2017-4
McInerney, M. J., Bryant, M. P., Hespell, R. B., and Costerton, J. W. (1981). Syntrophomonas wolfei gen. nov. sp. nov, an anaerobic, syntrophic, fatty-acid oxidizing bacterium. Appl. Environ. Microbiol. 41, 1029–1039.
McInerney, M. J., Struchtemeyer, C. G., Sieber, J., Mouttaki, H., Stams, A. J. M., Schink, B., et al. (2008). Physiology, ecology, phylogeny, and genomics of microorganisms capable of syntrophic metabolism. Ann. N. Y. Acad. Sci. 1125, 58–72. doi: 10.1196/annals.1419.005
Naeem, S., and Li, S. B. (1997). Biodiversity enhances ecosystem reliability. Nature 390, 507–509. doi: 10.1038/37348
Narihiro, T., Kim, N. K., Mei, R., Nobu, M. K., and Liu, W. T. (2015). Microbial community analysis of anaerobic reactors treating soft drink wastewater. PLoS One 10:e0119131. doi: 10.1371/journal.pone.0119131
Nunoura, T., Oida, H., Toki, T., Ashi, J., Takai, K., and Horikoshi, K. (2006). Quantification of mcrA by quantitative fluorescent PCR in sediments from methane seep of the nankai trough. FEMS Microbiol. Ecol. 57, 149–157. doi: 10.1111/j.1574-6941.2006.00101.x
Paerl, H. W., Fulton, R. S., Moisander, P. H., and Dyble, J. (2001). Harmful freshwater algal blooms, with an emphasis on Cyanobacteria. Sci. World J. 1, 76–113. doi: 10.1100/tsw.2001.16
Parks, D. H., Tyson, G. W., Hugenholtz, P., and Beiko, R. G. (2014). STAMP: statistical analysis of taxonomic and functional profiles. Bioinformatics 30, 3123–3124. doi: 10.1093/bioinformatics/btu494
R Development Core Team (2011). R: A Language and Environment for Statistical Computing. Vienna: R Foundation for Statistical Computing.
Ravcheev, D. A., Godzik, A., Osterman, A. L., and Rodionov, D. A. (2013). Polysaccharides utilization in human gut bacterium Bacteroides thetaiotaomicron: comparative genomics reconstruction of metabolic and regulatory networks. BMC Genomics 14:873. doi: 10.1186/1471-2164-14-873
Ruan, Z., Wang, Y., Zhang, C., Song, J., Zhai, Y., Zhuang, Y., et al. (2014). Clostridium huakuii sp. nov., an anaerobic, acetogenic bacterium isolated from methanogenic consortia. Int. J. Syst. Evol. Micr. 64, 4027–4032. doi: 10.1099/ijs.0.062711-0
Schink, B. (1997). Energetics of syntrophic cooperation in methanogenic degradation. Microbiol. Mol. Biol. Rev. 61, 262–280.
Schink, B. (2002). Synergistic interactions in the microbial world. Antonie Van Leeuwenhoek 81, 257–261.
Sessions, A. L., Doughty, D. M., Welander, P. V., Summons, R. E., and Newman, D. K. (2009). The continuing puzzle of the great oxidation event. Curr. Biol. 19, R567–R574. doi: 10.1016/j.cub.2009.05.054
Shao, K., Gao, G., Chi, K., Qin, B., Tang, X., Yao, X., et al. (2013). Decomposition of Microcystis blooms: implications for the structure of the sediment bacterial community, as assessed by a mesocosm experiment in lake Taihu. China J. Basic Microbiol. 53, 549–554. doi: 10.1002/jobm.201100532
Shi, L., Cai, Y., Yang, H., Xing, P., Li, P., Kong, L., et al. (2009). Phylogenetic diversity and specificity of bacteria associated with Microcystis aeruginosa and other cyanobacteria. J. Environ. Sci. 21, 1581–1590. doi: 10.1016/s1001-0742(08)62459-6
Shu, D. T., He, Y. L., Yue, H., and Wang, Q. Y. (2015). Microbial structures and community functions of anaerobic sludge in six full-scale wastewater treatment plants as revealed by 454 high-throughput pyrosequencing. Bioresour. Technol. 186, 163–172. doi: 10.1016/j.biortech.2015.03.072
Steinberg, L. M., and Regan, J. M. (2008). Phylogenetic comparison of the methanogenic communities from an acidic, oligotrophic fen and an anaerobic digester treating municipal wastewater sludge. Appl. Environ. Microbiol. 74, 6663–6671. doi: 10.1128/AEM.00553-08
Su, X. L., Tian, Q., Zhang, J., Yuan, X. Z., Shi, X. S., Guo, R. B., et al. (2014). Acetobacteroides hydrogenigenes gen. nov., sp. nov., an anaerobic hydrogen-producing bacterium in the family Rikenellaceae isolated from a reed swamp. Int. J. Syst. Evol. Micr. 64, 2986–2991. doi: 10.1099/ijs.0.063917-0
Suzuki, M. T., Taylor, L. T., and Delong, E. F. (2000). Quantitative analysis of small-subunit rRNA genes in mixed microbial populations. Appl. Environ. Microbiol. 66, 4605–4614. doi: 10.1128/aem.66.11.4605-4614.2000
Tang, X., Li, L., Shao, K., Wang, B., Cai, X., Zhang, L., et al. (2015). Pyrosequencing analysis of free-living and attached bacterial communities in meiliang bay. Can. J. Microbiol. 61, 22–31. doi: 10.1139/cjm-2014-0503
Tholozan, J. L., Touzel, J. P., Samain, E., Grivet, J. P., Prensier, G., and Albagnac, G. (1992). Clostridium neopropionicum sp. nov., a strict anaerobic bacterium fermenting ethanol to propionate through acrylate pathway. Arch. Microbiol. 157, 249–257. doi: 10.1007/bf00245158
Wang, H., Lu, J., Wang, W., Yang, L., and Yin, C. (2006). Methane fluxes from the littoral zone of hypertrophic Taihu lake. J. Geophys. Res. 111:D17109.
Wexler, H. M. (2007). Bacteroides: the good, the bad, and the nitty-gritty. Clin. Microbiol. Rev. 20, 593–621. doi: 10.1128/cmr.00008-07
Wilms, R., Kopke, B., Sass, H., Chang, T. S., Cypionka, H., and Engelen, B. (2006). Deep biosphere-related bacteria within the subsurface of tidal flat sediments. Environ. Microbiol. 8, 709–719. doi: 10.1111/j.1462-2920.2005.00949.x
Wuebbles, D. J., and Hayhoe, K. (2002). Atmospheric methane and global change. Earth-Sci. Rev. 57, 177–210. doi: 10.1016/s0012-8252(01)00062-9
Xing, P., Guo, L., Tian, W., and Wu, Q. L. (2011). Novel Clostridium populations involved in the anaerobic degradation of Microcystis blooms. ISME J. 5, 792–800. doi: 10.1038/ismej.2010.176
Zhai, C., Song, S., Zou, S., Liu, C., and Xue, Y. (2013). The mechanism of competition between two bloom-forming Microcystis species. Freshw. Biol. 58, 1831–1839. doi: 10.1093/jxb/erx027
Zhang, Q., Goberna, M., Liu, Y., Cui, M., Yang, H., Sun, Q., et al. (2018). Competition and habitat filtering jointly explain phylogenetic structure of soil bacterial communities across elevational gradients. Environ. Microbiol. 20, 2386–2396. doi: 10.1111/1462-2920.14247
Zhang, X. J., Chen, C., Ding, J., Hou, A., Li, Y., Niu, Z., et al. (2010). The 2007 water crisis in Wuxi. J. Hazard. Mater. 182, 130–135. doi: 10.1016/j.jhazmat.2010.06.006
Zhou, J., Deng, Y., Luo, F., He, Z., Tu, Q., and Zhi, X. (2010). Functional molecular ecological networks. mBio 1:e00169-10. doi: 10.1128/mBio.00169-10
Zhou, L., Fang, L., Sun, Y., Su, Y., and Zhu, W. (2015). Effects of the dietary protein level on the microbial composition and metabolomic profile in the hindgut of the pig. Anaerobe 38, 61–69. doi: 10.1016/j.anaerobe.2015.12.009
Keywords: microbial interaction, deterministic succession, Microcystis, anoxic decomposition, Clostridiaceae
Citation: Wu Y-F, Xing P, Liu S and Wu QL (2019) Enhanced Microbial Interactions and Deterministic Successions During Anoxic Decomposition of Microcystis Biomass in Lake Sediment. Front. Microbiol. 10:2474. doi: 10.3389/fmicb.2019.02474
Received: 14 April 2019; Accepted: 15 October 2019;
Published: 30 October 2019.
Edited by:
Petra M. Visser, University of Amsterdam, NetherlandsReviewed by:
Gregory Dick, University of Michigan, United StatesCopyright © 2019 Wu, Xing, Liu and Wu. This is an open-access article distributed under the terms of the Creative Commons Attribution License (CC BY). The use, distribution or reproduction in other forums is permitted, provided the original author(s) and the copyright owner(s) are credited and that the original publication in this journal is cited, in accordance with accepted academic practice. No use, distribution or reproduction is permitted which does not comply with these terms.
*Correspondence: Peng Xing, cHhpbmdAbmlnbGFzLmFjLmNu; Qinglong L. Wu, cWx3dUBuaWdsYXMuYWMuY24=
†These authors have contributed equally to this work
Disclaimer: All claims expressed in this article are solely those of the authors and do not necessarily represent those of their affiliated organizations, or those of the publisher, the editors and the reviewers. Any product that may be evaluated in this article or claim that may be made by its manufacturer is not guaranteed or endorsed by the publisher.
Research integrity at Frontiers

Learn more about the work of our research integrity team to safeguard the quality of each article we publish.