 Michael Lukumbuzya
 Markus Schmid1
 Petra Pjevac
 Holger Daims
95% of researchers rate our articles as excellent or good
Learn more about the work of our research integrity team to safeguard the quality of each article we publish.
Find out more
METHODS article
Front. Microbiol. , 19 June 2019
Sec. Microbiotechnology
Volume 10 - 2019 | https://doi.org/10.3389/fmicb.2019.01383
Fluorescence in situ hybridization (FISH) with rRNA-targeted oligonucleotide probes is a key method for the detection of (uncultured) microorganisms in environmental and medical samples. A major limitation of standard FISH protocols, however, is the small number of phylogenetically distinct target organisms that can be detected simultaneously. In this study, we introduce a multicolor FISH approach that uses eight fluorophores with distinct spectral properties, which can unambiguously be distinguished by confocal laser scanning microscopy combined with white light laser technology. Hybridization of rRNA-targeted DNA oligonucleotide probes, which were mono-labeled with these fluorophores, to Escherichia coli cultures confirmed that the fluorophores did not affect probe melting behavior. Application of the new multicolor FISH method enabled the differentiation of seven (potentially up to eight) phylogenetically distinct microbial populations in an artificial community of mixed pure cultures (five bacteria, one archaeon, and one yeast strain) and in activated sludge from a full-scale wastewater treatment plant. In contrast to previously published multicolor FISH approaches, this method does not rely on combinatorial labeling of the same microorganisms with different fluorophores, which is prone to biases. Furthermore, images acquired by this method do not require elaborate post-processing prior to analysis. We also demonstrate that the newly developed multicolor FISH method is compatible with an improved cell fixation protocol for FISH targeting Gram-negative bacterial populations. This fixation approach uses agarose embedding during formaldehyde fixation to better preserve the three-dimensional structure of spatially complex samples such as biofilms and activated sludge flocs. The new multicolor FISH approach should be highly suitable for studying structural and functional aspects of microbial communities in virtually all types of samples that can be analyzed by conventional FISH methods.
Fluorescence in situ hybridization (FISH) targeting ribosomal RNA is a widely used molecular tool for the cultivation-independent identification, visualization, and quantification of microorganisms in environmental and medical samples. In standard FISH approaches, fluorescently mono-labeled oligonucleotide probes are hybridized to the rRNA of microbial cells, and the stained cells are subsequently visualized by widefield epifluorescence or confocal laser scanning microscopy (e.g., Amann et al., 1990; Wagner et al., 1994). A key advantage is that FISH (and methods derived from FISH) reveals the localization of the targeted microorganisms within complex environments, such as biofilms, and their colocalization patterns with other organisms (Daims et al., 2006; Almstrand et al., 2013; Mark Welch et al., 2016; Probandt et al., 2018). Spatial distribution and colocalization data help identify and characterize specific microbe-microbe interactions. Examples include syntrophic symbioses (Maixner et al., 2006), predator-prey relationships (Dolinšek et al., 2013), and interspecies cooperation during infection (Stacy et al., 2014). When combined with single-cell isotope labeling and chemical imaging techniques to study microbial physiology in situ (Lee et al., 1999; Wagner, 2009), FISH offers unique possibilities to relate spatial information with the metabolic capabilities of uncultured microorganisms (Berry et al., 2013).
Approaches based on FISH, which are applied to analyze the abundance, spatial distribution, and physiology of microorganisms, will benefit if many different target organisms can be visualized in the same experiment. The more organisms can be detected by FISH simultaneously, the less time and sample material is needed for sample preparation, in situ hybridization, fluorescence image acquisition, and if applicable, additional analyses such as chemical imaging (Wagner, 2009). However, in standard FISH applications up to three different fluorophores are used for mono-labeling up to three different oligonucleotide probes at the 5′-ends. Therefore, not more than three phylogenetically distantly related target organisms can be detected concurrently. Only if the target organisms represent different clades within the same phylogenetic group, so that probes specific for this group and sub-groups can be hierarchically nested, up to seven populations can be distinguished based on the probe binding patterns (Amann et al., 1996).
The fluorophores most commonly used for standard FISH are the sulfoindocyanine dyes Cy3 and Cy5, and 5(6)-carboxyfluorescein-N-hydroxysuccinimide ester (FLUOS). The limitation to these three dyes (or to fluorophores with similar excitation and emission spectral properties) is mainly caused by the use of band- or long-pass filters in fluorescence microscopy, and problems with excitation crosstalk and emission bleed-through of fluorophores (Valm et al., 2012). Several methods have recently been developed to overcome this limitation. The multicolor DOPE-FISH approach uses oligonucleotide probes that are double-labeled with different fluorophores at their 5′- and 3′-ends (Stoecker et al., 2010; Behnam et al., 2012). It combines the simplicity of the standard FISH protocol with new label combinations to visualize up to six phylogenetically distantly related microbial taxa in the same experiment. A conceptually similar method relies on quadruple-labeled oligonucleotide probes (Schimak et al., 2015). Here, up to four fluorophores are attached to multi-labeled (MiL)-FISH probes by CLICK chemistry. The fluorescence signal intensities of the tagged microorganisms are comparable or higher than intensities achieved by standard FISH with mono-labeled probes.
Double- or quadruple-labeling of the same microbial cell with different dyes leads to color blending, and the blended colors are used to identify the target organisms (we refer to this approach as “combinatorial labeling”). However, a similar signal intensity (brightness) of all fluorophores in the recorded images is an important prerequisite for correct color blending in multicolor DOPE-FISH or MiL-FISH experiments. In order to meet this condition, the imaging parameters (e.g., camera exposure time or fluorescence detector sensitivity) must be carefully adjusted for each dye. This can be difficult if target populations, which are labeled by different dye combinations that include one identical fluorophore, strongly differ in their fluorescence brightness. For example, different signal intensities can be caused by a different cellular ribosome content, a different efficiency of probe binding to their target sites, and a different cell wall permeability for oligonucleotide probes (Wagner et al., 2003).
CLASI-FISH is an approach to achieve the simultaneous detection of numerous different taxa, which uses combinatorial labeling with different dyes and spectral imaging (Valm et al., 2012; Mark Welch et al., 2016). A unique combination of two or more distinctly mono-labeled probes is used to tag each single microbial taxon, so that the taxa are distinguished from each other by the spectral properties of the combined fluorophores. The taxa are then identified by applying linear unmixing during post-processing of the spectral images (Valm et al., 2012). CLASI-FISH has been successfully applied to distinguish up to 15 different target organisms at once (Valm et al., 2011; Mark Welch et al., 2016). However, the application of two distinct oligonucleotide probes to label the same microorganism in CLASI-FISH experiments, requires the binding affinities of the applied probes to be highly similar. If this requirement is not met, the sensitivity of the assay might decrease due to shifts in the spectral composition of the fluorescent signals (Behnam et al., 2012).
For reasons outlined above, all currently available multicolor FISH methods still use a small set of different fluorophores and then rely on combinatorial labeling, which can be challenging to interpret correctly. Problems with recording the fluorescence of specific fluorophores can occur if samples show strong autofluorescence at the respective wavelengths (Behnam et al., 2012), drastically reducing the number of targets detectable by any of the above described methods. However, none of these methods exploit the full potential of state-of-the-art fluorescence microscopy. Confocal laser scanning microscopes (CLSMs) with white light laser (WLL) technology, which provide seamlessly tunable excitation wavelengths across almost the entire UV-VIS spectrum (470 to 670 nm) and freely definable windows for the recorded emission wavelengths are a recent development in the field of epifluorescence microscopy. At the same time, highly sensitive hybrid photodetectors, which allow the acquisition of fluorescence signals even when very narrow emission wavelength windows are defined to reduce bleed-through, are now available (Borlinghaus et al., 2012). These features enhance the flexibility of both fluorophore excitation and emitted fluorescence detection, and thus they extend the range of fluorophores one can utilize for FISH and other fluorescence imaging approaches.
Here we introduce a multicolor FISH approach, which utilizes the flexibility of WLL technology to detect multiple microbial populations without combinatorial labeling. The method is based on the standard FISH protocol with mono-labeled oligonucleotide probes but uses an extended set of fluorophores with distinct spectral properties spanning almost the entire spectrum of visible light. We demonstrate the successful application of this multicolor FISH approach to an artificial mixture of cultured microorganisms (referred to as “mock community”) and to a complex microbial community in activated sludge from a municipal wastewater treatment plant (WWTP). All described experiments were performed using a CLSM equipped with a WLL and a UV diode. The novel multicolor FISH method can in principle also be used with more commonly available CLSMs (equipped with Ar and HeNe lasers and a UV diode) and with conventional epifluorescence microscopes. However, the number of simultaneously applicable fluorochromes depends on the microscope setup (e.g., number of installed lasers or filter sets) and is most likely smaller than with a WLL.
Escherichia coli K12 (DSM 498) and Bacillus subtilis WS29 (DSM 10) were grown at 37°C in lysogeny broth. Niabella soli (DSM 19437) was grown at 37°C in R2A medium (DSMZ medium 830). The nitrite-oxidizing bacterium “Candidatus Nitrotoga fabula” was cultured in nitrite-containing mineral medium as detailed elsewhere (Kitzinger et al., 2018). The complete ammonia oxidizer (comammox organism) Nitrospira inopinata (Daims et al., 2015) and the ammonia-oxidizing archaeon Nitrososphaera gargensis were grown in mineral ammonium-containing media (Palatinszky et al., 2015; Kits et al., 2017). Saccharomyces cerevisiae DSM 70449 was grown at 37°C in DSMZ medium 393. The four Gram-negative bacteria E. coli, N. soli, “Candidatus N. fabula,” and N. inopinata, and the yeast S. cerevisiae were harvested during the late logarithmic growth phase by centrifugation, washed once in phosphate-buffered saline (1 × PBS), and fixed in a 2% (v/v) formaldehyde solution for 4 h at 4°C as described elsewhere (Daims et al., 2005). B. subtilis and N. gargensis cells were harvested during the late logarithmic growth phase by centrifugation and fixed in a 1:1 mixture of 1 × PBS and 96% (v/v) ethanol according to Daims et al. (2005).
Activated sludge was sampled in March 2015 from a nitrifying-denitrifying tank at the municipal WWTP of Klosterneuburg, Austria. The sludge was centrifuged (20,817 ×g, 4°C, 15 min), most of the supernatant was removed, and the samples were fixed in a 2% (v/v) formaldehyde solution for 3 h at 4°C. Fixed samples were washed in 1 × PBS, resuspended in a 1:1 mixture of 1 × PBS and 96% (v/v) ethanol (Daims et al., 2005), and stored at -20°C. In addition, a modified fixation protocol was tested to better preserve the spatial structure of activated sludge flocs. For this purpose, sludge was sampled from the same WWTP in September 2016 and was suspended on site in a 1:1 mixture of 0.1% (w/v) LE agarose [Biozyme, gelling strength (1%) ≥ 1,200 g/cm2] and 2% (v/v) formaldehyde solution. The mixture was incubated for 1 h at ambient temperature. After transfer to the laboratory, the sludge suspended in agarose was transferred onto microscope slides and air-dried at room temperature for approximately 30 min (the agarose solidified during this step). To remove the fixative, the slides were dipped twice into 1 × PBS for 10 min each. Subsequently, the slides were dipped for 5 min each into 50, 70, and 96% (v/v) ethanol for dehydration and were stored at -20°C.
To test the applicability of the fluorophores in a sequential hybridization setup, an activated sludge sample with a previously described high diversity of Nitrospira-related nitrite-oxidizing bacteria (NOB) was used (Gruber-Dorninger et al., 2015). This nitrifying activated sludge had been sampled from a sequencing batch reactor, which treats reject water from sludge dewatering after anaerobic digestion, at the municipal full-scale WWTP of Ingolstadt (Germany) in October 2009, had been fixed by the same conventional protocol as described above (Daims et al., 2005), and had been stored at -20°C.
The rRNA-targeted DNA oligonucleotide probes used in this study are listed in Table 1. The new probe Nia224 (targeting the genus Niabella) was designed using the “probe design” and “probe match” functions of the software ARB (Ludwig et al., 2004) and the SILVA NR99, release 128 16S rRNA sequence database (Quast et al., 2013). Probes were mono-labeled at their 5′-ends with fluorophores as listed in Table 1. Molecular and spectral properties of all fluorophores used in this study are provided in Table 2. Fluorescently labeled probes and unlabeled competitor oligonucleotides (Table 1) were obtained from Biomers (Ulm, Germany).
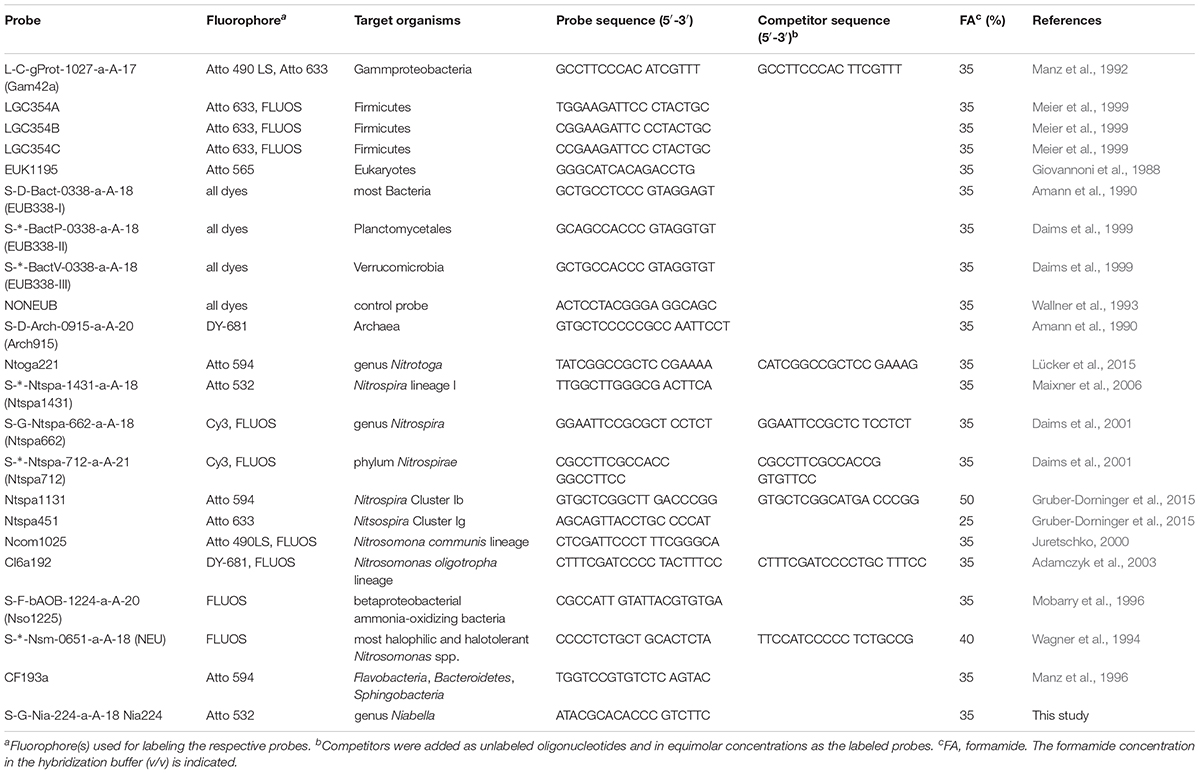
Table 1. Ribosomal RNA-targeted oligonucleotide probes used in this study.
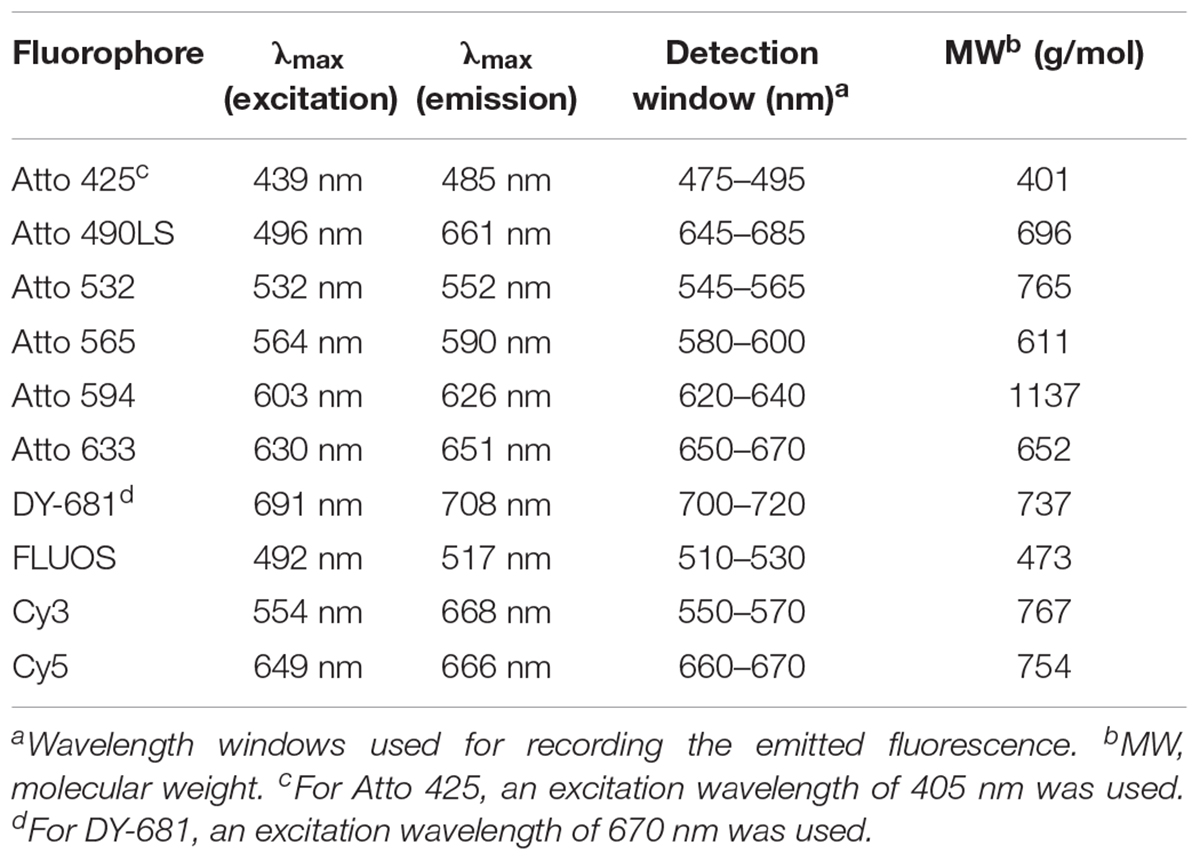
Table 2. Spectral and molecular properties of the fluorophores used for labeling rRNA-targeted oligonucleotide probes.
FISH of pure cultures of E. coli, of mixed pure cultures of reference organisms (mock community), and of all activated sludge samples was performed at 46°C according to a standard protocol for rRNA-targeted FISH (Manz et al., 1992; Daims et al., 2005) with the following modifications. Prior to application of the hybridization buffer onto the microscope slide, the buffer was mixed with a 5 to 15 pmol/μl working stock of each applied probe (Table 1) at a buffer: probe ratio of 10:1 (v/v). The hybridizations were performed for 2 h for pure cultures and the mock community samples, 2 h for each of three sequential hybridizations on sludge samples from the WWTP Ingolstadt or 12 h for single hybridizations on activated sludge samples from the WWTP Klosterneuburg. The long hybridization time of 12 h was chosen to improve the signal intensity of some of the applied probes (Yilmaz et al., 2006).
Following FISH, images were acquired with an inverted Leica TCS SP8X CLSM equipped with a 405 nm UV diode, a Leica supercontinuum white light laser, two photomultiplier (PMT) detectors, three hybrid (HyD) detectors, and the Leica Application Suite AF 3.2.1.9702. Fluorophores were excited at the respective excitation wavelength (Table 2) with the fixed wavelength diode laser or the WLL, respectively. The wavelength windows for recording the emitted fluorescence were adjusted according to the light emission properties of the fluorophores (Table 2).
The separately recorded fluorescence signals of the fluorophores were false-colored and overlaid to form a composite image by using the Leica Application Suite X and the image analysis and visualization software daime version 2.1 (Daims et al., 2006). To visualize multicolor FISH of activated sludge, three-dimensional (3D) confocal image stacks (z-stacks) of each fluorophore signal were recorded at the same position in the sample. The z-stacks were then false-colored and visualized together by maximum intensity projection (MIP) rendering in daime. MIP would accumulate the autofluorescence background of the sludge matrix from all images of all stacks in the final projection. To mitigate this effect prior to visualization, the images of the different fluorophore signals were subtracted from each other using the respective tool of the daime program. Image subtraction ensured that fluorescent background, which occurred in two or more images at the same position, was reduced while the specific probe signals were qualitatively preserved.
To compare the fluorescence intensities of the different fluorophores after rRNA-targeted FISH, aliquots of fixed E. coli cells from the same culture were separately hybridized to probe EUB338-I labeled with the different fluorophores (Table 2). The formamide concentration in the hybridization buffer was set to 35% in these experiments, and all hybridizations were performed in parallel. For each fluorophore, images of probe-stained cells were recorded using the respective settings for excitation and emission wavelengths. Other parameters of image acquisition were kept constant (in particular, the laser power was set to 10% and the “smart gain” was set to 100%). The mean fluorescence intensities of probe-stained cells were measured by image analysis using daime. To evaluate excitation crosstalk and emission bleed-through for the dyes Cy3, Atto 532, and Atto 565 as well as for Cy5 and Atto 633, E. coli cells were again separately hybridized to probe EUB338-I labeled with each of these dyes. Subsequently, images of probe-conferred fluorescence were acquired using the excitation wavelengths and emission recording windows of every dye (e.g., cells labeled with Cy3 were imaged with the settings for Cy3, Atto 532, and Atto 565). The mean fluorescence intensities of probe-stained cells were then measured by using daime. All data were plotted using R (R Core Team, 2017).
Fixed E. coli cells were separately hybridized to probe EUB338-I labeled with Cy3, Cy5, FLUOS, and the alternative fluorophores (Table 2) with increasing formamide concentrations in the hybridization buffer [0 to 70% (v/v) with 10% increments] as described elsewhere (Manz et al., 1992; Daims et al., 2005). Images of the fluorescent cells were recorded, and the probe dissociation profiles were determined by image analysis using the respective function of the daime program. The measured data were plotted and the probe dissociation curves were approximated by non-linear regression with a sigmoidal regression model in R. To determine the optimal hybridization conditions for the new probe Nia224 (Table 1), the same approach was used with fixed cells of Niabella soli and probe Nia224 labeled with Cy3.
Activated sludge samples from the WWTP Klosterneuburg were formaldehyde-fixed by the standard fixation protocol or by using a modified protocol with agarose embedding (see above). The sludge samples were hybridized to a mixture of probes Nso1225, Ncom1025, Cl6a192, and NEU (all labeled with FLUOS) to detect betaproteobacterial ammonia-oxidizing bacteria (AOB) and simultaneously to a mixture of probes Ntspa662 and Ntspa712 (both labeled with Cy3) to detect NOB of the genus Nitrospira (see also Table 1). Following FISH, confocal z-stacks of probe-conferred fluorescence were acquired at randomly chosen positions within each specimen. Twenty-three z-stacks were recorded for conventionally fixed and for agarose-embedded sludge, respectively. Each z-stack comprised the whole vertical thickness of the sludge floc at the respective position. This vertical thickness was determined manually, by finding the z-positions where the biomass at the top and the bottom of a floc was just outside the focal plane of the microscope. The xy resolution of the images was 1024 × 1024 pixels, and the axial distance between the images in the z-stacks was 0.34 μm. The spatial arrangement patterns of AOB and NOB in the z-stacks were analyzed by using the 3D “Inflate algorithm” of the daime software. Briefly, this approach quantifies the density of one microbial population (here: “population A”) at increasing distances from the cells (or cell clusters) of another population (“population B”). The measured densities of population A are normalized with the expected densities of a virtual population A’, which is equally abundant in the sample but has a random spatial distribution (i.e., random distribution is the null hypothesis). A normalized density of the real population A > 1.0 indicates coaggregation of populations A and B, a density < 1.0 indicates avoidance, and a density of 1.0 indicates random distribution at the respective distance. Details of the algorithm are described elsewhere (Daims and Wagner, 2011; Dolinšek et al., 2013). Prior to analysis, the xy resolution of the images was reduced in daime to 512 × 512 pixels in order to save computation time (image data were preserved by trilinear interpolation). A 3D median filter (kernel size 3 × 3 × 3 voxels) was applied to reduce background noise and to eliminate spurious small particles from the images.
Activated sludge samples from the WWTP Ingolstadt were hybridized with three different rRNA-targeted DNA oligonucleotide probes specific to NOB of Nitrospira sublineage Ib (Ntspa1131), Nitrospira lineage I (Ntspa1431), and Nitrospira sublineage Ig (Ntspa451), with hybridization optima at three distinct formamide concentrations (Table 1). The first hybridization step was performed for 2 h at a formamide concentration of 50% with probe Ntspa1131 (labeled with Atto 594), followed by a 10 min washing step. Immediately thereafter, two more 2 h hybridization and 10 min wash cycles at 35% (Ntspa1431, labeled with Atto 532) and 25% (Ntspa451, labeled with Atto 633) formamide concentration were performed.
In this study, we developed a multicolor FISH approach that utilizes seven alternative fluorophores in addition to the established fluorescent dye FLUOS (Table 2). The alternative dyes employed here have already been used for other applications in the life sciences, such as the visualization of membrane proteins in human cell lines and chromosomes (e.g., Beliveau et al., 2015; Chamma et al., 2016). However, derivatives of these alternative dyes which can be bound to oligonucleotides became available only recently. The here presented approach is based on confocal microscopy with WLL technology that allows the precise adjustment of the excitation wavelengths and of the wavelength recording windows for emitted fluorescence. These features enable the concurrent use of fluorophores whose excitation and/or emission spectra show adjacent but still distinct maxima (Figure 1). To evaluate the suitability of these fluorophores for rRNA-targeted FISH, the Bacteria-specific probe EUB338-I (Amann et al., 1990) was separately mono-labeled with each dye and hybridized to cells from a log-phase E. coli culture. All fluorophores yielded clearly detectable signals that were suitable for the visualization of E. coli cells and allowed the quantification of fluorescence brightness by image analysis (Figure 2). Under the applied conditions, the alternative fluorophores Atto 565, Atto 594, and Atto 633 yielded strong fluorescence intensities per E. coli cell that were comparable to the canonical fluorophore Cy3 (Figure 2). These four dyes were considerably brighter than all other tested fluorophores, including the well-established dyes Cy5 and FLUOS (Figure 2). The dyes Atto 425 and Atto 490LS were relatively dim compared to the other fluorophores (Figure 2). However, proper adaptation of the laser power and detector settings permitted the acquisition of fluorescence images for each dye in the subsequent multicolor FISH experiments (see below). No fluorescent signals were observed in control hybridizations of E. coli cells to the nonsense probe NONEUB mono-labeled with each of the alternative fluorophores, confirming that none of these dyes attached non-specifically to the cells (data not shown).
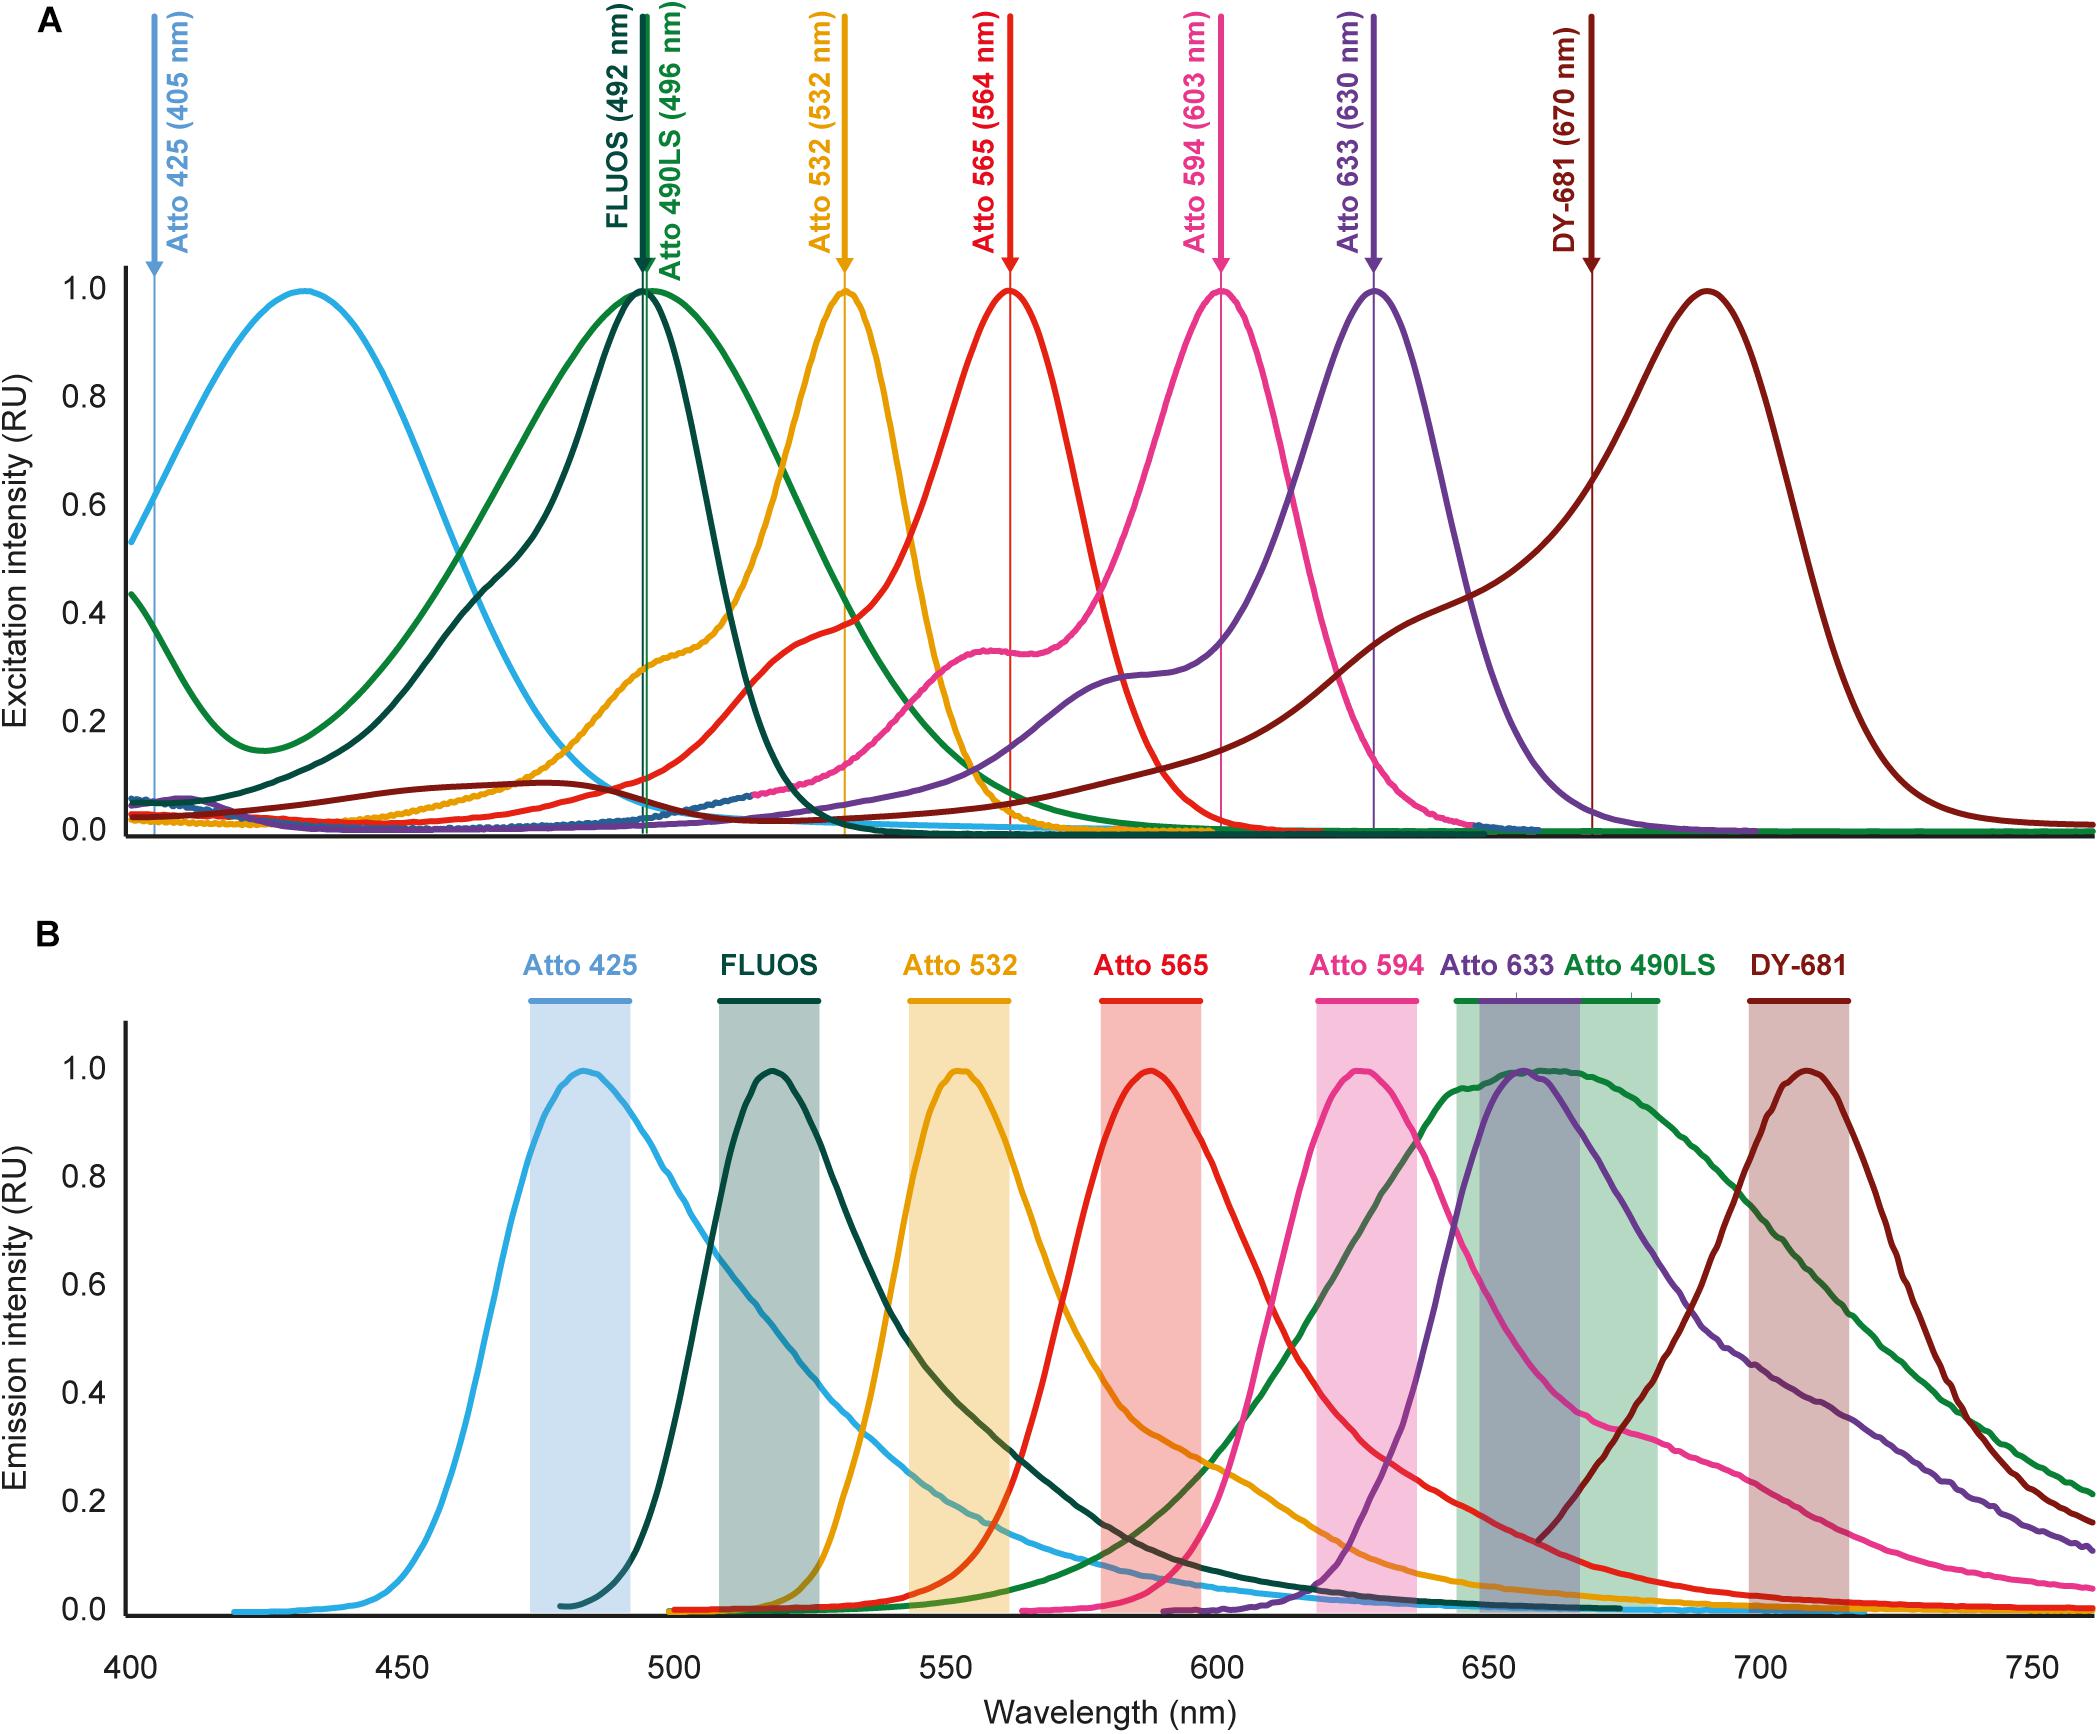
Figure 1. Excitation and emission spectra of the fluorochromes used for multicolor FISH in this study. (A) Excitation spectra. Wavelengths indicated after the fluorochrome names and by vertical lines are the excitation wavelengths applied for imaging. For Atto 425 and DY-681, different wavelengths than the maxima of the excitation spectra were used because of technical limitations of the microscopy equipment. (B) Emission spectra. Shaded regions indicate the wavelength windows used for recording the fluorescence emitted by the respective dyes. The spectral properties of the fluorochromes are listed in Table 2. Please refer to Fig. S1 for an illustration that includes the spectra of the widely used dyes Cy3 and Cy5, which were not used for multicolor FISH because of overlapping spectra with several of the other fluorochromes (see text for details). RU, relative units.
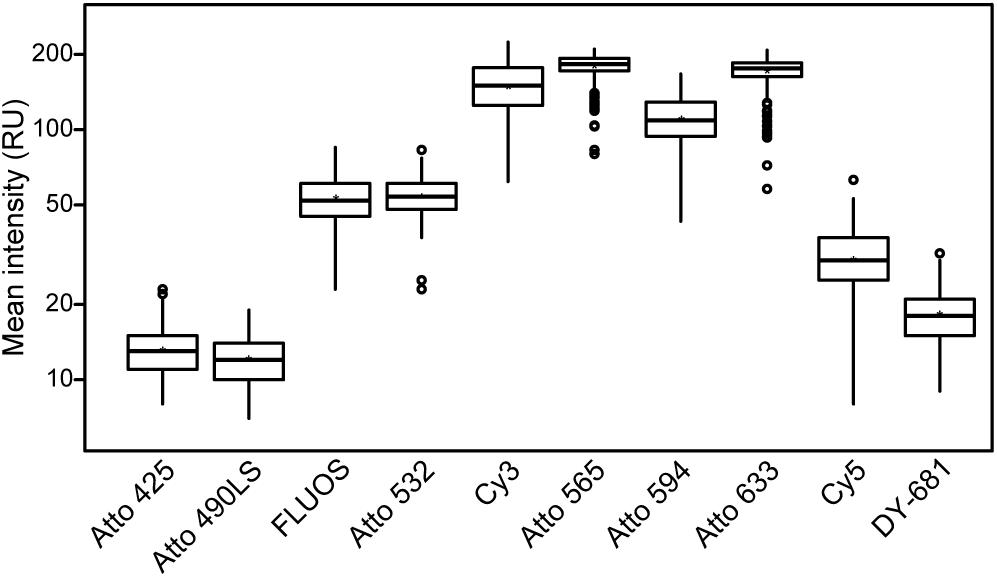
Figure 2. Comparison of the fluorescence intensities of the different fluorochromes. Mean fluorescence intensities of E. coli cells after FISH using probe EUB338-I labeled with the respective fluorochrome are shown. Aside from the excitation and recording wavelengths, images were acquired using the same imaging settings to ensure comparability. Note the logarithmic scaling of the y-axis. At least 100 E. coli cells were evaluated for each fluorophore.
The simultaneous application of different fluorophores in multicolor FISH experiments could be hampered by excitation crosstalk or emission bleed-through among the dyes, which would cause unspecific fluorescence signals. According to the spectral properties of the dyes used for multicolor FISH in this study (Figure 1), such problems are not expected if both the appropriate excitation wavelength and emission window is used to record the fluorescent signal of each dye. Consistently, in a multicolor FISH experiment using these dyes and mixed microbial pure cultures (mock community), no unspecific signals were observed (see below). However, the excitation spectrum of the canonical dye Cy3 suggests that excitation crosstalk likely occurs between Cy3 and the fluorophores Atto 532 or Atto 565, and the emission spectrum of Cy3 indicates that emission bleed-through occurs with Atto 532 and to a lesser extent with Atto 565 (Supplementary Figure S1). Similarly, both excitation crosstalk and emission bleed-through would be expected for a combination of the dyes Cy5 and Atto 633 (Supplementary Figure S1). These biases were experimentally confirmed (Supplementary Figure S2), so that Cy3 should not be combined with Atto 532 or Atto 565, and Cy5 not with Atto 633 in the same FISH experiment. In order to maximize the number of simultaneously applicable fluorophores, we excluded Cy3 from the subsequent multicolor FISH experiments. We also decided to use the brighter dye Atto 633 (Figure 2) instead of Cy5.
To assess whether the alternative fluorophores alter the melting behavior of the oligonucleotide probes, we recorded dissociation profiles for probe EUB338-I mono-labeled with each dye. Increasingly stringent hybridization and washing conditions (Daims et al., 2005) were applied in FISH experiments with the probes and E. coli as the target organism. The shape of the probe dissociation profiles was similar for the alternative fluorophores and the canonical dyes Cy3, Cy5, and FLUOS (Supplementary Figure S3). Merely with DY-681, the intensity of probe-conferred fluorescence started to decrease at a lower stringency than with the other dyes (Supplementary Figure S3). At high hybridization stringencies, this melting profile may lead to a slightly dimmer fluorescent signal of probes labeled with DY-681 compared to probes labeled with the other fluorochromes.
The use of the alternative fluorophores for multicolor FISH was demonstrated for a mixed mock community of seven microorganisms from different major phylogenetic groups: “Candidatus Nitrotoga fabula” (Betaproteobacteria), E. coli (Gammaproteobacteria), B. subtilis (Firmicutes), Niabella soli (Bacteroidetes), Nitrospira inopinata (Nitrospirae), Nitrososphaera gargensis (Thaumarchaeota), and Saccharomyces cerevisiae (Ascomycota). Oligonucleotide probes specifically targeting each of these organisms were labeled with different fluorophores (Table 1). Following FISH with these probes, all seven microorganisms in this mock community could be identified and clearly distinguished at the single cell level by confocal fluorescence microscopy (Figure 3). With the proper adjustments for the excitation wavelength and emission recording window for each dye (Table 2), no excitation crosstalk or emission bleed-through between any of the dyes was observed (Figure 3). Additional application of probe EUB338-I (labeled with Atto 425) resulted in the expected double-labeling of the bacterial cells with EUB338-I and the respective specific probe (Supplementary Figure S4). The use of Atto 425 also resulted in a weak fluorescent signal from the eukaryotic S. cerevisiae cells. A separate FISH experiment using a mixture of E. coli and S. cerevisiae cells, and probe EUB338-I labeled with dye Atto 633, revealed that S. cerevisiae was not erroneously detected by probe EUB338-I. Instead, the yeast cells showed autofluorescence with the imaging settings used to detect the signals of Atto 425 (Supplementary Figure S5).
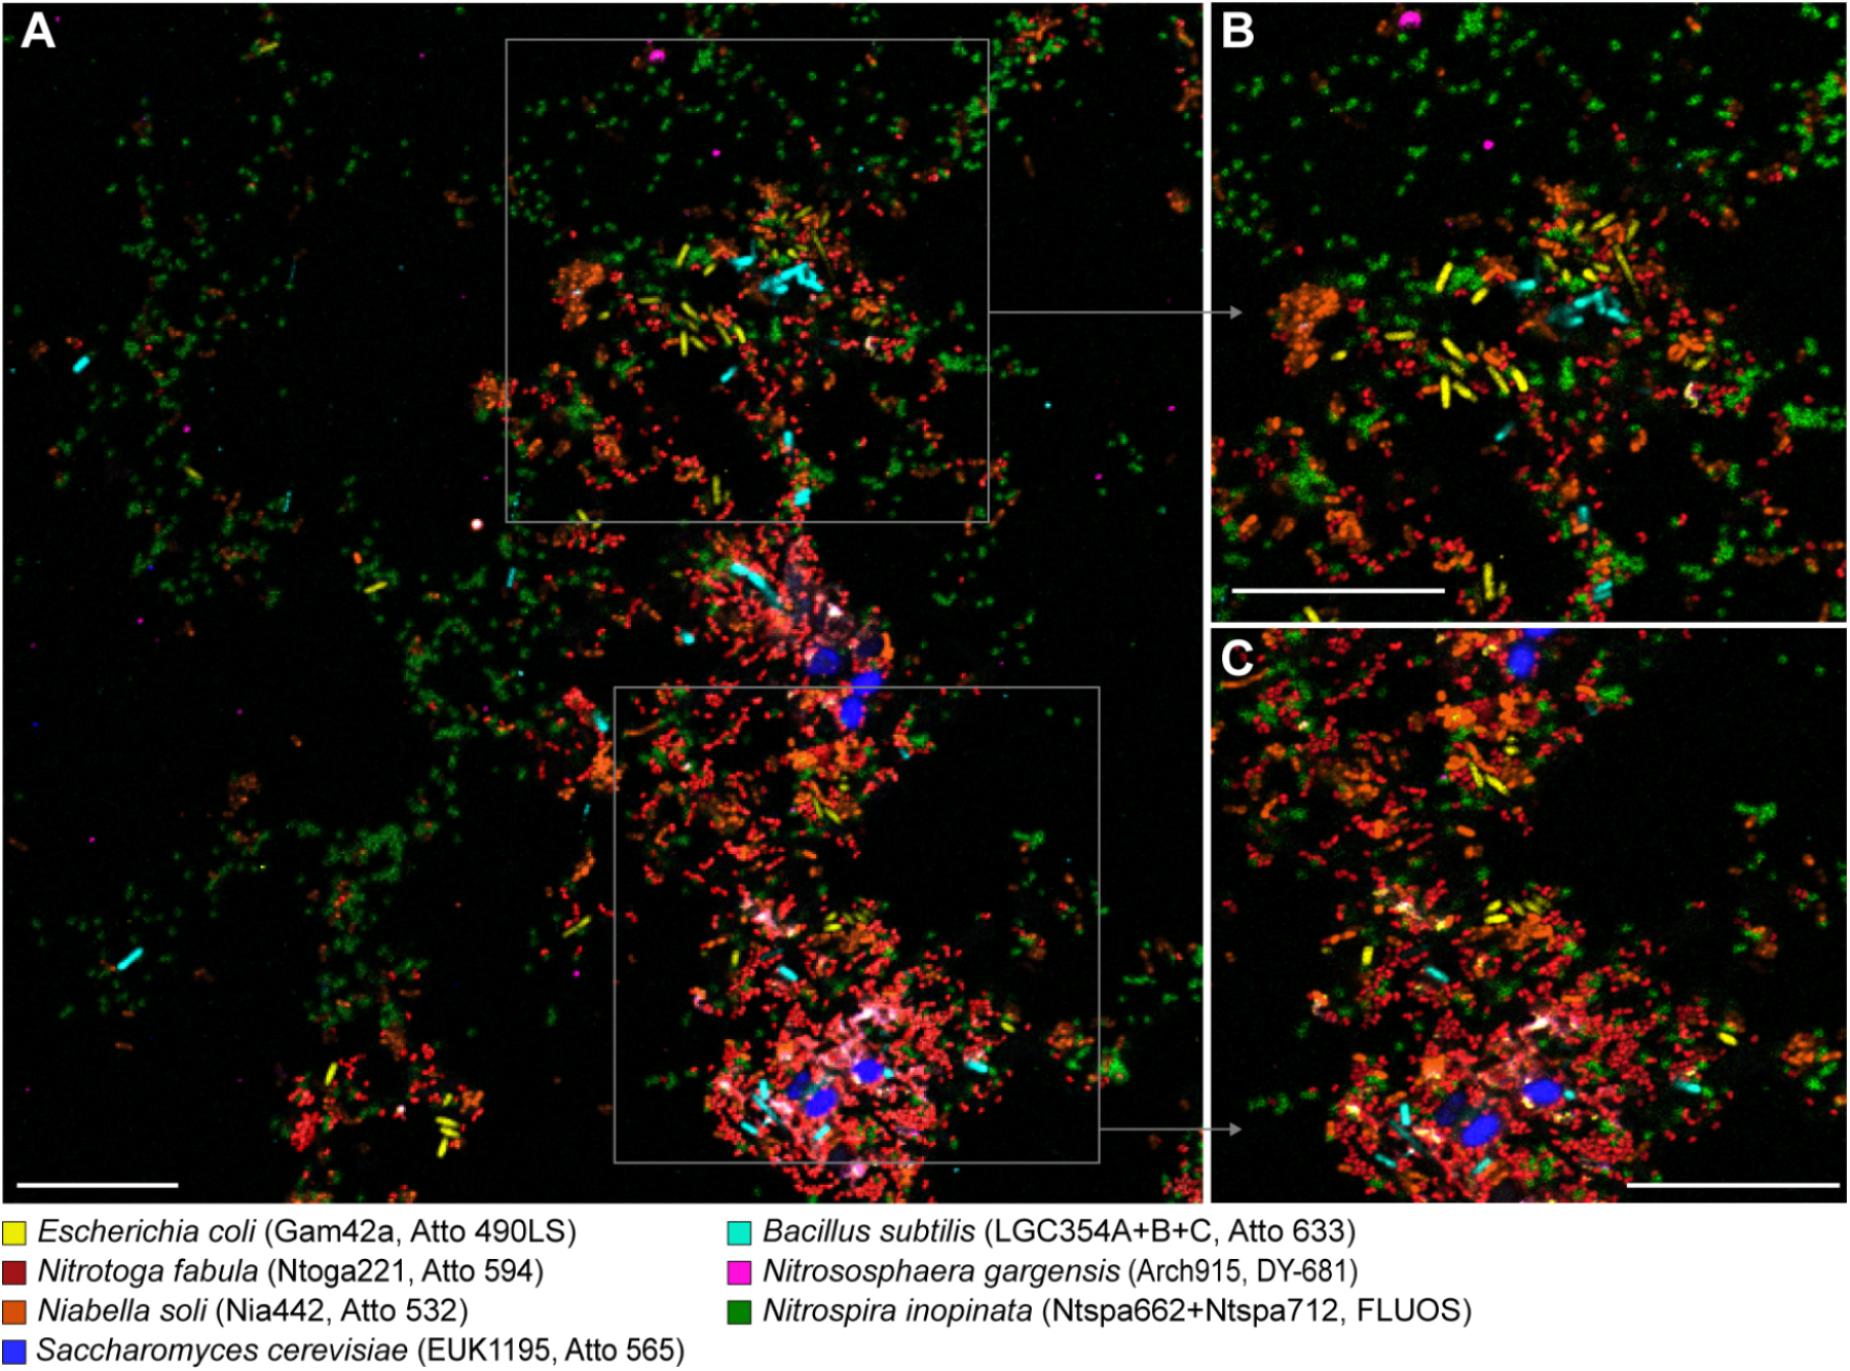
Figure 3. Simultaneous visualization, by multicolor FISH, of seven phylogenetically distinct microbial isolates in a mixture of pure cultures (mock community). The organisms, assigned false colors, rRNA-targeted oligonucleotide probes, and fluorochromes are indicated. (A) Representative image showing all organisms in the same microscopic field of view. Scale bar, 20 μm. (B,C) Enlarged parts of the image as indicated by the frames in panel (A).
To test the applicability of multicolor FISH with the alternative fluorophores on a complex environmental sample, we concurrently visualized seven distinct microbial target groups in nitrifying activated sludge from a municipal WWTP in Klosterneuburg, Austria: two different lineages of betaproteobacterial AOB (Nitrosomonas cluster 6a and the Nitrosomonas communis cluster), NOB of Nitrospira lineage I, members of the Bacteroidetes, Firmicutes, and Gammaproteobacteria, and eukaryotes. Representatives of these phylogenetic groups are widespread in WWTPs (Juretschko, 2000; Daims et al., 2001; Adamczyk et al., 2003; Gruber-Dorninger et al., 2015; McIlroy et al., 2015; Foissner, 2016). All seven probe target groups were detected in the sludge flocs and could be distinguished from each other in the same multicolor FISH experiment (Figure 4). Control hybridizations were performed with the sludge and probe NONEUB mono-labeled with each of the alternative fluorophores. In these controls, no fluorescence was detected aside from background fluorescence of the sludge matrix, which was also observed after FISH with NONEUB labeled with the canonical dyes Cy3, Cy5, and FLUOS (data not shown).
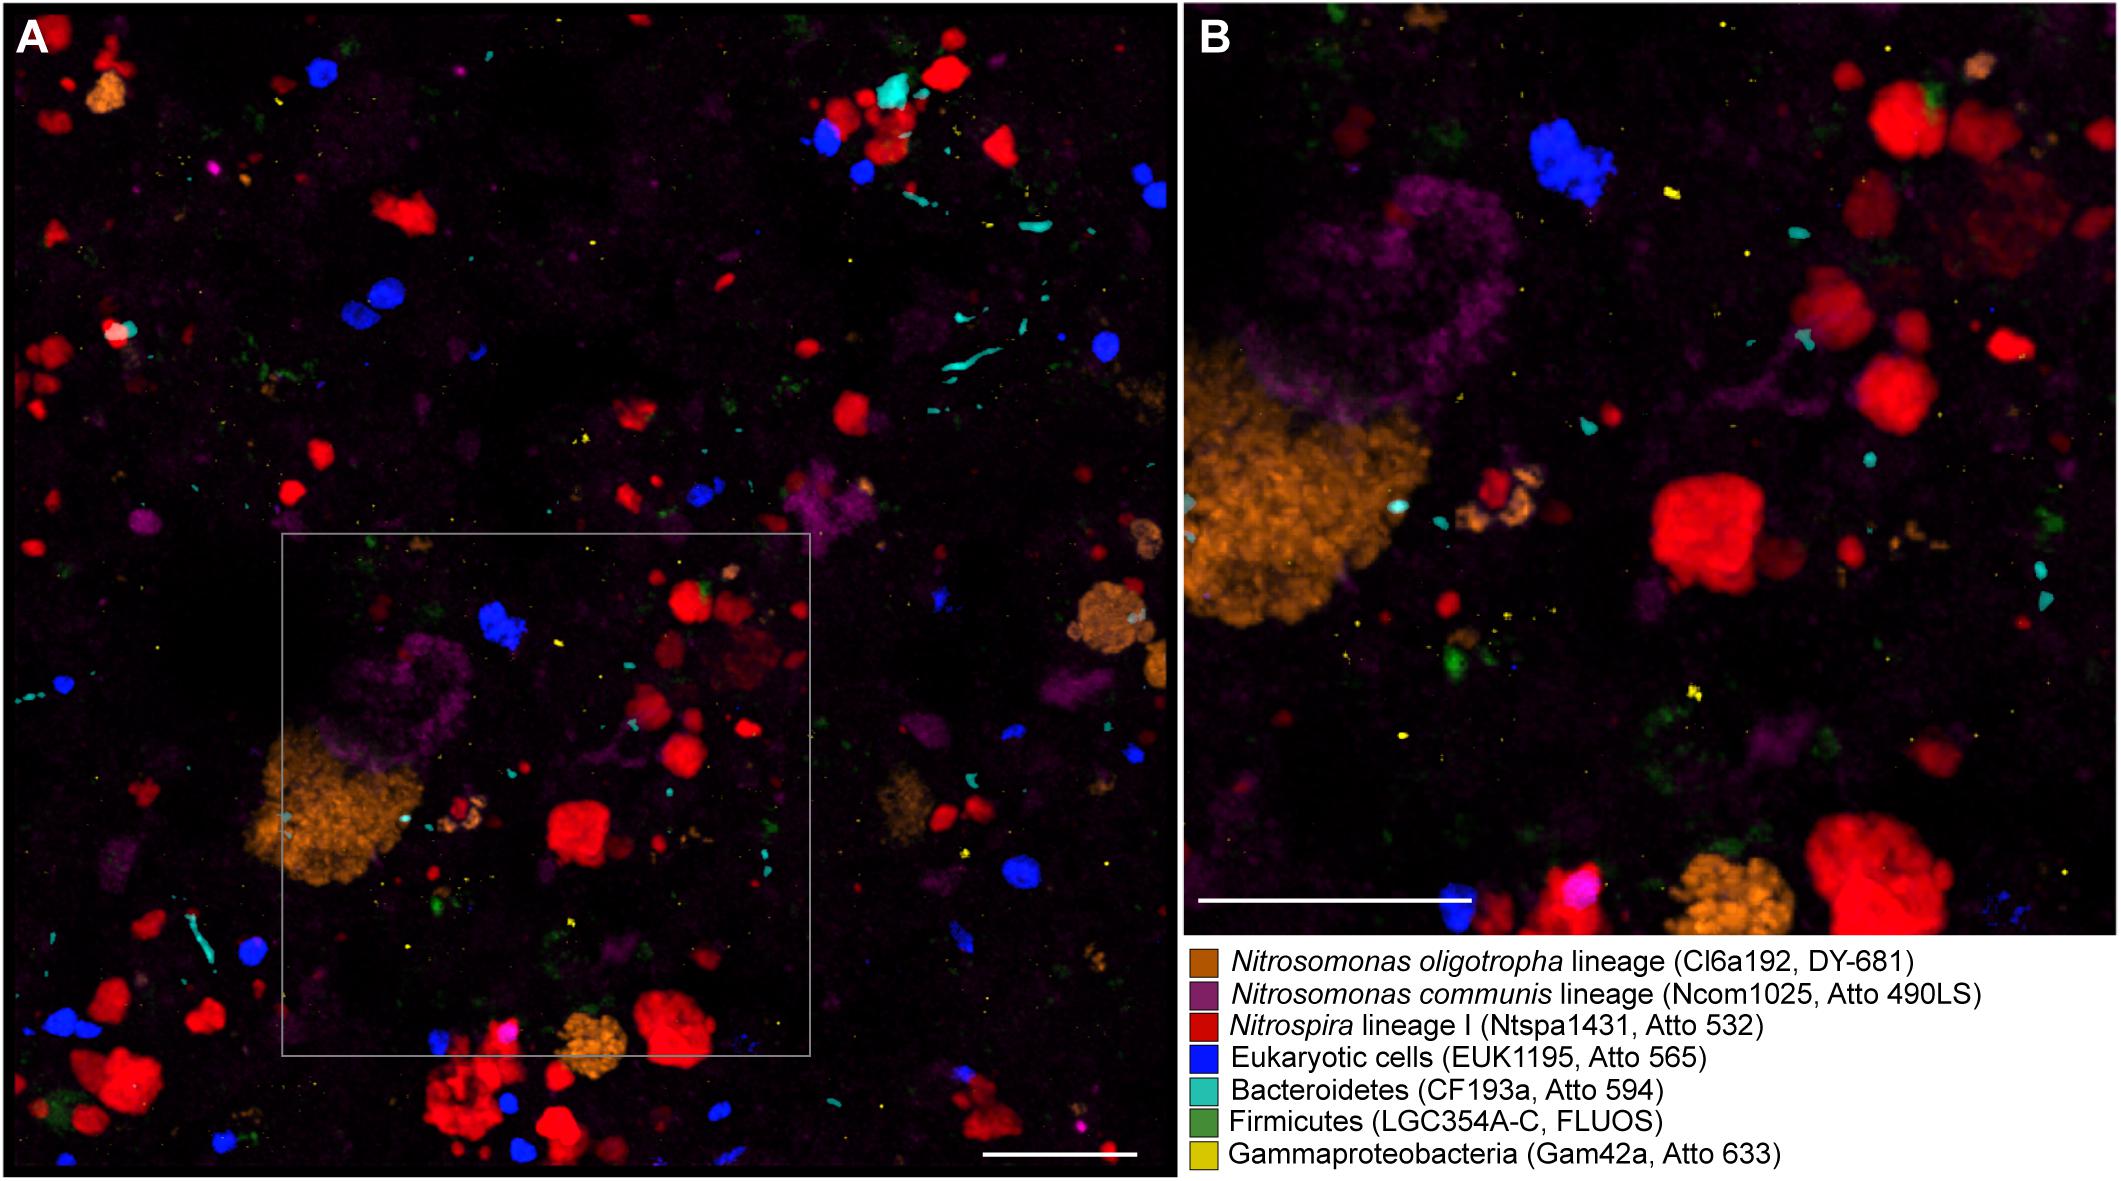
Figure 4. Simultaneous visualization, by multicolor FISH, of seven microbial target groups in activated sludge. The target organisms, assigned false colors, rRNA-targeted oligonucleotide probes, and fluorochromes are indicated. (A) Combined maximum intensity projection of confocal image stacks of each probe signal. Scale bar, 20 μm. The size of the image stacks along the z-axis was 12 μm. For the purpose of illustration, the brightness of the projection was enhanced by using the respective tool of the daime software. (B) Enlarged part of the image as indicated by the frame in panel (A).
Finally, the applicability of the fluorophores for sequential hybridization (i.e., subsequent hybridizations of the same sample at different formamide concentrations) was confirmed. For this purpose, a previously analyzed activated sludge sample from a municipal WWTP (Ingolstadt, Germany) was sequentially hybridized at three different formamide concentrations (50%, 35% and 25%) to three distinct rRNA-targeted oligonucleotide probes. These probes targeted NOB of Nitrospira lineage I, sublineage Ib, and sublineage Ig (Table 1; Gruber-Dorninger et al., 2015). Signals for all three targeted NOB groups were detected in the sludge flocs. Consistent with the previous analysis (Gruber-Dorninger et al., 2015), an overlay of the signals for lineage I (probe Ntspa1431) and sublineage Ib (probe Ntspa1131) was observed, whereas the signals for lineage Ig (probe Ntspa451) did not overlap with the signals of the other applied Nitrospira probes (Supplementary Figure S6).
Prior to fixation for FISH, activated sludge from the WWTP Klosterneuburg was embedded in agarose and transferred onto microscope slides in order to reduce the impact of fixation and hybridization on the 3D structure of the microbial assemblies in the flocs. In particular, the agarose embedding avoided centrifugation of the biomass, which is part of the standard formaldehyde fixation protocol for rRNA-targeted FISH (Manz et al., 1992; Daims et al., 2005). This modified fixation procedure was fully compatible with multicolor FISH, as the applied agarose (LE Agarose, Biozyme) did not show autofluorescence that would hamper image acquisition (Figure 4).
In order to assess whether agarose embedding had an effect on the 3D structure of the sludge flocs, the spatial coaggregation patterns of nitrifying microorganisms in the flocs were quantified by image analysis. Previous studies had shown that AOB and NOB microcolonies often coaggregate in activated sludge. Biological reasons for this spatial arrangement are that the NOB feed on the nitrite produced by AOB, while the AOB benefit from the removal of toxic nitrite (Juretschko et al., 1998; Daims et al., 2006; Maixner et al., 2006). Consistently, our quantitative analysis confirmed a pronounced coaggregation of AOB and NOB over a distance range from ca. 0.5 to 12.5 μm in agarose-embedded sludge (Supplementary Figure S7). Beyond this range, the AOB and NOB microcolonies were randomly distributed (Supplementary Figure S7). Coaggregation was also detected for conventionally fixed sludge (i.e., fixed without agarose embedding but with centrifugation). However, the minimal coaggregation distance was slightly shorter (<0.5 μm) and random distribution started already at a distance of ca. 9 μm (Supplementary Figure S7). Hence, the spatial structure of the conventionally fixed sludge was slightly altered during fixation and hybridization. The quantified difference between the coaggregation patterns appears to be small. However, earlier analyses of a nitrifying biofilm suggested that steep in situ concentration gradients of nitrite exist within a short distance of 10 μm from AOB microcolonies. The nitrite concentration was highest close to the AOB, but it decreased rapidly and within a few μm distance because of diffusion and nitrite consumption by NOB (Maixner et al., 2006). Interestingly, different NOB populations colonized the biofilm along these nitrite gradients, apparently reflecting their different adaptations to elevated or low nitrite concentrations (Maixner et al., 2006). Thus, a high precision of coaggregation analyses is important for understanding interactions between tightly packed microorganisms that involve the production and consumption of diffusible compounds. The modified fixation protocol with embedding can improve the precision of spatial analyses based on FISH. Multicolor FISH offers the additional advantage that multiple microbial populations can be detected simultaneously (Figure 4), increasing the probability that new spatial arrangement patterns are found.
In this study, we demonstrated a simple and efficient multicolor FISH approach. It is based on the use of alternative fluorophores in combination with WLL technology, which is becoming widely available as part of modern CLSM equipment. The approach enabled the simultaneous detection and visualization of seven distinct microbial taxa in the same hybridization experiment (or potentially eight taxa, if Atto 425 is used to label a specific probe instead of EUB338-I, see also Supplementary Figure S4B). In the analyzed samples, the fluorescence intensity of the alternative fluorophores was well sufficient for rRNA-targeted FISH of microbes with mono-labeled oligonucleotide probes. Most of the dyes showed a comparable or higher fluorescence intensity than the most commonly applied fluorophores Cy3, Cy5, and FLUOS (Figure 2). As with these canonical dyes, double-labeling (Stoecker et al., 2010) or multi-labeling (Schimak et al., 2015) of oligonucleotide probes with the same alternative fluorophore could further enhance the signal intensity, for example to detect organisms with a low ribosome content or to improve FISH results with autofluorescent samples. Because of excitation crosstalk and emission bleed-through, Cy3 and Cy5 were not compatible with Atto 532 and Atto 565 (Cy3) or Atto 633 (Cy5). This limitation should be considered if Cy3- or Cy5-labeled “legacy probes” must be used together with alternative fluorophores in multicolor FISH experiments. All other tested dyes can be freely combined, because unspecific signals due to crosstalk and bleed-through are unlikely based on the spectral properties of the fluorochromes (Figure 1) and were consistently not observed in any of our experiments.
The number of distinct target organisms, which can be distinguished by our multicolor FISH approach, is limited by the number of different fluorophores that can be detected by the imaging equipment and can be combined without excitation crosstalk or emission bleed-through. Here, up to eight fluorophores were applied together (Figure 1) and could be imaged using a CLSM equipped with a WLL and a UV diode. It should be possible to use subsets of the fluorophores (except DY-681) with more common CLSMs that are equipped with Ar and He/Ne lasers as well as an UV diode. Furthermore, the dyes Atto 425, Atto 565, and Atto 633 (as well as the canonical fluorophore FLUOS) can also be used with conventional epifluorescence microscopes and filter sets commonly used for imaging DAPI, Cy3, and Cy5 fluorescence signals. However, in these cases fewer microbial target groups can be visualized simultaneously.
CLASI-FISH, which relies on the combinatorial labeling of microbial cells with multiple different fluorophores, can differentiate more than eight organisms in one experiment (Valm et al., 2011). However, the approach introduced here, uses a well-established standard protocol for FISH with rRNA-targeted DNA oligonucleotide probes, and does not depend on image post-processing or image analysis steps other than false-coloring of the obtained signals. In particular, our method, unlike all previously published multicolor FISH methods, does not rely on color blending. Thus, the imaging parameters can be freely adjusted to the signal intensity of each fluorophore and target organism, without affecting the correct identification of other organisms in the same experiment. Nevertheless, the alternative fluorophores can also be used for combinatorial labeling if phylogenetically nested probes are applied (Supplementary Figures S4B, S6), or in DOPE-FISH, (MiL)-FISH and CLASI-FISH protocols to further increase the number of organisms detectable by these methods. However, the same biases and constrains would apply to combinatorial labeling with the alternative fluorophores as for the conventional fluorophores used in previously published combinatorial labeling methods.
Multicolor rRNA-targeted FISH is a powerful tool with many potential applications in microbial ecology and medical microbiology. For example, multicolor FISH can efficiently complement DNA sequencing-based microbiome studies by revealing the spatial arrangement of multiple different organisms in biofilms and other complex samples (Mark Welch et al., 2016). In this context, the preservation of 3D structures is important. Previous protocols improved the structure preservation during FISH by embedding already fixed samples in agarose, polyacrylamide, or polymerizing resin (Moter et al., 1998; Daims et al., 2001, 2006; Mark Welch et al., 2016). Alternatively, biofilm was fixed while still attached to its substratum and subsequently detached and cryosectioned for FISH analysis (Almstrand et al., 2013). The embedding of samples already prior to or during fixation, as applied in this study, can further improve structure preservation. However, the fixation and embedding protocol as applied in this study is only suitable for the FISH analysis of Gram-negative microorganisms, as formaldehyde fixation would hamper the FISH-based detection Gram-positive microorganisms (Braun-Howland et al., 1992). In addition, the embedding approach has only been tested with floccular samples (activated sludge) and will likely need adaptations for use with other types of samples such as sessile biofilms. As a next step, different embedding media (including those mentioned above) and fixation protocols could be tested to develop an optimized method for the pre-fixation embedding and subsequent multicolor FISH of flocs, biofilms, and tissue samples.
The new multicolor FISH method is based on the standard FISH protocol, with the key modification that the rRNA-targeted oligonucleotide probes are labeled with non-canonical fluorophores. Experiments performed in this study have validated this method and showed that the selected fluorophores do not alter the hybridization behavior or specificity of rRNA-targeted oligonucleotide probes across a wide range of target organisms. Notably, the preparation of samples for this multicolor FISH approach does also not differ from standard FISH. Hence, we expect that in future studies no additional experimental controls beyond those applying to the standard FISH protocol need to be performed. In consequence, the multicolor FISH method should also be compatible with manual or automated quantitative FISH approaches that have been used in combination with the standard FISH protocol. These approaches, and their limitations, have been reviewed in detail elsewhere (Daims and Wagner, 2007). Approaches to physiologically characterize uncultured microorganisms, by combined single-cell isotope labeling, FISH, and chemical imaging (Wagner, 2009), provide both spatial and functional information about the target organisms. If combined with multicolor FISH, these tools could be used even more efficiently, for example to monitor the utilization of isotope-labeled substrates by multiple different organisms. Such applications should be facilitated by a straightforward multicolor FISH approach, which does not need complex image processing procedures and is easy to interpret. The method introduced here meets these requirements. It may become a valuable tool in future studies, which aim to verify “omics”-based hypotheses on the ecological roles of uncultured microorganisms by in situ functional tests at the single-cell level. In summary, our multicolor FISH method is straightforward, easy to implement, and should be compatible with virtually all applications of standard FISH with rRNA-targeted oligonucleotide probes.
PP, ML, and HD conceived the research idea and contributed to the development of the research plan. ML and MS performed the laboratory work. ML, PP, and HD carried out image analysis and evaluated the data. ML, PP, and HD were the primary authors writing the manuscript, while all other authors were involved in writing and editing of the manuscript.
This research was supported by the Austrian Science Fund (FWF) project P27319-B21 to HD.
The authors declare that all research was conducted in the absence of commercial or financial relationships that could be construed as a conflict of interest.
We would like to thank Adrian Berger, Nadia Ahlers, and Julia Ramesmeyer for technical assistance, and David Berry and Alexander Loy for discussion. Katharina Kitzinger is acknowledged for providing cells of “Candidatus Nitrotoga fabula.”
The Supplementary Material for this article can be found online at: https://www.frontiersin.org/articles/10.3389/fmicb.2019.01383/full#supplementary-material
FIGURE S1 | Excitation and emission spectra of the fluorochromes used for multicolor FISH and of Cy3 and Cy5. (A) Excitation spectra. Wavelengths indicated after the fluorochrome names and by vertical lines are the excitation wavelengths applied for imaging. For Atto 425 and DY-681, different wavelengths than the maxima of the excitation spectra were used because of technical limitations of the microscopy equipment. (B) Emission spectra. Shaded regions indicate the wavelength windows used for recording the fluorescence emitted by the respective dyes. The spectral properties of the fluorochromes are listed in Table 2 in the main text. RU, relative units.
FIGURE S2 | Excitation crosstalk and emission bleed-through of the dyes Cy3 and Cy5 with alternative fluorophores used in this study. Mean fluorescence intensities of Escherichia coli cells after FISH using probe EUB338-I labeled with the respective fluorochrome are shown. “Imaging settings” refers to the applied excitation wavelength and emission recording window. Note the logarithmic scaling of the y-axes. At least 100 E. coli cells were evaluated for each combination of fluorophore and imaging settings. RU, relative units. (A) Analysis of the fluorophores Atto 532, Cy3, and Atto 565. (B) Analysis of the fluorophores Atto 633 and Cy5.
FIGURE S3 | Dissociation profiles of probe EUB338-I labeled with the different fluorochromes. E. coli was used as the target organism in FISH experiments with increasingly stringent hybridization and washing conditions. Data points depict the mean fluorescence intensity of at least 100 E. coli cells at each formamide concentration in the hybridization buffer. Error bars (s.e.m.) are not shown if smaller than symbols. Probe dissociation curves (dashed lines) were approximated by non-linear regression with a sigmoidal regression model. Fluorochromes are indicated above the plots. Note the different scaling of the y-axes. RU, relative units.
FIGURE S4 | Simultaneous visualization, by multicolor FISH, of seven phylogenetically distinct microbial isolates in a mixture of pure cultures (mock community). The organisms, assigned false colors, rRNA-targeted oligonucleotide probes, and fluorochromes are indicated. (A) Representative image showing all organisms in the same microscopic field of view. Scale bar, 20 μm. (B) Same field of view as in panel (A), but showing the fluorescence signal of probes EUB338-I to III targeting most bacteria. Several rod-shaped B. subtilis cells, which appear in panel (B), could not be visualized in panel (A). The binding sites of probes EUB338 and LGC354 at the 16S rRNA overlap, so that a more efficient hybridization of one probe can lead to a very dark fluorescent signal of the respective other probe. Scale bar, 20 μm.
FIGURE S5 | Visualization of a mixture of E. coli and S. cerevisiae cells. E. coli was stained by FISH with the EUB338 probe mix labeled with Atto 633 (false-colored in red). S. cerevisiae was not labeled by FISH. Instead, the autofluorescence of the yeast cells (false-colored in cyan) was recorded using the same imaging settings as would be needed for recording the signals of dye Atto 425. Scale bar, 10 μm.
FIGURE S6 | Simultaneous visualization of three Nitrospira target groups after sequential FISH at three different formamide concentrations. The applied probes were labeled with alternative fluorochromes. The target organisms, assigned false colors, rRNA-targeted oligonucleotide probes, and fluorochromes are indicated. Scale bar, 20 μm.
FIGURE S7 | Spatial arrangement pattern analysis of ammonia- and nitrite-oxidizing bacteria in activated sludge. The sludge was either embedded in agarose prior to formaldehyde fixation or conventionally fixed in formaldehyde without embedding. The horizontal dashed line (y = 1) indicates random spatial distribution at the respective distance. Values above this line indicate coaggregation (i.e., NOB cells were more abundant at this distance from AOB cells than expected for randomly distributed populations). Values below this line indicate that NOB cells were less abundant at this distance from AOB cells than expected for randomly distributed populations. Data points are means from the analysis of n = 23 confocal z-stacks. Shaded areas depict 95% confidence intervals of the mean. RU, relative units.
Adamczyk, J., Hesselsoe, M., Iversen, N., Horn, M., Lehner, A., Nielsen, P. H., et al. (2003). The isotope array, a new tool that employs substrate-mediated labeling of rRNA for determination of microbial community structure and function. Appl. Environ. Microbiol. 69, 6875–6887. doi: 10.1128/aem.69.11.6875-6887.2003
Almstrand, R., Daims, H., Persson, F., Sörensson, F., and Hermansson, M. (2013). New methods for analysis of spatial distribution and coaggregation of microbial populations in complex biofilms. Appl. Environ. Microbiol. 79, 5978–5987. doi: 10.1128/AEM.01727-13
Amann, R., Snaidr, J., Wagner, M., Ludwig, W., and Schleifer, K. H. (1996). In situ visualization of high genetic diversity in a natural microbial community. J. Bacteriol. 178, 3496–3500. doi: 10.1128/JB.178.12.3496-3500.1996
Amann, R. I., Krumholz, L., and Stahl, D. A. (1990). Fluorescent-oligonucleotide probing of whole cells for determinative, phylogenetic, and environmental studies in microbiology. J. Bacteriol. 172, 762–770. doi: 10.1128/jb.172.2.762-770.1990
Behnam, F., Vilcinskas, A., Wagner, M., and Stoeckerb, K. (2012). A straightforward DOPE (double labeling of oligonucleotide probes)-FISH (fluorescence in situ hybridization) method for simultaneous multicolor detection of six microbial populations. Appl. Environ. Microbiol. 78, 5138–5142. doi: 10.1128/AEM.00977-12
Beliveau, B. J., Boettiger, A. N., Avendaño, M. S., Jungmann, R., McCole, R. B., Joyce, E. F., et al. (2015). Single-molecule super-resolution imaging of chromosomes and in situ haplotype visualization using Oligopaint FISH probes. Nat. Commun. 6:7147. doi: 10.1038/ncomms8147
Berry, D., Stecher, B., Schintlmeister, A., Reichert, J., Brugiroux, S., Wild, B., et al. (2013). Host-compound foraging by intestinal microbiota revealed by single-cell stable isotope probing. Proc. Natl. Acad. Sci. U.S.A. 110, 4720–4725. doi: 10.1073/pnas.1219247110
Borlinghaus, R. T., Birk, H., and Schreiber, F. (2012). Detectors for sensitive detection?: HyD. Curr. Microsc. Contrib. Adv. Sci. Technol. 2, 818–825.
Braun-Howland, E. B., Danielsen, S. A., and Nierzwicki-Bauer, S. A. (1992). Development of a rapid method for detecting bacterial cells in situ using 16S rRNA-targeted probes. Biotechniques 13, 928–934.
Chamma, I., Letellier, M., Butler, C., Tessier, B. C., Lim, K.-H., Gauthereau, I., et al. (2016). Mapping the dynamics and nanoscale organization of synaptic adhesion proteins using monomeric streptavidin. Nat. Commun. 7:10773. doi: 10.1038/ncomms10773
Daims, H., Brühl, A., Amann, R., Schleifer, K. H., and Wagner, M. (1999). The domain-specific probe EUB338 is insufficient for the detection of all bacteria: development and evaluation of a more comprehensive probe set. Syst. Appl. Microbiol. 22, 434–444. doi: 10.1016/S0723-2020(99)80053-8
Daims, H., Lebedeva, E. V., Pjevac, P., Han, P., Herbold, C., Albertsen, M., et al. (2015). Complete nitrification by nitrospira bacteria. Nature 528:504. doi: 10.1038/nature16461
Daims, H., Lücker, S., and Wagner, M. (2006). Daime, a novel image analysis program for microbial ecology and biofilm research. Environ. Microbiol. 8, 200–213. doi: 10.1111/j.1462-2920.2005.00880.x
Daims, H., Nielsen, J. L., Nielsen, P. H., Wagner, M., and Schleifer, K. (2001). In situ characterization of Nitrospira -like nitrite-oxidizing bacteria active in wastewater treatment plants. Appl. Environ. Microbiol. 67, 5273–5284. doi: 10.1128/AEM.67.11.5273
Daims, H., Stoecker, K., and Wagner, M. (2005). “Fluorescence in situ hybridization for the detection of prokaryotes,” in Advanced Methods in Molecular Microbial Ecology, eds A. M. Osborn and C. J. Smith (Abingdon: Bios-Garland),213–239.
Daims, H., and Wagner, M. (2007). Quantification of uncultured microorganisms by fluorescence microscopy and digital image analysis. Appl. Microbiol. Biotechnol. 75, 237–248. doi: 10.1007/s00253-007-0886-z
Daims, H., and Wagner, M. (2011). In situ techniques and digital image analysis methods for quantifying spatial localization patterns of nitrifiers and other microorganisms in biofilm and flocs. Methods Enzymol. 496, 185–215. doi: 10.1016/B978-0-12-386489-5.00008-7
Dolinšek, J., Lagkouvardos, I., Wanek, W., Wagner, M., and Daims, H. (2013). Interactions of nitrifying bacteria and heterotrophs: identification of a Micavibrio-like putative predator of Nitrospira spp. Appl. Environ. Microbiol. 79, 2027–2037. doi: 10.1128/AEM.03408-12
Foissner, W. (2016). Protists as bioindicators in activated sludge: Identification, ecology and future needs. Eur. J. Protistol. 55, 75–94. doi: 10.1016/j.ejop.2016.02.004
Giovannoni, S. J., DeLong, E. F., Olsen, G. J., and Pace, N. R. (1988). Phylogenetic group-specific oligodeoxynucleotide probes for identification of single microbial cells. J. Bacteriol. 170, 720–726. doi: 10.1128/jb.170.2.720-726.1988
Gruber-Dorninger, C., Pester, M., Kitzinger, K., Savio, D. F., Loy, A., Rattei, T., et al. (2015). Functionally relevant diversity of closely related Nitrospira in activated sludge. ISME J. 9, 643–655. doi: 10.1038/ismej.2014.156
Juretschko, S. (2000). Mikrobielle Populationsstruktur Und-Dynamik in Einer Nitrifizierenden, Denitrifizierenden Belebtschlammanlage. Ph.D. Thesis, Technische Universität München, München.
Juretschko, S., Timmermann, G., Schmid, M., Schleifer, K. H., Pommerening-Röser, A., Koops, H. P., et al. (1998). Combined molecular and conventional analyses of nitrifying bacterium diversity in activated sludge: Nitrosococcus mobilis and Nitrospira-like bacteria as dominant populations. Appl. Environ. Microbiol. 64, 3042–3051.
Kits, K. D., Sedlacek, C. J., Lebedeva, E. V., Han, P., Bulaev, A., Pjevac, P., et al. (2017). Kinetic analysis of a complete nitrifier reveals an oligotrophic lifestyle. Nature 549, 269–272. doi: 10.1038/nature23679
Kitzinger, K., Koch, H., Lücker, S., Sedlacek, C. J., Herbold, C., Schwarz, J., et al. (2018). Characterization of the first “Candidatus Nitrotoga” isolate reveals metabolic versatility and separate evolution of widespread nitrite-oxidizing bacteria. mBio 9, 1–16. doi: 10.1128/mBio.01186-18
Lee, N., Nielsen, P. H., Andreasen, K. H., Juretschko, S., Nielsen, J. L., Schleifer, K. H., et al. (1999). Combination of fluorescent in situ hybridization and microautoradiography-a new tool for structure-function analyses in microbial ecology. Appl. Environ. Microbiol. 65, 1289–1297.
Lücker, S., Schwarz, J., Gruber-Dorninger, C., Spieck, E., Wagner, M., and Daims, H. (2015). Nitrotoga-like bacteria are previously unrecognized key nitrite oxidizers in full-scale wastewater treatment plants. ISME J. 9, 708–720. doi: 10.1038/ismej.2014.158
Ludwig, W., Strunk, O., Westram, R., Richter, L., Meier, H., Yadhukumar, A., et al. (2004). ARB: a software environment for sequence data. Nucleic Acids Res. 32, 1363–1371. doi: 10.1093/nar/gkh293
Maixner, F., Noguera, D. R., Anneser, B., Stoecker, K., Wegl, G., Wagner, M., et al. (2006). Nitrite concentration influences the population structure of Nitrospira-like bacteria. Environ. Microbiol. 8, 1487–1495. doi: 10.1111/j.1462-2920.2006.01033.x
Manz, W., Amann, R., Ludwig, W., Vancanneyt, M., and Schleifer, K. H. (1996). Application of a suite of 16S rRNA-specific oligonucleotide probes designed to investigate bacteria of the phylum cytophaga-flavobacter-bacteroides in the natural environment. Microbiology 142, 1097–1106. doi: 10.1099/13500872-142-5-1097
Manz, W., Amann, R., Ludwig, W., Wagner, M., and Schleifer, K.-H. (1992). Phylogenetic oligodeoxynucleotide probes for the major subclasses of proteobacteria: problems and solutions. Syst. Appl. Microbiol. 15, 593–600. doi: 10.1016/s0723-2020(11)80121-9
Mark Welch, J. L., Rossetti, B. J., Rieken, C. W., Dewhirst, F. E., and Borisy, G. G. (2016). Biogeography of a human oral microbiome at the micron scale. Proc. Natl. Acad. Sci. U.S.A. 113, E791–E800. doi: 10.1073/pnas.1522149113
McIlroy, S. J., Saunders, A. M., Albertsen, M., Nierychlo, M., McIlroy, B., Hansen, A. A., et al. (2015). MiDAS: the field guide to the microbes of activated sludge. Database 2015, 1–8. doi: 10.1093/database/bav062
Meier, H., Amann, R., Ludwig, W., and Schleifer, K. H. (1999). Specific oligonucleotide probes for in situ detection of a major group of gram-positive bacteria with low DNA G+C content. Syst. Appl. Microbiol. 22, 186–196. doi: 10.1016/S0723-2020(99)80065-4
Mobarry, B. K., Wagner, M., Urbain, V., Rittmann, B. E., and Stahl, D. A. (1996). Phylogenetic probes for analyzing abundance and spatial organization of nitrifying bacteria. Appl. Environ. Microbiol. 62, 2156–2162.
Moter, A., Leist, G., Rudolph, R., Schrank, K., Choi, B. K., Wagner, M., et al. (1998). Fluorescence in situ hybridization shows spatial distribution of as yet uncultured treponemes in biopsies from digital dermatitis lesions. Microbiology 144, 2459–2467. doi: 10.1099/00221287-144-9-2459
Palatinszky, M., Herbold, C., Jehmlich, N., Pogoda, M., Han, P., von Bergen, M., et al. (2015). Cyanate as an energy source for nitrifiers. Nature 524, 105–108. doi: 10.1038/nature14856
Probandt, D., Eickhorst, T., Ellrott, A., Amann, R., and Knittel, K. (2018). Microbial life on a sand grain: from bulk sediment to single grains. ISME J. 12, 623–633. doi: 10.1038/ismej.2017.197
Quast, C., Pruesse, E., Yilmaz, P., Gerken, J., Schweer, T., Yarza, P., et al. (2013). The SILVA ribosomal RNA gene database project: Improved data processing and web-based tools. Nucleic Acids Res. 41, 590–596. doi: 10.1093/nar/gks1219
R Core Team (2017). R: A Language and Environment for Statistical Computing. Vienna: R Foundation for Statistical Computing.
Schimak, M. P., Kleiner, M., Wetzel, S., Liebeke, M., Dubilier, N., and Fuchs, B. M. (2015). MiL-FISH: Multi-labelled oligonucleotides for fluorescence in situ hybridisation improve visualization of bacterial cells. Appl. Environ. Microbiol. 82, 62–70. doi: 10.1128/AEM.02776-15
Stacy, A., Everett, J., Jorth, P., Trivedi, U., Rumbaugh, K. P., and Whiteley, M. (2014). Bacterial fight-and-flight responses enhance virulence in a polymicrobial infection. Proc. Natl. Acad. Sci. U.S.A. 111, 7819–7824. doi: 10.1073/pnas.1400586111
Stoecker, K., Dorninger, C., Daims, H., and Wagner, M. (2010). Double labeling of oligonucleotide probes for fluorescence in situ hybridization (DOPE-FISH) improves signal intensity and increases rRNA accessibility. Appl. Environ. Microbiol. 76, 922–926. doi: 10.1128/AEM.02456-09
Valm, A. M., Mark Welch, J. L., and Borisy, G. G. (2012). CLASI-FISH: Principles of combinatorial labeling and spectral imaging. Syst. Appl. Microbiol. 35, 496–502. doi: 10.1016/j.syapm.2012.03.004
Valm, A. M., Welch, J. L. M., Rieken, C. W., Hasegawa, Y., Sogin, M. L., Oldenbourg, R., et al. (2011). Systems-level analysis of microbial community organization through combinatorial labeling and spectral imaging. Proc. Natl. Acad. Sci. U.S.A. 108, 4152–4157. doi: 10.1073/pnas.1101134108
Wagner, M. (2009). Single-cell ecophysiology of microbes as revealed by Raman microspectroscopy or secondary ion mass spectrometry imaging. Annu. Rev. Microbiol. 63, 411–429. doi: 10.1146/annurev.micro.091208.073233
Wagner, M., Assmus, B., Hartmann, A., Hutzler, P., and Amann, R. (1994). In situ analysis of microbial consortia in activated sludge using fluorescently labelled, rRNA-targeted oligonucleotide probes and confocal scanning laser microscopy. J. Microsc. 176, 181–187. doi: 10.1111/j.1365-2818.1994.tb03513.x
Wagner, M., Horn, M., and Daims, H. (2003). Fluorescence in situ hybridisation for the identification and characterisation of prokaryotes. Curr. Opin. Microbiol. 6, 302–309. doi: 10.1016/S1369-5274(03)00054-7
Wallner, G., Amann, R., and Beisker, W. (1993). Optimizing fluorescent in situ hybridization with rRNA-targeted oligonucleotide probes for flow cytometric identification of microorganisms. Cytometry 14, 136–143. doi: 10.1002/cyto.990140205
Keywords: fluorescence in situ hybridization, confocal laser scanning microscopy, white light laser, fluorophores, microorganisms, three-dimensional structure, activated sludge
Citation: Lukumbuzya M, Schmid M, Pjevac P and Daims H (2019) A Multicolor Fluorescence in situ Hybridization Approach Using an Extended Set of Fluorophores to Visualize Microorganisms. Front. Microbiol. 10:1383. doi: 10.3389/fmicb.2019.01383
Received: 02 November 2018; Accepted: 03 June 2019;
Published: 19 June 2019.
Edited by:
Sabine Kleinsteuber, Helmholtz Centre for Environmental Research (UFZ), GermanyReviewed by:
Nuno F. Azevedo, University of Porto, PortugalCopyright © 2019 Lukumbuzya, Schmid, Pjevac and Daims. This is an open-access article distributed under the terms of the Creative Commons Attribution License (CC BY). The use, distribution or reproduction in other forums is permitted, provided the original author(s) and the copyright owner(s) are credited and that the original publication in this journal is cited, in accordance with accepted academic practice. No use, distribution or reproduction is permitted which does not comply with these terms.
*Correspondence: Petra Pjevac, cGpldmFjQG1pY3JvYmlhbC1lY29sb2d5Lm5ldA==; cGV0cmEucGpldmFjQGdtYWlsLmNvbQ==
Disclaimer: All claims expressed in this article are solely those of the authors and do not necessarily represent those of their affiliated organizations, or those of the publisher, the editors and the reviewers. Any product that may be evaluated in this article or claim that may be made by its manufacturer is not guaranteed or endorsed by the publisher.
Research integrity at Frontiers
Learn more about the work of our research integrity team to safeguard the quality of each article we publish.