
94% of researchers rate our articles as excellent or good
Learn more about the work of our research integrity team to safeguard the quality of each article we publish.
Find out more
ORIGINAL RESEARCH article
Front. Microbiol., 07 May 2019
Sec. Food Microbiology
Volume 10 - 2019 | https://doi.org/10.3389/fmicb.2019.00949
 Celina Z. To1
 Arun K. Bhunia1,2,3*
Shiga-toxin producing Escherichia coli (STEC) is a serious public health concern. Current Vero cell assay, although sensitive, is lengthy and requires 48–72 h to assess STEC presence in a sample. In this study, we investigated if Vero cells in a three-dimensional (3D) platform would provide improved sensitivity for rapid screening of STEC. Vero cells (epithelial kidney cell line) were grown as a monolayer (2D) or in a collagen-matrix (3D) and exposed to Shiga-toxin (Stx) preparation or STEC cells that were pre-exposed to antibiotics (mitomycin C, ciprofloxacin, or polymyxin B) for toxin induction. Lactate dehydrogenase (LDH) release from Vero cells was used as a biomarker for cytotoxicity. Modified tryptic soy broth (mTSB) as enrichment broth containing mitomycin C (2 μg/ml) or ciprofloxacin (100 ng/ml) significantly induced Stx production, which was further confirmed by the dot-immunoblot assay. The 3D Vero platform detected STEC after 6 h post-infection with cytotoxicity values ranging from 33 to 79%, which is considerably faster than the traditional 2D platform, when tested with STEC. The cytotoxicity for non-Stx producing bacteria, Salmonella, Listeria, Citrobacter, Serratia, and Hafnia was found to be below the cytotoxicity cutoff value of 15%. The detection limit for the 3D Vero cell assay was estimated to be 107 CFU/ml for bacteria and about 32 ng/ml for Stx in 6 h. STEC-inoculated ground beef samples (n = 27) resulted in 38–46% cytotoxicity, and the bacterial isolates (n = 42) from ground beef samples were further confirmed to be stx1 and stx2 positive in a multiplex PCR yielding a very low false-positive result. This 3D cell-based screening assay relies on mammalian cell pathogen interaction that can complement other molecular techniques for the detection of cell-free Stx or STEC cells from food samples for early detection and prevention.
Shiga-toxin (Stx) producing Escherichia coli (STEC) is of major public health concern and is one of the top five foodborne pathogens responsible for a high number of hospitalizations in the United States each year (Scallan et al., 2011). STEC comprises more than 200 serotypes and is Gram-negative, rod-shaped, non-spore-forming bacteria that live in the intestinal tract of animals, contaminated soil and surface waters (Mathusa et al., 2010). However, most do not cause serious illness unless it carries the Locus of Enterocyte Effacement (LEE) Pathogenicity Island that contains eae and genes for the Type III secretion system (T3SS) (Bhunia, 2018). Under severe cases, the infection can progress and lead to hemolytic uremic syndrome (HUS). Although some LEE-negative STEC strains can still cause illness, all outbreak strains that are highly associated to HUS are predominantly LEE positive strains (Hughes et al., 2006). The major serotypes of concern are O157, O26, O45, O103, O111, O121, and O145, which were responsible for several foodborne outbreaks (Martineau et al., 2001; Grant et al., 2011; Farrokh et al., 2013). The O157 STEC can be distinguished from other serovars based on their ability to ferment sorbitol. Sorbitol-positive species can either be O157:NM, non-O157 STEC, or non-STEC, and the sorbitol-negative species are O157 STEC (CDC, 2006; Pollock et al., 2010; Parsons et al., 2016). STEC can produce two types of Stx, Stx1, and Stx2, which are further subdivided into, Stx1a, Stx1c, Stx1d, Stx2a, Stx2b, Stx2c, Stx2d, Stx2f, and Stx2g, where Stx2a and Stx2c are the most prevalent subtypes that have been associated with HUS in patients (Sheoran et al., 2003; Bhunia, 2018). Therefore, advanced technologies and methods should be exploited for rapid detection of STEC including emerging pathogens that express stx gene to reduce the risk of food contamination, prevent foodborne outbreaks, and alleviate financial burden in the food industry.
Although mortality is low, the consumption of food contaminated with STEC leads to high morbidity (Karmali et al., 2010; CDC, 2012; Sperandio and Pacheco, 2012). Continuous efforts are being made to develop microbial pathogen and toxin detection platforms for improving food safety and diagnostic testing (Tokarskyy and Marshall, 2008; Wang et al., 2012; Bhunia, 2014; Cho et al., 2014; Tang et al., 2014; Wang and Salazar, 2015). According to the FDA and USDA-FSIS, a zero-tolerance policy is enforced in the United States where raw commodity must be free of the seven serogroups (O26, O103, O45, O111, O121, O145, and O157:H7) before retail distribution (Babsa et al., 2015;FSIS, 2016; Brusa et al., 2017).
Traditional culturing methods, although accurate, are tedious and lengthy. Further, the standardized methodology is only established for O157 serotype of STEC, limiting the ability to detect and quantify non-O157 STEC serotypes (FDA, 2001). Biochemical and physiological characteristics can be used to differentiate STEC O157 from non-pathogenic E. coli; however, such methods may not be able to distinguish non-O157 STEC from non-pathogenic E. coli (FDA, 2001). Molecular assay tools such as PCR and immunoassays are widely used (Tate and Ward, 2004; Medina et al., 2012; Schrader et al., 2012; Wang et al., 2016; Armstrong et al., 2018) but they may fail to differentiate viable from dead cells or active from inactive toxins. Moreover, these methods may have limited specificity due to the cross-reactivity of antibodies and performance may be hampered by inhibitors from complex food matrices. Mammalian cell-based assays have a unique advantage over other molecular techniques because of its ability to measure the physiological function and toxicity of the analyte (Banerjee and Bhunia, 2009; Banerjee et al., 2010). Furthermore, they may be suitable for rapid high throughput screening to rule out negative samples while positive samples can be examined by a confirmatory test, to achieve results in an hour to a day (Banerjee and Bhunia, 2009; Bhunia, 2014). To improve stability, sensitivity, and physiological relevance of the cell-based assays, mammalian cells are generally embedded in the natural matrices such as collagen, gelatin, elastin, silk fibroin, chitosan, chitin, fibrin, fibrinogen or grown as spheroid as a three dimensional (3D) scaffold, which mimics in vivo tissue organization and behavior and is an attractive model to study pathogen, toxin and drug interactions (Edmondson et al., 2014; Ravi et al., 2015; Barrila et al., 2018).
The Vero cell assay is considered the gold standard for screening Stx-positive samples in 48–72 h by examining the morphology of Vero cells under an inverted microscope (Konowalchuk et al., 1977). The assay was modified by our group to rapidly detect and differentiate STEC from non-pathogenic E. coli relying on the release of lactate dehydrogenase (LDH) from Vero cells as a biomarker for cytotoxicity and detection was achieved in 12–16 h (Roberts et al., 2001). Maldonado et al. (2005) used the same assay to evaluate the cytotoxicity profile of E. coli isolates from food and environmental sources. Later, Quiñones et al. (2009) modified the assay using a genetically modified Vero cell line with a destabilized variant (half-life, 2 h) of the enhanced green fluorescent protein (Vero-d2GFP) that could detect 100 pg/ml of Stx2 in 16 h. Infectious dose for Stx2a is reported to be 1–2,000 ng and for Stx1a is about 400 ng (Tesh et al., 1993; Russo et al., 2014). Although the assay has a low detection limit, the detection time is comparable to the previously mentioned LDH release assay (Roberts et al., 2001). Interestingly, commercial and newly developed cell-based assays only target Stx toxin, rather than STEC bacteria as the analyte. Furthermore, for best practice, a 6–8 h work shift is typically desired by both the food industry and government agencies. Thus our goal was to modify the Vero cell assay platform for improved sensitivity and rapid detection within the desired work-shift hours for STEC bacteria.
In this study, besides Vero cells, we also evaluated THP-1 (human monocyte cell line) for cytotoxicity, where both cell lines were embedded in a collagen matrix in a three dimensional (3D) assay platform and optimized assay conditions such as antibiotic induction for toxin production for testing with artificially contaminated ground beef samples. Samples were further confirmed for the presence of STEC (and Stx) by using the traditional culturing method and a multiplex PCR targeting stx1 and stx2. Overall, results support the potential application of 3D Vero cell platform over the THP-1 platform for detection of STEC from food samples in 6 h after an initial enrichment step.
Initially, Vero cell monolayer (2D) and THP-1 cell suspensions in a 48-well tissue culture plate were tested for their sensitivity to purified Stx (1 μg/ml) after 16 h of exposure. In 2D setup, THP-1 cells showed significantly higher sensitivity to purified commercial Stx toxin subtypes than the Vero cells, and the corresponding Trypan blue stained microscopic cell images confirmed cell death characterized by cell rounding, detachment, and dye uptake (Figures 1A,B). Both cell lines were then embedded in collagen matrix using rat-tail collagen type I in a 48-well plate as before to create a 3D cell structure (Banerjee et al., 2008) and tested against purified Stx preparations. Data show that the 3D Vero cells were more sensitive to Stx than the 3D THP-1 cells (Figures 1A,B). In contrast, 2D THP-1 is more sensitive to Stx than the 2D Vero (Figures 1A,B). Next, we determined the limit of detection for each platform to purified toxins diluted serially and found that cytotoxicity response is concentration-dependent (Figures 1C–F). In both 2D Vero and 3D THP-1 assays, the detection limit was 0.5–1 μg/ml and cytotoxicity values varied from 20 to 30% after 16 h exposure. While the 3D Vero and 2D THP-1 cell platforms detected the Stx subtypes as low as 62.5–125 ng/ml. Collectively, these data indicate that the 3D Vero cell platform provides the best response to Stx thus was selected for further assay development.
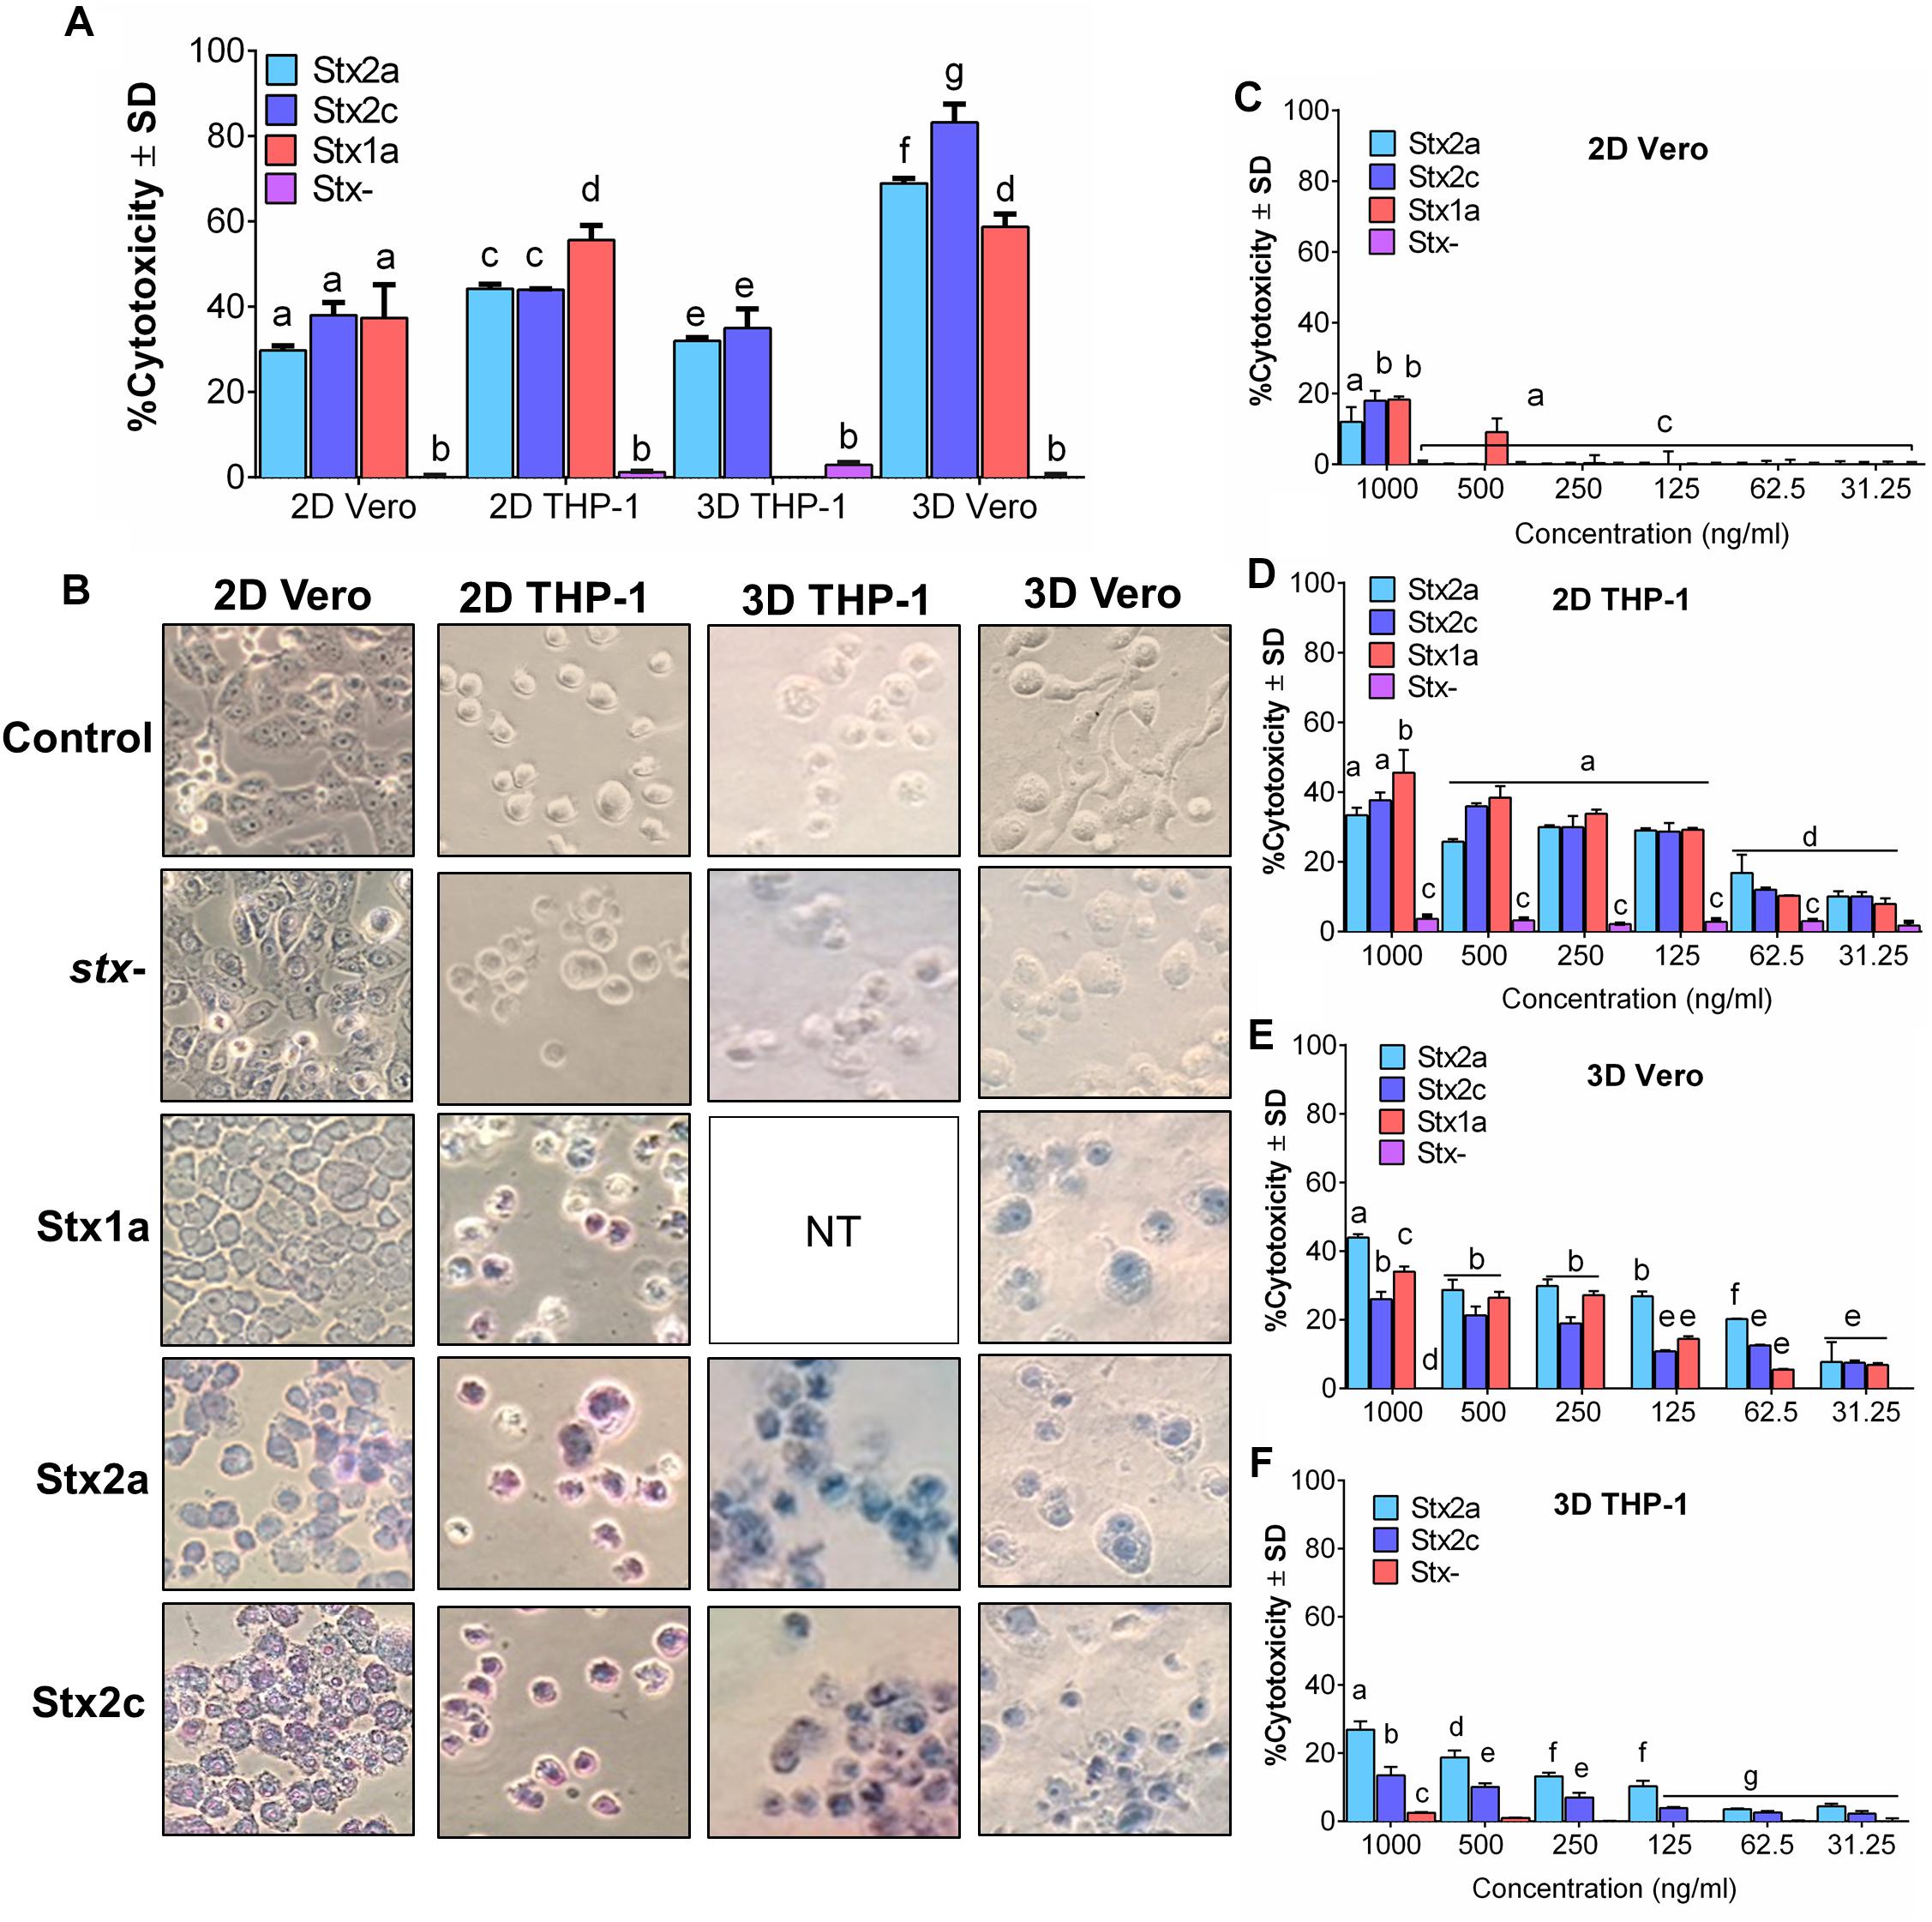
Figure 1. Vero cells are more sensitive to purified Stx than THP-1 cells in a 3D platform. Comparison of sensitivity against (A) commercial Stx1a, Stx2a, and Stx2c toxins at 1,000 ng/μl against 2D and 3D Vero and THP-1 cells after 16 h. (B) Visual examination of Vero and THP-1 cells using Trypan blue staining captured at 400× after 16 h post-infection. Cytotoxicity response to different concentrations (31.25–1,000 ng/μl) of commercial Stx1a, Stx2a, and Stx2c toxins to (C) 2D Vero, (D) 2D THP-1, (E) 3D Vero, and (F) 3D THP-1. Cell-free supernatant from stx- strain (O157:H12 strain 489) was used as a negative control. Due to the limitation of resources, Stx1a was not tested for 3D THP-1 cells.
Next, we tested the sensitivity of 2D and 3D Vero cell-platforms after exposure to stx+ and stx- STEC cells after 16 h exposure at different cell concentrations. In both 2D and 3D platforms, a minimum of 107 CFU/ml STEC was required to yield a positive response (Figures 2A–D and Table 1). The cytotoxic response from the 3D Vero platform (38 ± 7%, P < 0.05) was significantly higher (P < 0.05) than the 2D Vero platform (26 ± 2%) after exposure to 107 CFU/ml of STEC (Figures 2A–C). Exposure to a higher concentration of STEC (108 CFU/ml) induced significantly (P < 0.05) higher levels of cytotoxic response (72 ± 2 vs. 76 ± 4%) (Figure 2C). Cytotoxicity values of stx- strain (489) tested in either 2D or 3D platform (0–5 ± 1%) were significantly lower than the stx+ (204P) strain (P < 0.05). Microscopic images of Trypan blue stained Vero cells confirmed cytotoxicity response of STEC cells (Figure 2D). Furthermore, an increase in the concentration of STEC exposure increased dye uptake and cell rounding and cell damage.
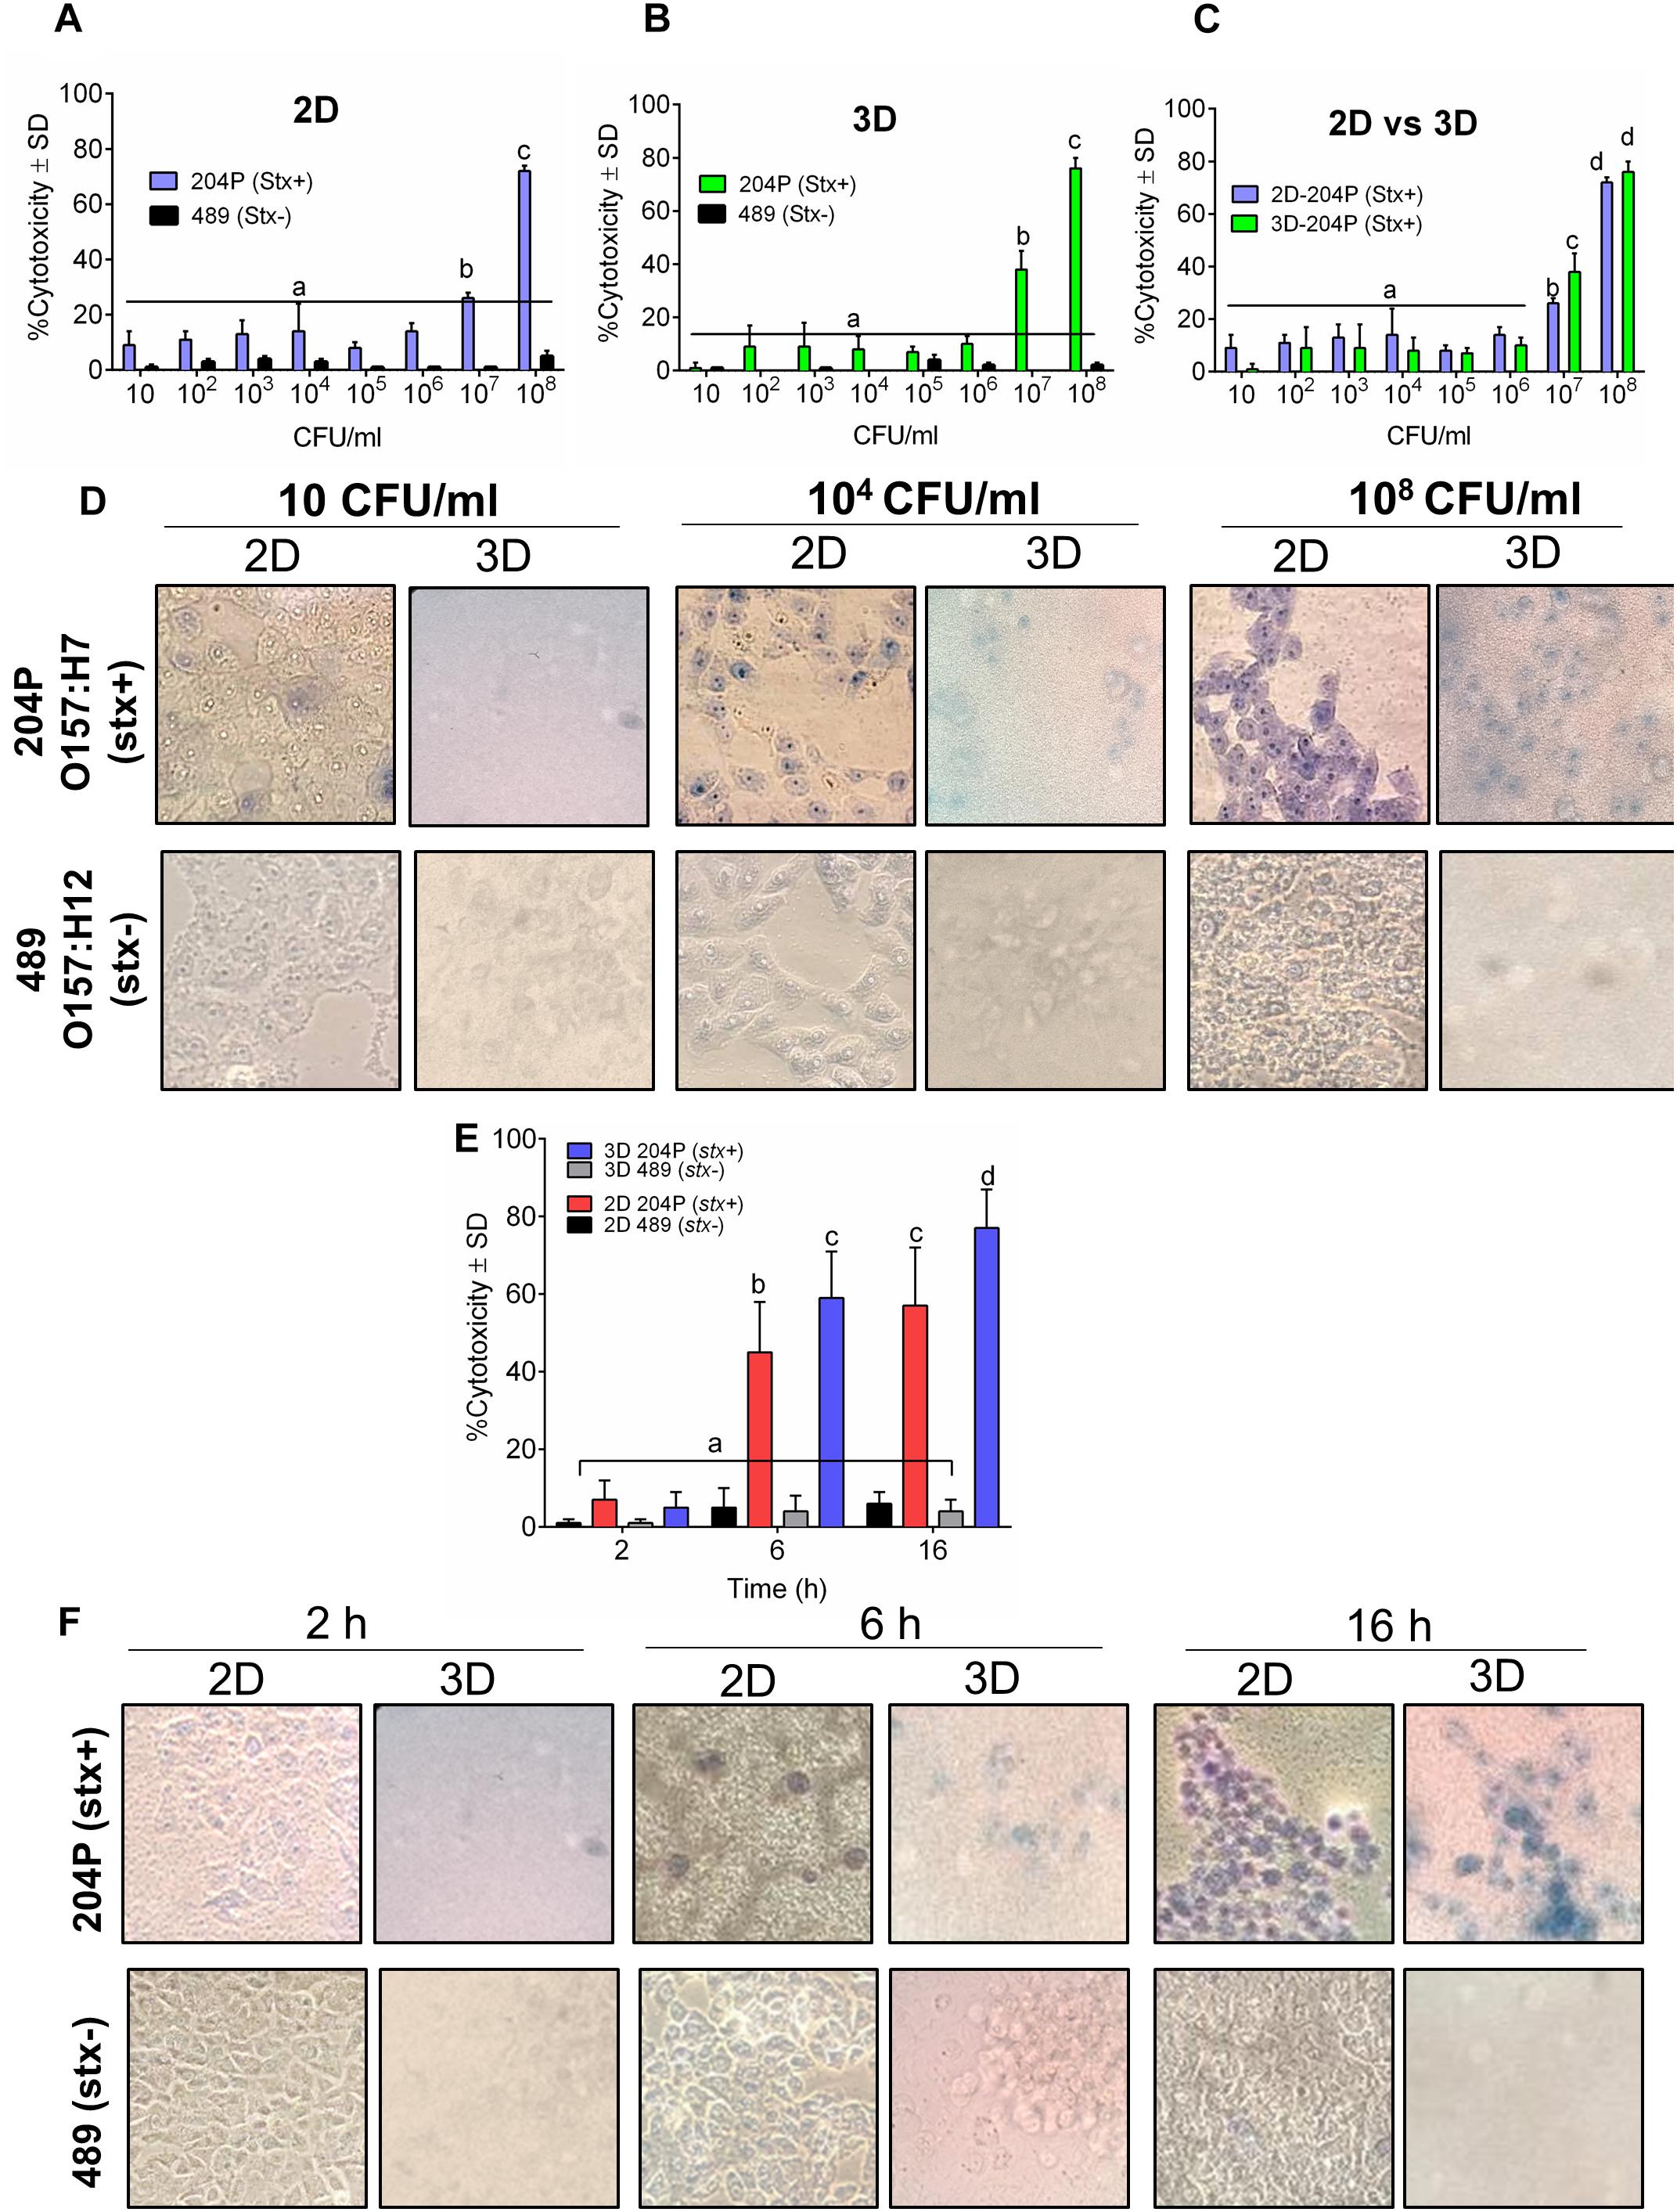
Figure 2. 3D Vero cell platform is specific for STEC cells. Analysis of cytotoxicity of stx+ (O157:H7 strain 204P) and stx- (O157:H12 strain 489) in (A) 2D Vero and (B) 3D Vero, and (C) 2D vs. 3D Vero cell assay. (D) Microscopic images showing the cytotoxicity effect of increasing concentrations of stx+ (204P) and stx- (489) E. coli cells at 16 h under 400× magnification. (E) Cytotoxicity effect of stx+ (204P) and stx- (489) E. coli cells (1 × 10⁸ CFU/ml) at 4, 6, and 16 h using 2D and 3D Vero cells and corresponding (F) light microscopic images under 400× magnification.
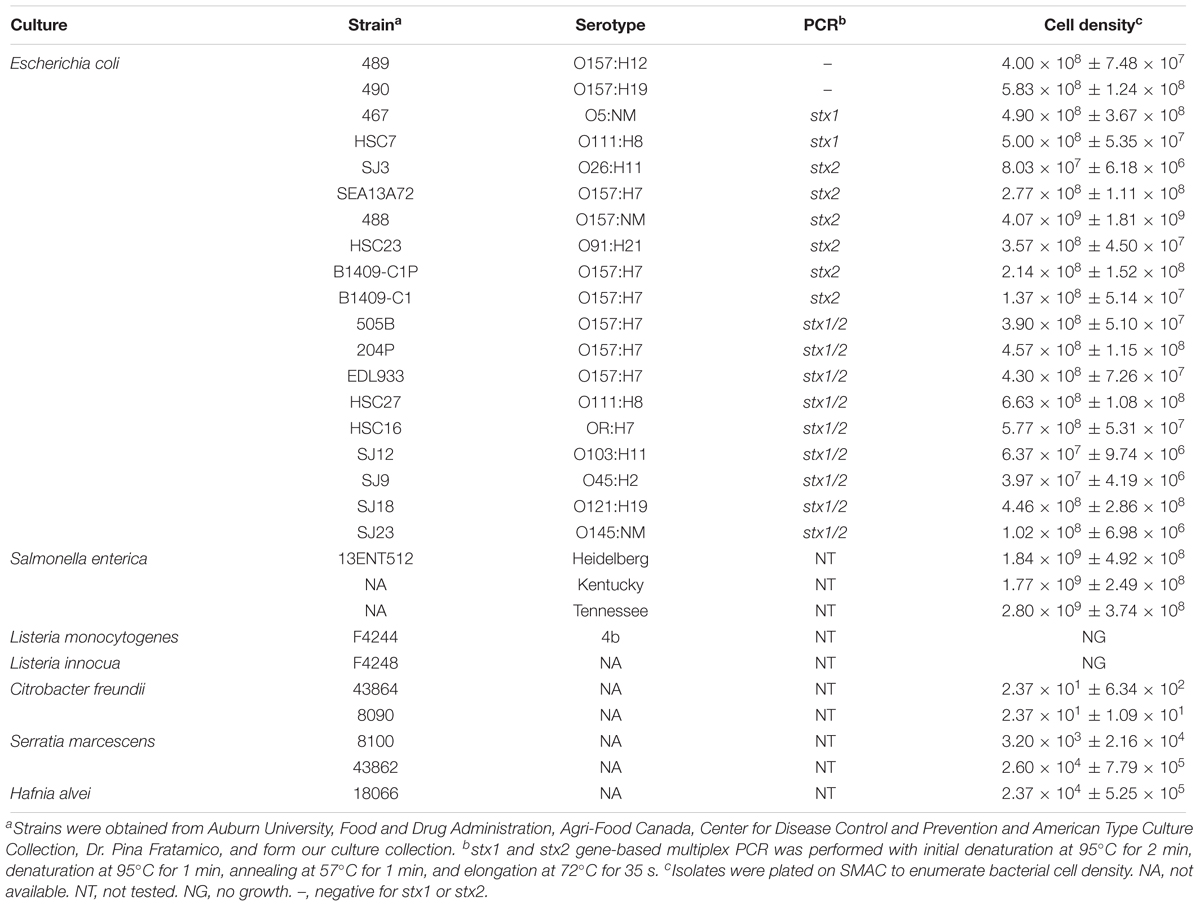
Table 1. Bacterial cell populations in mTSB (USDA enrichment) after 15 h of growth.
Next, we determined an optimal time required to show a definite difference in cytotoxicity between stx+ (204P) and stx- (489) strains. At 2 h, there was no difference, while at 6 and 16 h post-infection (hpi), cytotoxicity values were found to be significantly (P < 0.05) different between stx+ and stx- strains (Figure 2E). Furthermore, the 3D Vero showed a higher response than the 2D Vero toward stx+ strain and consequent microscopic images confirmed this observation (Figure 2F).
We verified the sensitivity of the 3D Vero cell platform to 27 STEC and non-STEC strains at 2, 6, and 16 hpi. Data show that all STEC strains tested (including serovars O157, O26, O121, O103, O45, and O145) showed significantly higher cytotoxicity (P < 0.05) than the non-STEC strains at 6 and 16 h while no discernable cytotoxicity response at 2 h (Table 2). Since no significant difference was observed among negative controls at each time point on a 2D or 3D platform (P < 0.05), a cutoff value was determined by taking three standard deviations above the mean of all negative controls (Table 3), and the assay threshold is established to be 15% (Zhang et al., 1999; Moodie et al., 2010). Microscopic images of Vero cells captured after infection with stx+ STEC (204P) and non-STEC bacterial isolates (Salmonella enterica serovar Tennessee, Salmonella Heidelberg, Salmonella Kentucky, Listeria innocua F4248, Listeria monocytogenes F4244, Citrobacter freundii, Serratia marcescens, Hafnia alvei, and non-pathogenic E. coli isolates) were in agreement with the cytotoxicity data (Supplementary Figure S1).
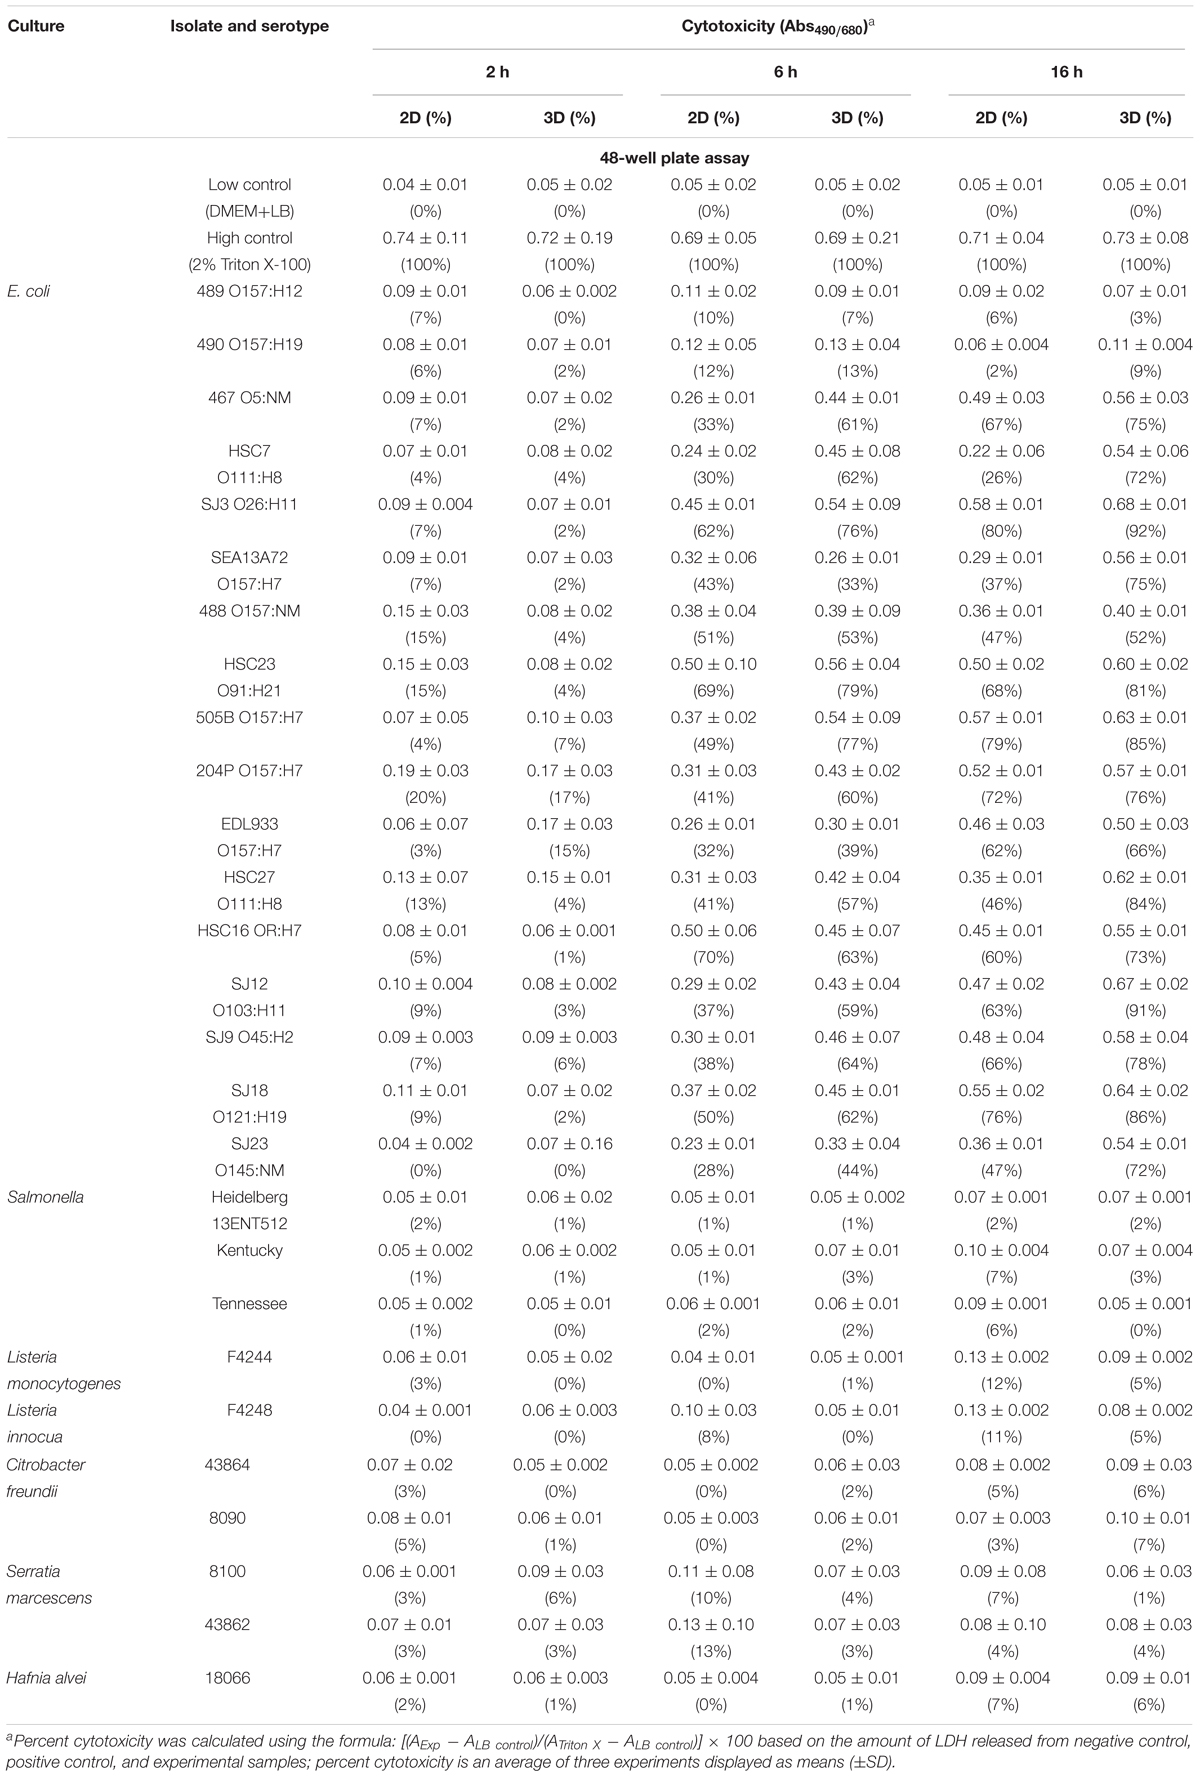
Table 2. Cytotoxicity assay of STEC and non-STEC bacteria.
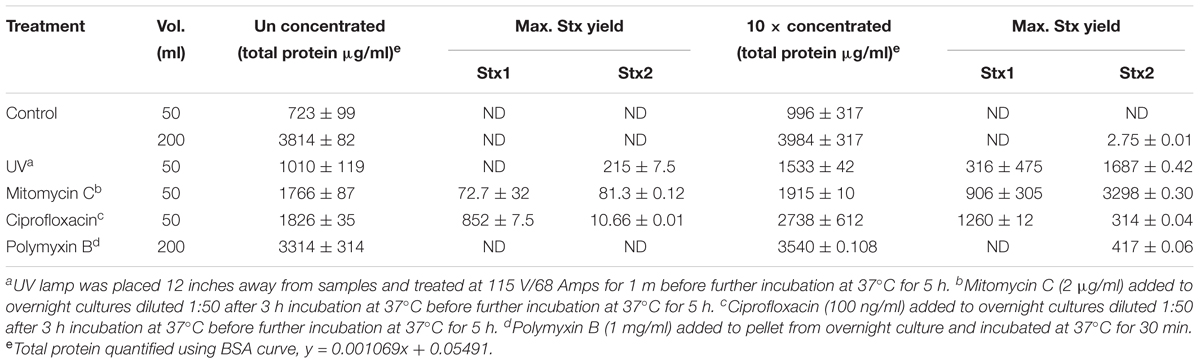
Table 3. Stx yield from stx+ 204P 5 h after induction with UV, mitomycin C, ciprofloxacin, or polymyxin B.
Our ultimate goal is to use an Stx-induction agent, such as antibiotics, together with the traditional bacterial enrichment broth before testing of food samples on a 3D cell-based assay platform without an intermediate sample-processing step. Antibiotics-induced Stx production has been reported before (Yee et al., 1993; Shimizu et al., 2003). Therefore, we wanted to examine the effect of several antibiotics, such as mitomycin C (2 μg/ml), ciprofloxacin (100 ng/ml), polymyxin B (2 mg/ml) and ultraviolet light (UV, exposure time 1.5 min) on Stx production and corresponding cytotoxicity on 2D and 3D Vero cell platforms. Data show that mitomycin C and UV induced the highest amount of Stx production than the ciprofloxacin or polymyxin B (Table 3). Toxin production was quantified in a dot blot immunoassay using anti-Stx1 and anti-Stx2 antibodies, and commercial Stx1 and Stx2 toxins as standards (Figure 3). Mitomycin C and UV induced 316 ± 475–906 ± 305 μg/ml Stx1 and 1687 ± 0.42–3298 ± 0.30 μg/ml Stx2, respectively. Ciprofloxacin induced 1,260 ± 12 μg/ml Stx1 and 314 ± 0.04 μg/ml Stx2 while polymyxin B induced undetectable levels of Stx1 and 417 ± 0.06 μg/ml Stx2. The crude toxin preparations (10× concentrated or unconcentrated) were then tested against 2D and 3D Vero cell platforms, and both showed positive effects. Notably, the effect was significantly higher on 3D than the 2D Vero cells (Figures 4A,B).
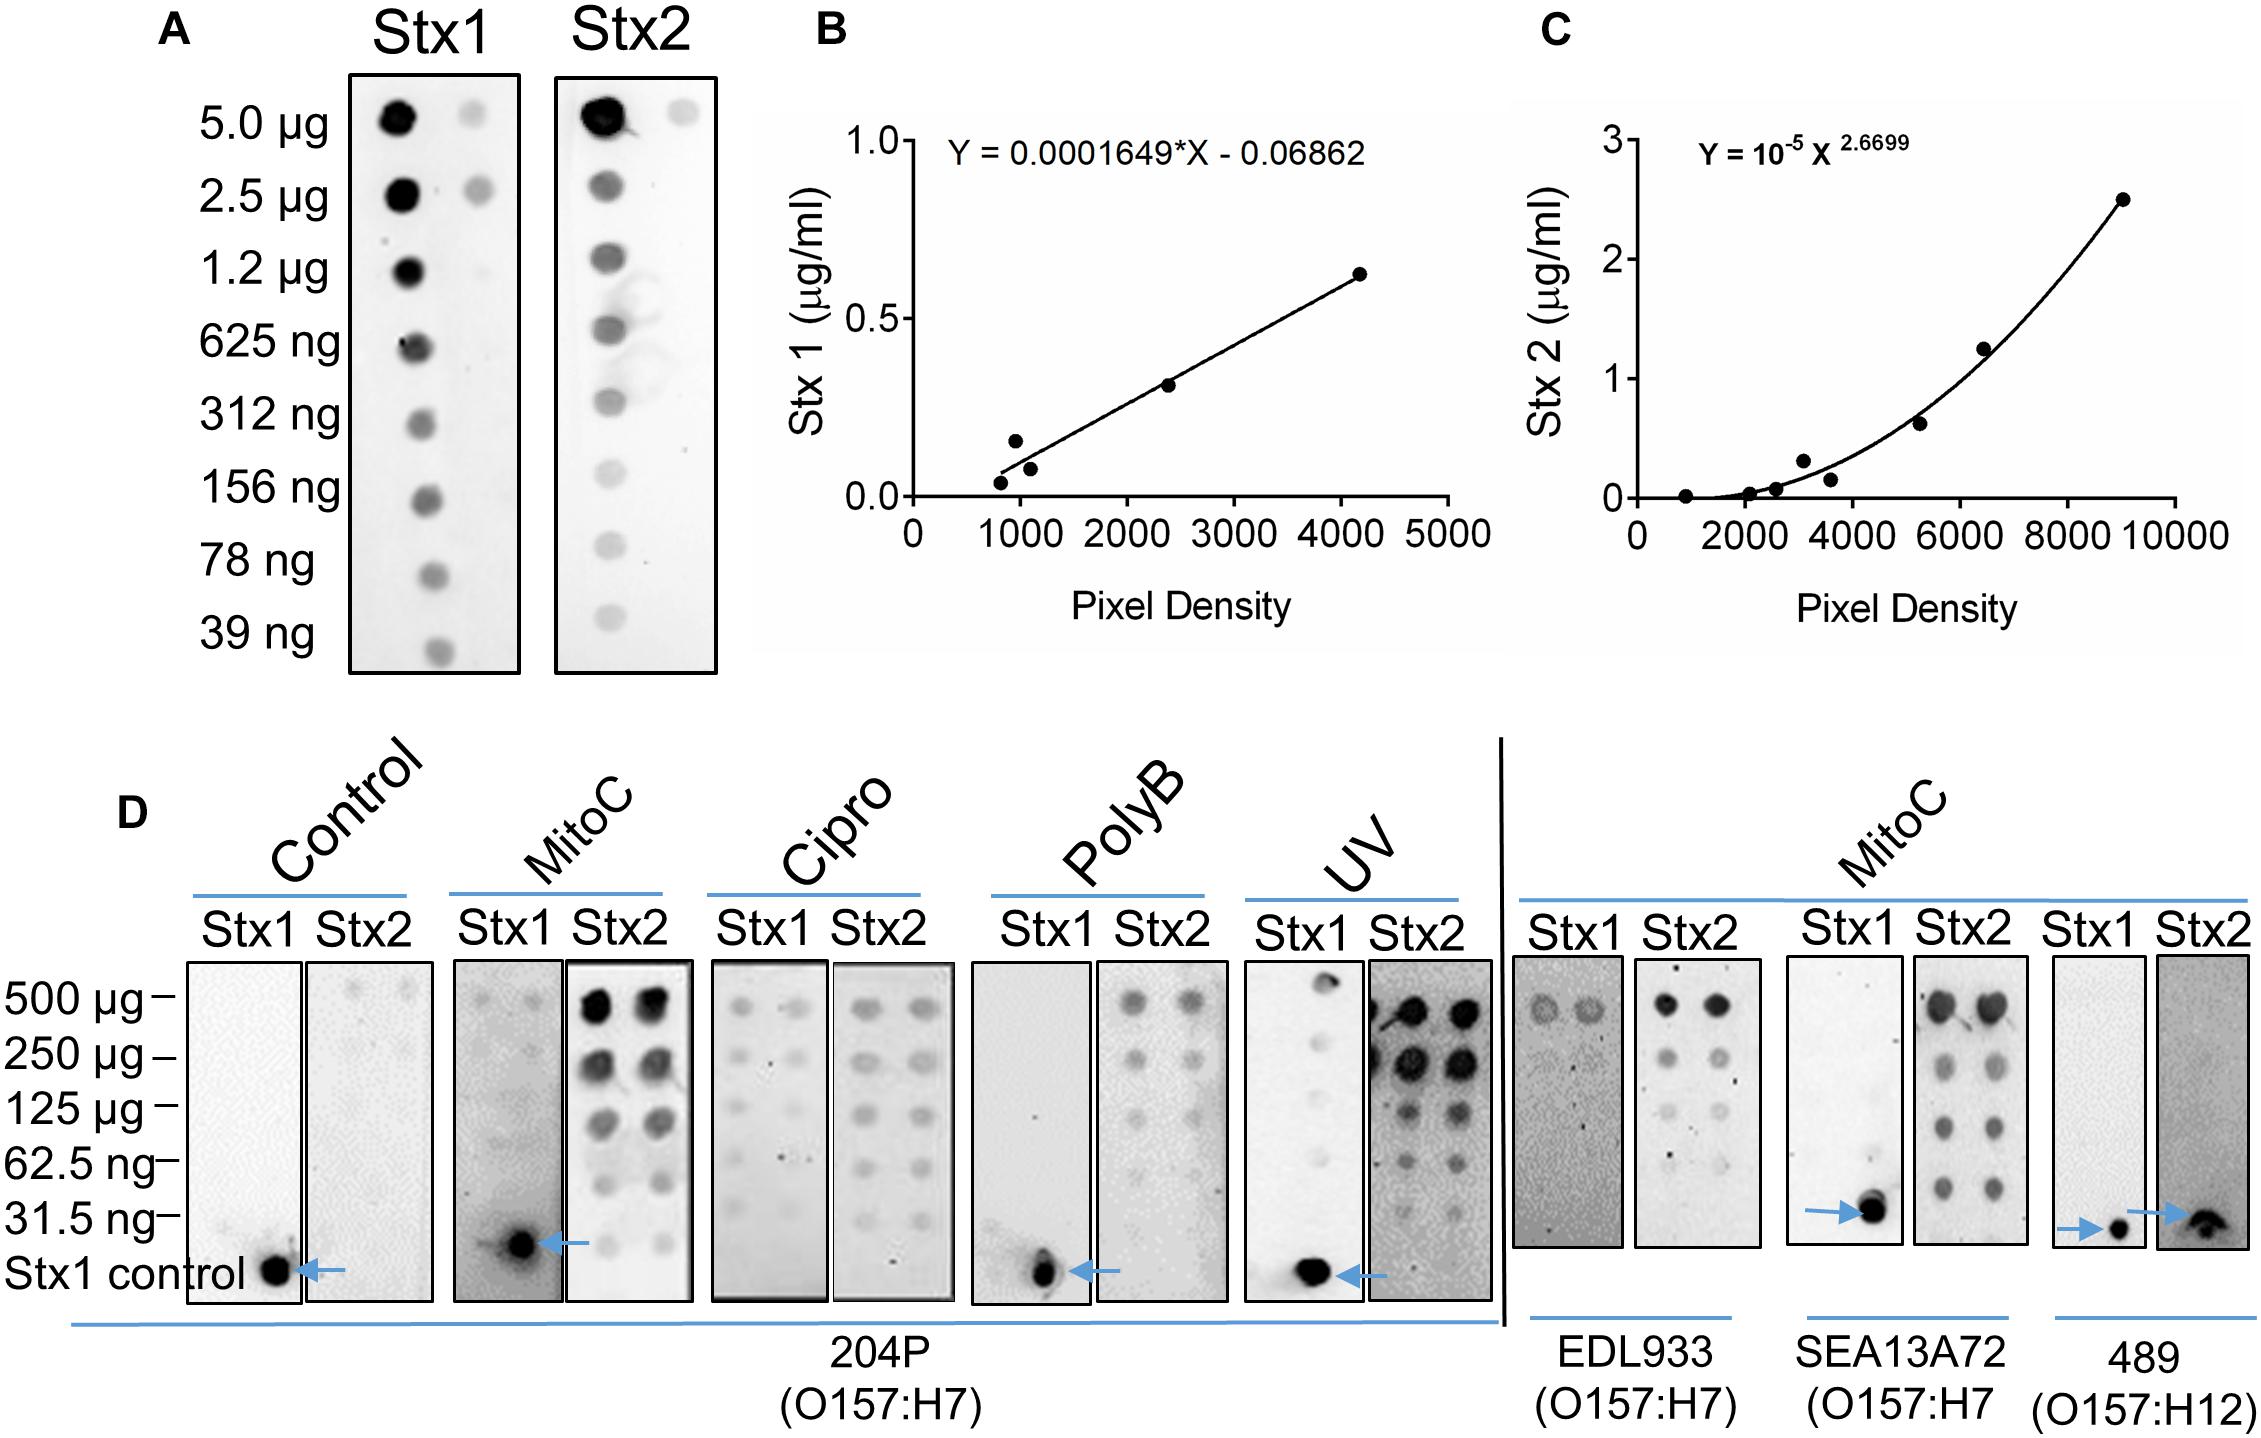
Figure 3. Antibiotic induction of STEC increases toxin production. (A) Twofold serial dilutions of commercial Stx1 and Stx2 obtained from Toxin Technologies (Sarasota, FL, United States) were used to establish toxin standard curves (B,C), respectively. (D) Dot blot analysis of crude Stx1 and Stx2 protein concentrated from stx+ strains (204P, EDL933, SEA13A72), and stx- (489) 5 h after Stx induction using antibiotics or UV light. Commercial Stx1 was used as a control in some blots (see arrows).
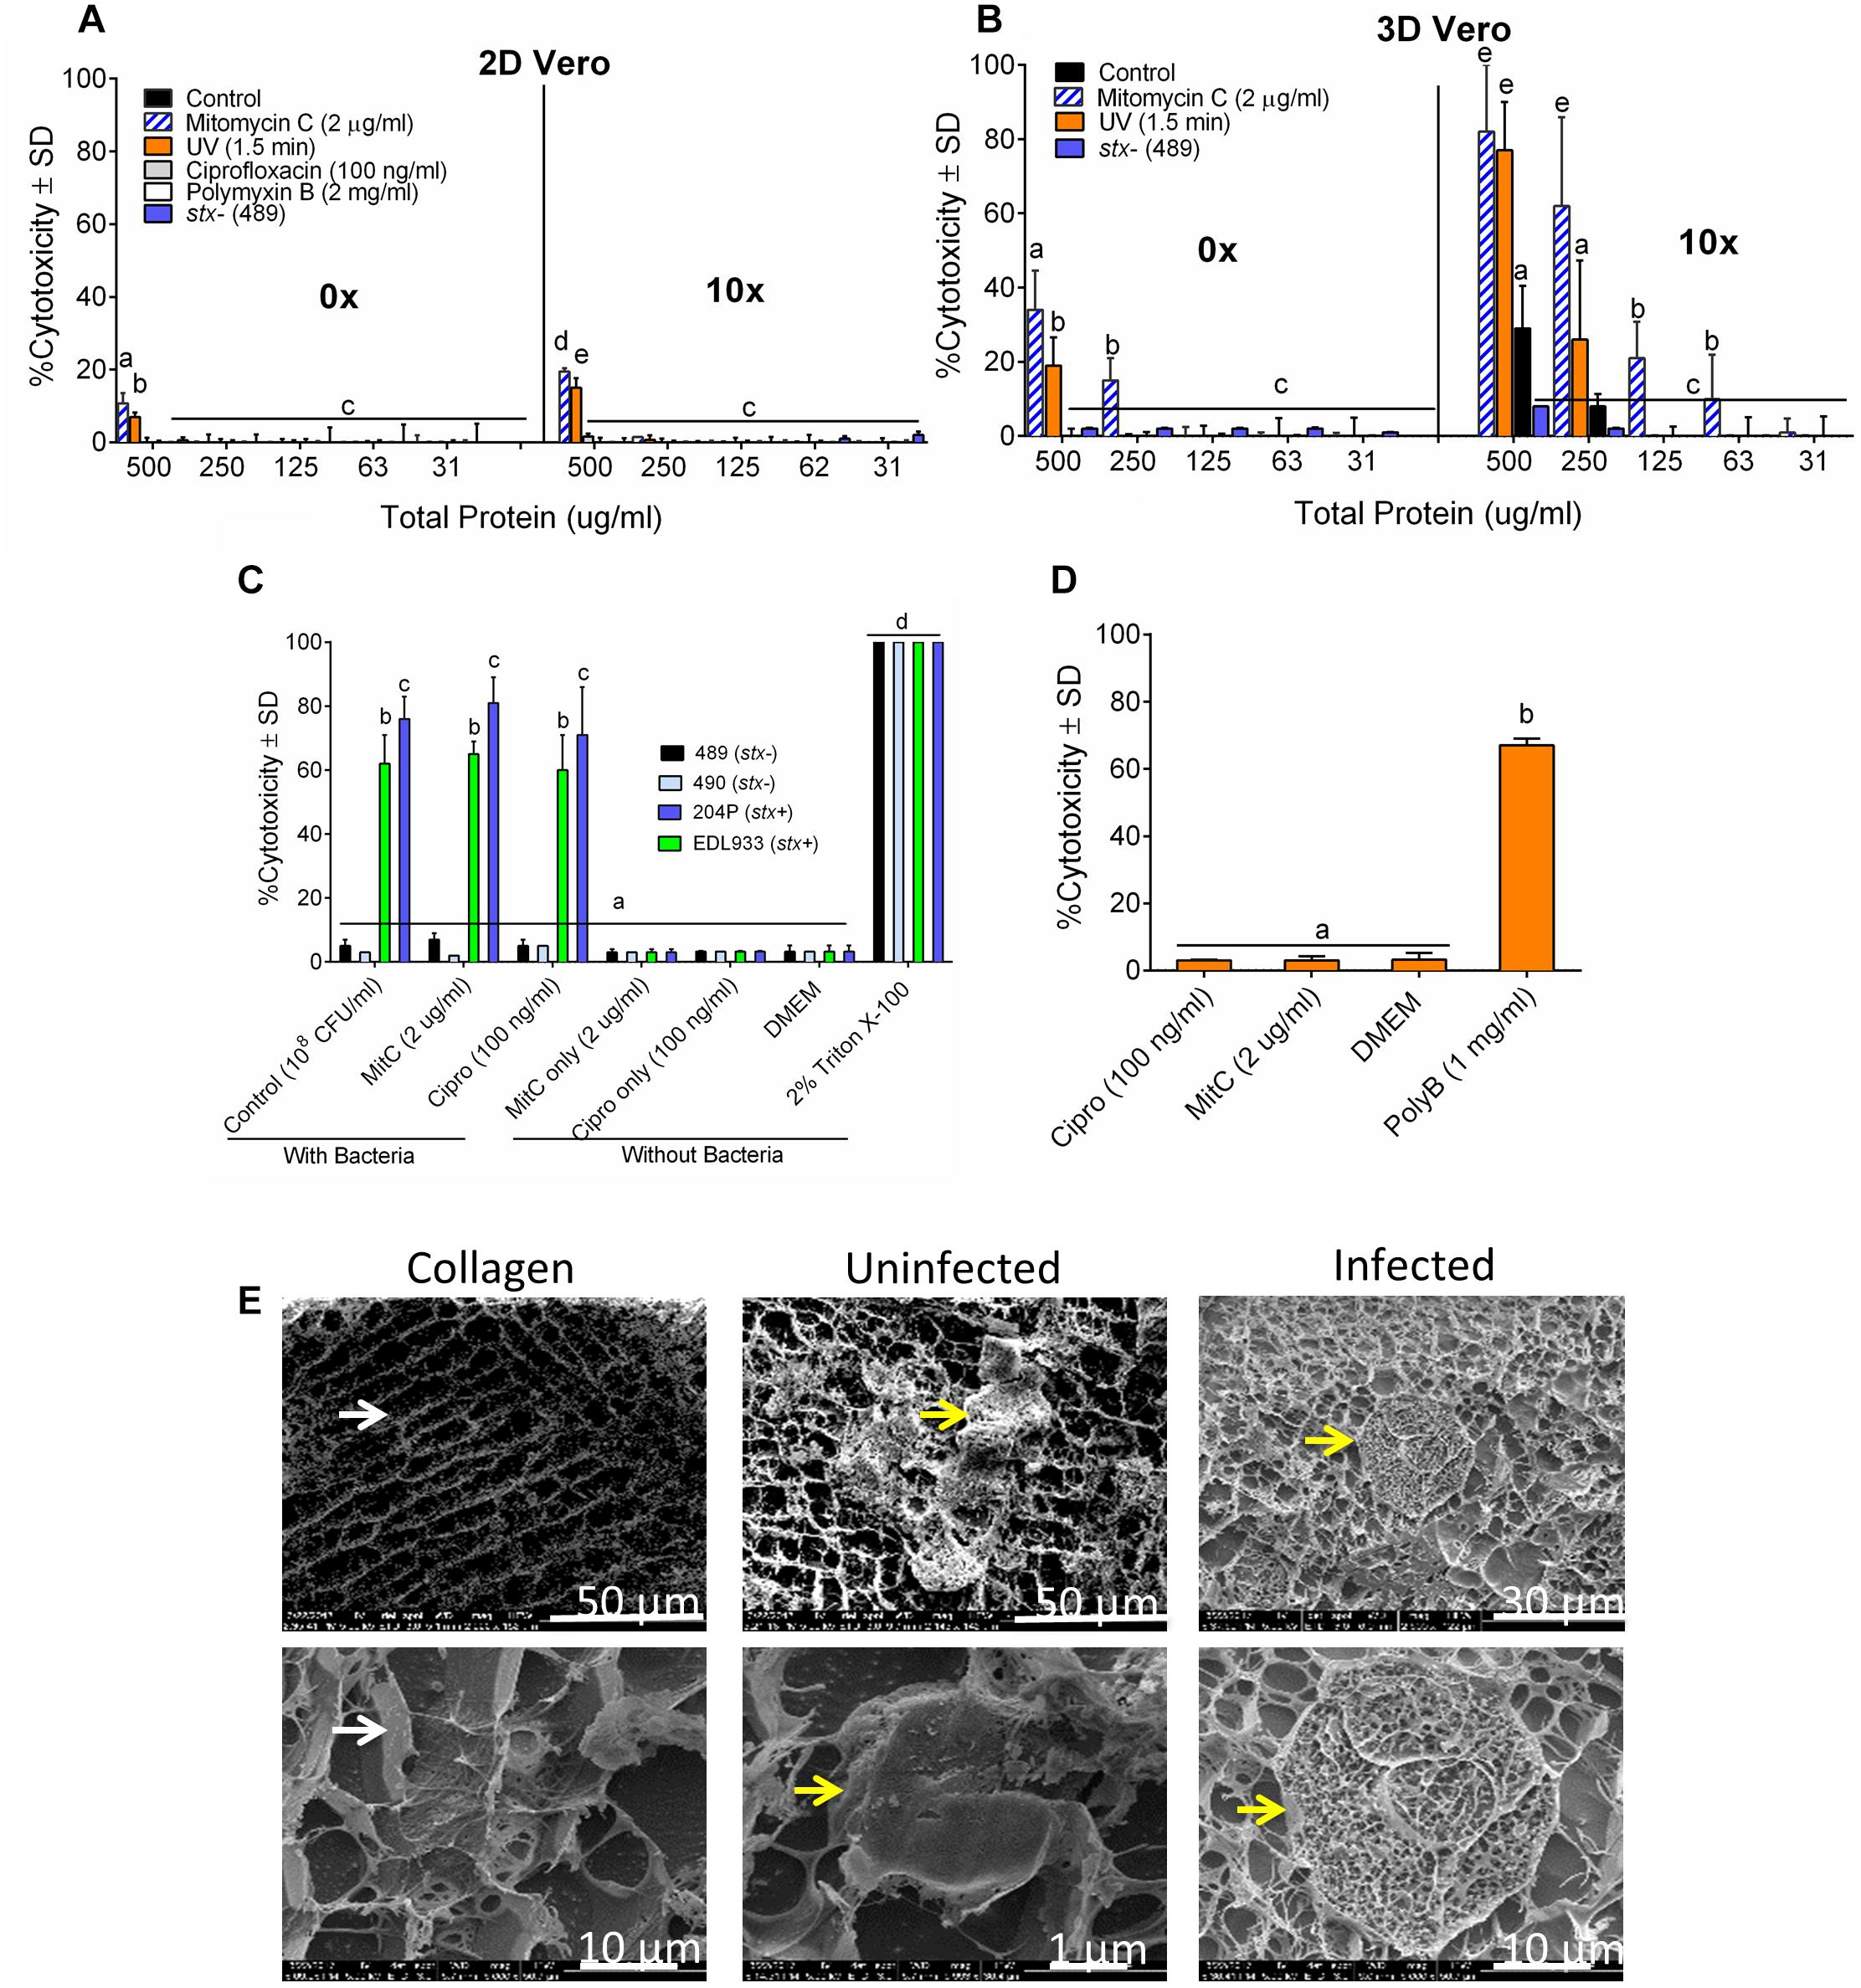
Figure 4. The sensitivity of 3D Vero cell platform. Cytotoxicity response of toxin preparations (0 or 10× concentrated) from E. coli strain 204P (stx+) after antibiotic or UV induction on (A) 2D Vero and (B) 3D Vero after 16 h exposure. (C) Vero cells exposed to bacteria pre-induced with antibiotics: STEC and non-pathogenic E. coli and (D) antibiotics alone: ciprofloxacin (Cipro), mitomycin C (MitC), and polymyxin B (Poly B) for 3 h and 16 h, respectively, at 37°C in 5% CO2. (E) Cryo-SEM images of the collagen embedded Vero cells exposed to crude Stx preparation from mitomycin C induced E. coli strain 204P (O157:H7) incubated for 8 h.
A 3-h pre-induction of stx+ strains (EDL933 and 204P) with mitomycin C (2 μg/ml) yielded 65 ± 4% and 81 ± 8% cytotoxicity, respectively. A similar trend was observed for ciprofloxacin, achieving 60 ± 11% and 71 ± 15% cytotoxicity, respectively, for these two strains. For uninduced bacteria, exposure to the same isolates had cytotoxicity values of 62 ± 9% and 76 ± 7%, respectively (Figure 4C). As expected, stx- strains (489 and 490) showed negligible cytotoxicity (3–7 ± 2%) with or without antibiotics. We also tested the cytotoxic effects of all antibiotics, if any, without the bacteria and only polymyxin B caused cytotoxicity on Vero cells (Figure 4D). Cryo-scanning electron microscopy (SEM) images also showed cell damage induced by Stx preparation from 204P strain after mitomycin C induction (Figure 4E). Stx-induced cell damage is mostly characterized by porous honeycomb-like cell architecture. Collectively, these data indicate that mitomycin C, ciprofloxacin and the UV treatment induced Stx production, and the cell-free toxin preparation showed a significantly higher cytotoxic effect than the toxin preparation from the uninduced cells. However, differences in cytotoxicity were not significant for STEC cells with or without induction when tested against the 3D Vero cells; therefore, antibiotics were not used with our food sample testing experiment described below.
Escherichia coli 204P (stx+) and 489 (stx-) – inoculated raw ground beef samples (3 samples × 9 technical replicates = 27), procured from local grocery stores were enriched in mTSB at 42°C for 15 h (FDA, 2001). An aliquot of the enriched food samples was centrifuged and resuspended in LB and then applied to 3D Vero cell platform and incubated for 6 h. Note, mTSB alone exhibited cytotoxic response against Vero, and thus this medium was replaced with LB before Vero assay (Supplementary Figure S1). A 15-h enrichment time was previously determined to yield a cell concentration of at least 107 CFU/ml (Figure 2 and Table 1) required for positive cytotoxicity on the 3D Vero platform. The 3D Vero cell assay positively detected STEC form all artificially contaminated ground beef samples tested with cytotoxicity values varied from 36 to 61% (Figure 5A). Strain 489 (stx-) served as a negative control for the assay and yielded 3–7% cytotoxicity, which is significantly lower than the stx+ samples (P < 0.05). Trypan blue staining of Vero cells confirmed dye uptake, cell rounding and characteristic cytotoxic effect, which was in good agreement with LDH-based cytotoxicity assay (Figure 5B). The presence of STEC in the enrichment broth (mTSB) was re-confirmed after subculturing on SMAC plates and multiplex PCR analysis of colonies for the presence of stx1 and stx2 genes (Figure 5C). These data clearly indicate that the 3D Vero cell platform is suitable for the detection of STEC cells from raw ground beef samples.
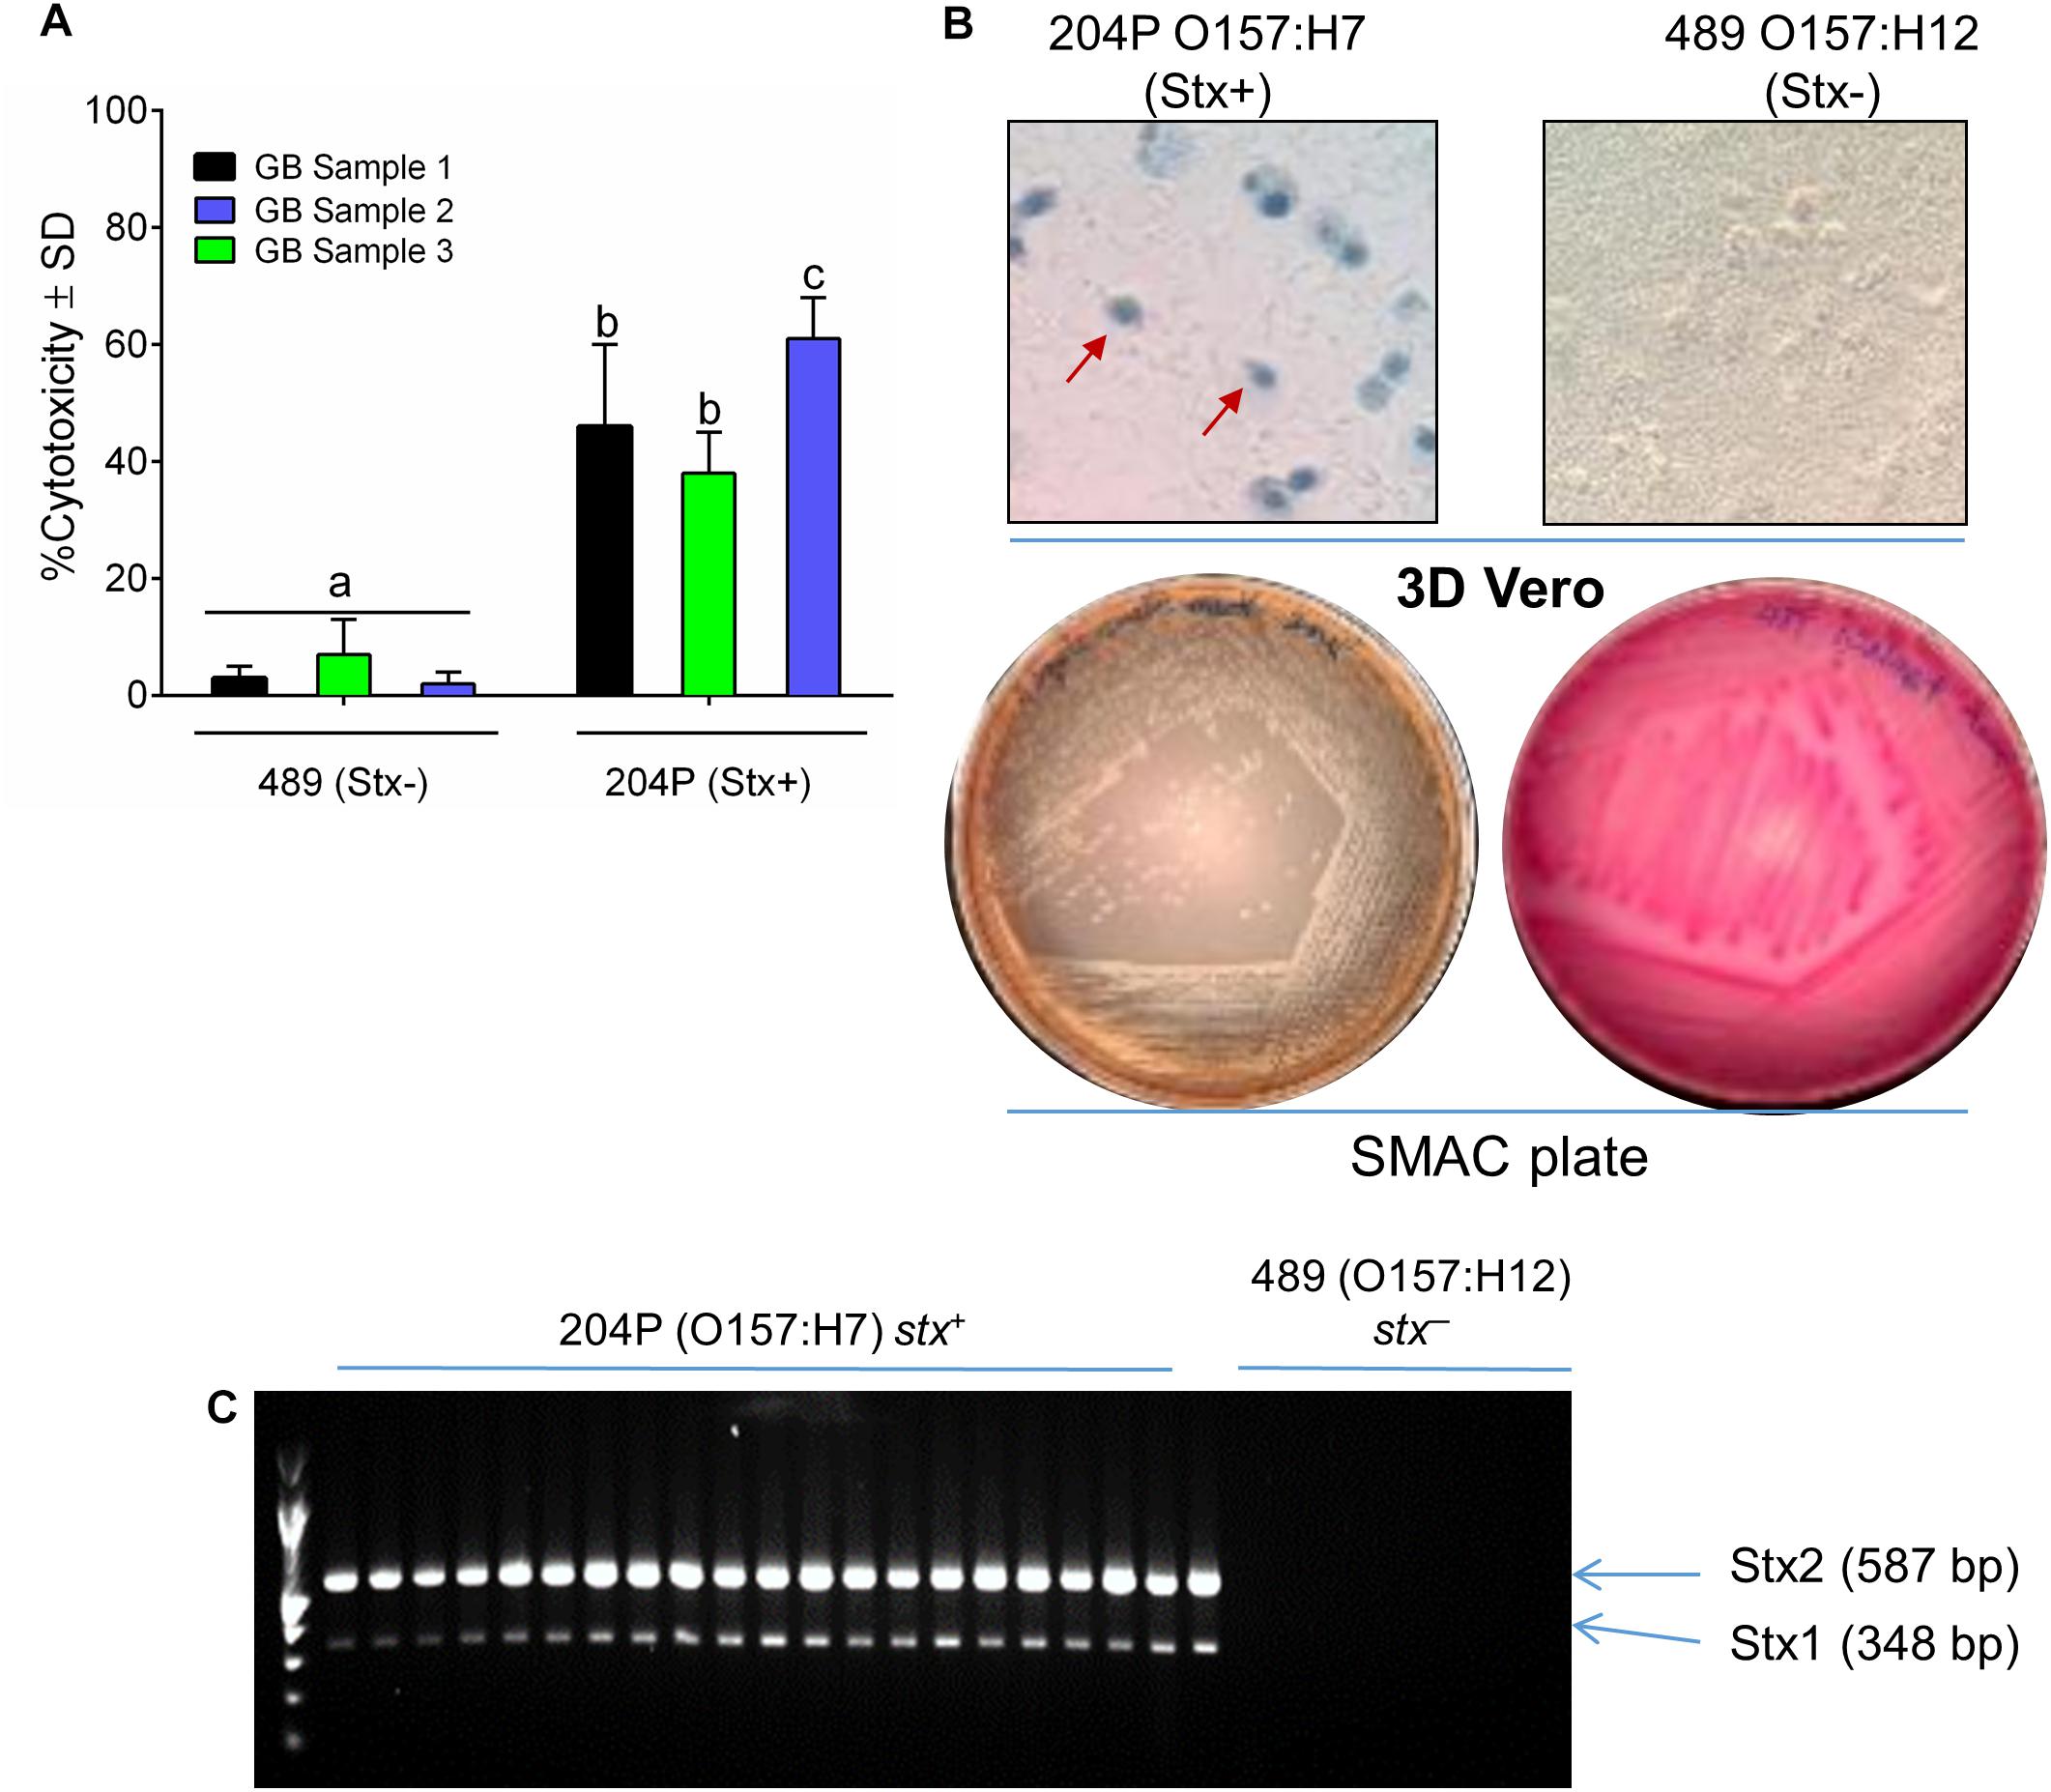
Figure 5. Detection of STEC from inoculated ground beef samples using 3D Vero. (A) Percent cytotoxicity induced by STEC from inoculated ground beef samples (n = 3 × 9 = 27) on 3D Vero. (B) Trypan blue staining of treated Vero cells shows cell rounding and membrane damage after exposure to ground beef spiked with strain 204P (stx+) but not with 489 (stx-). Plating on SMAC plate (B) and PCR (C) confirmed the presence of STEC cells and stx1 (348 bp) and stx2 genes (587 bp), respectively, from inoculated ground beef samples.
This study demonstrates the application of the 3D Vero cell platform for rapid and sensitive detection and screening of Shiga-toxin producing E. coli from non-STEC bacteria in food samples. We employed the 3D Vero cell platform, which was able to detect both STEC cells and cell-free toxins in 6 h. This 3D Vero cell platform showed a cytotoxic response only to STEC cells or Stx preparations but no response to non-STEC cells. In this study, the Vero cell culturing in 3D platform, and toxin induction approach helped improve the assay sensitivity thereby reducing the detection time to about 6 h, which is a significant improvement over previous reports (Konowalchuk et al., 1977; Roberts et al., 2001; Quiñones et al., 2009). We found that the Vero cells in the 3D platform are more sensitive to STEC than the 2D setup. This may be primarily attributed to the 3D scaffold mimicking tissues in the body by maintaining cell polarity thus providing greater access of Vero cell surface receptors to pathogens and toxins (Ravi et al., 2015; Barrila et al., 2018). Furthermore, the collagen embedding provides stable support for Vero cells during testing of food samples without any possibility of loss of cells, which can happen when the cells are grown in 2D monolayers. Additionally, collagen’s strong gelling properties can act as a protective barrier to enhance the viability of cells and eliminate the risk of tampering during field-deployment (Banerjee et al., 2008; Parenteau-Bareil et al., 2010). Previously, a similar 3D cell culture system using Ped-2E9 hybridoma B cells significantly improved toxin detection from Listeria monocytogenes, and Bacillus cereus (Banerjee et al., 2008; Banerjee and Bhunia, 2010). Overall, a 6 h 3D Vero cell-based assay is more competitive than the previously modified 2D Vero cell-based assay (12–16 h) (Roberts et al., 2001), and compatible with immunoassays (Tokarskyy and Marshall, 2008; Il-Hoon et al., 2015; Wang et al., 2016; Armstrong et al., 2018), PCR (Cui et al., 2003; Amani et al., 2015; Parsons et al., 2016), and light scattering sensor (Tang et al., 2014), thus provides an attractive alternative approach for the screening of food samples for the presence of STEC.
Antibiotics or phage induction methods are typically used to induce or release Stx from STEC bacteria either to improve Stx yield for pathogenesis studies or to improve sensitivity for detection assays (Griffin and Gemski, 1983; Yee et al., 1993; Zhang et al., 2000; Laing et al., 2012; Armstrong et al., 2018). As Stx prophages tightly regulate Stx production and release, activation of the SOS response gene, recA, must occur to express downstream stx1 and stx2 genes (Tyler et al., 2013). DNA damaging agents such as mitomycin C and ciprofloxacin that inhibit DNA synthesis or topoisomerase I, respectively, can induce bacterial SOS response and induce Stx production. Therefore, mitomycin C, ciprofloxacin, and polymyxin B were used at recommended concentrations (Roberts et al., 2001; Shimizu et al., 2003; Aertsen et al., 2005; Maldonado et al., 2005; Wang et al., 2016). Interestingly, Vero cells showed a strong cytotoxic response to polymyxin B (1 mg/ml) in absence of bacterial toxins. Polymyxin B mediated cytotoxic event is attributed to the interaction of polymyxin B with the cytoplasmic membrane of mammalian cells while disrupting osmotic homeostasis and promotion of oxidative stress (Neiva et al., 2013; Vattimo et al., 2016) thus, polymyxin B was not used in subsequent experiments. Furthermore, STEC pre-induced with mitomycin C and ciprofloxacin for 3 h did not improve the sensitivity of Vero cells to STEC suggesting that antibiotics may not be necessary for the development of 3D Vero assay for detection of STEC cells from food samples. STEC pathogenesis is multifactorial involving bacterial intimate attachment and production of attachment effacement lesion, which is substantiated by upregulation of genes in LEE, activation of T3SS, and Stx production for a cytotoxic response (Schüller, 2011; Tran et al., 2014; Licznerska et al., 2016; Bhunia, 2018). This may explain why Stx-mediated additive cytotoxic response after antibiotic induction was not seen when used with the STEC cells. However, mitomycin C and ciprofloxacin induction may yield a higher Stx amount during toxin preparation and for enhanced cytotoxicity response (Yee et al., 1993; Schüller, 2011).
An enrichment step is essential for food testing as it ensures full recovery and increased bacterial numbers without running the risk of generating false negatives (Sharpe, 2001; Bhunia, 2014; Vetter, 2016). Although the detection limit of 3D Vero cell is high, requiring at least 107 CFU/ml, a 15-h enrichment in mTSB should be able to achieve 107-8 CFU/ml in the test sample with a very low (<100 CFU/25 g) initial inoculum for reliable detection of STEC from food samples. This enrichment step for sample preparation is required for most, if not all detection assays including immunoassay and PCR (Gould et al., 2009). It is well documented that PCR and immunoassays have superior sensitivity in detecting STEC (10 CFU/ml) and Stx (0.5 ng/ml) (Il-Hoon et al., 2015; Gehring et al., 2017); however, there are also drawbacks in detection time, sample and reagent preparation, and information provided about functional activity of Stx and viability of STEC (Pimbley and Patel, 1998; Cui et al., 2003; Banerjee et al., 2013; Amani et al., 2015; Zeng et al., 2016). Vero cell assay can also detect picogram quantities of Stx, however, detection time must be extended to 24–72 h to acquire confirmatory results (Hughes et al., 1998; Rasooly and Do, 2010; Lentz et al., 2011). We verified that the detection time plays a role in the sensitivity of the assay using commercial Stx1 and Stx2 toxins preparations. Additionally, crude Stx sample preparation with the lengthy isolation, enrichment, and concentration methods makes it cumbersome to be used as an analyte for routine rapid detection.
To overcome the burden of sample and assay preparation with a faster sampling and detection time, 3D Vero cell system has been validated with inoculated ground beef samples for successful detection of viable STEC cells in 6 h after an enrichment step. In the 3D Vero cell assay, LDH release from toxin-induced cell death was measured as an indicator for cytotoxicity. However, this enzyme is found in animal tissues (meat), so interference from ground beef samples before inoculation with STEC or non-STEC cells must be calculated to correct for final values (Collins et al., 1991; Šalplachta and Nečas, 2000). Therefore, appropriate controls must be included every sampling time while using the 3D Vero platform. Furthermore, Salmonella, Listeria, Citrobacter, Serratia, Hafnia, and non-pathogenic Escherichia coli following a 15-h enrichment in mTSB did not yield positive cytotoxicity results, confirming the specificity of 3D Vero to detect STEC. Additionally, the purpose of using non-pathogenic E. coli, untreated mammalian cells, enrichment media, and antibiotics as negative controls throughout the study is to evaluate the level of interference that could affect the performance of the assay. With a low interference level, which allowed us to establish a 15% cutoff value, reduce the risk of achieving false positive results.
In summary, we demonstrated that the 3D Vero cell-based assay could be used for rapid detection of STEC by measuring LDH release. During method development, sample preparation time was shortened by using a bacterial analyte rather than a toxin analyte where the use of antibiotics can be eliminated in the enrichment step. Antibiotic-uninduced STEC resuspended in LB exhibited desirable cytotoxicity levels (26–81%) that is above the 15% threshold after 6 h post-infection of the 3D Vero cell. Concentrated culture filtrates after mitomycin C induction also induced comparable levels of cytotoxicity, which was validated with dot immunoblotting showing high Stx2 yield (3.2-fold). Despite the high Stx1 production from ciprofloxacin induction (1.4-fold), low Stx2 yield was achieved. Mitomycin C was chosen for further studies due to the level of importance of Stx2 in STEC infection and its association with HUS. When compared to control cells, Vero cell morphology was profoundly altered in response to viable STEC cells and active Stx observed after Trypan blue staining and Cryo-SEM. Vero cells in either 2D or 3D configuration can detect up to 107-8 CFU/ml or 1,000 ng/ml (2D) and 31.25 ng/ml (3D) of Stx in 6 h, respectively. THP-1 cells did not exhibit a strong positive signal against STEC cells as compared to the Vero cells but can detect up to 125 ng/ml of Stx and 31.25 ng/ml of Stx in a 2D and 3D configurations, respectively. Since 3D Vero cells performed the best in response to both STEC cells and crude Stx, the 3D Vero platform was successfully used for the screening and detection of STEC cells from artificially contaminated ground beef samples in 6 h, which is faster than the traditional gold standard Vero cell assay which takes about 72-h. This method provides an opportunity to screen for emerging STEC serotypes with similar cytotoxicity potential. Therefore, this method for screening viable STEC has the potential to be adopted by the public health and/or food industry sectors for the screening of STEC from various samples to prevent future occurrence of STEC related foodborne outbreaks.
Frozen stock cultures (Table 1) were grown in BHI (Brain Heart Infusion) broth and then maintained on BHI agar (BHI, Becton Dickinson) plate for 1 month at 4°C. For fresh cultures, isolated colonies were inoculated into modified tryptone soy broth (mTSB) containing 0.15% bile salt, 0.4% dipotassium hydrogen phosphate, and 0.25% glucose (Becton Dickinson, Franklin Lakes, NJ, United States) at 42°C for 15 h with shaking at 120 rpm. Bacteria were also grown in Luria Bertani (LB) broth (10 g/L tryptone, 5 g/L yeast extract, 10 g/L NaCl), and EC broth (Becton Dickinson). To confirm and verify cultures, isolates were streaked on Modified Oxford Agar (MOX, Neogen, Lansing, MI, United States), Xylose Lysine Tergitol 4 (XLT4, Becton Dickinson), Sorbitol McConkey Agar (SMAC, Becton Dickinson) and RAPID’Enterobacteriaceae Medium (Bio-Rad, Hercules, CA, United States).
African green monkey kidney (Vero) cell line (ATCC CCL-81) were purchased from the American Type Culture Collections (ATCC) and maintained in Dulbecco’s modified Eagles medium (DMEM) (Sigma, St. Louis, MO, United States) with 10% fetal bovine serum. For all cytotoxicity assays, 3.2 × 10⁴ Vero or undifferentiated THP-1 (human monocyte cell line, ATCC) cells were grown as monolayers (2D) or suspensions (2D), respectively, in 48 well plates at 37°C with 5% CO2 under humidity for 24 h. Vero cell monolayers were trypsinized with 0.25% of trypsin (Sigma) as described by the vendor and cell counts were determined by Trypan blue (0.4%) staining (Sigma). For 3D cell culture, cell suspensions were centrifuged and about 3.2 × 10⁴ Vero or undifferentiated THP-1 cells were embedded with collagen (0.7 mg/ml) containing 50 μl PBS, 113 μl collagen I, 2.5 μl NaOH, and 335 μl DMEM (Sigma) as described (Banerjee et al., 2008) in 48 well plates (Corning). DMEM or RPMI supplemented with 10% fetal bovine serum (FBS) was added after a 30-min incubation at 37°C in 5% CO2 to allow for complete gelation.
Lactate dehydrogenase release was measured as described before (Roberts et al., 2001; Maldonado et al., 2005). THP-1 suspension cells were centrifuged (1,800 × g for 3 min), washed with serum-free RPMI and seeded at 3.2 × 10⁴ cells in 48 well plates with an initial volume adjusted to 200 μl/well. Vero cell monolayers and Vero embedded cells were washed with serum-free DMEM before the addition of DMEM (200 μl/well). Cells were exposed to 300 μl of STEC cells (∼108 CFU/ml) for 2 to 16 h or serial dilutions of crude or commercial Stx1a, Stx2a, and Stx2c toxins (Toxin Technologies, Sarasota, FL, United States or BEI Resources, Manassas, VA, United States) for 16 h. Vero or THP-1 cell supernatants were collected after centrifugation (1,800 × g for 3 min) and loaded onto a sterile 96 well plate. Samples (50 μl) were mixed with LDH reaction reagent (50 μl) containing diaphorase, NAD+, sodium lactate, and iodophenyl-nitrophenyl-phenyltetrazolium chloride (Pierce Biotechnology, Rockford, IL, United States). Plates were incubated for 15–20 min in the dark at room temperature before taking measurements at absorbance 490/680 nm for LDH release using a microplate reader (Epoch, BioTek, Winooski, VT, United States). High controls treated with Triton X-100 (2%) for 45 min and low controls treated with serum-free DMEM+LB were used to calculate the percent cytotoxicity. Crude toxin preparations, STEC cells (204P) or commercial Stx toxins were used as positive controls for all LDH assays while cell-free supernatant or cells from stx- strain (O157:H12 strain 489) were used as negative control. To visualize cytopathic effect from treatments, cells were fixed with formaldehyde (4% in PBS, Sigma) and stained with Trypan blue (4%, 1:2 dilution, Corning, Waltham, MA, United States) solution for 3 min. Images were captured at 400× magnification using an Olympus Inverted Microscope.
Four different growth media were evaluated to test for potential interference with the assay. Three hundred microliters of each LB broth, EC broth, and DMEM were added to 200 μl of DMEM before exposure to Vero cells and incubated for 16 h at 37°C in 5% CO2. LDH assay of cell supernatants was performed as above.
For antibiotic induction, Vero cells were exposed to 500 μl of DMEM containing polymyxin B (50 μg/ml, Sigma), mitomycin C (24 ng/ml, Sigma), or ciprofloxacin (1.2 ng/ml, Sigma) for 16 h at 37°C in 5% CO2. To verify the activity of antibiotics, Vero cell supernatants were tested against EDL933 (108 CFU/ml) on BHI. Since polymyxin B can potentially interfere with the assay and can give a high background signal, mitomycin C and ciprofloxacin were used for further experiments. Since LB and DMEM had the least cytotoxicity response, these two media were then used as resuspension media to evaluate cytotoxicity response of stx+ positive and stx- samples after a 3 h pre-induction with mitomycin C (2 μg/ml) and ciprofloxacin (100 ng/ml) at 37°C with shaking at 120 rpm. All samples were analyzed for LDH release after 16 h as described above. Vero cells were imaged under light microscopy (Olympus) at 400× magnification.
Crude toxins were prepared from stx+ O157:H7 strains (204P, EDL933, SEA13A72), O5:NM (467), and stx- O157:H12 strain 489. Bacteria were grown in mTSB at 37°C for 15 h with shaking at 120 rpm. An aliquot of each culture was centrifuged and re-suspended to a final volume of 300 μl in LB to reach a concentration of 108 CFU/ml and used immediately for LDH assay as above.
Overnight cultures were diluted to 1:50 in 50 ml LB and incubated for 3 h at 37°C with shaking at 120 rpm before the addition of mitomycin C (2 μg/ml) or ciprofloxacin (100 μg/ml, Sigma). For UV light treatment, overnight cultures were pelleted at 10,000 × g for 3 min, resuspended in LB, and dispensed into a sterile petri dish which was placed under a UV lamp (115 V, 68 Amps, UVP, Upland, CA, United States) for 1 min maintaining a distance of 12 inches between the lamp and sample. All cultures were further incubated for 5 h at 37°C with shaking at 120 rpm before collecting supernatant after centrifugation at 10,000 × g for 3 min. For polymyxin B treatment, 50 ml overnight culture was pelleted, re-suspended in 500 μl of PBS, supplemented with polymyxin (1 mg/ml), and further incubated for 30 min before collecting supernatant after centrifugation at 10,000 × g for 3 min. Pellets from all treatments were incubated with 100 μl of chloroform at room temperature for 30 min to improve Stx release and toxin yield. Cell-free supernatants of all treatments were concentrated to about 3–5 ml (about 10-fold concentrated) using Amicon Ultra-15 Centrifugal Filter Units using a 50 kDa cut-off cellulose membrane at 5,000 × g for 15 min (Millipore Sigma, Billerica, MA, United States).
Nitrocellulose membranes (0.2 μm, Biotrace NT, Thermo Scientific, Rochester, NY, United States) were pre-wetted in Tris-buffered saline with 0.1% tween 20 (TBST) for 1 min and placed in Bio-Dot apparatus (Bio-Rad, Hercules, CA, United States) under vacuum. Twofold diluted crude toxin samples and commercial Stx standards (Toxin Technologies, Sarasota, FL, United States, or BEI Resources, Manassas, VA, United States) were loaded into each well and application of gentle vacuum allowed fluid passage through the membrane. Membranes were washed with 100 μl of TBST/well, blocked with TBST containing 5% non-fat dry milk (NFDM), and incubated at room temperature for 45 min. Membranes were then washed with TBST three times at room temperature for 3 min with gentle agitation. Primary antibody solution containing antibody to Stx1-1 or Stx2-5 (Skinner et al., 2014, 2015; Wang et al., 2016) at dilutions 1:1000 in TBST with 5% NFDM was added to blots and allowed to incubate overnight at 4°C.
Twenty-seven bacterial isolates were screened for cytotoxicity potential after a 15 h enrichment in mTSB at 42°C with shaking. Vero cells (2D and 3D) were washed with serum-free DMEM (SF-DMEM) before exposure to bacteria (300 μl ≈ 108 CFU/ml). The total volume of wells was adjusted to 500 μl with SF-DMEM before incubation at 37°C in 5% CO2. To determine the limit of detection of the assay, overnight cultures of stx+ (204P) and stx- (489) were resuspended in LB and serial dilutions of bacterial preparations were added to Vero cells and incubated for 16 h at 37°C in 5% CO2. To determine optimal detection time, Vero cell cytotoxicity was assayed after exposure to stx+ (204P) and stx- (489) at 108 CFU/ml) for 2 h, 6 h, and 16 h. Salmonella, Listeria spp., Citrobacter, Hafnia, and Serratia spp. were also tested to investigate assay specificity. All samples were centrifuged at 1,800 × g for 3 min and assayed for LDH. LDH values were acquired from three independent sets of experiments and analyzed in duplicates. After LDH analysis, cells were fixed with formaldehyde (4%) before Trypan blue (4%, 1:2 dilution) staining for 3 min to determine Vero cell morphology after treatments at 400× magnification.
Minimally dehydrated collagen gel embedded Vero cells were mounted on slotted Gatan holders with 1 mm of the sample above the holder. Samples were cryo-transferred after plunge freezing with nitrogen slush into the Gatan preparation chamber, which is held under high vacuum. Frozen samples were fractured with a cold scalpel in the Gatan Alto 2500 preparation chamber at -185°C (Pleasanton, CA, United States) before being transferred into the SEM chamber. Samples were mounted on the cryo-stage set for -90°C sublimation and imaged until a structure was observed before sputter coating for 120 s using a platinum target at -185°C. SEM Cryo-stage was lowered to -140°C during sputter coating and was reinserted onto the NovaNano SEM cryo-stage before capturing final images of fractured surfaces. An accelerating voltage of 5 kV and spot size 3 with a working distance of approximately 5 mm at magnifications ranging ×1,000 and ×10,000 were used in the NovaNano SEM.
3D Vero cell platform was used to screen and detect STEC from artificially contaminated ground beef samples. Three brands of ground beef (5 lb each), purchased from local grocery stores, were artificially inoculated with stx+ 204P (O157:H7) and stx- 489 (O157:H12) strain under aseptic conditions. Samples were processed following the USDA guidelines for screening STEC in ground beef samples (FSIS, 2016). In brief, ground beef samples (32 ± 3.2 g each, 3 samples × 9 technical replicates = 27) were placed in sterile strainer bags (Seward, Islandia, NY, United States) inoculated with 100 μl of 204P (6.7 × 10² ± 2.1 × 10² CFU/ml) and 489 (7.4 × 10² ± 5.9 × 10² CFU/ml). Samples were then diluted with 97 ± 1.9 ml of mTSB and hand massaged for 1 min to homogenize before incubating at 42°C for 15 h with shaking at 120 rpm. To determine a final cell density after enrichment, samples were serially diluted (1:10 in PBS) and plated on SMAC plates and incubated at 37°C for 24 h. For 3D Vero cell assay, 300 μl samples were centrifuged at 10,000 × g for 3 min and resuspended in the same volume of LB before exposure to 2D or 3D Vero cells (3.2 × 10⁴ cells) in a 48-well plate format. After incubation at 37°C for 6 h in 5% CO2, samples were centrifuged at 1,800 × g for 3 min and analyzed for LDH release. Uninoculated meat samples were also tested to check for background response and interference. Suspected colonies identified on the SMAC were confirmed by PCR, targeting stx1 and stx2 genes.
DNA templates were extracted following a boiling and colony PCR method (Feng et al., 2002; Hoang Minh et al., 2015). Stx-specific primers targeting stx1 (5′-ATCCTATTCCCGGGAGTTTACG-3′ and 5′-GCGT CATCGTATACACAGGAGC-3′) and stx2 (5′-CACCAGACAATGTAACCGCTG-3′ and 5′-TIACCATTTCAGTACCTTCTGGTAA-3′) genes were used to confirm the Stx presence in the 3D Vero-identified STEC positive samples. DNA templates from non-STEC isolates, uninoculated meat samples, and water were used as negative controls. The reaction mixture (25 μl) contained 200 ng of DNA template, 1× GoTaq Flexi buffer, 1 U of GoTaq, 2.5 mM MgCl2, 200 μM deoxynucleoside triphosphates (dNTP), and 4 μM of stx1 and stx2 forward and reverse primers. The PCR was carried out with an initial denaturation step at 94°C for 120 s, followed by 35 cycles of denaturation at 95°C for 60 s, annealing at 57°C for 60 s, 72°C for 60 s and a final extension at 72°C for 35 s.
Values are presented as mean ± SD. GraphPad Prism (version 6) software was used to perform ordinary one-way or two-way ANOVA followed by Tukey’s multiple comparisons analysis to evaluate whether there are a significant difference among media (LB, DMEM, EC, mTSB) and antibiotics (mitomycin C and ciprofloxacin) induced cytotoxicity response. ImageJ (NIH) was used to assess Stx yield after induction. SAS software was used to perform 2 × 2 × 3 ANOVA followed by Tukey’s post hoc analysis to assess the interaction between stx+ and stx- strains, dimension (2D vs. 3D), and time of incubation (2 h, 6 h, and 16 h).
AB conceived the idea. AB and CT designed the experiments, analyzed the data, and wrote the manuscript. CT performed the experiments.
This work was supported by the United States Department of Agriculture, Agricultural Research Service, under Agreement No. 59-8072-6-001, the USDA National Institute of Food and Agriculture (Hatch accession no. 1016249) and the Center for Food Safety Engineering at Purdue University. Any opinions, findings, conclusion, or recommendations expressed in this publication are those of the author(s) and do not necessarily reflect the view of the United States Department of Agriculture.
The authors declare that the research was conducted in the absence of any commercial or financial relationships that could be construed as a potential conflict of interest.
Tomasz Wilmanski is acknowledged for statistical analysis, Robert Seiler for technical assistance, Dr. Xiaohua He from Western Regional Research Center (USDA-ARS), Emeryville, CA, United States for providing Stx1-1 and Stx2-5 primary antibodies, Dr. Thomas Walter for providing UV lamp set up, BEI resources for providing purified Stx1a, Stx2a, and Stx2c standards, and Pratik Banerjee (University of Memphis) for critical review of the manuscript.
The Supplementary Material for this article can be found online at: https://www.frontiersin.org/articles/10.3389/fmicb.2019.00949/full#supplementary-material
FIGURE S1 | Specificity assay. (A) Effect of growth media (DMEM, LB, EC, mTSB, stx-) on Vero cytotoxicity. (B,C) Cytotoxicity of non-STEC bacteria on 3D Vero cells after 6 h exposure. (C) STEC strain EDL933 caused severe cell damage, cell rounding, and cell death visualized after Trypan blue staining while other pathogens (Salmonella Tennessee, Listeria monocytogenes, Serratia marcescens, Citrobacter freundii, Hafnia alvei, and Escherichia coli) did not cause any damage during this period (magnification, 400×).
Aertsen, A., Van Houdt, R., and Michiels, C. W. (2005). Construction and use of an stx1 transcriptional fusion to gfp. FEMS Microbiol. Lett. 245, 73–77.
Amani, J., Ahmadpour, A., Fooladi, A. A. I., and Nazarian, S. (2015). Detection of E. coli O157: H7 and Shigella dysenteriae toxins in clinical samples by PCR-ELISA. Braz. J. Infect. Dis. 19, 278–284. doi: 10.1016/j.bjid.2015.02.008
Armstrong, C., Ruth, L., Capobianco, J., Strobaugh, T., Rubio, F., and Gehring, A. (2018). Detection of Shiga toxin 2 produced by Escherichia coli in foods using a novel AlphaLISA. Toxins 10:422. doi: 10.3390/toxins10110422
Babsa, S., Caprioli, A., Chiani, P., Ferreri, C., Galati, F., Maugliani, A., et al. (2015). Report of the 15th Inter-Laboratory Study on the Detection of Verocytotoxin-Producing E. coli (VTEC) in sprouts (PT 15). Bethesda, MD: Istituto Superiore di Sanità.
Banerjee, P., and Bhunia, A. K. (2009). Mammalian cell-based biosensors for pathogens and toxins. Trends Biotechnol. 27, 179–188. doi: 10.1016/j.tibtech.2008.11.006
Banerjee, P., and Bhunia, A. K. (2010). Cell-based biosensor for rapid screening of pathogens and toxins. Biosens. Bioelectron. 26, 99–106. doi: 10.1016/j.bios.2010.05.020
Banerjee, P., Franz, B., and Bhunia, A. (2010). “Mammalian Cell-Based Sensor System,” in Whole Cell Sensing Systems I, eds S. Belkin and M. B. Gu (Berlin: Springer), 21–55. doi: 10.1007/10_2009_21
Banerjee, P., Kintzios, S., and Prabhakarpandian, B. (2013). Biotoxin detection using cell-based sensors. Toxins 5, 2366–2383. doi: 10.3390/toxins5122366
Banerjee, P., Lenz, D., Robinson, J. P., Rickus, J. L., and Bhunia, A. K. (2008). A novel and simple cell-based detection system with a collagen-encapsulated B-lymphocyte cell line as a biosensor for rapid detection of pathogens and toxins. Lab. Invest. 88, 196–206. doi: 10.1038/labinvest.3700703
Barrila, J., Crabbé, A., Yang, J., Franco, K., Nydam, S. D., Forsyth, R. J., et al. (2018). Modeling host-pathogen interactions in the context of the microenvironment: three-dimensional cell culture comes of age. Infect. Immun. 86:e282–18. doi: 10.1128/IAI.00282-18
Bhunia, A. K. (2014). One day to one hour: how quickly can foodborne pathogens be detected? Future Microbiol. 9, 935–946. doi: 10.2217/fmb.14.61
Bhunia, A. K. (2018). “Escherichia coli,” in Foodborne Microbial Pathogens: Mechanisms and Pathogenesis, ed. A. K. Bhunia (New York, NY: Springer New York), 249–269.
Brusa, V., Restovich, V., Galli, L., Teitelbaum, D., Signorini, M., Brasesco, H., et al. (2017). Isolation and characterization of non-O157 Shiga toxin-producing Escherichia coli from beef carcasses, cuts and trimmings of abattoirs in Argentina. PLoS One 12:e0183248. doi: 10.1371/journal.pone.0183248
CDC (2006). Importance of culture confirmation of Shiga toxin-producing Escherichia coli infection as illustrated by outbreaks of gastroenteritis–New York and North Carolina, 2005. MMWR Morb. Mortal. Wkly. Rep. 55, 1042–1045.
CDC (2012). National Shiga toxin-producing Escherichia coli (STEC) surveillance overview. Atlanta, GA: US Department of Health and Human Services, CDC.
Cho, I.-H., Radadia, A. D., Farrokhzad, K., Ximenes, E., Bae, E., Singh, A. K., et al. (2014). Nano/Micro and spectroscopic approaches to food pathogen detection. Annu. Rev. Anal. Chem. 7, 65–88. doi: 10.1146/annurev-anchem-071213-020249
Collins, S. S., Keeton, J. T., and Smith, S. B. (1991). Lactate dehydrogenase activity in bovine muscle as a potential heating endpoint indicator. J. Agri. Food Chem. 39, 1291–1293. doi: 10.1021/jf00007a019
Cui, S., Schroeder, C., Zhang, D., and Meng, J. (2003). Rapid sample preparation method for PCR-based detection of Escherichia coli O157: H7 in ground beef. J. Appl. Microbiol. 95, 129–134. doi: 10.1046/j.1365-2672.2003.01951.x
Edmondson, R., Broglie, J. J., Adcock, A. F., and Yang, L. (2014). Three-dimensional cell culture systems and their applications in drug discovery and cell-based biosensors. Assay Drug Develop. Technol. 12, 207–218. doi: 10.1089/adt.2014.573
Farrokh, C., Jordan, K., Auvray, F., Glass, K., Oppegaard, H., Raynaud, S., et al. (2013). Review of Shiga-toxin-producing Escherichia coli (STEC) and their significance in dairy production. Int. J. Food Microbiol. 162, 190–212. doi: 10.1016/j.ijfoodmicro.2012.08.008
Feng, P., Weagant, S. D., Grant, M. A., and Burkhardt, W. (2002). “Enumeration of Escherichia coli and the coliform bacteria, chap. 4,” in Food and Drug Administration (FDA), Bacteriological Analytical Manual Online (Gaithersburg, MD: AOAC International).
Gehring, A. G., Fratamico, P. M., Lee, J., Ruth, L. E., He, X., He, Y., et al. (2017). Evaluation of ELISA tests specific for Shiga toxin 1 and 2 in food and water samples. Food Control 77, 145–149. doi: 10.1016/j.foodcont.2017.02.003
Gould, L. H., Bopp, C., Strockbine, N., Atkinson, R., Baselski, V., Body, B., et al. (2009). Recommendations for diagnosis of shiga toxin–producing Escherichia coli infections by clinical laboratories. MMWR Recomm. Rep. 58, 1–14.
Grant, M. A., Hedberg, C., Johnson, R., Harris, J., Logue, C. M., Meng, J., et al. (2011). The significance of non-O157 Shiga toxin-producing Escherichia coli in food. Food Prot. Trends 31, 33–45.
Griffin, D. E., and Gemski, P. (1983). Release of Shiga toxin from Shigella dysenteriae 1 by polymyxin B. Infect. Immun. 40, 425–428.
Hoang Minh, S., Kimura, E., Hoang Minh, D., Honjoh, K. I., and Miyamoto, T. (2015). Virulence characteristics of Shiga toxin-producing Escherichia coli from raw meats and clinical samples. Microbiol. Immunol. 59, 114–122. doi: 10.1111/1348-0421.12235
Hughes, A. K., Stricklett, P. K., and Kohan, D. E. (1998). Cytotoxic effect of Shiga toxin-1 on human proximal tubule cells. Kidney Int. 54, 426–437. doi: 10.1046/j.1523-1755.1998.00015.x
Hughes, J. M., Wilson, M. E., Johnson, K. E., Thorpe, C. M., and Sears, C. L. (2006). The emerging clinical importance of non-O157 Shiga toxin—producing Escherichia coli. Clin. Infect. Dis. 43, 1587–1595.
Il-Hoon, C., Bhunia, A., and Irudayaraj, J. (2015). Rapid pathogen detection by lateral-flow immunochromatographic assay with gold nanoparticle-assisted enzyme signal amplification. Int. J. Food Microbiol. 206, 60–66. doi: 10.1016/j.ijfoodmicro.2015.04.032
Karmali, M. A., Gannon, V., and Sargeant, J. M. (2010). Verocytotoxin-producing Escherichia coli (VTEC). Vet. Microbiol. 140, 360–370. doi: 10.1016/j.vetmic.2009.04.011
Konowalchuk, J., Speirs, J., and Stavric, S. (1977). Vero response to a cytotoxin of Escherichia coli. Infect. Immun. 18, 775–779.
Laing, C. R., Zhang, Y., Gilmour, M. W., Allen, V., Johnson, R., Thomas, J. E., et al. (2012). A comparison of Shiga-toxin 2 bacteriophage from classical enterohemorrhagic Escherichia coli serotypes and the German E. coli O104:H4 outbreak strain. PLoS One 7:e37362. doi: 10.1371/journal.pone.0037362
Lentz, E. K., Leyva-Illades, D., Lee, M. S., Cherla, R. P., and Tesh, V. L. (2011). Differential response of the human renal proximal tubular epithelial cell line HK-2 to Shiga toxin types 1 and 2. Infect. Immun. 79, 3527–3540. doi: 10.1128/IAI.05139-11
Licznerska, K., Nejman-Faleńczyk, B., Bloch, S., Dydecka, A., Topka, G., Gąsior, T., et al. (2016). Oxidative stress in Shiga toxin production by enterohemorrhagic Escherichia coli. Oxid. Med. Cell. Longev. 2016:3578368. doi: 10.1155/2016/3578368
Maldonado, Y., Fiser, J. C., Nakatsu, C. H., and Bhunia, A. K. (2005). Cytotoxicity potential and genotypic characterization of Escherichia coli isolates from environmental and food sources. Appl. Environ. Microbiol. 71, 1890–1898. doi: 10.1128/aem.71.4.1890-1898.2005
Martineau, F., Picard, F. J., Ke, D., Paradis, S., Roy, P. H., Ouellette, M., et al. (2001). Development of a PCR assay for identification of staphylococci at genus and species levels. J. Clin. Microbiol. 39, 2541–2547. doi: 10.1128/jcm.39.7.2541-2547.2001
Mathusa, E. C., Chen, Y. H., Enache, E., and Hontz, L. (2010). Non-O157 Shiga toxin-producing Escherichia coli in foods. J. Food Prot. 73, 1721–1736. doi: 10.4315/0362-028x-73.9.1721
Medina, M. B., Shelver, W. L., Fratamico, P. M., Fortis, L., Tillman, G., Narang, N., et al. (2012). Latex agglutination assays for detection of non-O157 Shiga toxin-producing Escherichia coli serogroups O26, O45, O103, O111, O121, and O145. J. Food Prot. 75, 819–826. doi: 10.4315/0362-028X.JFP-11-430
Moodie, Z., Price, L., Gouttefangeas, C., Mander, A., Janetzki, S., Löwer, M., et al. (2010). Response definition criteria for ELISPOT assays revisited. Cancer Immunol. Immunother. 59, 1489–1501. doi: 10.1007/s00262-010-0875-4
Neiva, L. B. D. M., Fonseca, C. D. D., Watanabe, M., and Vattimo, M. D. F. F. (2013). Polymyxin B: dose and time dependent nephrotoxicity effect in vitro. Acta Paul. Enferm. 26, 57–62.
Parenteau-Bareil, R., Gauvin, R., and Berthod, F. (2010). Collagen-based biomaterials for tissue engineering applications. Materials 3, 1863–1887. doi: 10.3390/ma3031863
Parsons, B. D., Zelyas, N., Berenger, B. M., and Chui, L. (2016). Detection, characterization, and typing of Shiga toxin-producing Escherichia coli. Front. Microbiol. 7:478. doi: 10.3389/fmicb.2016.00478
Pimbley, D. W., and Patel, P. D. (1998). A review of analytical methods for the detection of bacterial toxins. Symp. Ser. Soc. Appl. Microbiol. 27, 98S–109S. doi: 10.1046/j.1365-2672.1998.0840s198s.x
Pollock, K. G. J., Locking, M. E., Beattie, T. J., Maxwell, H., Ramage, I., Hughes, D., et al. (2010). Sorbitol-fermenting Escherichia coli O157. Scotland. Emerg. Infect. Dis. 16, 881–882.
Quiñones, B., Massey, S., Friedman, M., Swimley, M. S., and Teter, K. (2009). Novel cell-based method to detect Shiga toxin 2 from Escherichia coli O157:H7 and inhibitors of toxin activity. Appl. Environ. Microbiol. 75, 1410–1416. doi: 10.1128/AEM.02230-08
Rasooly, R., and Do, P. M. (2010). Shiga toxin Stx2 is heat-stable and not inactivated by pasteurization. Int. J. Food Microbiol. 136, 290–294. doi: 10.1016/j.ijfoodmicro.2009.10.005
Ravi, M., Paramesh, V., Kaviya, S. R., Anuradha, E., and Solomon, F. D. P. (2015). 3D cell culture systems: advantages and applications. J. Cell. Physiol. 230, 16–26. doi: 10.1002/jcp.24683
Roberts, P. H., Davis, K. C., Garstka, W. R., and Bhunia, A. K. (2001). Lactate dehydrogenase release assay from Vero cells to distinguish verotoxin producing Escherichia coli from non-verotoxin producing strains. J. Microbiol. Methods 43, 171–181. doi: 10.1016/s0167-7012(00)00222-0
Russo, L. M., Melton-Celsa, A. R., Smith, M. A., Smith, M. J., and O’brien, A. D. (2014). Oral intoxication of mice with Shiga toxin type 2a (Stx2a) and protection by anti-Stx2a monoclonal antibody 11E10. Infect. Immun. 82, 1213–1221. doi: 10.1128/IAI.01264-13
Šalplachta, J., and Nečas, J. (2000). Lactate dehydrogenase isoenzyme pattern in tissues and serum of the calf. Acta Vet. Brno 69, 267–275. doi: 10.2754/avb200069040267
Scallan, E., Hoekstra, R. M., Angulo, F. J., Tauxe, R. V., Widdowson, M. A., Roy, S. L., et al. (2011). Foodborne illness acquired in the United States—major pathogens. Emerg. Infect. Dis. 17, 7–15. doi: 10.3201/eid1701.09-1101p1
Schrader, C., Schielke, A., Ellerbroek, L., and Johne, R. (2012). PCR inhibitors–occurrence, properties and removal. J. Appl. Microbiol. 113, 1014–1026. doi: 10.1111/j.1365-2672.2012.05384.x
Schüller, S. (2011). Shiga toxin interaction with human intestinal epithelium. Toxins 3, 626–639. doi: 10.3390/toxins3060626
Sharpe, A. (2001). Food Sample Preparation and Enrichment for Rapid Detection. Ontario, ON: Special Publications-Royal Society of Chemistry.
Sheoran, A. S., Chapman, S., Singh, P., Donohue-Rolfe, A., and Tzipori, S. (2003). Stx2-specific human monoclonal antibodies protect mice against lethal infection with Escherichia coli expressing Stx2 variants. Infect. Immun. 71, 3125–3130. doi: 10.1128/iai.71.6.3125-3130.2003
Shimizu, K., Asahara, T., Nomoto, K., Tanaka, R., Hamabata, T., Ozawa, A., et al. (2003). Development of a lethal Shiga toxin-producing Escherichia coli-infection mouse model using multiple mitomycin C treatment. Microb. Pathog. 35, 1–9. doi: 10.1016/s0882-4010(03)00065-2
Skinner, C., Patfield, S., Stanker, L. H., Fratamico, P., and He, X. (2014). New high-affinity monoclonal antibodies against Shiga toxin 1 facilitate the detection of hybrid Stx1/Stx2 in vivo. PLoS One 9:e99854. doi: 10.1371/journal.pone.0099854
Skinner, C., Zhang, G., Patfield, S., and He, X. (2015). An in vitro combined antibiotic-antibody treatment eliminates toxicity from Shiga toxin-producing Escherichia coli. Antimicrob. Agents Chemother. 59, 5435–5444. doi: 10.1128/AAC.00763-15
Sperandio, V., and Pacheco, A. R. (2012). Shiga Toxin in Enterohemorrhagic E.coli: regulation and novel antivirulence strategies. Front. Cell. Infect. Microbiol. 2:81. doi: 10.3389/fcimb.2012.00081
Tang, Y., Kim, H., Singh, A. K., Aroonnual, A., Bae, E., Rajwa, B., et al. (2014). Light scattering sensor for direct identification of colonies of Escherichia coli serogroups O26, O45, O103, O111, O121, O145 and O157. PLoS One 9:e105272. doi: 10.1371/journal.pone.0105272
Tesh, V. L., Burris, J. A., Owens, J. W., Gordon, V. M., Wadolkowski, E. A., O’brien, A. D., et al. (1993). Comparison of the relative toxicities of Shiga-like toxins type I and type II for mice. Infect. Immun. 61, 3392–3402.
Tokarskyy, O., and Marshall, D. L. (2008). Immunosensors for rapid detection of Escherichia coli O157:H7 – Perspectives for use in the meat processing industry. Food Microbiol. 25, 1–12. doi: 10.1016/j.fm.2007.07.005
Tran, S. L., Billoud, L., Lewis, S. B., Phillips, A. D., and Schüller, S. (2014). Shiga toxin production and translocation during microaerobic human colonic infection with Shiga toxin-producing E.?coli O157:H7 and O104:H4. Cell. Microbiol. 16, 1255–1266. doi: 10.1111/cmi.12281
Tyler, J. S., Beeri, K., Reynolds, J. L., Alteri, C. J., Skinner, K. G., Friedman, J. H., et al. (2013). Prophage induction is enhanced and required for renal disease and lethality in an EHEC mouse model. PLoS Pathog. 9:e1003236. doi: 10.1371/journal.ppat.1003236
Vattimo, M. E. F., Watanabe, M., Da Fonseca, C. D., Neiva, L. B., Pessoa, E. A., and Borges, F. T. (2016). Polymyxin B nephrotoxicity: from organ to cell damage. PLoS One 11:e0161057. doi: 10.1371/journal.pone.0161057
Vetter, D. (2016). Understanding Microbiological Sampling and Testing. Washington, DC: Food Safety Inspection Service (FSIS).
Wang, F., Jiang, L., Yang, Q., Prinyawiwatkul, W., and Ge, B. (2012). Rapid and specific detection of Escherichia coli serogroups O26, O45, O103, O111, O121, O145, and O157 in ground beef, beef trim, and produce by loop-mediated isothermal amplification. Appl. Environ. Microbiol. 78, 2727–2736. doi: 10.1128/AEM.07975-11
Wang, J., Katani, R., Li, L., Hegde, N., Roberts, E. L., Kapur, V., et al. (2016). Rapid detection of Escherichia coli O157 and Shiga toxins by lateral flow immunoassays. Toxins 8:92. doi: 10.3390/toxins8040092
Wang, Y., and Salazar, J. K. (2015). Culture-independent rapid detection methods for bacterial pathogens and toxins in food matrices. Comp. Rev. Food Sci. Food Saf. 15, 183–205. doi: 10.1111/1541-4337.12175
Yee, A., De Grandis, S., and Gyles, C. (1993). Mitomycin-induced synthesis of a Shiga-like toxin from enteropathogenic Escherichia coli HI 8. Infect. Immun. 61, 4510–4513.
Zeng, D., Chen, Z., Jiang, Y., Xue, F., and Li, B. (2016). Advances and challenges in viability detection of foodborne pathogens. Front. Microbiol. 7:1833. doi: 10.3389/fmicb.2016.01833
Zhang, J.-H., Chung, T. D., and Oldenburg, K. R. (1999). A simple statistical parameter for use in evaluation and validation of high throughput screening assays. J. Biomol. Screening 4, 67–73. doi: 10.1177/108705719900400206
Keywords: Shiga-toxin producing Escherichia coli (STEC), cytotoxicity, Vero cells, 3D, food ground beef, multiplex-PCR, pathogen detection
Citation: To CZ and Bhunia AK (2019) Three Dimensional Vero Cell-Platform for Rapid and Sensitive Screening of Shiga-Toxin Producing Escherichia coli. Front. Microbiol. 10:949. doi: 10.3389/fmicb.2019.00949
Received: 10 February 2019; Accepted: 15 April 2019;
Published: 07 May 2019.
Edited by:
Giovanna Suzzi, University of Teramo, ItalyReviewed by:
Mohamed Elhadidy, University of Science and Technology at Zewail City, EgyptCopyright © 2019 To and Bhunia. This is an open-access article distributed under the terms of the Creative Commons Attribution License (CC BY). The use, distribution or reproduction in other forums is permitted, provided the original author(s) and the copyright owner(s) are credited and that the original publication in this journal is cited, in accordance with accepted academic practice. No use, distribution or reproduction is permitted which does not comply with these terms.
*Correspondence: Arun K. Bhunia, Ymh1bmlhQHB1cmR1ZS5lZHU=
Disclaimer: All claims expressed in this article are solely those of the authors and do not necessarily represent those of their affiliated organizations, or those of the publisher, the editors and the reviewers. Any product that may be evaluated in this article or claim that may be made by its manufacturer is not guaranteed or endorsed by the publisher.
Research integrity at Frontiers
Learn more about the work of our research integrity team to safeguard the quality of each article we publish.