 Na Deng
 Honglei Wang
 Juying Jiao
- State Key Laboratory of Soil Erosion and Dryland Farming on the Loess Plateau, Institute of Soil and Water Conservation, Northwest A&F University, Yangling, China
Denitrification is a critical component of soil nitrogen (N) cycling, including its role in the production and loss of nitrous oxide (N2O) from the soil system. However, restoration effects on the contribution of denitrification to soil N2O emissions, the abundance and diversity of denitrifying bacteria, and relationships among N2O emissions, soil properties, and denitrifying bacterial community composition remains poorly known. This is particularly true for fragile semiarid ecosystems. In order to address this knowledge gap, we utilized 42-year chronosequence of Robinia pseudoacacia plantations in the Chinese hilly gullied Loess Plateau. Soil potential N2O emission rates were measured using anaerobic incubation experiments. Quantitative polymerase chain reaction (Q-PCR) and Illumina MiSeq high-throughput sequencing were used to reveal the abundance and community composition of denitrifying bacteria. In this study, the afforestation practices following farmland abandonment had a strong negative effect on soil potential N2O emission rates during the first 33 years. However, potential N2O emission rates steadily increased in 42 years of restoration, leading to enhanced potential risk of greenhouse gas emissions. Furthermore, active afforestation increased the abundance of denitrifying functional genes, and enhanced microbial biomass. Actinobacteria and Proteobacteria were the dominant denitrifying bacterial phyla in the 0 to 33-years old sites, while the 42-years sites were dominated by Planctomycetes and Actinobacteria, implying that the restoration performed at these sites promoted soil microbial succession. Finally, correlation analyses revealed that soil organic carbon concentrations had the strongest relationship with potential N2O emission rates, followed by the abundance of the nosZ functional gene, bulk density, and the abundance of Bradyrhizobium and Variovorax across restoration stages. Taken together, our data suggest above-ground restoration of plant communities results in microbial community succession, improved soil quality, and significantly altered N2O emissions.
Introduction
Nitrogen management is one of the major environmental challenges for the 21st century (Sutton et al., 2011), and the mitigation of nitrous oxide (N2O) emissions are of particular concern due to the strong role N2O can play in climate change. In fact, the contribution of N2O as a greenhouse gas affecting global temperatures is third only to CO2 and CH4, which have global warming potentials approximately 298 and 11.9 times larger than N2O, respectively (Domeignoz-Horta et al., 2018). N2O is also involved in the destruction of the stratospheric ozone layer (Crutzen, 1970) and has become the dominant ozone depleting substance (Ravishankara et al., 2009). With N2O emissions on the rise [12–16 Tg N yr-1 from 2000 to 2050 (Bouwman et al., 2013; Hu et al., 2015)], studies that explore the factors that regulate N2O fluxes for soil, ocean, estuaries, freshwater habitats, and wastewater treatment plants are increasing (Schreiber et al., 2012; Zhang Y. et al., 2016).
Soils constitute the largest source of N2O emissions (Bremner and Blackmer, 1979; Hu et al., 2015), especially in agricultural and forested ecosystems (Kong et al., 2010; Smethurst, 2010; Levy-Booth et al., 2014). To enable more effective mitigation to counteract the steady increase in N2O emissions, it is necessary to better understand the mechanisms that drive N2O fluxes in different ecosystems (Hu et al., 2015). Numerous studies have focused on estimation and simulation of N2O fluxes (Reay et al., 2012), assessing the impact of environmental factors on N2O efflux (e.g., Bateman and Baggs, 2005; Chen et al., 2012; Németh et al., 2014), the central role of soil microbial communities in regulating nitrogen cycle processes and N2O emissions (e.g., Baggs, 2011; Bouwman et al., 2013; Tatti et al., 2013; Chen et al., 2015) and microbial ecology that helps determine the production and consumption of N2O (Barberan et al., 2012; Singh et al., 2010). Specifically, denitrification is one of the major microbial pathways fueling N2O emissions from soil (Smith et al., 2003; Shaw et al., 2006; Levy-Booth et al., 2014). Denitrification consists of sequential reductions of soluble NO3- and NO2- to the nitrogen gases NO, N2O, and N2 via four enzymatic complexes (Philippot et al., 2011). For instance, the first step (NO3- → NO2-) is catalyzed by nitrate reductase encoded by napA and narG genes; the second step (NO2- → NO) is catalyzed by nirK and nirS genes encoding nitrite reductase; the third step leading to N2O production (NO → N2O) is mediated by nitrous reductase, encoded by qnorB gene. And the last step, the reduction of N2O to N2 occurs through the nosZ gene encoding nitrous reductase, which is the only known sink for N2O in the biosphere (Philippot et al., 2007). Denitrification is an enzymatically catalyzed process and can be strongly influenced by environmental factors, including soil conditions (Smith et al., 2003; Cuhel et al., 2010; Hu et al., 2014; Levy-Booth et al., 2014) and vegetation features (Zhang C. et al., 2016; Liu et al., 2018). For example, several studies have reported increasing N2O emissions with decreasing soil pH (Bergaust et al., 2010; Cuhel et al., 2010) and oxygen concentrations (Chapuis-Lardy et al., 2007; Schreiber et al., 2012). Those effects have been attributed to a specific regulation of N2O reductase activity (Richardson et al., 2009). Changes in soil pH and oxygen concentration can be influenced by several factors depending on vegetation type, land-use history, and time since active restoration occurred (Cheng and An, 2015; Kou et al., 2016; Nadal-Romero et al., 2016). This supports the hypothesis that vegetation, edaphic properties, and microbial community are closely linked over the course of ecosystem succession following disturbance (Lozano et al., 2014; Zhang C. et al., 2016; Barber et al., 2017). However, the rules that govern these interacting associations remain relatively poorly understood (Bernhard and Kelly, 2016), and few studies focus on the correlation between N2O emission rates and the abundances, composition, and diversity of denitrifying bacterial community during vegetation management (e.g., afforestation) of abandoned farmland in semiarid regions over the long-term.
Due to the high degree of human activities that have occurred over the long-term, such as cultivation and grazing, the Chinese Loess Plateau had been one of the most eroded regions and one of the most vulnerable areas to desertification in China (Fu et al., 2011). To address this issue, a number of programs were initiated by the Chinese government in the 20st century, for example, “Grain for Green,” which was the conversion of steep cultivated land to forest and grassland. In particular, afforestation was considered as a key restoration approach in China for the past few decades (Kou et al., 2016; Hu et al., 2017) and, due to its tolerance of a wide range of soil conditions (Liu et al., 2018), the nitrogen-fixing tree Robinia pseudoacacia has been widely planted as a pioneer afforestation species in the Chinese Loess Plateau. To date, the effects of this restoration on a vegetation competition, soil properties, and microbial communities during afforestation have been reported (Jiao et al., 2012; Cheng and An, 2015; Kou et al., 2016; Zhang C. et al., 2016; Liu et al., 2018). However, studies of N2O emissions and the denitrifying microbial communities that drive these emissions during afforestation are still few, especially in arid and semiarid ecosystems.
In order to address this important knowledge gap, here we simultaneously assessed multiple aspects of plant and soil in a restoration chronosequence in the Chinese Loess Plateau. The goals of our study were to (1) assess the potential rates of N2O efflux across reforested sites of different ages, (2) determine the abundance of denitrifying functional genes and discern the diversity and composition of total bacteria and denitrifying bacteria communities, and (3) explore the relationships among potential N2O emission rates, soil properties, and denitrifying bacterial community across a range of restoration stages.
Materials and Methods
Study Area
This study was conducted in the Zhifanggou watershed (36°43′21″–36°46′10″N, 109°14′26″–109°15′44″E), located in the hilly gullied region of the Chinese Loess Plateau. Climate is semiarid, characterized by a mean annual temperature of 8.8°C (with a mean minimum temperature in January of -6.2°C and a mean maximum temperature in August of 37.2°C). Mean annual precipitation is 504 mm and a mean annual evaporation is 1,000 mm (Kou et al., 2016; Zhang C. et al., 2016). The soils are mainly Calcaric Cambisols, and the study area is distributed in the transition zone between forest and steppe. Species located in the area include Sophora viciifolia, Periploca sepium, Rosa xanthina, Spiraea pubescens, Artemisia scoparia, Lespedeza davurica, Stipa bungeana, Artemisia giraldii, Artemisia gmelinii, and Bothriochloa ischaemun.
Historical farming practices at the sites removed native species, resulting in severe soil erosion and land degradation (Fu et al., 2011). The primary approach to solve these problems has been vegetation restoration (conversion of steep cultivated land to forest and grassland) (Zheng, 2006). In this context, R. pseudoacacia was considered as a pioneer tree for afforestation and more than 70,000 ha of land was reforested with R. pseudoacacia from 1950 to 2005 in the Chinese Loess Plateau (Jiao et al., 2012; Kou et al., 2016). To investigate the restoration effects of R. pseudoacacia plantations on N2O emission and denitrifier communities, the method of space for time substitution was used in our study. We selected R. pseudoacacia plantations of different ages (14, 26, 33, and 42-years), and farmland (0-year) for the control. All the R. pseudoacacia plantations had been planted with a layout of plantings that were 2 m × 2 m, resulting in similar initial tree densities. The ages of the R. pseudoacacia plantations were obtained from interviews with local farmers and compared with records registered with the An’sai Ecological Experimental Station of Soil and Water Conservation. Farmland agricultural practices included planting potatoes (Solanum tuberosum) and fertilizing with 600–900 kg ha-1 N urea and 400–600 kg ha-1 phosphorus pentoxide (P2O5) per year. R. pseudoacacia plantations and farmland control sites were selected with three replicates per restoration stage. Each of the three replicates was on a different hill slope. All sites were south-facing, and soil properties of the studied sites are presented in Table 1 and Supplementary Table S1.
Table 1. Soil physicochemical properties across different restoration n stages.
Vegetation Survey
A vegetation survey was conducted on our study sites in July 2016 (the peak of the growing season in the area). In each site, a 10 m × 10 m quadrant was established to estimate the canopy density and the vegetation cover, and five 1 m × 1 m quadrants were randomly selected to identify all plant species and record the number of individuals of each plant species. The canopy density and vegetation cover were estimated visually by three observers. The numbers of plant species were used to calculate the Pielou evenness index and Shannon diversity index, which were used to estimate the evenness and diversity, respectively (Kou et al., 2016). The number of species was used to estimate the richness (Supplementary Tables S2, S3).
Soil Sampling
Soil samples were collected in July 2016, when the soil moisture and temperature are conducive to microorganism activity (Bateman and Baggs, 2005). In each site, we sampled to a depth of 20 cm because most of the soil nutrients and microorganisms are in this upper soil layer (Kou et al., 2016). We then took three samples in each site, with each sample made up of six evenly distributed cores (5 cm in diameter and 20 cm deep). These soils were used to determine the organic carbon content, total nitrogen content, extractable ammonium and nitrate content, pH, potential N2O emission rates, and the abundance and composition of soil denitrifying bacteria. The litter horizons were removed before soil sampling was performed. Soil samples were kept sealed and in a cooler with ice prior to analysis. After transportation to the laboratory, the soil samples were immediately sieved (< 2 mm), and visible plant roots, stones, and debris were removed. Soils were then separated into two subsamples: one subsample was immediately stored at -80°C for DNA analysis, and the other sample was air-dried at room temperature for chemo-physical analyses. Furthermore, another three evenly distributed cores (height = 5 cm, diameter = 5.05 cm) were sampled to determine soil bulk density in each site.
Soil Analysis
N2O Emission Experiment
Laboratory incubations were used to determine potential N2O emissions rates. The pathways of N2O emission are strongly influenced by soil temperature and moisture (Bateman and Baggs, 2005). In our study area, the in situ soil temperature and moisture in the uppermost 20 cm were consistently measured from 23 June 2016 to 26 October 2016 using soil temperature-water monitors (L-99; Hangzhou Luge Science and Technology limited company, Hangzhou, China). The average temperature was 23.34 ± 1.80°C from 8:00 to 20:00 and 19.80 ± 0.31°C from 20:00 to 8:00 (Supplementary Figure S1). Therefore, to assess potential N2O emission rates we set the temperatures to range from 20.1 to 25.4°C from 8:00 to 20:00 and from 18.8 to 21.7°C from 20:00 to 8:00, which was consistent with the measured data. The soil moisture was set at a water-filled pore space (WFPS) of 60%, the wet soil environment which is conducive to N2O emission by denitrifiers (Bateman and Baggs, 2005; Li et al., 2016). Furthermore, the denitrification process occurs in anaerobic environments (Xiong et al., 2017) and thus an anaerobic environment was created using 150-ml Erlenmeyer flasks with gas-tight lids fitted with a gas sampling port and incubated an incubator (RXZ-380C; Ningbo Jiangnan Instrument Plant, Ningbo, China) (Bateman and Baggs, 2005). Soil (10 g, 7 repetitions, air-dried) was weighed into each flask and soil moisture amended to achieve the target WFPS of 60%. Soils were conditioned at 60% WFPS for 7 days to initiate microbial activity and to minimize changes in soil moisture in the incubator at the start of experiment. On day 8, the flasks were sealed, evacuated and filled with high argon gas 3 times (10 min each time) to keep an anaerobic environment. Samples were then incubated for 24 h and headspace samples (approximately 40 ml) were collected to assess for N2O gas. The N2O gas samples were analyzed using a gas chromatograph (Agilent 7890 gas chromatograph equipped with an ECD detector, Agilent, Santa Clara, CA, United States). The potential N2O emission rates were calculated using the following formula (Lu et al., 2011):
In this: VN2O shows the potential N2O emission rates (mg kg-1 h-1); ρ shows the density of N2O–N in standard state, 1.25 kg m-3; C shows the gas density of N2O (m3 m-3); VG shows the upper effective volume of the flask (m3); V shows the liquid volume (m3); α shows the Bunsen correction coefficient, 0.549 in 25°C (we used the value in our study); W shows the dry soil weight (g); T is the temperature at the time gases were measured (we used a mean value in of 22°C).
Quantitative Polymerase Chain Reaction (Q-PCR) and Illumina MiSeq High-Throughput Sequencing
The soil DNA was extracted from 0.5 to 1 g soil using a D5625-01 soil DNA kit (Omega Biotek, Winooski, VT, United States) according to the manufacturer’s instructions. We extracted three soil DNA samples in each restoration stages for quantitative analysis, and then mixed the three DNA samples in one samples for Illumina MiSeq high-throughput sequencing analysis.
Quantitative analysis was conducted for fragments of the bacteria 16S rRNA and six denitrifying functional genes (i.e., narG, napA, nirK, nirS, qnorB, and nosZ). Q-PCR was performed in a CFX Real-Time PCR Detection System (Bio-Rad, Bio-Rad Laboratories Inc., Hercules, CA, United States) via a three-step thermal cycling procedure, with a 20 μL reaction mixture consisting of 10 μL of SYBR Green I PCR master mix (Applied Biosystems, Foster City, CA, United States), 1 μL of the DNA template (sample DNA or plasmid DNA for standard curves), 1 μL of forward primers, 1 μL of reverse primers, and 7 μL of sterile water (Millipore, Burlington, MA, United States). The protocol and parameter for each target gene are presented in Supplementary Table S4. The R-squared value for each standard curve exceeded 0.99, which indicated linear relationships across the ranges used in this study.
Successful PCR amplification was verified by 2% agarose gel electrophoresis. The triplicate amplicons were pooled and purified by gel extraction and quantified using a Quant-iT PicoGreen dsDNA Assay kit with a microplate reader (FLx800, BioTek Instruments, Inc., Winooski, VT, United States). The purified PCR amplicons were then mixed at equimolar ratios for sequencing analysis. Sequencing was conducted on the Illumina MiSeq platform using a TruSeq Nano DNA LT Library Prep Kit (Illumina Corporation, San Diego, CA, United States). Before sequencing, quality inspection was conducted on the Agilent Bioanalyzer using the Agilent High Sensitivity DNA Kit, and the sample was checked to have only a single peak. Then the sample was quantified using a Quant-iT PicoGreen dsDNA Assay Kit on a Promega QuantiFluor, and more than 2 nM was quantified. The sample was diluted and mixed with NaOH to denature the DNA into single strands for sequencing. Finally, the sample was analyzed using a MiSeq sequencer for paired-end sequencing of 2 × 300 bp using MiSeq Reagent Kit V3 (600 cycles).
Soil Physicochemical Analysis
The soil organic carbon and total nitrogen concentrations were determined using the oil bath-K2Cr2O7 titration method and the Kjeldahl method, respectively. Extractable ammonium and nitrate concentrations were determined following extraction of fresh soil with 1 mol L-1 KCl and then using a colorimetric method on an Alpkem Autoanalyzer (AA3 Auto Analyzer 3; German SEAL; German). The soil pH was determined using an automatic titrator (PHSJ-4F pH meter, Shanghai Electric Instrument Science Instruments Ltd., Shanghai, China) in 1:2.5 soil: water suspensions. The soil bulk density was determined gravimetrically in the laboratory.
Statistical Analysis
To estimate the effects of R. pseudoacacia plantations on soil properties, potential N2O emission rates and denitrifying bacterial community, we analyzed the differences in soil bulk density, pH, organic carbon content, extractable ammonium and nitrate content, potential N2O emission rates, and the abundance of total bacteria and denitrifying functional genes (napA, narG, nirK, nirS, qnorB, and nosZ) with restoration age using general linear models. Post hoc comparisons with restoration stages were also performed using least significant difference (LSD) tests.
Principal Component Analysis (PCA) was used to analyze the similarity of total bacterial and denitrifying bacterial communities during restoration stages. The richness, evenness, and diversity of total bacterial communities were quantified by using Chao 1, Simpson and Shannon diversity indices, and the features of vegetation communities were quantified by using species richness, Pielou evenness and Shannon diversity indices. To quantify the correlations of potential N2O emission rates and denitrifying functional genes, we used a normal distribution of the log of abundance of denitrifying functional genes. The correlations among soil properties, potential N2O emission rates and denitrifying functional genes were quantified using Pearson correlation analyses before engaging in further analyses. Then, based on the results of Pearson correlation analyses, a multiple regression analysis was performed to determine the multiple linear regression equation relating potential N2O emission rates and denitrifying functional genes. Likewise, the structural equation model (SEM) was applied to investigate the direct and indirect effects of the indices chosen by multiple regression analysis on potential N2O emission rates (P > 0.05). Finally, PCA and Pearson correlation analyses were also used to determine the ordination of potential N2O emission rates, soil properties and denitrifying bacterial community (the three major denitrifiers in genes level of each denitrifying functional genes).
All statistical analyses were performed using SPSS (IBM SPSS Statistics 20.0; International Business Machines Corporation, Armonk, NY, United States), and all graphs were made using Origin (OriginPro 2016; OriginLab Corporation, Northampton, MA, United States).
Results
Potential N2O Emission Rates on Denitrification After a Short Incubation
Potential N2O emission rates varied significantly with restoration ages and ranged between 5.38 and 10.50 μg kg-1 d-1 (Figure 1; df = 4; F = 107.313; P < 0.000). Rates were the highest at the 0-year sites, and decreased as the restoration ages increased from the 14-year to 33-year sites, and then increased between the 33-year and 42-year sites.
Figure 1. Different letters indicate significant differences (P < 0.05) among afforestation restoration ages based on a general linear model followed by an LSD post hoc test. The box plot shows the following information from top to bottom: maximum, upper quartile, median, lower quartile, and minimum. The white square shows the average value and the black line shows the trend. The black rhombus shows potential N2O emission rate data.
Abundance of Denitrifying Functional Genes
The absolute abundances of total bacteria and denitrifying functional genes, except narG genes, varied significantly with restoration stage (Figure 2 and Supplementary Table S5). The absolute abundances of total bacteria ranged from 1.93 × 10⁶ to 6.82 × 10⁶ copies g-1, and initially decreased compared with the 0-year sites and subsequently increased at the 14-year - 42-year sites. The napA and narG genes exhibited different trends. The absolute abundances of napA and narG genes varied 2.51 × 10⁴ - 8.11 × 10⁵ copies g-1 and 5.35 × 10⁴ - 1.70 × 10⁵ copies g-1, respectively. Compared with narG gene, which showed no obvious trend across the sites, the napA gene initially decreased between 0-year and 14-year sites, and subsequently increased at the 14-year - 33-year sites, and then declined between the 33-year and 42-year sites. The absolute abundances of nirK, qnorB and nosZ genes appeared to be more abundant at the 42-year sites than at those of other sites and increased from the 0-year to 42-year sites. In contrast, the nirS gene abundances showed no obvious trend across sites. The nirK, nirS, qnorB, and nosZ genes varied 2.8 × 10³–7.59 × 10⁵, 2.58 × 10³-9.77 × 10³, 1.90 × 10⁴-9.61 × 10⁵, and 1.94 × 10³-4.20 × 10⁵ copies g-1, respectively. Furthermore, the absolute abundances of qnorB were more than those of nosZ in all sites.
Figure 2. The absolute abundances of total bacteria and denitrifying functional genes among afforestation restoration of abandoned farmland. (A) Bacteria; (B) napA, narG; (C) nirK, nirS; (D) qnorB, nosZ. The absolute abundances (copies g soil-1) are shown on a log 10 scale (Y-axis). The standard deviations of the three replicates are indicated by error bars. Non-visible error bars indicate that the standard deviations are smaller than the marker size. Different letters indicate significant differences (P < 0.05) among restoration ages based on a general linear model followed by an LSD post hoc test.
Diversity and Composition of Total Bacterial and Denitrifying Bacterial Communities
After quality trimming and chimera removal, the total bacterial and denitrifying bacterial sequences were assayed using Illumina MiSeq high-throughput sequencing (Supplementary Table S6). The variations of total bacteria and denitrifying bacteria composition with restoration stages were identified by PCA (Supplementary Figures S2, S3). The richness (shown by Chao 1 index) and diversity (shown by Shannon index) of the total bacterial communities revealed the similar trend, i.e., an initial increase followed by a decrease (except 42-year in richness), with the highest values at the 26-year sites (Supplementary Table S7). However, the evenness (shown by Simpson index) of the total bacterial communities showed no difference among restoration stages (Supplementary Table S7). Furthermore, the richness, evenness and diversity of denitrifying bacterial communities showed no obvious trends among restoration stages (Supplementary Table S7). The total bacterial community was dominated by Actinobacteria (23.1% on average), followed by Proteobacteria (21.7%), Acidobacteria (17.1%), Planctomycetes (12.8%), Gemmatimonadetes (7.2%), and Chloroflexi (7.2%) (with relative abundances of more than 5%; Supplementary Table S8). Proteobacteria was the major phylum in total bacterial communities at 0-year to 33-year sites. However, Acidobacteria and Planctomycetes were dominant at 42-year sites (Supplementary Table S9). Moreover, the denitrifying bacteria encoded by napA, narG, nirS, and nosZ genes were dominated by Proteobacteria in the phyla level, and the percentages of Proteobacteria in denitrifying bacteria communities were 47.8, 56.0, 5.8, and 89.8%, respectively. Actinobacteria and Proteobacteria were the major phyla of denitrifying bacteria encoded by nirK (16.8%, 15.7%) and qnorB (8.9%, 12.8%), but the denitrifying bacterial communities were still somewhat unclear.
Soil Properties, Abundance and Diversity of Denitrifying Bacterial Communities in Relation to the Potential N2O Emission Rates
Some soil properties and soil microbial abundances were correlated with potential N2O emission rates. Soil pH and organic carbon content were negatively related to potential N2O emission rates (Figure 3; P < 0.01), while a positive relationship was found between extractable ammonium content and potential N2O emission rates (Figure 3; P < 0.01). Furthermore, the abundances of denitrifying bacteria encoded by nirK, qnorB, and nosZ genes were negatively related to potential N2O emission rates (Figure 3; P < 0.01, P < 0.05, and P < 0.05, respectively). Multiple regression analysis was used to determine the relative contribution of denitrifying functional genes to the variation of potential N2O emission rates. As a result, the ratios of qnorB/nirK, nosZ/nirS, (nirK+ nirS)/(napA+ narG), and (napA+ narG)/bacteria were the four major predictors, which could explain 53% of the variation in potential N2O emission rates (P = 0.018). The ratios of qnorB/nirK, nosZ/nirS, and (napA+ narG)/bacteria were significantly explained 34, 51, and 35% of the variation in potential N2O accumulation rates, respectively (Figures 4A,B,D). However, the ratios of (nirK+ nirS)/(napA+ narG) had no significant influence on potential N2O emission rates (Figure 4C). Likewise, the qnorB/nirK, nosZ/nirS, and (nirK+ nirS)/(napA+ narG) ratios showed significant differences between the 0-year and 14-year - 42-year sites (Supplementary Figures S4a–c), and (napA+ narG)/bacteria ratios were significantly different between the sites with the lowest (0-year) and the highest (33-year) potential N2O emission rates (Supplementary Figure S4d). Then, we used a SEM to examine the direct and indirect effects of the ratios of denitrifying functional genes on the potential emission rates of N2O (Figure 5). The qnorB/nirK, nosZ/nirS, (nirK+ nirS)/(napA+ narG), and (napA+ narG)/bacteria ratios had direct different influences (β = 0.17,-0.25, -0.27, and -0.43) on the variation of the potential N2O emission rates. Furthermore, the influences of (nirK+ nirS)/(napA+ narG) on the variation of the potential emission rates of N2O were mediated through qnorB/nirK (β = -0.11) and nosZ/nirS (β = -0.12), and the (napA+ narG)/bacteria ratios affected the potential N2O emission rates indirectly through qnorB/nirK (β = -0.04) and nosZ/nirS (β = -0.15). Overall, the SEM had a P = 0.086 (P > 0.05), which indicated that the SEM was applicable and explained 65% of the total variance influencing the potential N2O emission rates.
Figure 3. The relationships between potential N2O emission rates, denitrifying functional gene abundances, and soil properties among restoration stages. The strength of the linear relationship between two variables is described by the Pearson Correlation Coefficient and showed in different colors. P-values are given through black circles (P < 0.01) and unfilled circles (P < 0.05). N2O = N2O emission rates (μg kg-1 d-1); BD = bulk density (g cm-1); OC = organic carbon (g kg-1); TN = total nitrogen (g kg-1); extractable ammonium and nitrate (mg kg-1); bacteria, napA, narG, nirK, nirS, qnorB, and nosZ show the abundances of denitrifying functional genes.
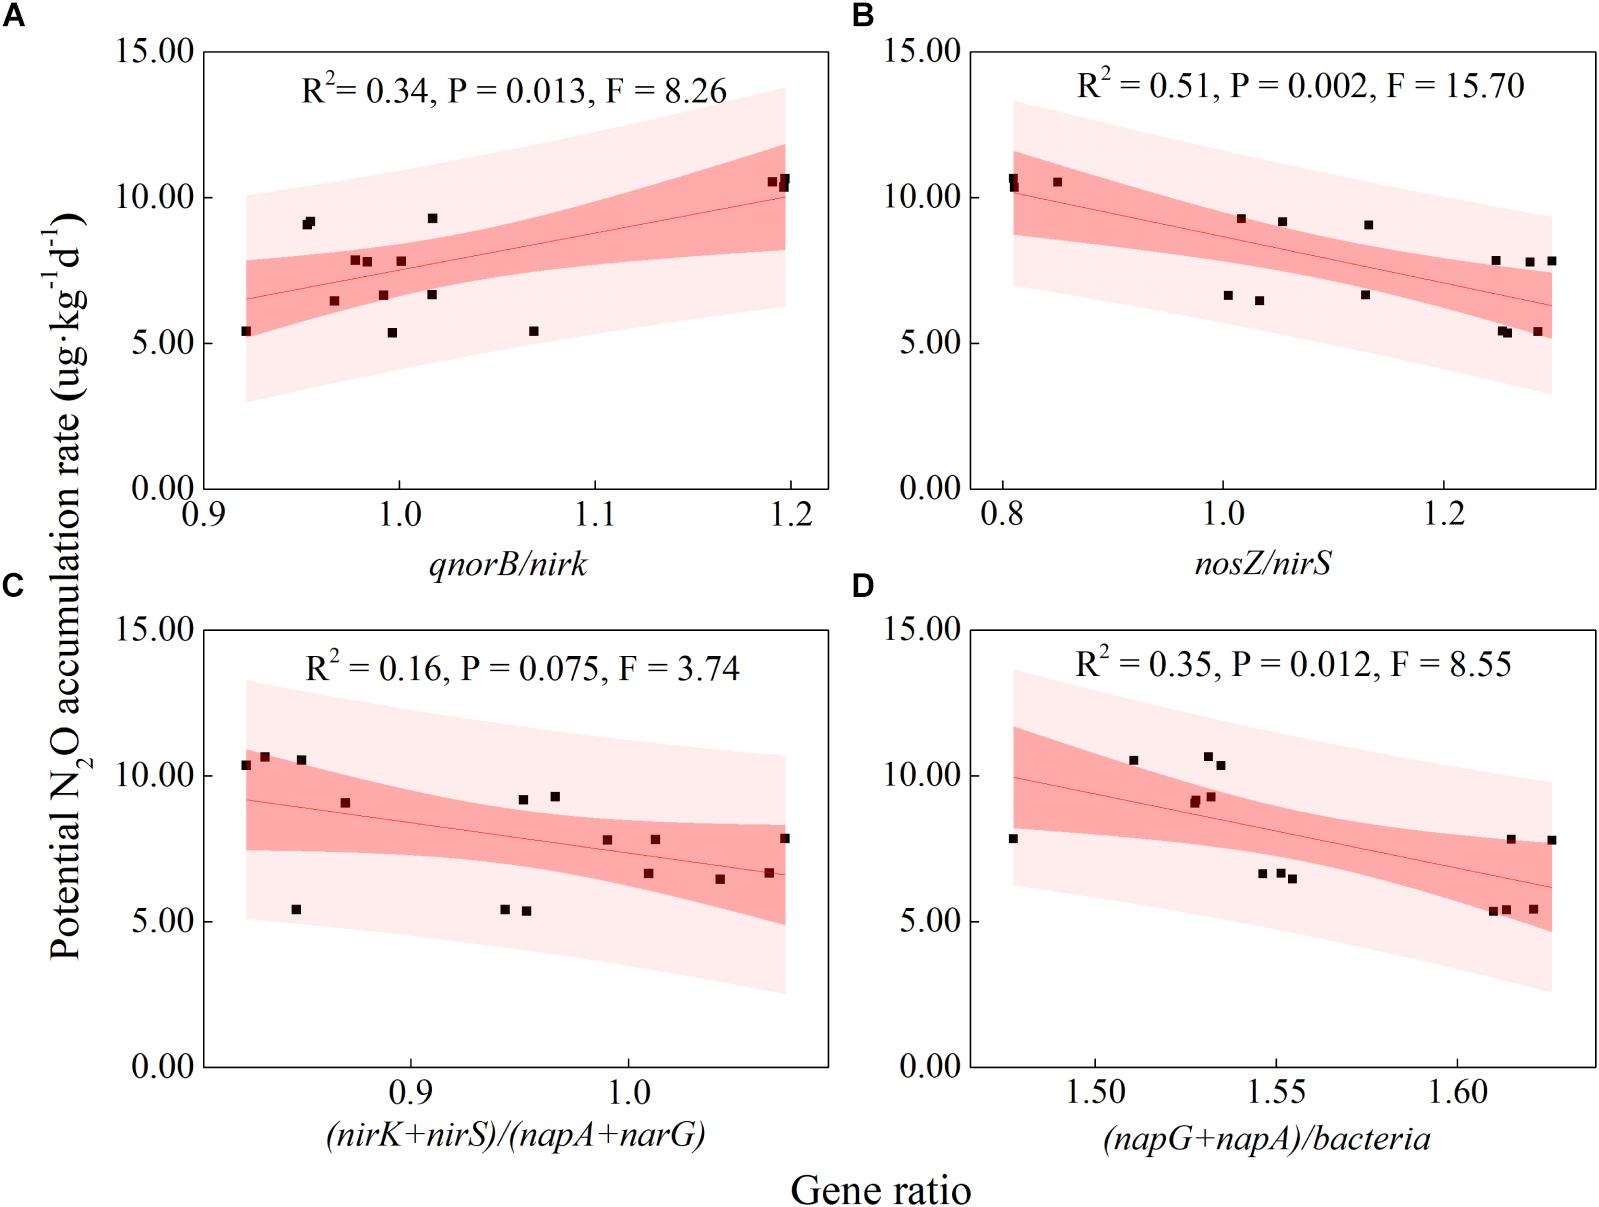
Figure 4. Relationships between the potential N2O emission rates and denitrifying functional gene ratios across restoration stages. (A) qnorB/nirK (NO transformation and N2O production); (B) nosZ/nirS (NO to N2 transformation); (C) (nirK+nirS)/ (napA+narG) (nitrite consumption); (D) (napA+narG)/bacteria (nitrite production). The bacteria represent the abundance of the denitrifier bacterial 16S RNA gene. The black squares indicate the potential N2O emission rates and the ratios of denitrifying functional genes. The red fitted lines are from ordinary least squares regression. The dark and shaded areas show the 95% confidence interval and the prediction band of the fit, respectively.
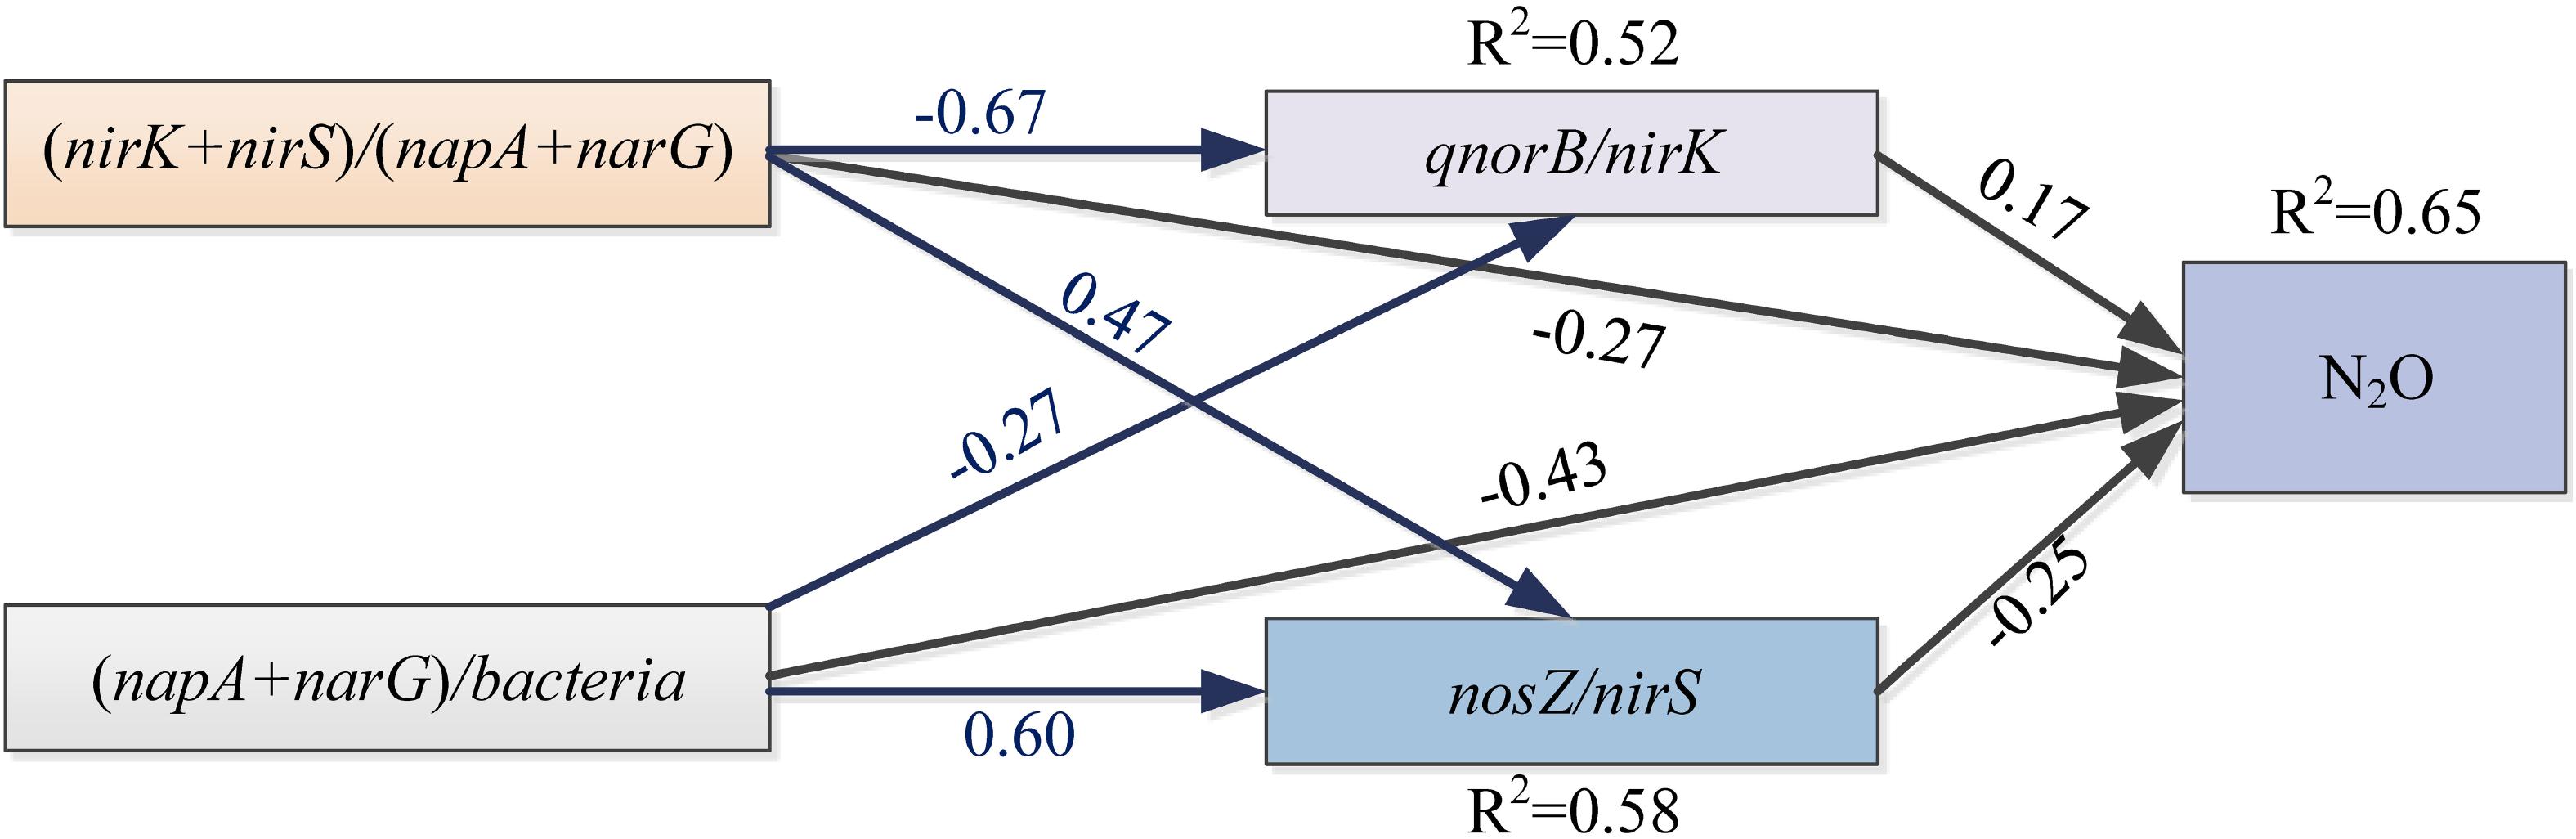
Figure 5. The structural equation model (SEM) describing the direct and indirect contributions of gene fragments on the potential N2O emission rates. Single-pointed arrows indicate causal paths. The black arrows represent the direct influences, and the blue arrows show indirect influences. R2 values are shown for dependent variables. A non-significant P-value (P = 0.086) for the Chi-squared statistic indicate that there was no significant difference between the covariance pattern predicted by the SEM and that from the observed covariance, indicating a good fit of the data.
Ordination of samples by PCA based on potential N2O emission rates, soil properties, abundances and composition of denitrifying bacterial community showed a clear separation of restoration stages along the first axis, with the first two axes explaining 92.37% of the total variance (Figure 6). The ordination stressed the trends observed in Supplementary Table S11, showing a strong correlation of some soil properties, denitrifying bacterial community with potential N2O emission rates. Of particular interest, we found positive correlations among extractable ammonium content, the abundance of nosZ and napA and potential N2O emission rates (P < 0.01), while negative correlations among soil pH, organic carbon content, the abundances of narG, nirS and qnorB, Bradyrhizobium (nirK), Variovorax (nirK), Bradyrhizobium (qnorB), and potential N2O emission rates were found (P < 0.01).
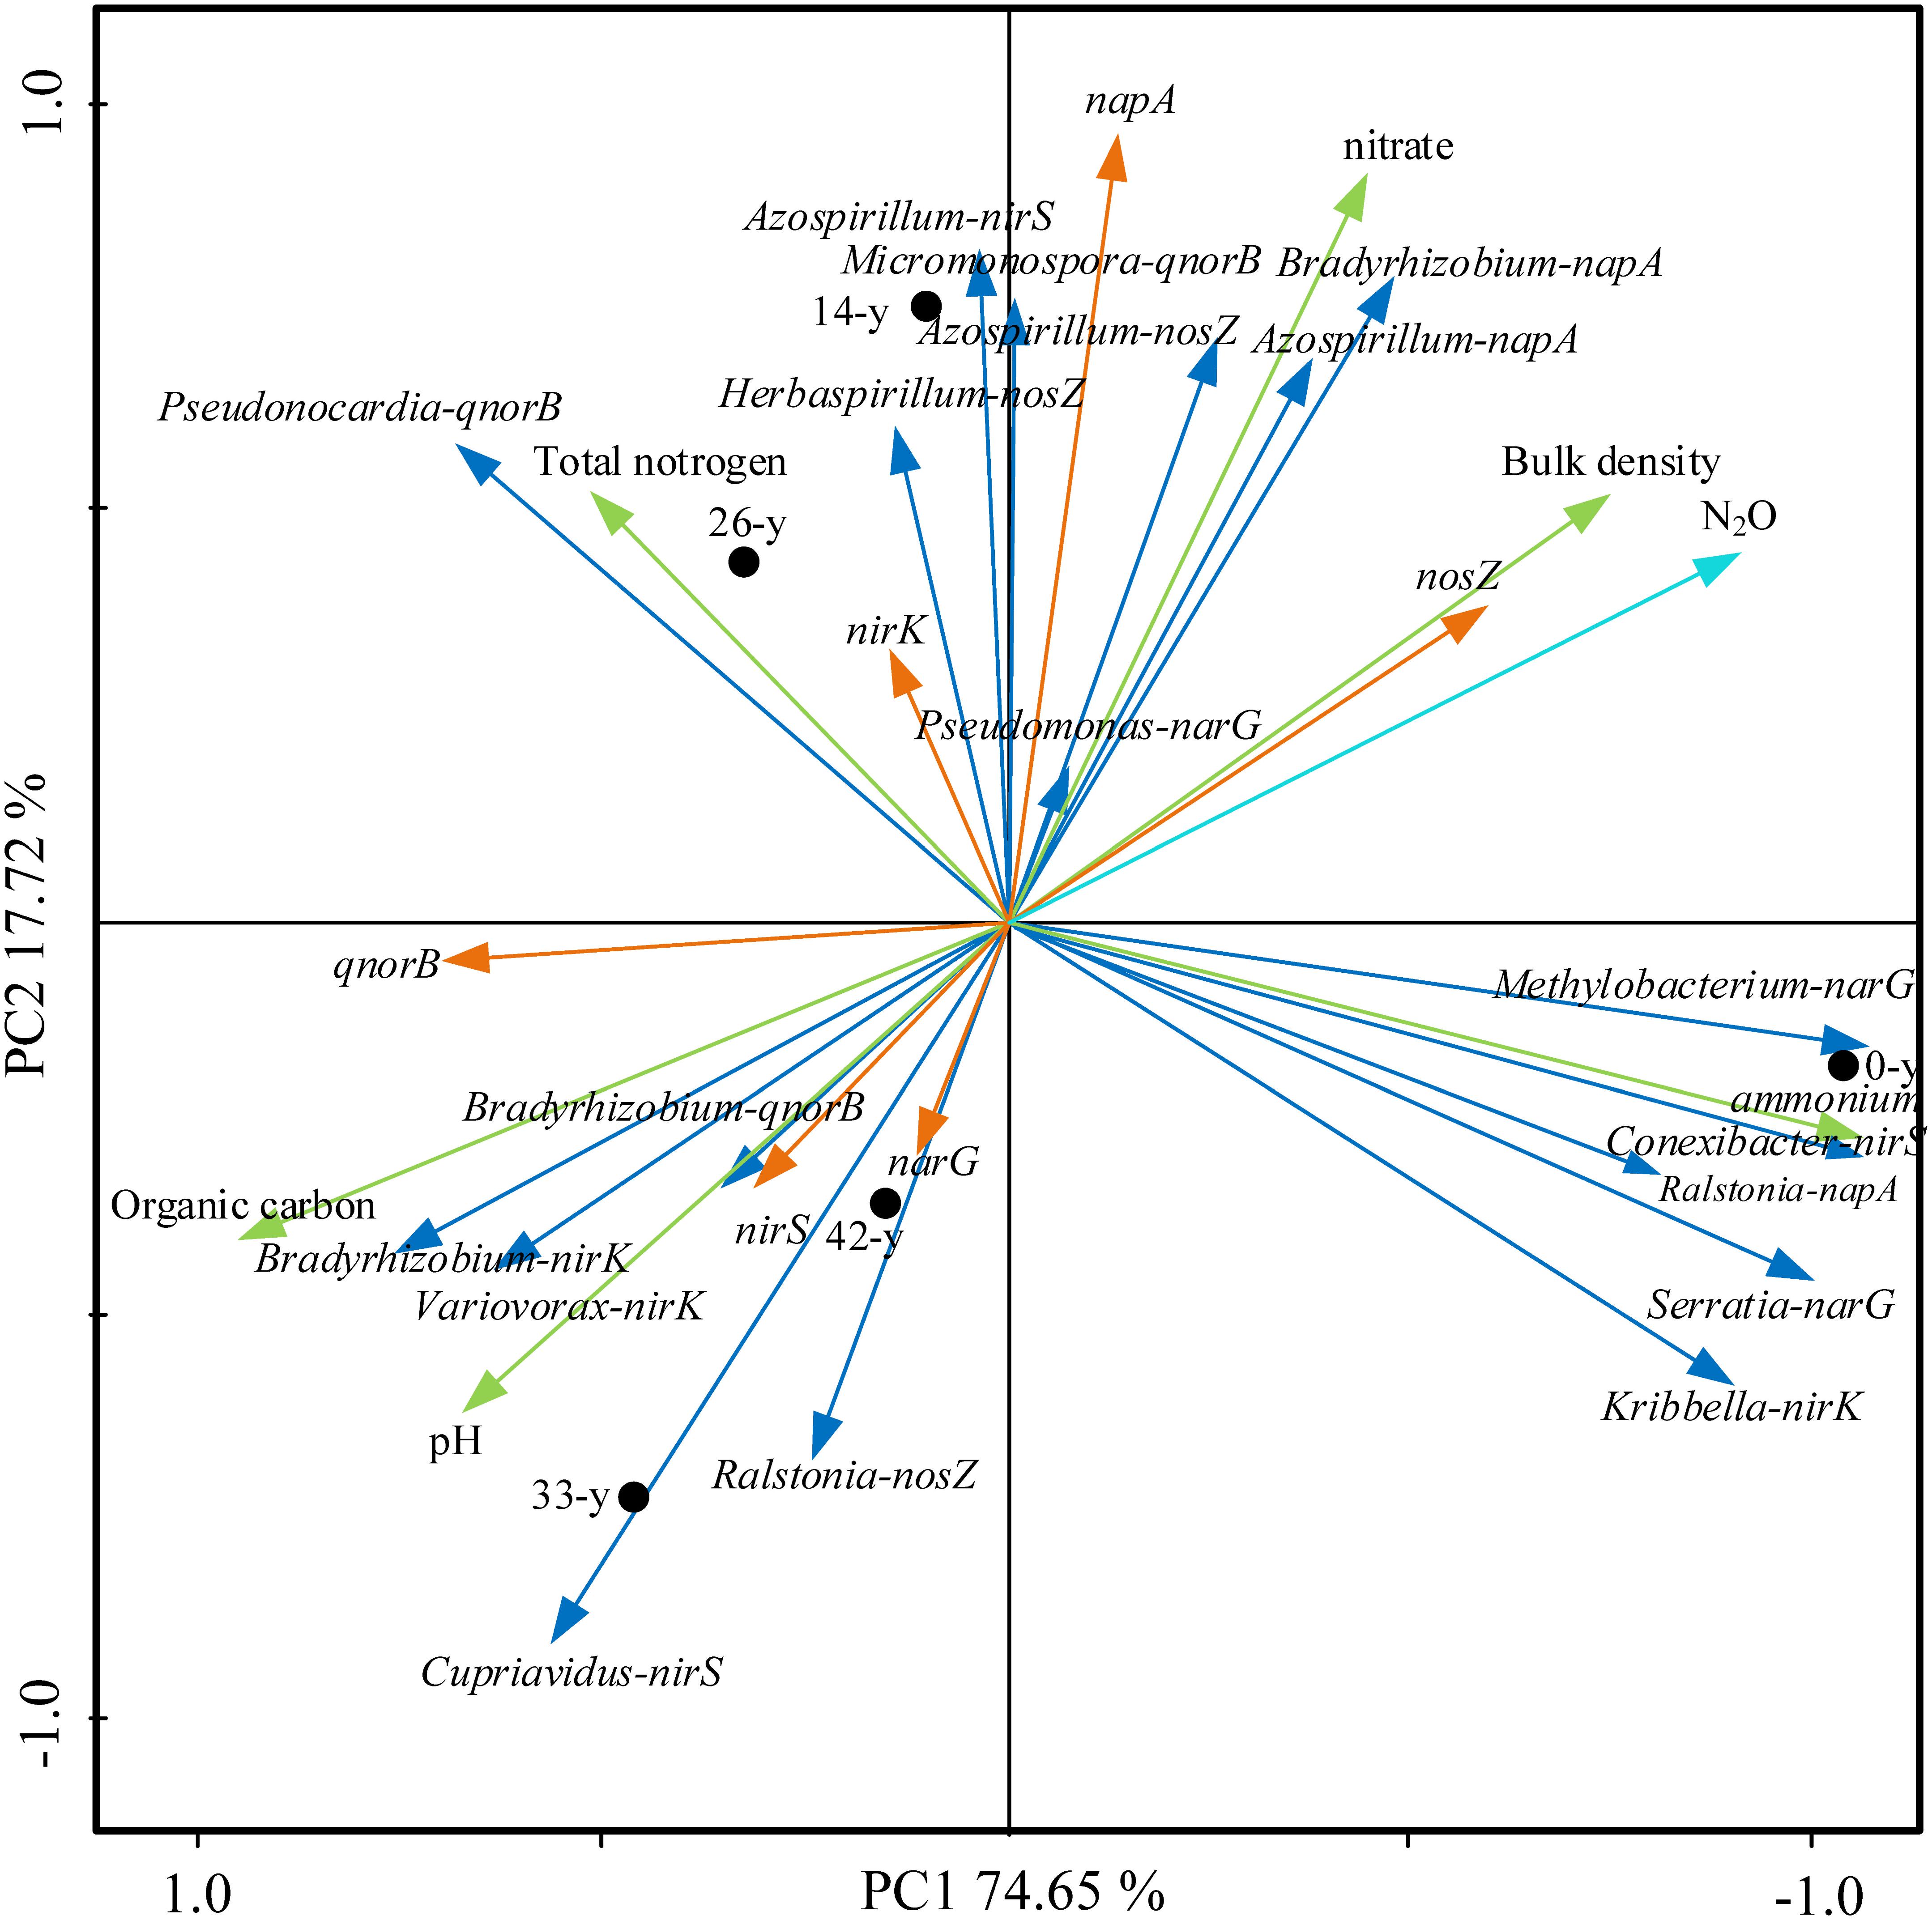
Figure 6. Principal component analysis (PCA) of potential N2O emission rates, soil properties (bulk density, pH, organic carbon content, total nitrogen content, extractable ammonium and nitrate content, the abundances (showing by napA, narG, nirK, nirS, qnorB, and nosZ) and composition of denitrifying bacterial community (Bradyrhizobium-napA, Azospirillum-napA, Ralstonia-napA, Methylobacterium-narG, Serratia-narG, Pseudomonas-narG, Kribbella-nirK, Bradyrhizobium-nirK, Variovorax-nirK, Conexibacter-nirS, Azospirillum-nirS, Cupriavidus-nirS, Micromonospora-qnorB, Pseudonocardia-qnorB, Bradyrhizobium-qnorB, Azospirillum-nosZ, Ralstonia-nosZ, and Herbaspirillum-nosZ). The first two PCA axes (PC1 and PC2) explain 92.37% of total variance. Field plots coded as in Supplementary Table S2.
Discussion
Potential Rates of N2O Emission Across a Restoration Chronosequence
The potential N2O emission rates through denitrification process varied significantly with restoration ages (Figure 1), suggesting that afforestation restoration does indeed alter N2O emissions (Liu et al., 2018). Compared with the 14-year - 42-year sites in this study, the 0-year sites had by far the highest potential N2O emission rates, indicating that farmland may have been the larger source of N2O (Domeignoz-Horta et al., 2018). Unfortunately we cannot scale these potential rates to annual values; nevertheless, elevated rates in actively managed farmlands would not be a surprise. Agricultural practices, such as tillage and fertilization, can increase the soil organic carbon and extractable ammonium contents consequently alter N2O emissions (Suleiman et al., 2013). Furthermore, afforestation restoration rapidly created a specific understory microhabitat due to canopy density, showing a decreasing trend of soil potential N2O emission (except at the 42-year sites; Figure 1). This supports the hypothesis that restoration in soils with a higher pH, such as those common in arid environments, may reduce N2O emission (Gundersen et al., 2012). Šimek et al. (2002) also reported that N2O/(N2O + N2) ratios decreased with increasing soil pH values, consistent with our finding that soil potential N2O emission rates decreased and pH increased at 14-year - 42-year sites (Figure 1 and Table 1). The 42-year sites had a higher potential N2O emission rates than did the 33-year sites (Figure 1), following a decrease in soil pH and organic carbon content, which translated into a decline in ecological function in the oldest sites. This phenomenon was consistent with the finding by Kou et al. (2016), who found that the soil nutrients and the density and cover of R. pseudoacacia plantations decreased after 30 years of afforestation in the Chinese Loess Plateau. Understory vegetation communities can dramatically alter soil microbial process through root exudation and litter inputs (Singh et al., 2004). In this study, we found that the potential fluxes of N2O were negatively correlated with trends in understory vegetation features, such as richness, evenness and diversity (Supplementary Table S3), and that soil properties, such as soil pH and organic carbon content (Table 1), were also negatively correlated with potential N2O emission rates, perhaps through their interactions with changes in understory vegetation (Cuhel et al., 2010; Levy-Booth et al., 2014). Therefore, N2O emission can be influenced by understory vegetation, soil pH and organic carbon content over the course afforestation and the role of denitrifying bacteria may also be critical.
The Abundance Dynamic of Denitrifying Functional Genes During Afforestation Restoration
The absolute abundances of total bacteria and the denitrifying functional genes of nirK, qnorB, and nosZ increased across age since restoration plantings (Figure 2), suggesting that afforestation restoration can increase microbial biomass (Lozano et al., 2014; Barber et al., 2017). However, the absolute abundances of total bacteria and the qnorB gene in the 0-year sites were higher than in the 14-year sites (Figure 2), which was inconsistent with a previous study showing that frequent human intervention can reduce the abundance of bacteria (Lin et al., 2012). Added nutrient resources in farmlands may support a more plentiful microbial community (Zhang C. et al., 2016), an idea which was supported by the Shannon diversity of the total bacterial community (Supplementary Table S5). Organic carbon content was positively correlated with the abundance of napA and narG genes (Bru et al., 2011). In this study, the absolute abundances of napA and narG genes showed different changes with restoration stages (Figure 2B), which may be explained by the special roles of napA and narG genes (Chèneby et al., 2009). The napA genes had a similar change with soil pH and organic carbon content (Figure 2B and Table 1), suggesting that the napA gene is more sensitive than narG gene on the variations in soil nutrients, which is contrary to the finding by Chèneby et al. (2009). The narG gene showed no obvious change with restoration age, inconsistent with the finding that the narG gene is easily promoted by increases in soil nutrients (Tang et al., 2016). This discrepancy might be due to differences in the environmental conditions in the two studies. The Chinese Loess Plateau is located in a semiarid region, whereas the nirS gene is likely more adapted to waterlogged soils than the nirK gene (Azziz et al., 2017). The nirS genes also showed no obvious changes in absolute abundance, while the nirK gene increased among restoration ages (Figure 2C). Likewise, the qnorB genes had higher abundances than nosZ genes in all sites (Figure 2D), which offered a molecular-level explanation for the viewpoint that soil acts as a source for N2O, especially in farmlands and forests (Bremner and Blackmer, 1979; Kong et al., 2010; Levy-Booth et al., 2014; Hu et al., 2015). Briefly, denitrifying functional genes have different roles in denitrification and have close relationships with each other (Figure 3), which can change the products of denitrification, especially N2O emission (Hu et al., 2015).
Variation in Denitrifying Bacterial Community Over the Course of Afforestation Restoration
PCA of the compositions and structures of the total bacterial and denitrifying bacterial communities identified large shifts in the distributions of microbial communities during restoration stages (Supplementary Figures S2, S3), which was consistent with the results of Lozano et al. (2014) and Zhang C. et al. (2016), who found obvious variations during the succession of bacterial communities in abandoned farmland. Actinobacteria and Proteobacteria were the most two abundant phyla of the total bacterial communities regardless of the restoration stages (except 42-year sites; Supplementary Table S8). Soil nutrients play an important role in the total bacterial community composition for Actinobacteria can be widely distributed in both terrestrial and aquatic ecosystems (Ventura et al., 2007) and Proteobacteria is partial to nutrient-rich soils (Liu et al., 2018). In this study, the total bacterial communities transitioned from Actinobacteria-dominant (0-year) to Proteobacteria-dominant (14 and 26-year) and then returned to Actinobacteria-dominant (33-year) (Supplementary Table S9), consistent with the findings by Desnues et al. (2007) and Liu et al. (2018). Taken together, these results indicate that total bacterial community composition was more influenced by soil total nitrogen and extractable nitrate contents. Furthermore, we found that the highest richness, evenness, and diversity of the understory vegetation community were in the 33-year sites, while the highest richness and diversity of total bacterial community were in the 26-year sites (Supplementary Tables S3, S7), suggesting an incongruous process which understory vegetation succession followed soil bacteria succession. These patterns are inconsistent with Lozano et al. (2014), who found that microbial succession followed plant succession in natural recovery processes. The mechanism underlying this difference is unclear, and the effects of artificial restoration process, especially for R. pseudoacacia plantations, on soil ecosystem may aid in understanding. Specifically, the total bacterial community composition in 42-y sites was dominated by Planctomycetes (22.3%), followed by Actinobacteria (19.4%), Acidobacteria (18.7%), and Proteobacteria (14.4%) (Supplementary Table S9), indicating a unique distribution of total bacterial community composition was found in our study. The mechanism underlying this control is unclear, but vegetation community in the herbaceous layer and the limitation by soil nutrients are likely playing a role.
Furthermore, Actinobacteria and Proteobacteria were the major phyla of denitrifying bacteria encoded by nirK and qnorB genes, which indicated that N2O products can occur in most environments (Liu et al., 2018) Although other soil processes controlled by microbes, such as nitrification, can also contribute to N2O efflux, denitrification is often a dominant pathway. Proteobacteria was the major phylum of denitrifying bacteria encoded by napA, narG, nirS, and nosZ regardless of restoration stages (Supplementary Table S3), suggesting that the dynamics of N2O emission is influenced by the changes in soil nutrients (Azziz et al., 2017; Tatti et al., 2017), which is in agreement with the relationship analysis indicating that denitrifying functional genes and soil properties were closely related (Figure 3). However, the richness, evenness, and diversity of denitrifying bacterial community showed no obvious trends across the chronosequence (Supplementary Table S7). The mechanism underlying this is unclear.
Relationships Among Potential N2O Emission Rates, Soil Properties and Denitrifying Bacteria
Taken together, the correlation analyses and the PCA (Figure 6) suggested that the variation in potential N2O emission rates were partially attributable to changes in the soil properties and in the abundance and composition of denitrifying bacteria. In addition, the restoration occurring from afforestation studied here changed the canopy density and altered the understory community (Liu et al., 2018). Such changes to the vegetation can affect soil properties through changes to root exudation and litterfall (Singh et al., 2004).
Response of Potential N2O Emission Rates to Soil Properties
Afforestation via planting trees can rapidly create an understory microhabitat from increases canopy density, which can, in turn, alter soil properties and N2O fluxes (Liu et al., 2018). In our study, we found that soil extractable ammonium content, pH, organic carbon content, and bulk density all had close correlations with potential N2O emission rates (Figures 3, 6). Specifically, we found a strong positive correlation between extractable ammonium content and potential N2O emission rates (Figure 3). Our study area was farmlands that were fertilized and agriculturally managed, especially with fertilizer addition, which can supply ample ammonium for denitrification, and N2O emission (Hu et al., 2015). Furthermore, soil pH had a negative correlation with potential N2O emission rates (Figures 3, 6 and Supplementary Table S11), consistent with the findings that higher soil pH could reduce N2O efflux (Wrage et al., 2001; Hu et al., 2015). Our results indicated that the denitrifying bacterial community encoded by nosZ genes preferred low pH in soils, which is seen in the negative relationships between soil pH and the Shannon diversity of denitrifying bacterial community encoded by nosZ genes (Figure 6). Soil organic carbon serves as the energy supply in heterotrophic microbial pathways, yet soil carbon content was negatively correlated with potential N2O emission rates (Figures 3, 6 and Supplementary Table S11). These patterns may be explained by the denitrifying bacterial community in the phyla level. We found that denitrifying bacterial community encoded by qnorB genes, which can produce N2O, belongs to Actinobacteria and Proteobacteria, leading to a large number of N2O emission in soils (Liu et al., 2018). However, the nosZ genes, acting as the only microbial pathway for N2O consumption, were made up more by Proteobacteria, meaning that eutrophic environments can had lower N2O emissions (Hu et al., 2015). Soil bulk density, which can be related to soil aeration, was positively correlation with potential N2O emission rates (Figure 6), suggesting that soil compaction could represent a significant control over N2O emission rates and losses to the atmosphere (Hu et al., 2015). Therefore, fertilizer addition and soil compaction (i.e., higher soil bulk density) may increase N2O emissions, whereas higher soil pH and organic carbon content can reduce N2O emissions.
Response of Potential N2O Emission Rates to Denitrifying Functional Genes
The multiple regression analysis, SEM and PCA showed that total bacteria and denitrifying functional genes were crucial in mediating potential N2O emission rates (Supplementary Table S10 and Figure 5), which could reflect and integrate a part of the fluctuations in bio-ecological processes (Hu et al., 2015). More specifically, the qnorB/nirK denotes the level of NO transformation and N2O production as the qnorB genes are directly involved in N2O production and NO consumption, while nirK genes perform NO production. The significant positive correlation between qnorB/nirK and potential N2O emission rates indicated the importance of the reaction substrate supply in N2O emissions. The nirK and nosZ genes are directly involved in NO production and N2 production processes, and nosZ/nirS ratio reflects the level of NO to N2 transformation. The nosZ/nirS had a negative correlation with potential N2O emission rates and because N2 production is the only pathway for N2O consumption, these data suggested that nosZ genes play an important role in controlling N2O emissions for this system. The napA and narG genes are involved in nitrite consumption level in denitrification process. The (napA+ narG)/bacteria and (nirK+ nirS)/(napA+ narG) were negatively associated with potential N2O emission rates, likely because they reflect nitrite transformation in the denitrification process. (napA+ narG)/bacteria reflects the nitrite production level and (nirK+ nirS)/(napA+ narG) was directly involved in nitrite consumption. This is in agreement with the finding of Levy-Booth et al. (2014), who found that nitrite reduction had a major influence on N2O emission rates. Furthermore, the indirect influence of denitrifying functional genes on potential N2O emission rates reflects the close links among different microbial processes of denitrification. The ratios of (nirK+ nirS)/(napA+ narG) and (napA+ narG)/bacteria had indirect influences on potential N2O emission rates through qnorB/nirK, suggesting that nitrite transformation showed an indirect effect on potential N2O emission rates by influencing the N2O production. We also found that the ratios of (nirK+ nirS)/(napA+ narG) and (napA+ narG)/bacteria had indirect influences on potential N2O emission rates through nosZ/nirS, suggesting that nitrite transformation showed an indirect effect on N2O emission rates by influencing the N2O consumption. Notably, we also found that the abundances of denitrifying bacteria encoded by nosZ were positively correlated with potential N2O emission rates, while qnorB was negatively correlated with potential N2O emission rates. The qnorB/nosZ ratios were positively correlated with potential N2O emission rates (r = 0.41), indicating that denitrifying functional genes have close relationships with each other (Figure 3) and N2O emissions can be regulated by the abundance of denitrifying functional genes (Hu et al., 2015).
Therefore, nitrite transformation is a key step in denitrification process and N2O emission (Domeignoz-Horta et al., 2018). However, the relationships between denitrifying functional genes and potential N2O emission rates were not sufficient to fully explain patterns in N2O emissions, and the underlying mechanisms and the response of denitrifying bacterial community on N2O emission rates is worthy of further study.
Response of Potential N2O Emission Rates to Denitrifying Bacterial Community
N2O emission is driven by soil microorganisms, especially denitrifiers in anaerobic environments (Hu et al., 2015). In our study, we found Bradyrhizobium (nirK) and Variovorax (nirK) were negatively correlated with potential N2O emission rates (P < 0.01) (Figure 6 and Supplementary Table S11), suggesting that the denitrifying functional genes encoded by nirK, which produce NO, were crucial to N2O emission. These data point to nitrite transformation as a key step in determining overall N2O emission rates, at least under the conditions simulated here (found in section “Response of Potential N2O Emission Rates to Denitrifying Functional Genes”). Specifically, a negative correlation between Bradyrhizobium (qnorB) and potential N2O emission rates was found, inconsistent with the finding that denitrifiers encoded by qnorB can produce N2O. In our study, soil organic carbon content had the strongest relationship with potential N2O emission rates, followed by the abundance of nosZ, soil bulk density, and Bradyrhizobium and Variovorax abundance, consistent with the findings by Levy-Booth et al. (2014), Lozano et al. (2014), Zhang C. et al. (2016), and Domeignoz-Horta et al. (2018), which indicated that the changes of soil properties can alter the microorganism composition and then influence the products of soil microbial pathway. Taken together, our study and others emphasize the importance of denitrifying bacterial communities in responding to environmental changes and modulating denitrification process (Bernhard and Kelly, 2016).
Conclusion
Afforestation restoration rapidly created a special understory microhabitat that acted as driving force to alter N2O emission and the diversities and compositions of vegetation and soil denitrifying bacteria communities. Compared with farmlands, afforestation restoration can increase soil nutrients (soil organic carbon content) and improve soil physical characteristics (soil bulk density), followed by increasing the abundances of denitrifying functional genes and altering the structure of denitrifying bacterial communities (Actinobacteria-dominant to Proteobacteria-dominant). These changes can interact to alter the dynamics of potential N2O emission rates. Specifically, correlation analysis indicated that NO transformation was the key step in determining potential N2O emissions in our study. However, some denitrifying bacteria were remaining unknown, and these organisms could be targeted for future soil nitrogen-focused studies in semiarid ecosystems.
Author Contributions
ND made the text, figures, and tables (including the Supplementary Material). HW, SH, and JJ contributed to experimental design method, manuscript frame, and manuscript modification.
Funding
This work was supported by the National Key Research and Development Program of China (No. 2016YFC0501604), the Fundamental Research Funds for the Central Universities (Z109021711), the Shanxi National Science Foundation (No. 2017JQ4022), and Special-Funds of Scientific Research Programs of State Key Laboratory of Soil Erosion and Dryland Farming on the Loess Plateau (A314021403-C6).
Conflict of Interest Statement
The authors declare that the research was conducted in the absence of any commercial or financial relationships that could be construed as a potential conflict of interest.
Supplementary Material
The Supplementary Material for this article can be found online at: https://www.frontiersin.org/articles/10.3389/fmicb.2019.00262/full#supplementary-material
References
Azziz, G., Monza, J., Etchebehere, C., and Irisarri, P. (2017). NirS- and nirK-type denitrifier communities are differentially affected by soil type, rice cultivar and water management. Eur. J. Soil Biol. 78, 20–28. doi: 10.1016/j.ejsobi.2016.11.003
Baggs, E. M. (2011). Soil microbial sources of nitrous oxide: recent advances in knowledge, emerging challenges and future direction. Curr. Opin. Environ. Sustain. 3, 321–327. doi: 10.1016/j.cosust.2011.08.011
Barber, N. A., Chantos-Davidson, K. M., Amel-Peralta, R., Sherwood, J. P., and Swingley, W. D. (2017). Soil microbial community composition in tallgrass prairie restorations converge with remnants across a 27-year chronosequence. Environ. Microbiol. 19, 3118–3131. doi: 10.1111/1462-2920.13785
Barberan, A., Bates, S. T., Casamayor, E. O., and Fierer, N. (2012). Using network analysis to explore co-occurrence patterns in soil microbial communities. ISME J. 6, 343–351. doi: 10.1038/ismej.2011.119
Bateman, E. J., and Baggs, E. M. (2005). Contributions of nitrification and denitrification to N2O emissions from soils at different water-filled pore space. Biol. Fertil. Soils 41, 379–388. doi: 10.1007/s00374-005-0858-3
Bergaust, L., Mao, Y., Bakken, L. R., and Frostegard, A. (2010). Denitrification response patterns during the transition to anoxic respiration and posttranscriptional effects of suboptimal pH on nitrogen oxide reductase in paracoccus denitrificans. Appl. Environ. Microb. 76, 6387–6396. doi: 10.1128/AEM.00608-10
Bernhard, A. E., and Kelly, J. J. (2016). Editorial: linking ecosystem function to microbial diversity. Front. Microbiol. 7:1041. doi: 10.3389/fmicb.2016.01041
Bouwman, A. F., Beusen, A. H. W., Griffioen, J., Groenigen, J. W. V., Hefting, M. M., Oenema, O., et al. (2013). Global trends and uncertainties in terrestrial denitrification and N2O emissions. Philos. Trans. R. Soc. Lond. B Biol. Sci. 368, 91–97. doi: 10.1098/rstb.2013.0112
Bremner, J. M., and Blackmer, A. M. (1979). Effects of acetylene and soil water content on emission of nitrous oxide from soils. Nature 280, 380–381. doi: 10.13227/j.hjkx.2016.10.041
Bru, D., Ramette, A., Saby, N. P. A., Dequiedt, S., Ranjard, L., Jolivet, C., et al. (2011). Determinants of the distribution of nitrogen-cycling microbial communities at the landscape scale. ISME J. 5, 532–542. doi: 10.1038/ismej.2010.130
Chapuis-Lardy, L., Wrage, N., Metay, A., Chottes, J., and Bernouxs, M. (2007). Soils, a sink for N2O? a review. Glob. Change Biol. 13, 1–17. doi: 10.1111/j.1365-2486.2006.01280.x
Chen, G. C., Nfy, T., and Ye, Y. (2012). Spatial and seasonal variations of atmospheric N2O and CO2 fluxes from a subtropical mangrove swamp and their relationships with soil characteristics. Soil Biol. Biochem. 48, 175–181. doi: 10.1016/j.soilbio.2012.01.029
Chen, Z., Wang, C., Gschwendtner, S., Willibald, G., Unteregelsbacher, S., Lu, H., et al. (2015). Relationships between denitrification gene expression, dissimilatory nitrate reduction to ammonium and nitrous oxide and dinitrogen production in montane grassland soils. Soil Biol. Biochem. 87, 67–77. doi: 10.1016/j.soilbio.2015.03.030
Chèneby, D., Brauman, A., Rabary, B., and Philippot, L. (2009). Differential responses of nitrate reducer community size, structure, and activity to tillage systems. Appl. Environ. Microb. 75, 3180–3186. doi: 10.1128/AEM.02338-08
Cheng, M., and An, S. S. (2015). Responses of soil nitrogen, phosphorous and organic matter to vegetation succession on the loess plateau of China. J. Arid. Land. 7, 216–223. doi: 10.1007/s40333-014-0043-3
Crutzen, P. J. (1970). The influence of nitrogen oxides on the atmospheric ozone content. Q. J. R. Meteorol. Soc. 96, 320–325. doi: 10.1002/qj.49709640815
Čuhel, J., Šimek, M., Laughlin, R. J., Bru, D., Chèneby, D., Watson, C. J., et al. (2010). Insights into the effect of soil pH on N2O and N2 emissions and denitrifier community size and activity. Appl. Environ. Microb. 76, 1870–1878. doi: 10.1128/AEM.02484-09
Desnues, C., Michotey, V. D., Wieland, A., Zhizang, C., Fourçans, A., and Duran, R. (2007). Seasonal and diel distributions of denitrifying and bacterial communities in a hypersaline microbial mat (camargue, france). Water Res. 41, 3407–3419. doi: 10.1016/j.watres.2007.04.018
Domeignoz-Horta, L. A., Philippot, L., Peyrard, C., Bru, D., Breuil, M. C., Bizouard, F., et al. (2018). Peaks of in situ N2O emissions are influenced by N2O-producing and reducing microbial communities across arable soils. Glob. Change Biol. 24, 360–370. doi: 10.1111/gcb.13853
Fu, B. J., Yu, L., Lü, Y., He, C., Yuan, Z., and Wu, B. (2011). Assessing the soil erosion control service of ecosystems change in the Loess Plateau of China. Ecol. Complex. 8, 284–293. doi: 10.1016/j.ecocom.2011.07.003
Gundersen, P., Christiansen, J. R., Alberti, G., Brüggemann, N., Castaldi, S., Gasche, R., et al. (2012). The response of methane and nitrous oxide fluxes to forest change in Europe. Biogeosciences 9, 3999–4012. doi: 10.5194/bg-9-3999-2012
Hu, H. W., Chen, D., and He, J. Z. (2015). Microbial regulation of terrestrial nitrous oxide formation: understanding the biological pathways for prediction of emission rates. FEMS Microbiol. Rev. 39, 729–749. doi: 10.1093/femsre/fuv021
Hu, S., Li, Y. J., Wang, W. Z., Jiao, J. Y., Kou, M., Yin, Q. L., et al. (2017). The antioxidation-related functional structure of plant communities: understanding antioxidation at the plant community level. Ecol. Indic. 78, 98–107. doi: 10.1016/j.ecolind.2017.03.007
Hu, Y., Xiang, D., Veresoglou, S. D., Chen, F., Chen, Y., Hao, Z., et al. (2014). Soil organic carbon and soil structure are driving microbial abundance and community composition across the arid and semi-arid grasslands in northern China. Soil Biol. Biochem. 77, 51–57. doi: 10.1016/j.soilbio.2014.06.014
Jiao, J. Y., Zhang, Z., Bai, W., Jia, Y., and Wang, N. (2012). Assessing the ecological success of restoration by afforestation on the Chinese Loess Plateau. Restor. Ecol. 20, 240–249. doi: 10.1111/j.1526-100X.2010.00756.x
Kong, A. Y. Y., Hristova, K., Scow, K. M., and Six, J. (2010). Impacts of different N management regimes on nitrifier and denitrifier communities and n cycling in soil microenvironments. Soil Biol. Biochem. 42, 1523–1533. doi: 10.1016/j.soilbio.2010.05.021
Kou, M., Garcia-Fayos, P., Hu, S., and Jiao, J. Y. (2016). The effect of Robinia pseudoacacia, afforestation on soil and vegetation properties in the loess plateau (China): a chronosequence approach. For. Ecol. Manag. 375, 146–158. doi: 10.1016/j.foreco.2016.05.025
Levy-Booth, D. J., Prescott, C. E., and Grayston, S. J. (2014). Microbial functional genes involved in nitrogen fixation, nitrification and denitrification in forest ecosystems. Soil Biol. Biochem. 75, 11–25. doi: 10.1016/j.soilbio.2014.03.021
Li, X. X., Sørensen, P., Olesen, J. E., and Petersen, S. O. (2016). Evidence for denitrification as main source of N2O emission from residue-amended soil. Soil Biol. Biochem. 92, 153–160. doi: 10.1016/j.soilbio.2015.10.008
Lin, Y. T., Whitman, W. B., Coleman, D. C., and Chiu, C. Y. (2012). Comparison of soil bacterial communities between coastal and inland forests in a subtropical area. Appl. Soil Ecol. 60, 49–55. doi: 10.1016/j.apsoil.2012.03.001
Liu, J., Yang, Z., Dang, P., Zhu, H., Gao, Y., Ha, V. N., et al. (2018). Response of soil microbial community dynamics to Robinia pseudoacacia L. afforestation in the Loess Plateau: a chronosequence approach. Plant Soil 423, 327–338. doi: 10.1007/s11104-017-3516-2
Lozano, Y. M., Hortal, S., Armas, C., and Pugnaire, F. I. (2014). Interactions among soil, plants, and microorganisms drive secondary succession in a dry environment. Soil Biol. Biochem. 78, 298–306. doi: 10.1016/j.soilbio.2014.08.007
Lu, H. X., Zhou, X. B., Zhang, J. B., and Cai, Z. C. (2011). Potential and gas products of denitrification in forest soils in Changbai Mountain. Acta Pedologica Sinica 48, 39–46.
Nadal-Romero, E., Cammeraat, E., Pérez-Cardiel, E., and Lasanta, T. (2016). Effects of secondary succession and afforestation practices on soil properties after cropland abandonment in humid mediterranean mountain areas. Agric. Ecosyst. Environ. 228, 91–100. doi: 10.1016/j.agee.2016.05.003
Németh, D. D., Wagner-Riddle, C., and Dunfield, K. E. (2014). Abundance and gene expression in nitrifier and denitrifier communities associated with a field scale spring thaw N2O flux event. Soil Biol. Biochem. 73, 1–9. doi: 10.1016/j.soilbio.2014.02.007
Philippot, L., Andert, J., Jones, C. M., Bru, D., and Hallin, S. (2011). Importance of denitrifiers lacking the genes encoding the nitrous oxide reductase for N2O emissions from soil. Glob. Change Biol. 17, 1497–1504. doi: 10.1111/j.1365-2486.2010.02334.x
Philippot, L., Hallin, S., and Schloter, M. (2007). Ecology of denitrifying prokaryotes in agricultural soil. Adv. Agron. 96, 249–305. doi: 10.1016/S0065-2113(07)96003-4
Ravishankara, A. R., Daniel, J. S., and Portmann, R. W. (2009). Nitrous oxide (N2O): the dominant ozone-depleting substance emitted in the 21st century. Nature 326, 123–125. doi: 10.1126/science.1176985
Reay, D. S., Davidson, E. A., Smith, K. A., Smith, P., Melillo, J. M., Dentener, F., et al. (2012). Global agriculture and nitrous oxide emissions. Nat. Clim. Chang. 2, 410–416. doi: 10.1038/nclimate1458
Richardson, D., Felgate, H., Watmough, N., Thomson, A., and Baggs, E. (2009). Mitigating release of the potent greenhouse gas N2O from the nitrogen cycle-could enzymic regulation hold the key? Trends Biotechnol. 27, 388–397. doi: 10.1016/j.tibtech.2009.03.009
Schreiber, F., Wunderlin, P., Udert, K. M., and Wells, G. F. (2012). Nitric oxide and nitrous oxide turnover in natural and engineered microbial communities: biological pathways, chemical reactions, and novel technologies. Front. Microbiol. 3:372. doi: 10.3389/fmicb.2012.00372
Shaw, L. J., Nicol, G. W., Smith, Z., Fear, J., Prosser, J. I., and Baggs, E. M. (2006). Nitrosospira spp. can produce nitrous oxide via a nitrifier denitrification pathway. Environ. Microbiol. 8, 214–222. doi: 10.1111/j.1462-2920.2005.00882.x
Šimek, M., Jíšová, L., and Hopkins, D. W. (2002). What is the so-called optimum pH for denitrification in soil? Soil Biol. Biochem. 34, 1227–1234. doi: 10.1016/S0038-0717(02)00059-7
Singh, B. K., Bardgett, R. D., Smith, P., and Reay, D. S. (2010). Microorganisms and climate change: terrestrial feedbacks and mitigation options. Nat. Rev. Microbiol. 8, 779–790. doi: 10.1038/nrmicro2439
Singh, B. K., Millard, P., Whiteley, A. S., and Murrell, J. C. (2004). Unravelling rhizosphere-microbial interactions: opportunities and limitations. Trends Microbiol. 12, 386–393. doi: 10.1016/j.tim.2004.06.008
Smethurst, P. J. (2010). Forest fertilization: trends in knowledge and practice compared to agriculture. Plant Soil 335, 83–100. doi: 10.1007/s11104-010-0316-3
Smith, K. A., Ball, T., Conen, F., Dobbie, K. E., Massheder, J., and Rey, A. (2003). Exchange of greenhouse gases between soil and atmosphere: interactions of soil physical factors and biological processes. Eur. J. Soil Sci. 54, 779–791. doi: 10.1046/j.1351-0754.2003.0567.x
Suleiman, A. K., Manoeli, L., Boldo, J. T., Pereira, M. G., and Roesch, L. F. (2013). Shifts in soil bacterial community after eight years of land-use change. Syst. Appl. Microbiol. 36, 137–144. doi: 10.1016/j.syapm.2012.10.007
Sutton, M. A., Howard, C. M., Erisman, J. W., Billen, G., and Bleeker, A. (2011). The European Nitrogen Assessment: Sources, Effects and Policy Perspectives. Cambridge: Cambridge University Press, 612. doi: 10.1017/CBO9780511976988
Tang, Y., Zhang, X., Li, D., Wang, H., Chen, F., Fu, X., et al. (2016). Impacts of nitrogen and phosphorus additions on the abundance and community structure of ammonia oxidizers and denitrifying bacteria in chinese fir plantations. Soil Biol. Biochem. 103, 284–293. doi: 10.1016/j.soilbio.2016.09.001
Tatti, E., Goyer, C., Zebarth, B. J., Burton, D. L., Giovannetti, L., and Viti, C. (2013). Short-term effects of mineral and organic fertilizer on denitrifiers, nitrous oxide emissions and denitrification in long-term amended vineyard soils. Soil Sci. Soc. Am. J. 77, 113–122. doi: 10.2136/sssaj2012.0096
Tatti, E., Goyer, C., Zebarth, B. J., Wertz, S., Burton, D. L., Chantigny, M., et al. (2017). Over-winter dynamics of soil bacterial denitrifiers and nitrite ammonifiers influenced by crop residues with different carbon to nitrogen ratios. Appl. Soil Ecol. 110, 53–64. doi: 10.1016/j.apsoil.2016.10.014
Ventura, M., Canchaya, C., Tauch, A., Chandra, G., Fitzgerald, G. F., Chater, K. F., et al. (2007). Genomics of actinobacteria: tracing the evolutionary history of an ancient phylum. Microbiol. Mol. Biol. R. 71, 495–548. doi: 10.1128/MMBR.00005-07
Wrage, N., Velthof, G. L., Van-Beusichem, M. L., and Oenema, O. (2001). Role of nitrifier denitrification in the production of nitrous oxide. Soil Biol. Biochem. 33, 1723–1732. doi: 10.1016/S0038-0717(01)00096-7
Xiong, Z. Q., Guo, L. D., Zhang, Q. F., Liu, G. H., and Liu, W. A. (2017). Edaphic Conditions Regulate Denitrification Directly and Indirectly by Altering Denitrifier Abundance in Wetlands along the Han River. China. Environ. Sci. Technol. 51, 5483–5491. doi: 10.1021/acs.est.6b06521
Zhang, C., Liu, G., Xue, S., and Wang, G. (2016). Soil bacterial community dynamics reflect changes in plant community and soil properties during the secondary succession of abandoned farmland in the Loess Plateau. Soil Biol. Biochem. 97, 40–49. doi: 10.1016/j.soilbio.2016.02.013
Zhang, Y., Ji, G., and Wang, R. (2016). Drivers of nitrous oxide accumulation in denitrification biofilters with low carbon:nitrogen ratios. Water Res. 106, 79–85. doi: 10.1016/j.watres.2016.09.046
Keywords: denitrification, nitrous oxide, high-throughput sequencing, afforestation restoration, denitrifying bacteria, farmland abandonment, Loess Plateau
Citation: Deng N, Wang H, Hu S and Jiao J (2019) Effects of Afforestation Restoration on Soil Potential N2O Emission and Denitrifying Bacteria After Farmland Abandonment in the Chinese Loess Plateau. Front. Microbiol. 10:262. doi: 10.3389/fmicb.2019.00262
Received: 14 May 2018; Accepted: 31 January 2019;
Published: 19 February 2019.
Edited by:
Sasha C. Reed, United States Geological Survey, United StatesReviewed by:
Jinjun Kan, Stroud Water Research Center, United StatesColin Tucker, United States Geological Survey, United States
Copyright © 2019 Deng, Wang, Hu and Jiao. This is an open-access article distributed under the terms of the Creative Commons Attribution License (CC BY). The use, distribution or reproduction in other forums is permitted, provided the original author(s) and the copyright owner(s) are credited and that the original publication in this journal is cited, in accordance with accepted academic practice. No use, distribution or reproduction is permitted which does not comply with these terms.
*Correspondence: Honglei Wang, d2FuZ2hvbmdsZWlAbndzdWFmLmVkdS5jbg==; d2FuZ2hvbmdsZWlAcGt1LmVkdS5jbg== Juying Jiao, anlqaWFvQG1zLmlzd2MuYWMuY24=