
94% of researchers rate our articles as excellent or good
Learn more about the work of our research integrity team to safeguard the quality of each article we publish.
Find out more
ORIGINAL RESEARCH article
Front. Microbiol. , 06 November 2018
Sec. Fungi and Their Interactions
Volume 9 - 2018 | https://doi.org/10.3389/fmicb.2018.02623
 Ken Miyazawa1
 Akira Yoshimi2
 Shin Kasahara3
 Asumi Sugahara1
 Ami Koizumi1
 Shigekazu Yano4
 Satoshi Kimura5,6
 Tadahisa Iwata5
 Motoaki Sano7
 Keietsu Abe1,2,8*
α-1,3-Glucan is one of the main polysaccharides in the cell wall of filamentous fungi. Aspergillus nidulans has two α-1,3-glucan synthase genes, agsA and agsB. We previously revealed that AgsB is a major α-1,3-glucan synthase in vegetative hyphae, but the function of AgsA remained unknown because of its low expression level and lack of phenotypic alteration upon gene disruption. To clarify the role of α-1,3-glucan in hyphal aggregation, we constructed strains overexpressing agsA (agsAOE) or agsB (agsBOE), in which the other α-1,3-glucan synthase gene was disrupted. In liquid culture, the wild-type and agsBOE strains formed tightly aggregated hyphal pellets, whereas agsAOE hyphae aggregated weakly. We analyzed the chemical properties of cell wall α-1,3-glucan from the agsAOE and agsBOE strains. The peak molecular mass of α-1,3-glucan from the agsAOE strain (1,480 ± 80 kDa) was much larger than that from the wild type (147 ± 52 kDa) and agsBOE (372 ± 47 kDa); however, the peak molecular mass of repeating subunits in α-1,3-glucan was almost the same (after Smith degradation: agsAOE, 41.6 ± 5.8 kDa; agsBOE, 38.3 ± 3.0 kDa). We also analyzed localization of α-1,3-glucan in the cell wall of the two strains by fluorescent labeling with α-1,3-glucan-binding domain–fused GFP (AGBD-GFP). α-1,3-Glucan of the agsBOE cells was clearly located in the outermost layer, whereas weak labeling was detected in the agsAOE cells. However, the agsAOE cells treated with β-1,3-glucanase were clearly labeled with AGBD-GFP. These observations suggest that β-1,3-glucan covered most of α-1,3-glucan synthesized by AgsA, although a small amount of α-1,3-glucan was still present in the outer layer. We also constructed a strain with disruption of the amyG gene, which encodes an intracellular α-amylase that synthesizes α-1,4-glucooligosaccharide as a primer for α-1,3-glucan biosynthesis. In this strain, the hyphal pellets and peak molecular mass of α-1,3-glucan (94.5 ± 1.4 kDa) were smaller than in the wild-type strain, and α-1,3-glucan was still labeled with AGBD-GFP in the outermost layer. Overall, these results suggest that hyphal pellet formation depends on the molecular mass and spatial localization of α-1,3-glucan as well as the amount of α-1,3-glucan in the cell wall of A. nidulans.
The fungal cell wall, which is composed mainly of polysaccharides, defines cell shape and shields cells from environmental stresses (Latgé, 2010; Yoshimi et al., 2016). In filamentous fungi, several polysaccharide components (α-glucans, β-glucans, galactomannan, and chitin) are needed for proper cell wall architecture. Some filamentous fungi secrete extracellular matrix, which also includes polysaccharides such as galactosaminogalactan (Lee and Sheppard, 2016; Yoshimi et al., 2016).
Cell wall polysaccharides of the pathogenic filamentous fungus Aspergillus fumigatus have been fractionated into alkali-soluble (AS) and alkali-insoluble (AI) fractions (Fontaine et al., 2000). The AS fraction contains mainly α-1,3-glucan with interconnecting α-1,4-linkage, and some galactomannan (Bernard and Latgé, 2001; Latgé, 2010), and the AI fraction is composed of chitin, β-1,6-branched β-1,3-glucan, and galactomannan (Fontaine et al., 2000; Bernard and Latgé, 2001). The alkali solubility method has been applied to fractionate cell wall components of the model filamentous fungus A. nidulans (Yoshimi et al., 2013, 2015) and industrial fungus A. oryzae (Miyazawa et al., 2016; Zhang et al., 2017b); the components of polysaccharides in both fractions derived from the two fungi are similar to those derived from A. fumigatus (Fontaine et al., 2000; Bernard and Latgé, 2001).
The role of α-1,3-glucan in pathogenesis and hyphal adhesion has been reported in A. fumigatus, A. nidulans, and A. oryzae (Beauvais et al., 2005, 2013; Maubon et al., 2006; Fontaine et al., 2010; Henry et al., 2012; Yoshimi et al., 2013; Miyazawa et al., 2016; Zhang et al., 2017b). In A. fumigatus and the pathogenic dimorphic yeast Histoplasma capsulatum, pathogen-associated molecular patterns (β-1,3-glucan and chitin) are covered by α-1,3-glucan, which prevents fungal cell recognition by host cells and promotes infection (Rappleye et al., 2004, 2007; Beauvais et al., 2013). In the rice blast fungus Magnaporthe grisea, α-1,3-glucan masks β-1,3-glucan and chitin and protects the fungal cell wall from digestive enzymes produced by plant cells during infection. Therefore, α-1,3-glucan acts in this fungus as a stealth factor that prevents recognition by the host (Fujikawa et al., 2009, 2012). β-1,3-Glucan and chitin are essential for maintaining cell wall integrity (Muszkieta et al., 2014; Dichtl et al., 2015). In A. fumigatus, a mutation in the only β-1,3-glucan synthase gene fks1 drastically attenuates growth, and increases branching and cell lysis (Dichtl et al., 2015), which is similar to the phenotype of cells treated by caspofungin that is a β-1,3-glucan synthase inhibitor. The family 1 chitin synthase mutants ΔchsG and ΔchsA/C/B/G of A. fumigatus show reduced growth and altered mycelial morphotype (Muszkieta et al., 2014). In the family 2 chitin synthase mutant ΔcsmA/csmB/F/D of A. fumigatus, chitin content in the cell wall was almost unaffected, but the cell wall structure of the mycelia is disorganized (Muszkieta et al., 2014).
Aspergillus fumigatus has three α-1,3-glucan synthase genes (AGS1–3), and disruptants lacking single genes or all the three genes (Δags) have been constructed (Beauvais et al., 2005; Maubon et al., 2006). The Δags strain lacked α-1,3-glucan and was less pathogenic than the parental strain. α-1,3-Glucan of A. fumigatus has a role in the aggregation of germinating conidia (Fontaine et al., 2010). The industrial fungus A. niger has five α-1,3-glucan synthase genes (agsA–E), and the expression of agsA and agsE is up-regulated in the presence of cell wall stress–inducing compounds such as calcofluor white and caspofungin (Damveld et al., 2005). Among the three α-1,3-glucan synthase genes of A. oryzae (agsA–C), agsB (orthologous to A. nidulans agsB) acts as the main α-1,3-glucan synthase gene (Zhang et al., 2017b). The triple disruption strain lacks α-1,3-glucan in the cell wall and forms smaller hyphal pellets than the parental strain does in liquid culture (Miyazawa et al., 2016). The triple disruptant has greater biomass and enzyme productivity than the parental strain, suggesting that the use of α-1,3-glucan-deficient strains of filamentous fungi would have improved productivity in the fermentation industry (Miyazawa et al., 2016).
Chemical structure of cell wall α-1,3-glucan in fungi was previously analyzed in fission yeast Schizosaccharomyces pombe (Grün et al., 2005) and A. wentii (Choma et al., 2013). α-Glucan from S. pombe consists of two interconnected linear chains (subunits, <120 residues each) of 1,3-linked α-glucose and some 1,4-linked α-glucose residues at their reducing ends as spacers (Grün et al., 2005). Alkali-soluble glucan from the cell wall of A. wentii consists of 25 subunits (200 residues each) of α-1,3-glucan separated by a short spacer of 1,4-linked α-glucose residues (Choma et al., 2013).
Aspergillus nidulans has two α-1,3-glucan synthase genes, agsA and agsB. α-1,3-Glucan in vegetative hyphae is synthesized mainly by AgsB (Yoshimi et al., 2013; He et al., 2014). The disruption of the agsB gene leads to the loss of α-1,3-glucan; therefore, AgsB is required for α-1,3-glucan biosynthesis under normal growth conditions (Yoshimi et al., 2013). In liquid culture, the agsB disruptant has fully dispersed hyphae, whereas the wild-type strain forms hyphal pellets (Yoshimi et al., 2013), suggesting that α-1,3-glucan is a hyphal aggregation factor. The agsA gene seems to be related to conidiation (He et al., 2014). However, the details of the agsA function and the chemical structure of polysaccharides synthesized by AgsA and AgsB remain unclear. In A. nidulans, the intracellular α-amylase amyG is crucial for α-1,3-glucan synthesis, whereas overexpression of the GPI-anchored α-amylase amyD decreases the amount of cell wall α-1,3-glucan (He et al., 2014). In the present study, we constructed the agsAOE or agsBOE strains, which overexpressed either agsA or agsB under the control of a constitutive promoter in the genetic background of agsB or agsA disruptants, respectively. The alkali-soluble glucan in the cell wall of these strains is composed of polysaccharides synthesized only by either AgsA or AgsB. In liquid culture, the abnormal hyphal dispersion of the agsB disruption strain was restored in the agsAOE strain, which formed hyphal pellets, suggesting that AgsA produces adhesive polysaccharides. The phenotypes of the hyphal pellets were obviously different between the agsAOE and agsBOE strains. We hypothesized that this difference is attributable to the difference in the chemical structure and/or the spatial localization in the cell wall of polysaccharides synthesized by AgsA or AgsB. In this study, we analyzed the chemical structure and localization of α-1,3-glucan in the agsAOE and agsBOE strains.
Strains are listed in Supplementary Table S1. Czapek–Dox (CD) medium was used for standard culture (Fujioka et al., 2007). To fulfill the auxotrophic requirements of A. nidulans, 200 μg/mL arginine, 0.02 μg/mL biotin, 0.5 μg/mL pyridoxine, 1.22 mg/mL uridine, and 1.12 mg/mL of uracil were added to the CD medium. For harvesting conidia and formation of fruiting body on plates, CD medium was supplemented with 1% glucose and 1.5% agar. To determine growth characteristics in liquid culture and analyze cell wall components, CD liquid medium was supplemented with 2% glucose.
The sequences of all primers are listed in Supplementary Table S2. The fusions were performed with an In-Fusion HD Cloning Kit (Clontech Laboratories, Inc., Mountain View, CA, United States) according to the manufacturer’s instructions.
The agsA gene was disrupted by using the Cre/loxP marker recycling system (Zhang et al., 2017a). To disrupt the agsA gene, the plasmids pAP-cre and pA-agsALR were first constructed (Supplementary Figures S1A,B). For pAP-cre construction (Supplementary Figure S1A), a fragment containing the lox71, xynG2 promoter (PxynG2) and Cre (amplicon 1) was amplified from the plasmid pAAG-cre (Zhang et al., 2017a). The pyrG marker (amplicon 2) was amplified from A. oryzae genomic DNA. The two amplicons and BamHI-digested pUC19 vector were fused by using an In-Fusion HD Cloning Kit (Clontech Laboratories, Inc., Mountain View, CA, United States) according to the manufacturer’s instructions. For pA-agsALR construction (Supplementary Figure S1B), the 5′ non-coding region (amplicon 3) and the coding region (amplicon 4) of the agsA gene were amplified from A. nidulans ABPU1 genomic DNA. The two amplicons and BamHI-digested pUC19 vector were fused. PCR amplification was then performed with primers ANagsALR-F and ANagsALR-R from pA-agsALR as a template; the resulting fragment was fused to the fragment containing PxynG2, pyrG marker gene, and loxP, which was obtained by digesting pAP-cre with NotI (Supplementary Figure S1C). The resulting plasmid was digested with EcoRI and transformed into the ABPU1 (ΔligD) and ΔagsB (ΔligD) strains (Supplementary Figure S1D). Candidate strains were selected on CD medium without uridine and uracil and then cultured on CD medium with uridine and uracil containing 1% xylose to induce Cre expression. Strains that required uridine and uracil were isolated by culture on CD plates with or without uridine and uracil. Replacement of the agsA gene was confirmed by PCR (Supplementary Figure S1E).
In the agsAOE and agsBOE strains, native promoters were replaced by the constitutive tef1 promoter. The sequences of primers used are listed in Supplementary Table S2. For generation of the agsAOE strain, the pAPyT-agsA plasmid was constructed (Supplementary Figure S2A). The 5′ non-coding region (amplicon 1) and the coding region (amplicon 2) of the agsA gene were amplified from A. nidulans ABPU1 genomic DNA. The pyroA marker (amplicon 3) was amplified from the pUCpyroA plasmid (Yoshimi et al., 2013). The tef1 promoter (amplicon 4) was amplified from A. nidulans genomic DNA. The four amplicons and BamHI-digested pUC19 vector were fused. The resulting plasmid was digested with NotI and transformed into the ΔagsB strain (Figure 1A).
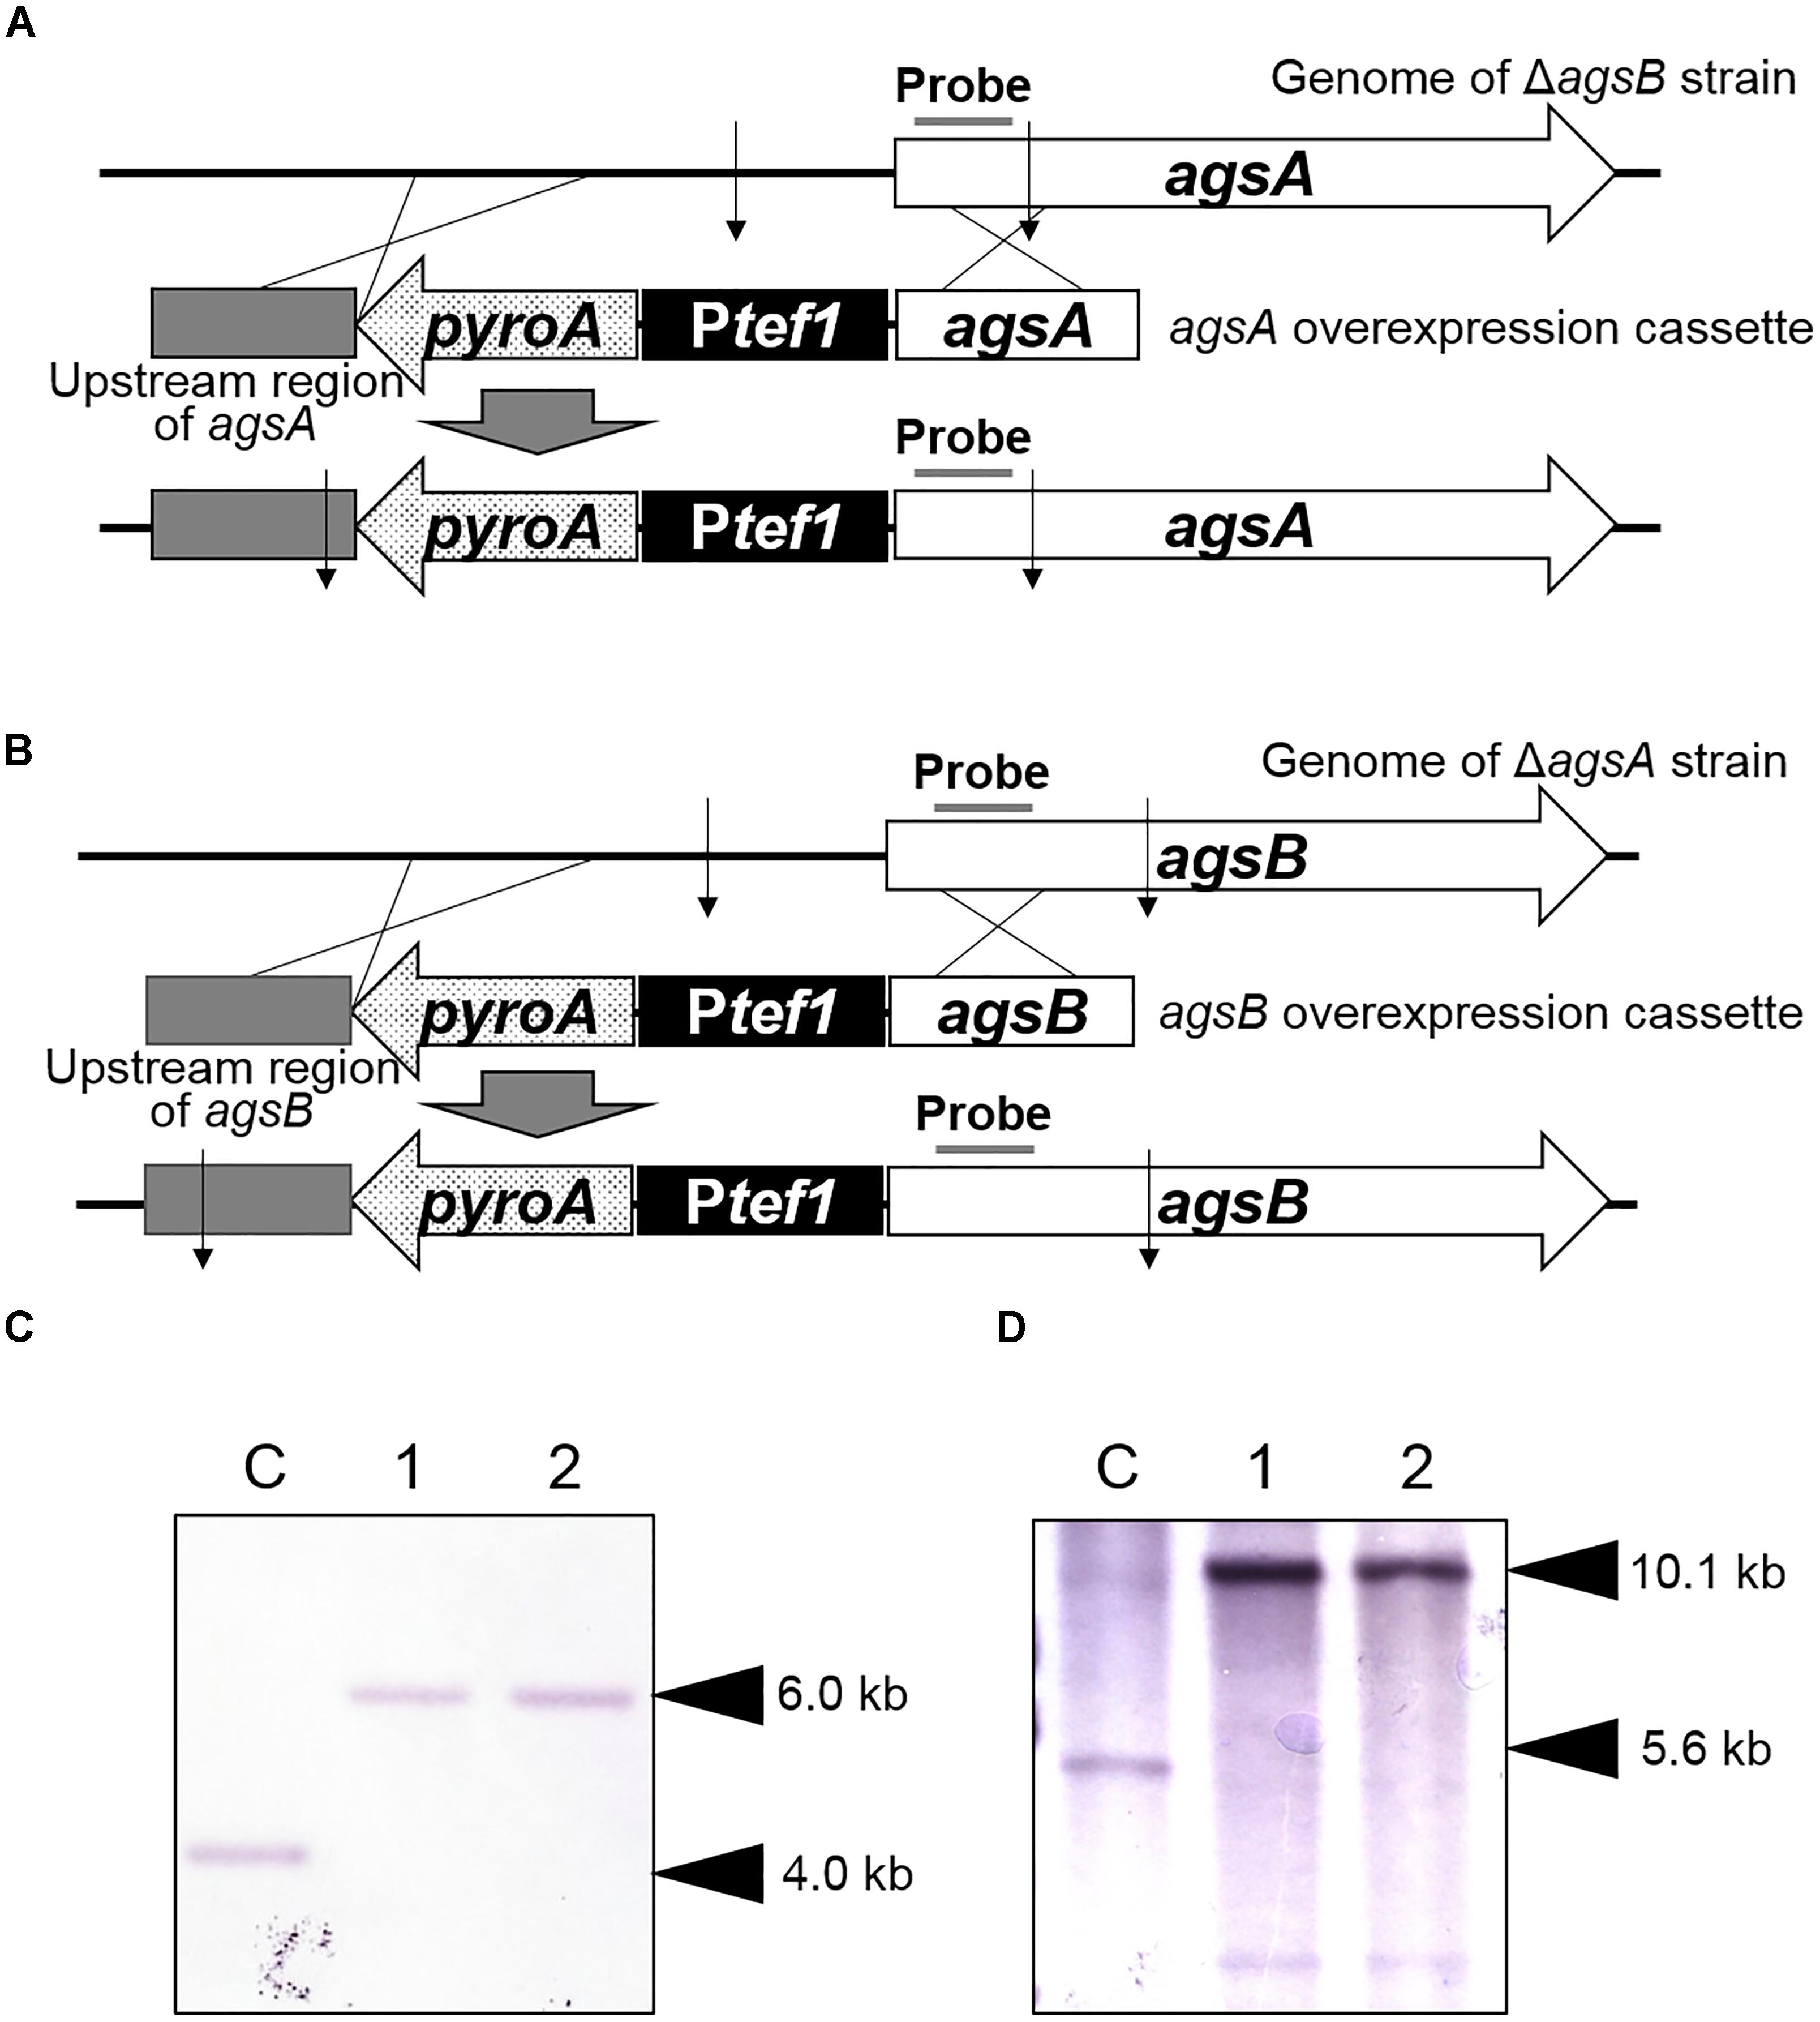
FIGURE 1. Construction of agsAOE and agsBOE strains of Aspergillus nidulans. (A) The agsA-overexpressing strain. Thin arrows indicate EcoRI digestion sites. (B) The agsB overexpressing strain. Thin arrows indicate SphI digestion sites. (C) Southern blot analysis of the agsA locus with the probe indicated in (A). Chromosomal DNA of the ΔagsB strain (lane C) and two agsAOE strains (lanes 1 and 2) was digested with EcoRI. (D) Southern blot analysis of the agsB locus with the probe indicated in (B). Chromosomal DNA of the ΔagsA strain (lane C) and two agsBOE strains (lanes 1 and 2) was digested with SphI.
For generation of the agsBOE strain, the pAPyT-agsB plasmid was constructed (Supplementary Figure S2B). The 5′ non-coding region (amplicon 1) and the coding region (amplicon 2) of the agsB gene were amplified from the A. nidulans ABPU1 genomic DNA template. The pyroA marker (amplicon 3) and tef1 promoter (amplicon 4) were amplified as above. The four amplicons and BamHI-digested pUC19 vector were fused. The resulting plasmid was digested with NotI and transformed into the ΔagsA strain (Figure 1B). The agsA- and agsB-overexpressing strains were isolated on the basis of pyroA nutrient requirement. Correct integration of each cassette was confirmed by Southern blot analysis. Genomic DNA of the ΔagsB and agsAOE strains was digested with EcoRI and that of the ΔagsA and agsBOE strains was digested with SphI. Fragments were separated on agarose gels and transferred onto membranes, which were then hybridized with digoxigenin (DIG)-labeled specific probes (Figure 1A). As expected, the probe for agsA (Figure 1A) bound to a 4.0-kb fragment (ΔagsB strain) and a 6.0-kb fragment (agsAOE strain; Figure 1C), and the probe for agsA (Figure 1B) bound to a 5.6-kb fragment (ΔagsA strain) and a 10.1-kb fragment (agsBOE strain; Figure 1D).
Strains that required arginine were complemented by transforming them with BamHI-digested pA-AoargB. This plasmid was constructed as follows (Supplementary Figure S3A). The 5′ (amplicon 1) and 3′ non-coding (amplicon 2) regions of the argB gene of A. nidulans were amplified from A. nidulans ABPU1 genomic DNA. The A. oryzae argB marker (amplicon 3) was amplified from A. oryzae genomic DNA. The three amplicons and BamHI-digested pUC19 vector were fused. The resulting plasmid (pA-AoargB) was digested with NotI and transformed into arginine-requiring strains (Supplementary Figure S3B). Replacement of the A. oryzae argB marker was confirmed by PCR (Supplementary Figure S3C).
All strains with disrupted ligD were complemented with the ligD gene by transforming them with NotI-digested pAP-CligD. This plasmid was constructed as follows (Supplementary Figure S4A). The 5′ (amplicon 1) and 3′ non-coding (amplicon 2) regions of the amdS gene were amplified from A. nidulans ABPU1 genomic DNA. The pyrG marker (amplicon 3) was amplified from A. oryzae genomic DNA. The full-length ligD gene (amplicon 4), including its promoter and terminator regions, was amplified from A. nidulans ABPU1 genomic DNA. The four amplicons and BamHI-digested pUC19 vector were fused. The resulting plasmid (pAP-CligD) was digested with NotI and transformed into the ligD-disrupted strains (Supplementary Figure S4B). Replacement of the ligD gene was confirmed by PCR (Supplementary Figure S4C).
The strains were generated by fusing the EGFP gene to the 3′ end of the agsA or agsB promoter region (Supplementary Figure S5A). For generation of the agsA promoter–GFP reporter strain, the pUC/AoargB-PagsA-EGFP plasmid was constructed (Supplementary Figure S5). The argB marker gene from A. oryzae (amplicon 1) was amplified from A. oryzae genomic DNA. The 5′ non-coding region of agsA (amplicon 2) was amplified from A. nidulans ABPU1 genomic DNA, and EGFP-TagdA (amplicon 3) from pNA(N)EGFP (Furukawa et al., 2007). The three amplicons and BamHI-digested pUC19 vector were fused. The resulting plasmid was transformed into the ABPU1 strain.
For generation of the agsB promoter–GFP reporter strain, the pUC/AoargB-PagsB-EGFP plasmid was constructed (Supplementary Table S1). The amplicons 1 and 3 were the same as for the construction of pUC/AoargB-PagsA–EGFP. The 5′ non-coding region of the agsB gene (amplicon 2) was amplified from A. nidulans ABPU1 genomic DNA. The three amplicons and BamHI-digested pUC19 vector were fused. The resulting plasmid was transformed into the ABPU1 strain. Insertion of the cassettes was confirmed by PCR.
The first round of PCR amplified gene fragments containing the 5′ non-coding region (amplicon 1) and the coding region (amplicon 2) of amyG from ABPU1 genomic DNA, and the pyrG gene (amplicon 3) from A. oryzae genomic DNA (Supplementary Figure S6A). The three resulting PCR products were gel-purified and fused into a disruption cassette in the second round of PCR. The resulting PCR product was gel-purified and transformed into the ABPU1 (ΔligD) strain. Replacement of the amyG gene was confirmed by PCR (Supplementary Figure S6B).
Mycelial cells cultured in CD liquid medium for 24 h were collected, and total RNA was extracted from the cells by using Sepasol-RNA I (Nakalai Tesque, Kyoto, Japan) in accordance with the manufacturer’s instructions. The total RNA (2 μg) was reverse transcribed by using a High-Capacity cDNA Reverse Transcription Kit (Applied Biosystems Inc., Foster City, CA, United States). Quantitative PCR was performed with a Mini Opticon real-time PCR system (Bio-Rad Laboratories, Hercules, CA, United States) with SYBR Green detection. For reaction mixture preparation, KOD SYBR qPCR Mix (Toyobo Co., Ltd., Osaka, Japan) was used. Primers used for quantitative PCR are listed in Supplementary Table S2. An equivalent amount of cDNA, obtained from reverse transcription reactions using an equivalent amount of total RNA, was applied to each reaction mixture. The gene encoding histone H2B was used as a normalization reference (an internal control) for determining the target gene expression ratios.
Mycelia cultured for 24 h in CD medium were collected by filtering through Miracloth (Merck Millipore, Darmstadt, Germany), washed with water, and freeze-dried. The mycelia were then pulverized by using a MM400 bench-top mixer mill (Retsch, Haan, Germany), and the powder (1 g) was suspended in 40 mL of 0.1 M Na phosphate buffer (pH 7.0). Cell wall components were fractionated by hot-water and alkali treatments (Yoshimi et al., 2013). Briefly, fractionation resulted in hot-water-soluble (HW), AS, and AI fractions; the AS fraction was further separated into a fraction soluble in water at neutral pH (AS1) and an insoluble fraction (AS2). Monosaccharide composition of each fraction was quantified according to Yoshimi et al. (2013). Each fraction was crude, and contained polysaccharides and some other compounds. For instance, the AS2 fraction derived from the wild-type strain was consisted of approximately 35% (weight) of polysaccharides (mainly α-1,3-glucan), 40% of polar lipids (<Mw 1,000) saponified by alkaline, and 25% of unidentified compounds (Yamashita et al., unpublished results).
The ABPU1 (ΔligD) and amyG disruption strains were cultured for 16 h or 24 h in CD medium, and the mycelia were used for fractionation.
The AS2 fraction from each strain was treated with α-1,3-glucanase from Bacillus circulans KA-304 (Yano et al., 2006) and the amount of sugar liberated was quantified as the amount of glucose, as described by Yoshimi et al. (2013). Mutan (positive control) was enzymatically synthesized using α-1,3-glucanosyl transferase of Streptococcus mutans (Suyotha et al., 2013). Curdlan (β-1,3-glucan) from Agrobacterium spp. (Kirin Kyowa Food Co. Ltd., Tokyo, Japan) was used as a negative control.
The AS2 fraction of each strain (50 mg) was suspended in 1 mL of 1 M NaOH/D2O and dissolved by vortexing. Mutan enzymatically synthesized by the action of GTF-J from Streptococcus salivarius (Puanglek et al., 2016) was used as a standard molecule of α-1,3-glucan. One drop of DMSO-d6 (deuterated dimethyl sulfoxide) was then added to each fraction and the solutions were centrifuged (3,000 × g, 5 min). 13C NMR spectra of the supernatants were obtained using a JNM-ECX400P spectrometer (JEOL, Tokyo, Japan) at 400 MHz at 35°C. Chemical shifts were recorded relative to the resonance of DMSO-d6.
Methylation analysis was performed according to Ciucanu and Kerek (1984) with modifications. The AS2 fraction (3 mg) from each strain was suspended in 2 mL of 20 mg/mL NaOH in DMSO, 0.8 mL of iodomethane was added, and the mixture was stirred for 30 min at room temperature in a closed vial. Methylation was stopped by adding water (4 mL), and then chloroform (3 mL) was added. The contents of the vial were mixed, and the aqueous phase was removed. Then water (4 mL) was added to the mixture and the aqueous phase was removed; this procedure was repeated twice. Toluene (0.5 mL) was added to the chloroform phase; the mixture was dried down, resuspended in toluene (1 mL), and dried down again. The whole methylation procedure was then repeated.
90% (w/v) Formic acid (2 mL) was added to the dried methylated material; the solution was then incubated in boiling water for 3 h and dried down. Subsequently, 1 M trifluoroacetic acid (2 mL) was added to the dried material, and the sample was incubated in boiling water for 3 h and then dried down. The hydrolyzed sample was mixed with NaBH4 in water (33 mg/mL; 1 mL) and incubated for 16 h at room temperature. Methanol–acetic acid mixture (5 μL acetic acid in 1 mL of methanol) was added to the reduced sample, and the mixture was evaporated to dryness. Methanol–acetic acid was added again to the dried material and the mixture was dried down; this procedure was performed three times. Methanol (3 mL) was added to the dried material, and the mixture was dried down; this procedure was performed three times. Pyridine (0.6 mL) and acetic anhydride (0.6 mL) were added to the dried material, and the sample was incubated for 90 min at 90°C. Toluene (2 mL) was then added and the sample was dried down. Toluene (2 mL) was added again to the dried material and then dried down. The sample was mixed with chloroform (2 mL) and water (4 mL), and the aqueous phase was removed. Then water (4 mL) was mixed with the chloroform phase, and the aqueous phase was removed. Then toluene (0.5 mL) was added to the chloroform phase, and the mixture was dried down. Finally, the sample was mixed with chloroform (3 mL). Methylated sugars were analyzed using a gas chromatography system (GC-2010/GCMS-QP2010; Shimadzu, Kyoto, Japan) with an HP-5 column (Agilent Technologies, Inc., Santa Clara, CA, United States). Peaks were identified by comparison with information in the Shimadzu mass spectral libraries.
The average molecular mass of alkali-soluble polysaccharides was determined by high-performance size-exclusion chromatography (HPSEC). The HPSEC system consisted of an isocratic pump Dionex ICS-5000 (Dionex, Sunnyvale, CA, United States) and an FLC-10 refractive index detector (Shimamura Tech Inc., Tokyo, Japan) and was equipped with a Sugar KS-805 column (8.0 mm × 300 mm; Showa Denko Co. Ltd., Tokyo, Japan) and a Sugar KS-G 6B guard column (Showa Denko). The eluent was 1 M NaOH, and the flow rate was 1 mL/min for 25 min. The AS2 fraction (10 mg) was dissolved in 1 M NaOH. The detector was normalized with dextran standard (2,160, 1,400, 500, 110, 70, 40, 20, and 10 kDa). HY-PCR software (Shimamura Tech Inc.) was used for data analysis.
The sample (20 mg) was suspended in 0.1 M acetate buffer (pH 3.9; 10 mL) and sodium periodate was added (final conc. 30 mM). The mixture was incubated for 72 h at 4°C in the dark with stirring. Ethylene glycol (100 μL) was then added to remove excess sodium periodate. The sample was dialyzed against water, mixed with NaBH4 (30 mg), and incubated for 3 h at room temperature. The sample was neutralized with 10% (v/v) acetic acid and dialyzed against water. Trifluoroacetic acid was then added (final conc. 0.5 M) and the mixture was incubated for 24 h at room temperature. The sample was freeze-dried and then dissolved in 1 M NaOH for HPSEC analysis.
Mycelial cells were cultured at 37°C for 12 h in CD liquid medium. A drop of cells was placed on a glass slide and dried at 55°C for 15 min. The cells were washed twice with phosphate buffered saline (PBS), fixed with 4% (v/v) paraformaldehyde for 15 min, and then washed again as above. A drop of PBS containing 100 μg/mL α-1,3-glucan-binding domain–fused GFP (AGBD-GFP; DS1CB6SD2-GFP; Suyotha et al., 2013), 100 μg/mL monoclonal β-1,3-glucan-specific antibody (Biosupplies, Parkville, VIC, Australia), and 10 μg/mL wheat germ agglutinin Alexa Fluor 350 conjugate was added. The sample was incubated at room temperature for 3 h and then washed as above. A drop of PBS containing anti-mouse IgG antibody Alexa Fluor 594 conjugate (Invitrogen, Carlsbad, CA, United States) as a secondary antibody for β-1,3-glucan-specific antibody was added. The sample was incubated at room temperature for 1 h, washed as above, and imaged on a FluoView FV1000 confocal laser scanning microscope (Olympus, Tokyo, Japan). For enzymatic digestion of α-1,3-glucan, fixed cells were washed twice with 50 mM potassium phosphate buffer (pH 6.5), incubated in the same buffer containing 50 μg/mL α-1,3-glucanase from B. circulans KA-304 (Yano et al., 2006) for 6 h at 37°C, washed three times with PBS, and fluorescently labeled. For enzymatic digestion of β-1,3-glucan, fixed cells were washed twice with 50 mM sodium acetate buffer (pH 5.0), incubated in the same buffer containing 500 μg/mL β-1,3-glucanase from A. niger (Sigma, St. Louis, MO, United States) for 6 h at 55°C, washed three times with PBS, and fluorescently labeled.
To detect α-1,3-glucan in the cell wall of vegetative hyphae and fruiting body, cells were stained with AGBD-GFP. Cells (20 mg) of vegetative hyphae or fruiting body of the BPU1 strain (Hagiwara et al., 2007) were suspended in 50 mM potassium phosphate buffer (pH 6.5) containing 0.1 mg/mL AGBD-GFP and incubated at 30°C for 4 h with gentle shaking. The cells were washed twice with 50 mM potassium phosphate buffer (pH 6.5) and observed under an IX81 inverted fluorescence microscope (Olympus).
Student’s t-test was used for the comparison of paired samples, and Tukey’s test was used for the comparison of multiple samples.
We constructed the A. nidulans strains each overexpressing only one α-1,3-glucan synthase gene by introducing an agsA overexpression cassette into the ΔagsB strain and agsB cassette into the ΔagsA strain. In hyphal cells, the expression level of agsA was significantly higher in the agsAOE strain than in the wild-type and ΔagsB strains (P < 0.05; Figure 2A). The expression of agsB was higher in the agsBOE strain than in the wild-type and ΔagsA strains (P < 0.05; Figure 2B). The results of the quantitative PCR analysis also revealed that agsA in the agsBOE strain and agsB in the agsAOE strain were not expressed (data not shown). Thus, the expression of agsA or agsB was upregulated in the respective strains.
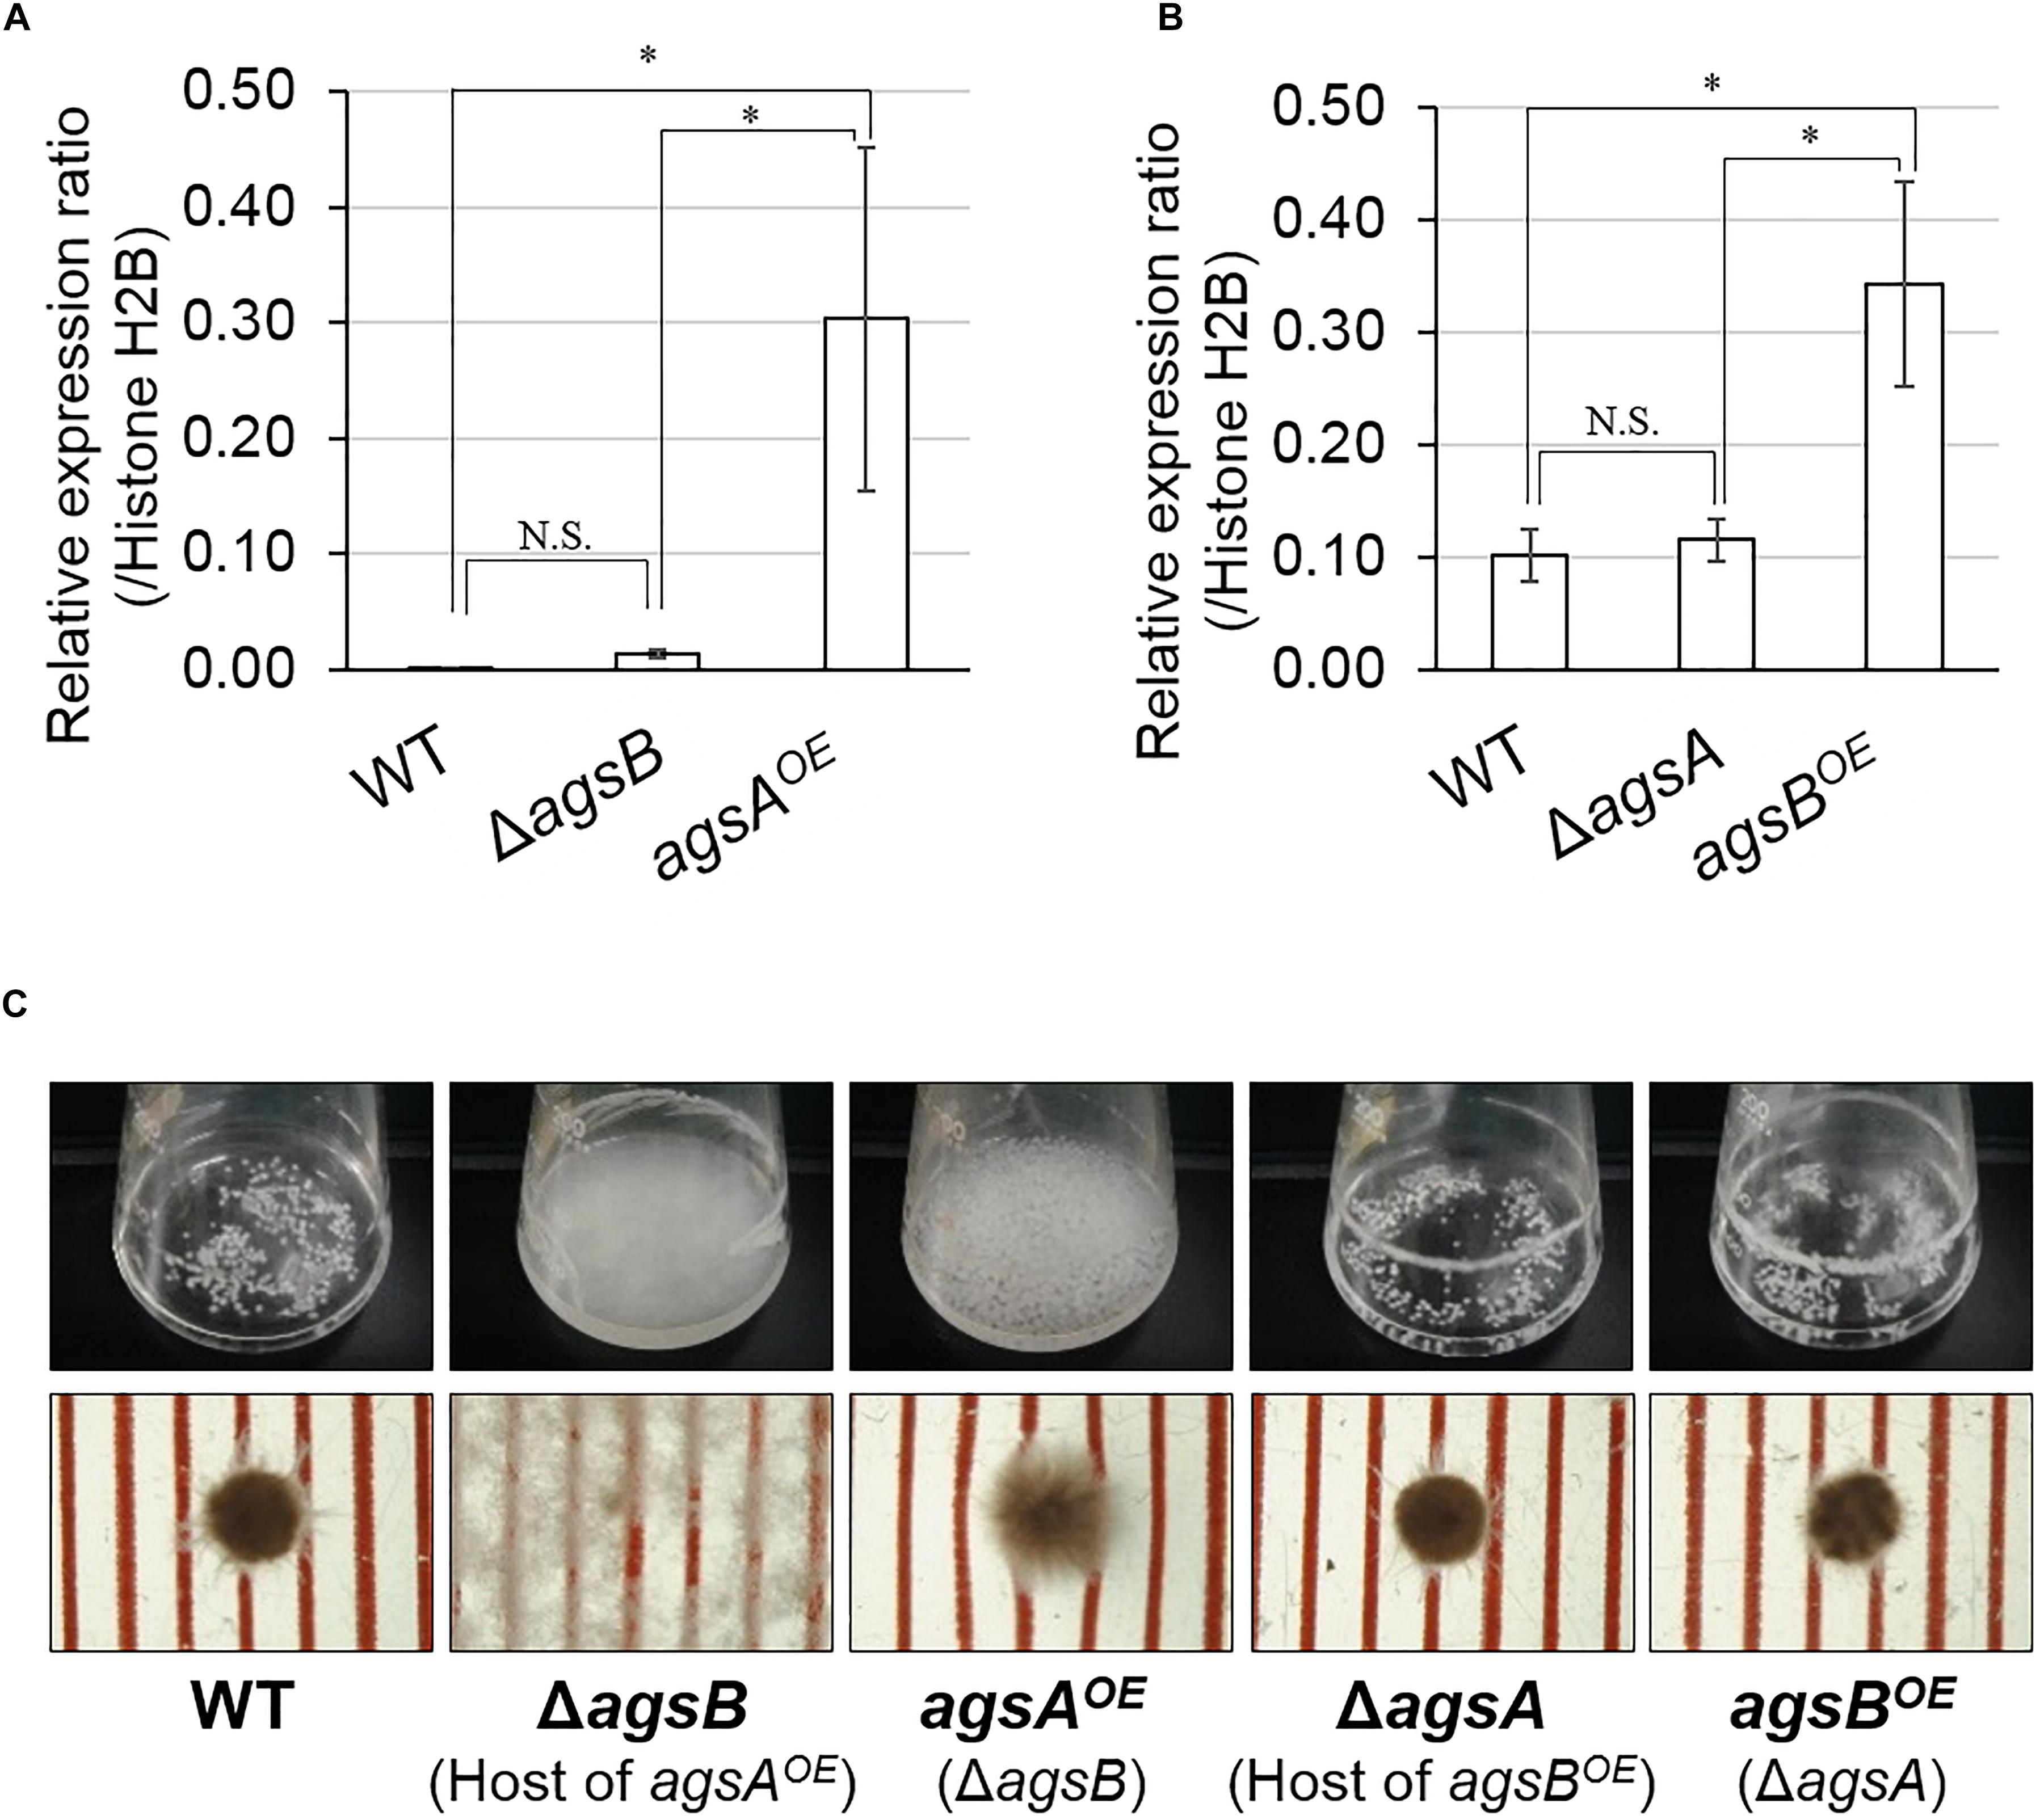
FIGURE 2. Characterization of the agsAOE and agsBOE strains in liquid culture. Conidia (final concentration, 5 × 10⁵/mL) of the wild-type, agsAOE, agsBOE, ΔagsA, and ΔagsB strains were inoculated into CD liquid medium and rotated at 160 rpm at 37°C for 24 h. (A,B) Transcript levels of the (A) agsA and (B) agsB genes were determined by quantitative PCR on total RNA using the gene-specific primers indicated in Supplementary Table S2. Error bars represent the standard deviation of the mean calculated from three replicates. Asterisks denote significant differences based on Tukey’s test (∗P < 0.05). (C) Growth of the wild-type, ΔagsB, agsAOE, ΔagsB, agsBOE strains. Upper row, photographs of cultures in Erlenmeyer flasks; lower row, representative hyphal pellets of each strain under a stereomicroscope. Scale intervals are 1 mm.
No distinguishable differences were observed in the colonial growth and conidiation of any of the strains grown on agar plates for 4 days (Supplementary Figure S7). In liquid culture, the hyphae of the wild-type and ΔagsA strains formed tightly aggregated pellets, whereas the ΔagsB strain showed dispersed hyphae (Figure 2C), in agreement with our previous results (Yoshimi et al., 2013). The phenotype of hyphal dispersion of the ΔagsB strain was restored in the agsAOE strain, but the hyphae of the agsAOE strain formed loosely aggregated pellets (Figure 2C). The hyphae of the agsBOE strain formed tightly aggregated pellets, similar to those of the wild type (Figure 2C). These results suggest that the phenotypic difference between the agsAOE and agsBOE strains might be attributable to the difference in polysaccharides synthesized by AgsA and AgsB.
To analyze cell wall components in the agsAOE and agsBOE strains, we fractionated the cell walls of both strains by hot-water and alkali treatments (Yoshimi et al., 2013). The HW fraction contained mainly glucose (Glc) with small amounts of galactose (Gal) and mannose (Man) (Supplementary Figure S8A). The amount of glucose in the HW fractions of the agsAOE and agsBOE strains was lower than in those of the wild-type strain (Supplementary Figure S8A). The AS1 fraction contained little sugar (Supplementary Figure S8B). AS2 was composed mainly of Glc with a small amount of Man, although AS2 of the ΔagsAΔagsB strain hardly contained any Glc (Figure 3A). The amount of Glc in the AS2 fraction from both the agsAOE (18.9% of total cell wall fractions) and agsBOE (18.2%) strains was about three times that of the wild type (6.6%). The AI fraction was composed of about 10% of glucosamine and Glc with 1–2% Gal and Man in each strain (Figure 3B). Taken together, these results show that the replacement of the native agsA or agsB promoter with the tef1 promoter increased the amount of alkali-soluble glucan in the cell wall of both the agsAOE and agsBOE strains.
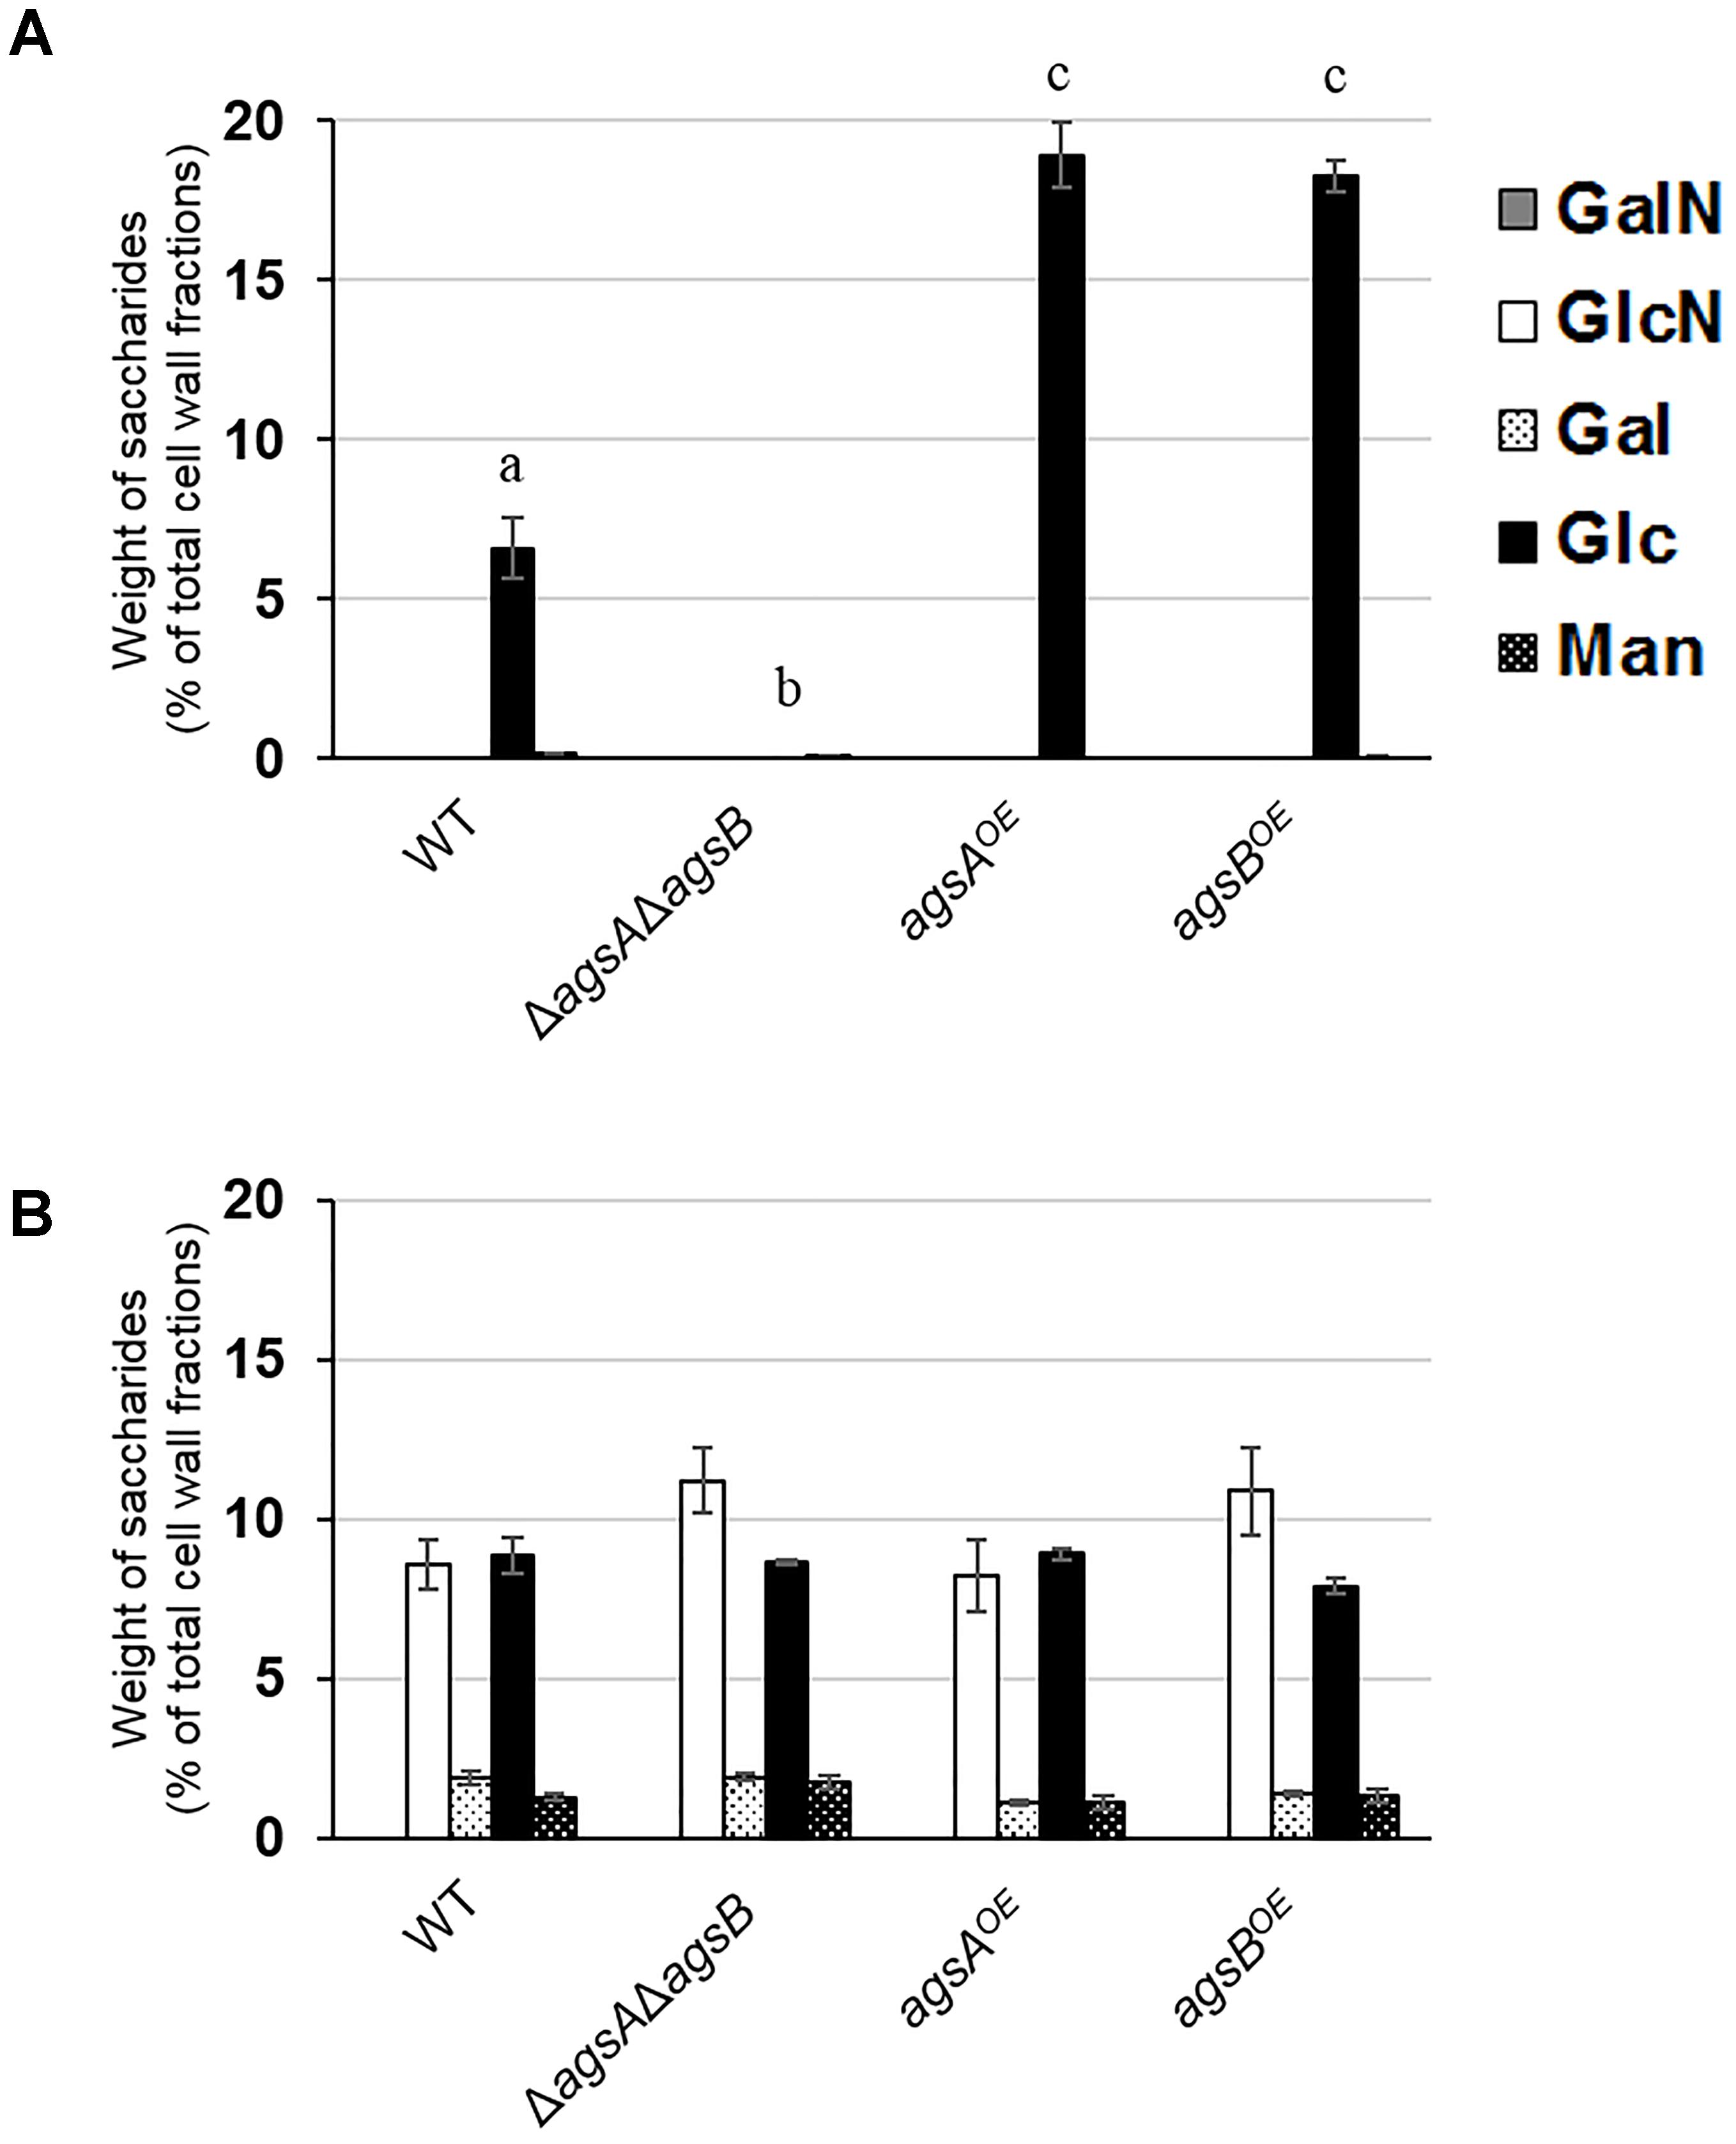
FIGURE 3. Monosaccharide composition of cell wall fractions from the wild-type (WT), ΔagsAΔagsB, agsAOE, and agsBOE strains. The strains were cultured in CD medium (160 rpm, 37°C, 24 h). (A) Alkali-soluble, insoluble in water at neutral pH fraction (AS2). (B) Alkali-insoluble (AI) fraction. Error bars represent the standard error of the mean calculated from three replicates. Different letters denote significant differences based on Tukey’s test (P < 0.05). GalN, galactosamine; GlcN, glucosamine; Gal, galactose; Glc, glucose; Man, mannose.
Our previous analyses showed that the AS2 fraction derived from wild-type A. nidulans contains mainly α-1,3-glucan (Yoshimi et al., 2013). To investigate the factor that caused the difference in hyphal aggregation between the agsAOE and agsBOE strains, we analyzed the polysaccharide composition of the AS2 fraction. Sugar liberated from the AS2 fraction by α-1,3-glucanase was detected in the wild-type strain and the positive control mutan but was scarce in the AS2 fraction from the ΔagsAΔagsB strain and the negative control curdlan (Figure 4). In the AS2 fractions from both the agsAOE and agsBOE strains, sugar was liberated similar to that from the wild-type strain and mutan (Figure 4).
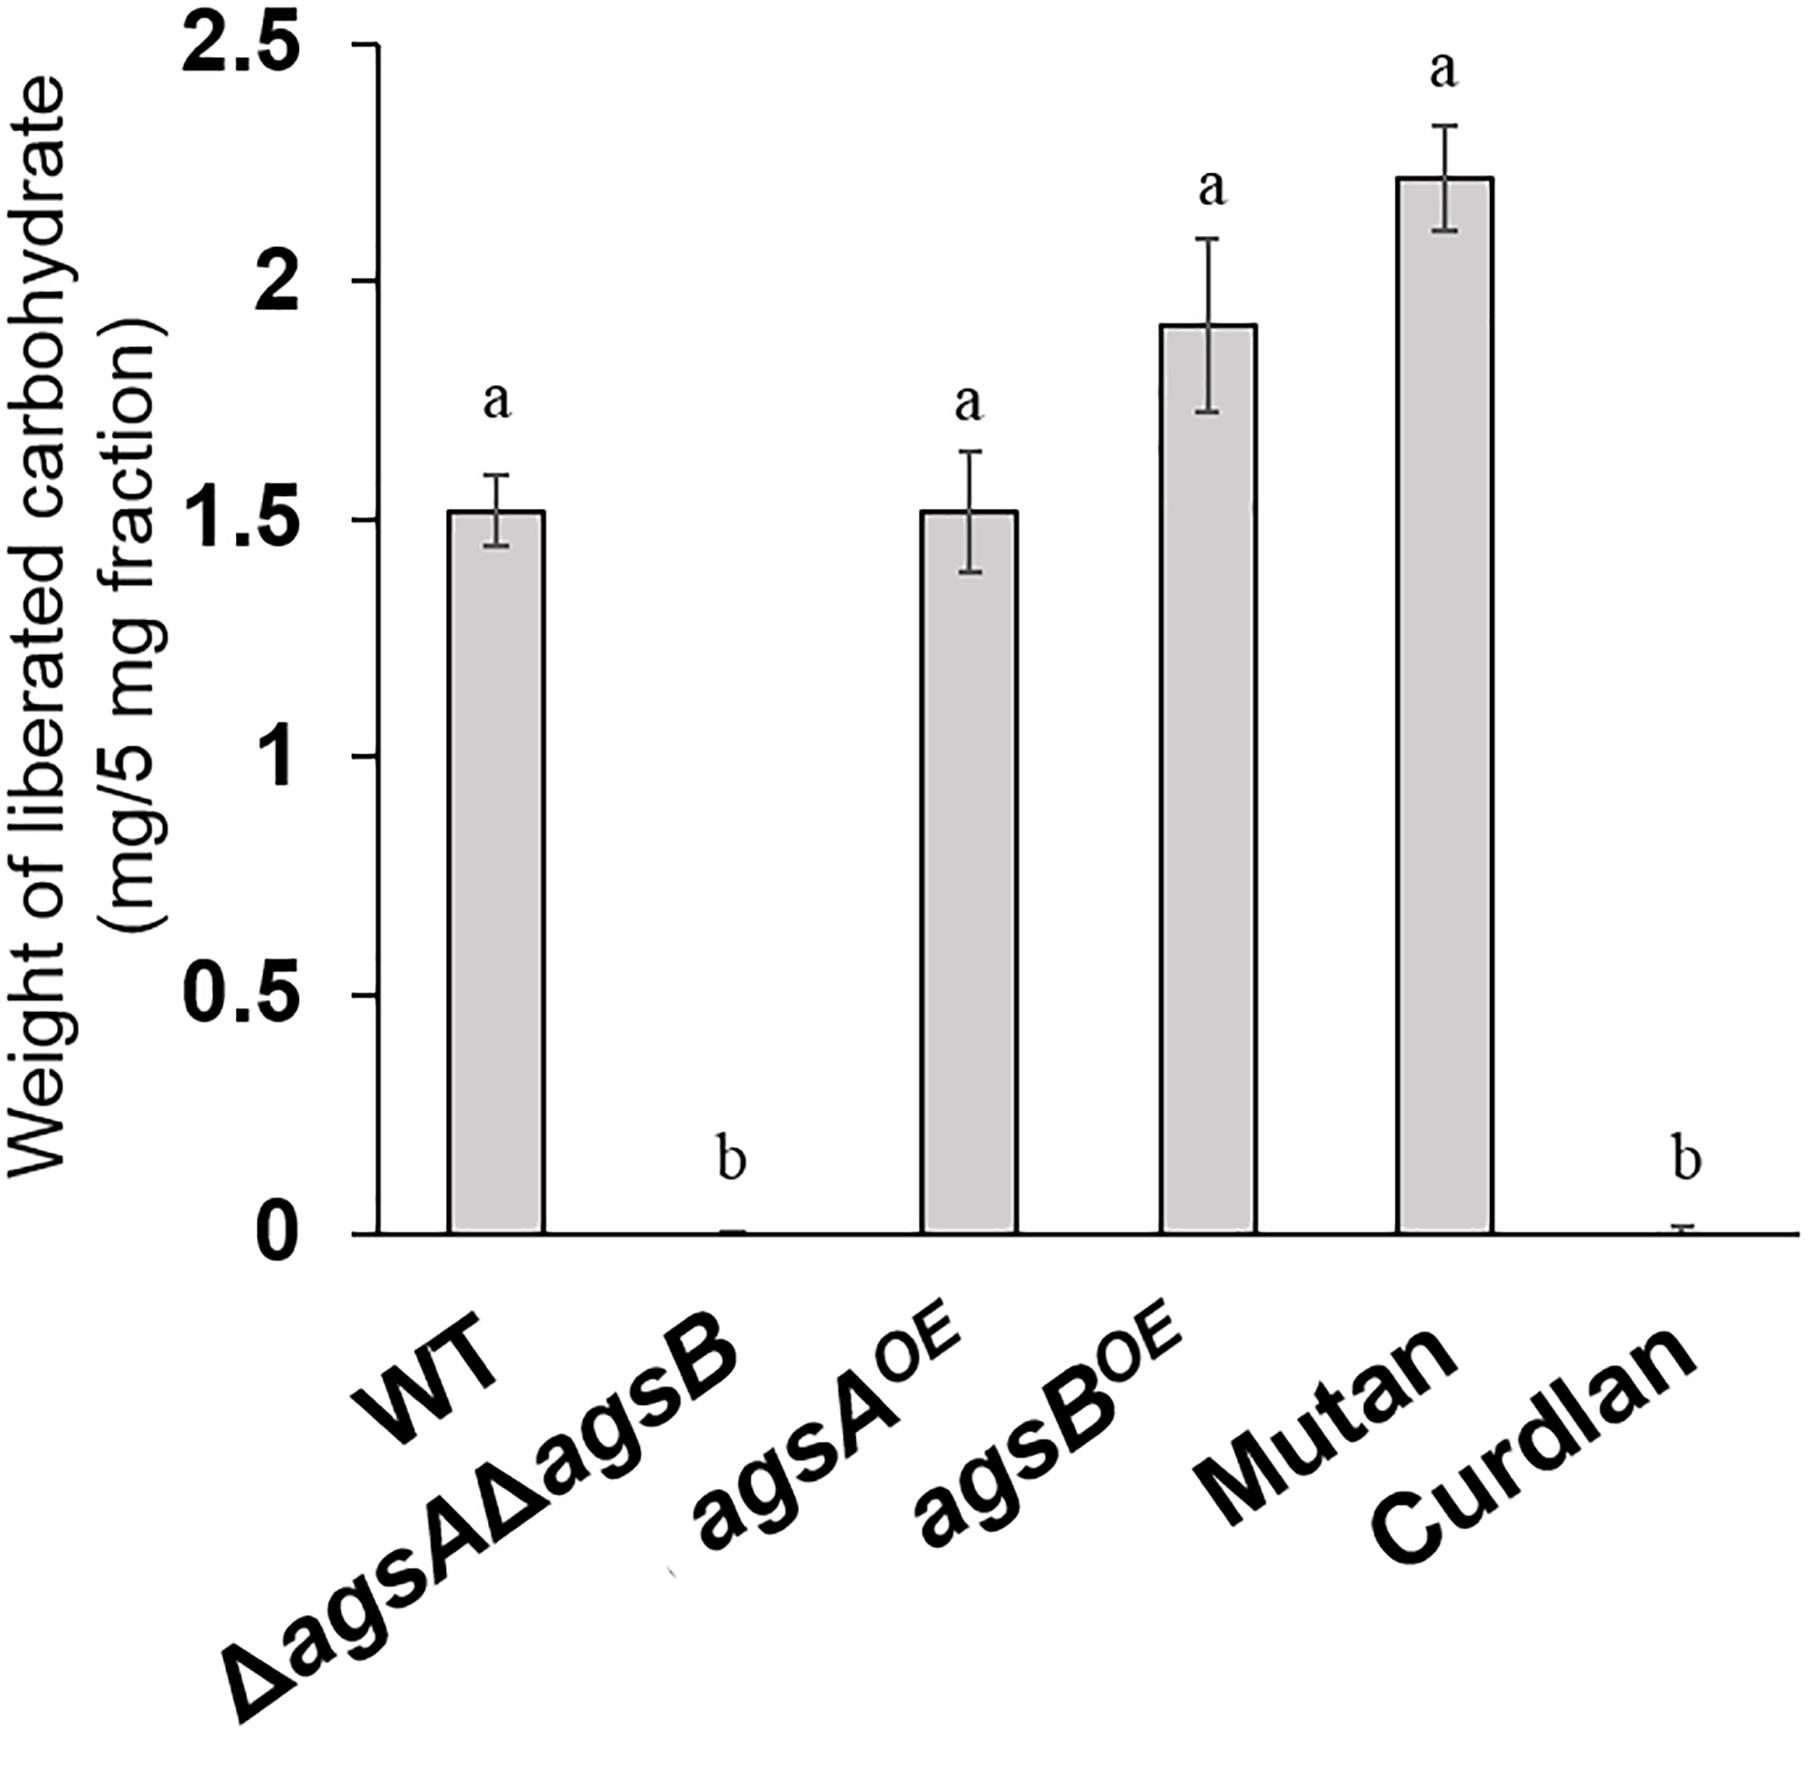
FIGURE 4. Saccharides liberated from the AS2 fractions after treatment with α-1,3-glucanase. The AS2 fractions derived from the wild-type, ΔagsAΔagsB, agsAOE, and agsBOE strains were treated with α-1,3-glucanase from Bacillus circulans KA-304. Liberated sugars were hydrolyzed and quantified as glucose by high-performance liquid chromatography. Error bars represent the standard error of the mean calculated from three replicates. Different letters denote significant differences based on Tukey’s test (P < 0.05).
In agreement with Yoshimi et al. (2013), 13C NMR spectroscopic analysis detected signals typical of α-1,3-glucan in the AS2 fraction from the wild-type strain and in mutan, which was enzymatically synthesized by GTF-J from S. salivarius (Figures 5A,D). The AS2 fractions from both the agsAOE and agsBOE strains also showed chemical shift signals similar to those of mutan (Figures 5B,C).
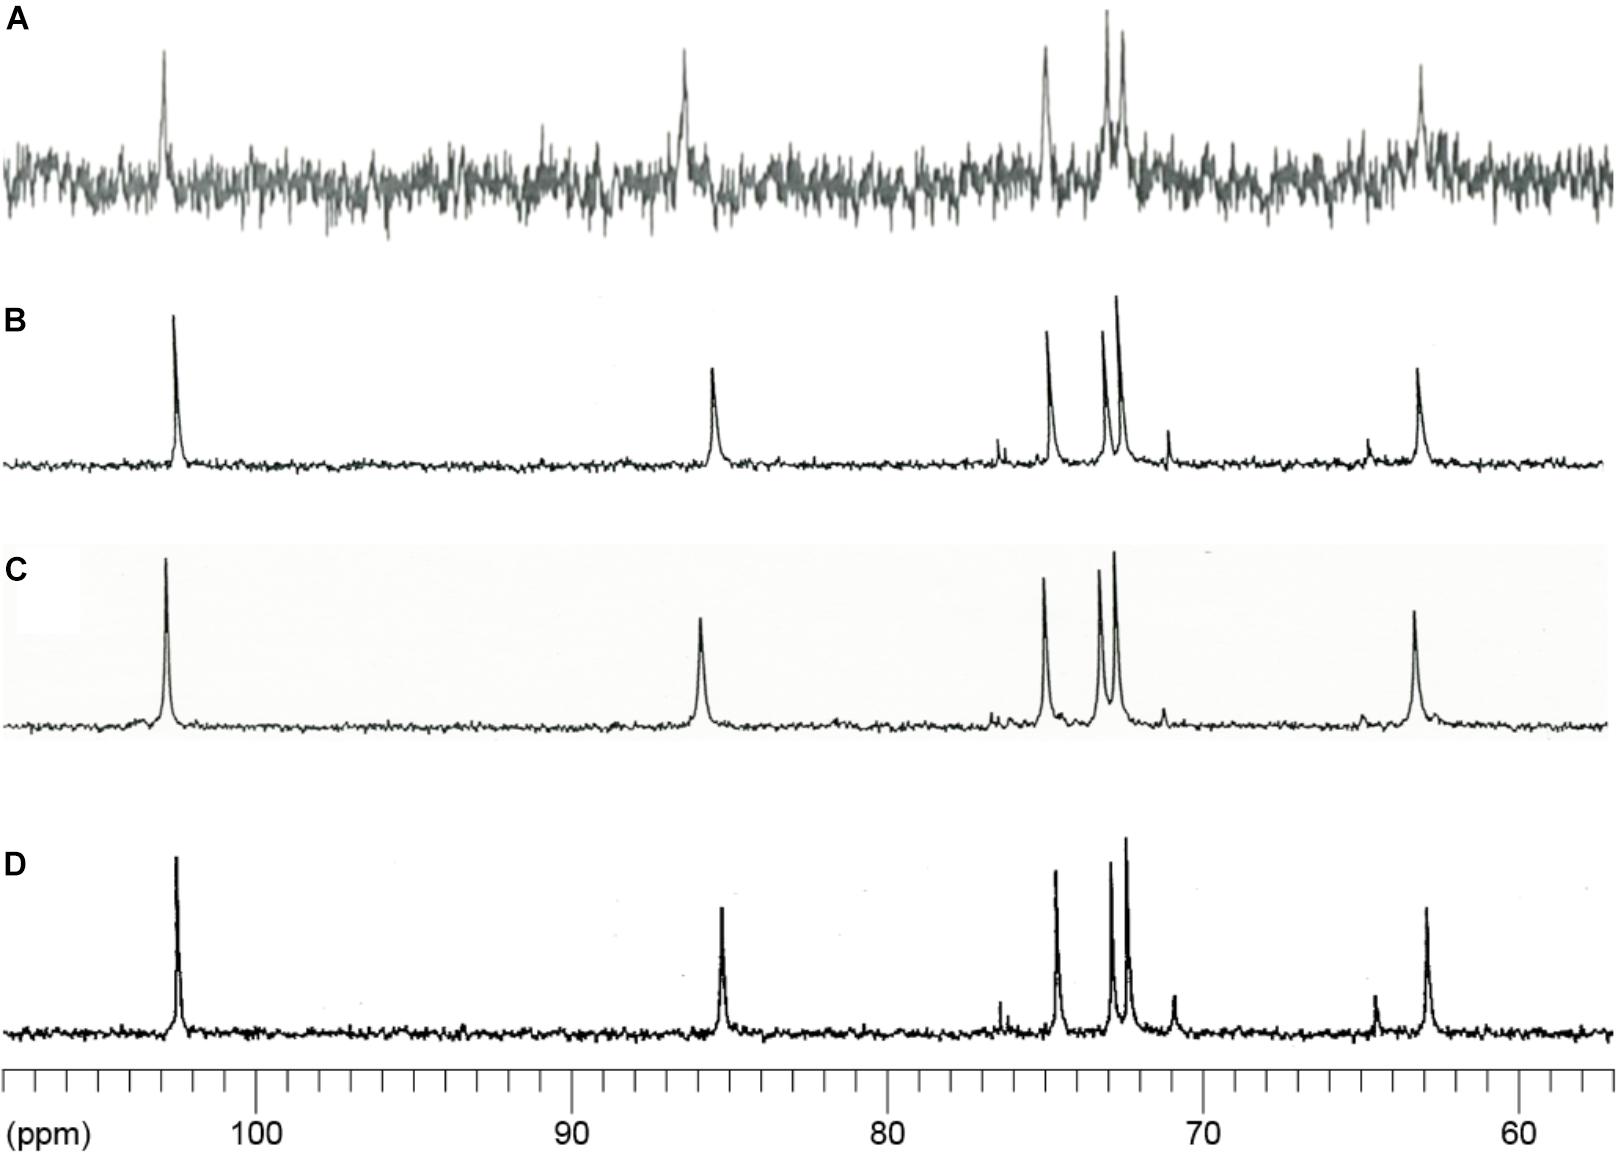
FIGURE 5. 13C-NMR spectra of the AS2 fractions from the wild-type (WT), agsAOE, and agsBOE strains. The AS2 fractions from (A) wild-type, (B) agsAOE, and (C) agsBOE strains were dissolved in 1 M NaOH/D2O. (D) Mutan enzymatically synthesized by the action of GTF-J from Streptococcus salivarius and representing a standard molecule of α-1,3-glucan. NMR spectra were measured at 400 MHz at 35°C. Chemical shifts were recorded relative to the resonance of DMSO-d6.
To determine the linkage of polysaccharides in the AS2 fraction, we performed methylation analysis. The AS2 fraction from the wild-type strain contained mainly 2,4,6-tri-O-methyl(Me)-Glc (1,3,5-triacetyl-2,4,6-tri-O-methyl-D-glucitol), which indicated 1,3-glucosidic bonds (Table 1). Small amounts of 2,3,4,6-tetra-O-Me-Glc (indicating non-reducing end termini), 2,3,6-tri-O-Me-Glc (1,4-glucosidic bonds), 3,4,6-tri-O-Me-Glc (1,2-glucosidic bonds), and 2,4-di-O-Me-Glc (3,6-branching points) were also detected in the AS2 fraction from the wild-type strain (Table 1). The 1,4-glucosidic bonds seemed to be derived from the primer or spacer molecules of α-1,3-glucan (Table 1). The 1,2-glucosidic bonds seemed to be derived from galactomannan (Figure 3A). The 3,6-branching points might be derived from contaminating β-1,3/1,6-glucan (Table 1). Similar to the AS2 fraction from the wild-type strain, those from the agsAOE and agsBOE strains contained the same permethylated glucose compounds as each other (Table 1). Taken together, the results of all three experimental approaches show that the AS2 fractions from the wild-type, agsAOE, and agsBOE strains were composed mainly of α-1,3-glucan.
The molecular mass of alkali-soluble glucan from filamentous fungi is expected to be nearly 1,000 kDa (Choma et al., 2013) and is therefore difficult to estimate. Here, we efficiently evaluated the molecular mass of alkali-soluble glucan using HPSEC. The increase in the elution volume of dextrans (molecular weight standards for polysaccharides) with the decrease in their molecular weight could be approximated by a quadratic function in the 70-2,160 kDa range (Figure 6A). The peak of alkali-soluble glucan from the agsAOE strain was detected in a smaller elution volume than that from the agsBOE strain (Figure 6A). The peak molecular weight (Mp) of the alkali-soluble glucan from the agsAOE strain was 1,480 ± 80 kDa, which was about four times that from agsBOE (372 ± 47 kDa; P < 0.01) (Table 2). The alkali-soluble glucan from the wild-type strain (147 ± 52 kDa) was smaller than that from the agsBOE strain (P < 0.05; Table 2). The amount of alkali-soluble glucan from the wild type was also smaller than that from the agsBOE stain; therefore, the alkali-soluble glucan from the wild type might be more sensitive to degradation. These molecular masses are equivalent to number-average degrees of polymerization (DP) of 9,160 ± 520 (agsAOE), 2,230 ± 290 (agsBOE), and 908 ± 319 (wild type) (Table 2). In the wild type, an additional large peak was detected at approximately 13.5 mL, which seemed to be derived from degraded alkali-soluble cell wall glucan (Figure 6A; black arrow). The difference in the molecular mass of alkali-soluble glucan between the agsAOE and agsBOE strains might be a primary factor causing hyphal aggregation.
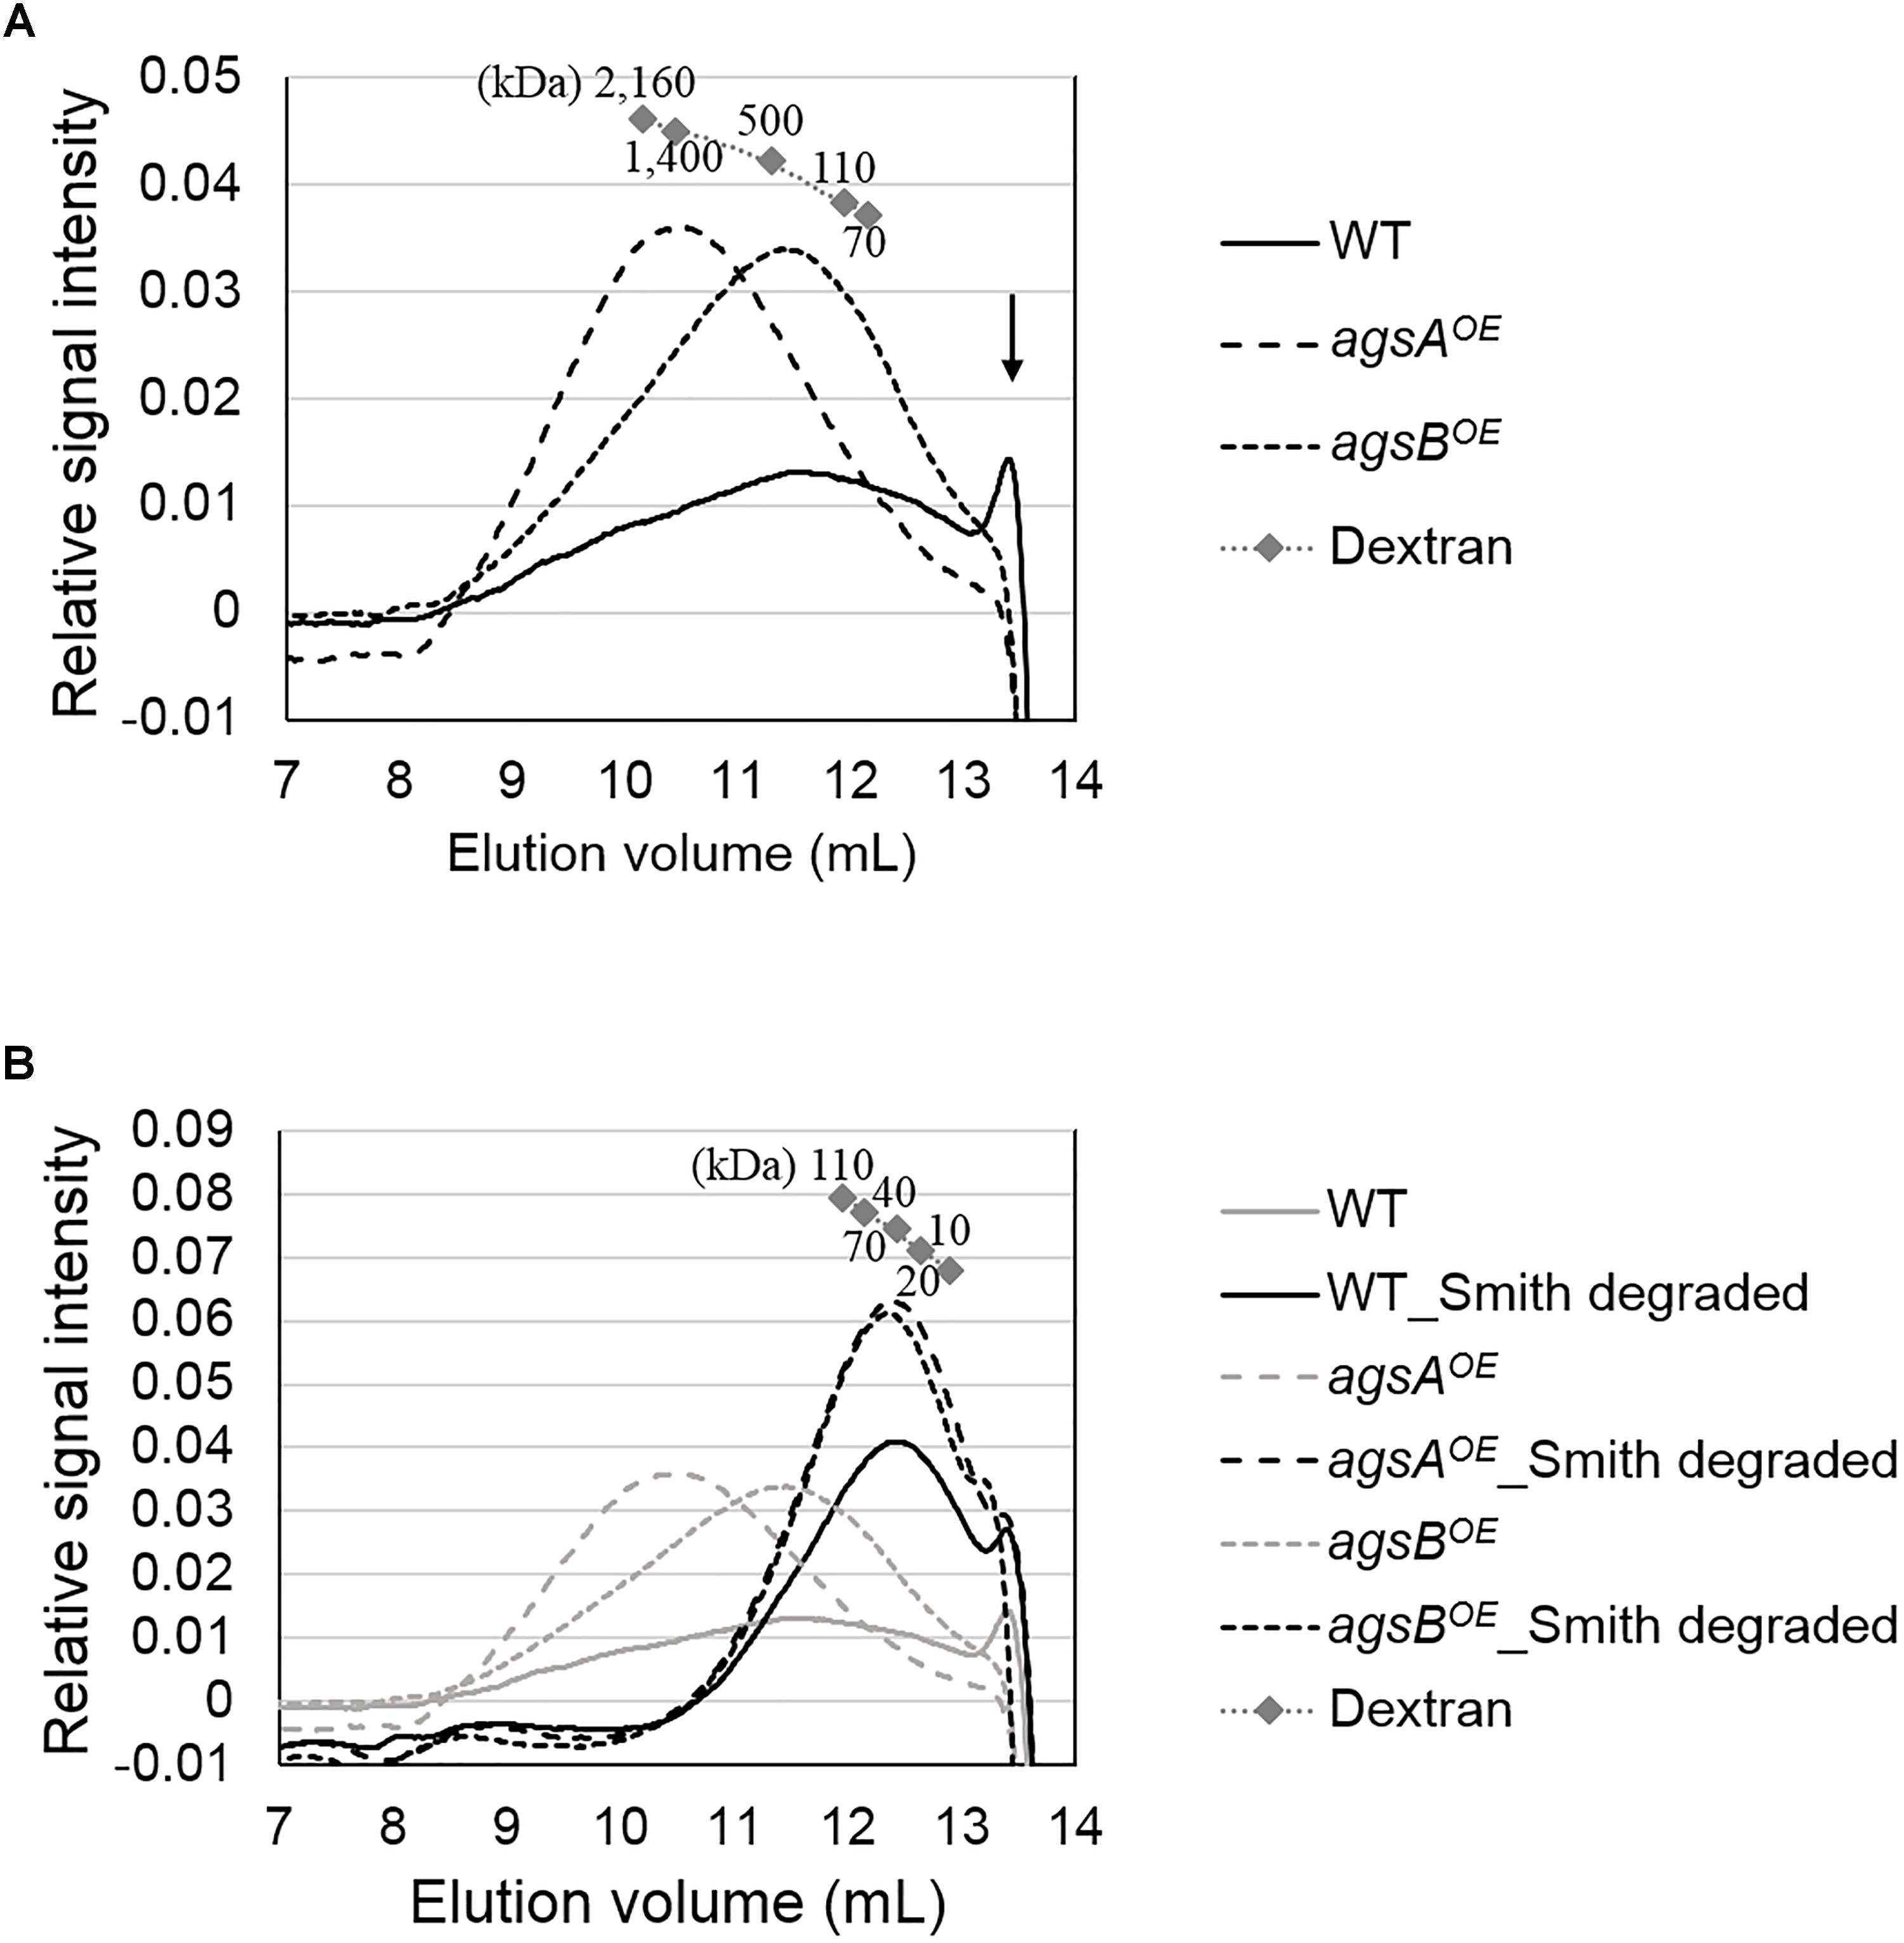
FIGURE 6. High-performance size-exclusion chromatography elution profiles of (A) AS2 fractions and (B) Smith-degraded AS2 fractions from the wild-type, agsAOE, and agsBOE strains. The AS2 fraction (10 mg) from each strain was dissolved in 1 M NaOH/H2O. Glucan elution was monitored as refractive index. Molecular masses of the glucan peaks were determined from a calibration curve of dextran standards. Elution profiles shown in gray in (B) are the same as in (A). The results of a representative of three experiments are shown.
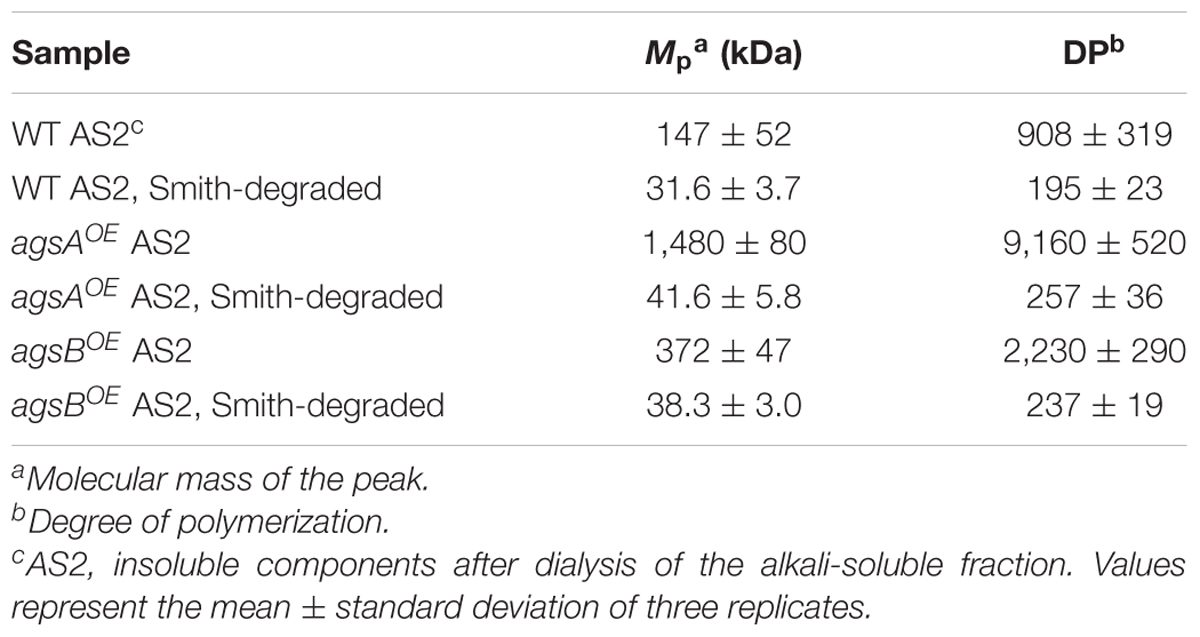
TABLE 2. Molecular mass and degree of polymerization of alkali-soluble glucans from α-1,3-glucan synthase–overexpressing strains.
We hypothesized that the chemical structure such as that of α-1,3-glucan subunits might differ between alkali-soluble glucans from the agsAOE and agsBOE strains, and thus we performed Smith degradation, which selectively hydrolyzes 1,4-linked glucose residues in alkali-soluble glucan chains (Goldstein et al., 1965; Hay et al., 1965), followed by HPSEC.
Smith-degraded alkali-soluble glucans from both the agsAOE and agsBOE strains were detected in a larger elution volume than that of non-degraded glucans (Figure 6B). The molecular mass of Smith-degraded glucans was estimated by calibration using dextran (10–110 kDa) with linear approximation (Figure 6B). The Mp of Smith-degraded glucan was 41.6 ± 5.8 kDa for agsAOE, 38.3 ± 3.0 kDa for agsBOE, and 31.6 ± 3.7 kDa for the wild-type (Table 2). These Mp values are equivalent to DP of 257 ± 36 for agsAOE, 237 ± 19 for agsBOE, and 195 ± 23 for the wild type (Table 2). No significant difference was found in the degree of polymerization of Smith-degraded alkali-soluble glucan between the agsAOE and agsBOE strains. The numbers of α-1,3-glucan subunits in the alkali-soluble glucan calculated from the molecular masses of non-degraded and Smith-degraded alkali-soluble glucans were 35.9 ± 2.8 (agsAOE), 9.82 ± 2.27 (agsBOE), and 4.65 ± 1.89 (wild-type). These HPSEC analyses suggest that the molecular mass of alkali-soluble glucan synthesized by AgsA is approximately four times that synthesized by AgsB, and that AgsA and AgsB synthesize subunits consisting of similar numbers (approximately 200) of 1,3-linked α-glucose residues.
We found that the phenotypes of the agsAOE and agsBOE strains might be related to the molecular weight of the alkali-soluble glucan, which mainly consisted of α-1,3-glucan. However, another possibility could be that spatial localization of α-1,3-glucan synthesized by AgsA in the cell wall differs from that of AgsB. To examine this possibility, we labeled α-1,3-glucan, β-1,3-glucan, and chitin in the cell wall of the wild-type, agsAOE, and agsBOE strains. In the wild-type strain, α-1,3-glucan was strongly labeled along the outline of the cells, whereas β-1,3-glucan and chitin were labeled weakly (Figure 7). In the ΔagsAΔagsB strain, which lacks cell wall α-1,3-glucan, β-1,3-glucan, and chitin were strongly labeled along the outline of the cells (Figure 7). In the agsBOE strain, α-1,3-glucan was strongly labeled along the outline of the cells, but it was only weakly labeled in the agsAOE strain (Figure 7). In addition, β-1,3-glucan and chitin were clearly labeled in the agsAOE strain, but not in the agsBOE strain (Figure 7). These results suggest that α-1,3-glucan of the wild-type and agsBOE strains was localized in the outermost layer of the cell wall, whereas α-1,3-glucan of the agsAOE strain might be masked by β-1,3-glucan and chitin layer.
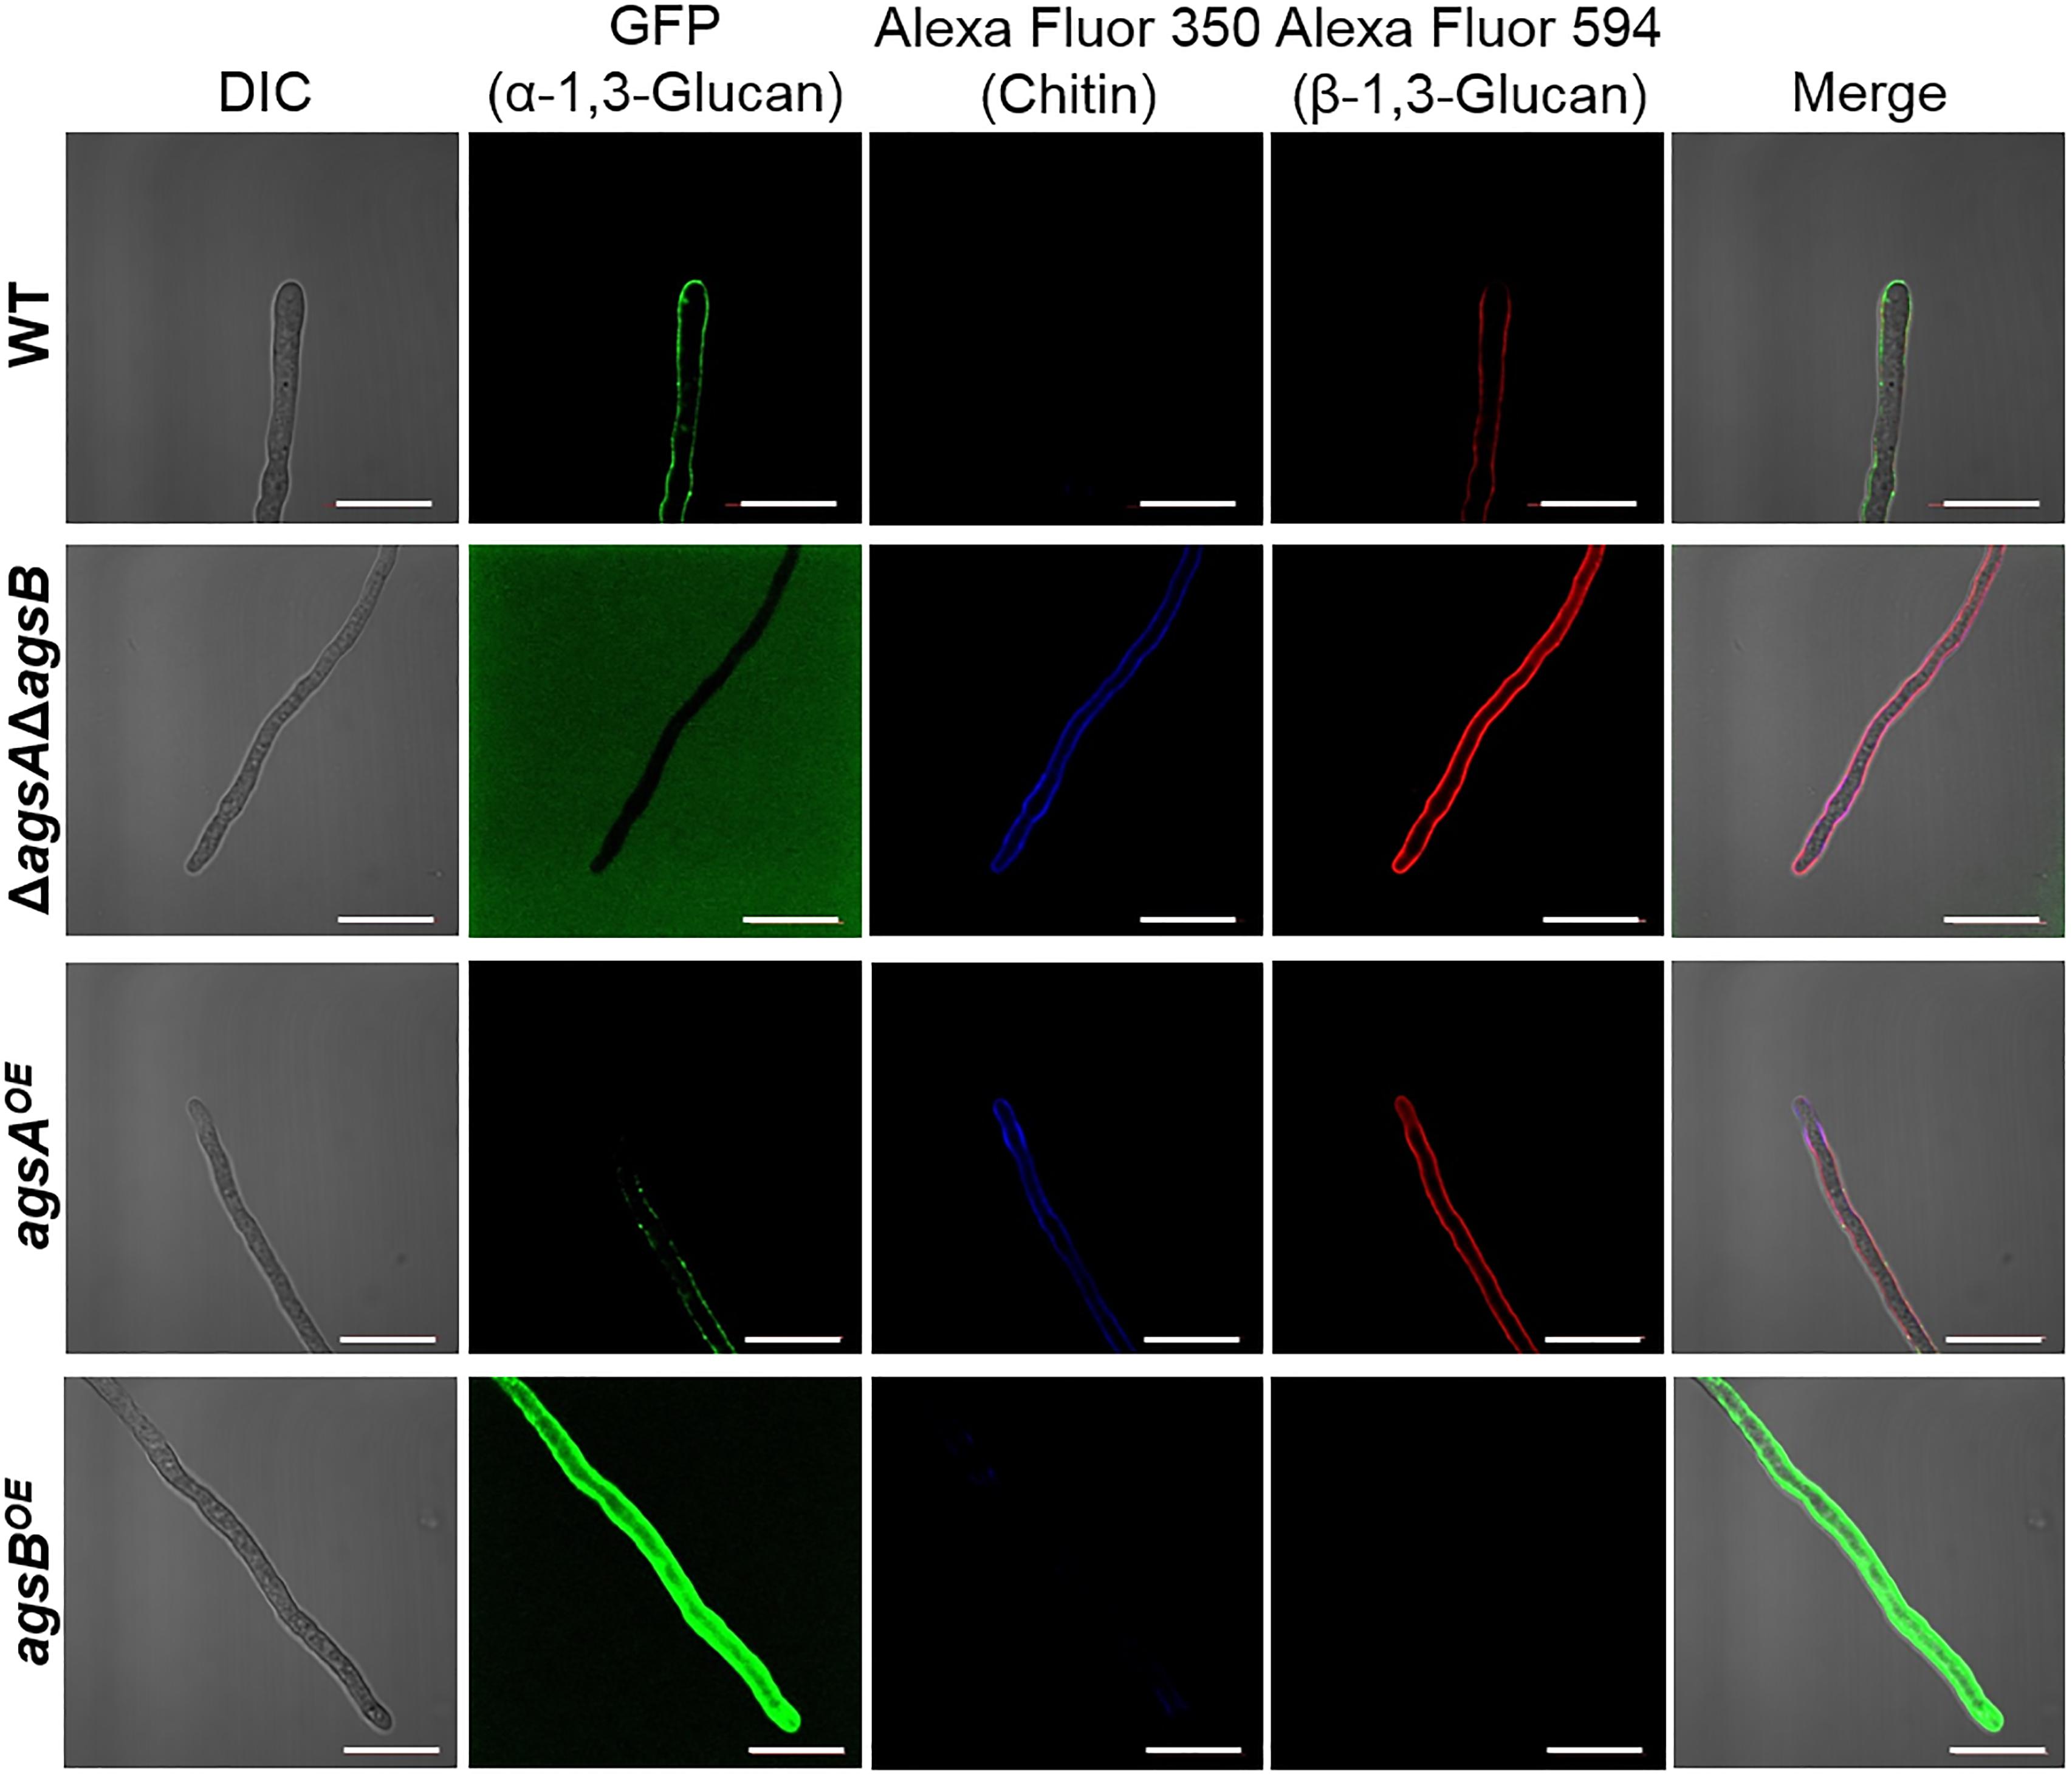
FIGURE 7. Localization of cell wall polysaccharides of vegetative hyphae. Hyphae cultured in CD liquid medium for 12 h were fixed and stained with AGBD-GFP for α-1,3-glucan, fluorophore-labeled antibody for β-1,3-glucan, and fluorophore-labeled lectin for chitin. Scale bars are 10 μm.
To validate these results, we treated agsAOE and agsBOE cells with α-1,3-glucanase or β-1,3-glucanase, and then observed the fluorescent-labeled cell wall components. α-1,3-Glucanase-treated agsAOE cells and β-1,3-glucanase-treated agsBOE cells (Figure 8) looked similar to the respective untreated cells (Supplementary Figure S9). In the β-1,3-glucanase-treated agsAOE cells, α-1,3-glucan was clearly labeled at the outline of the cells with some fluorescent dots, and β-1,3-glucan and chitin labeling was also visible (Figure 8). Fluorescence of α-1,3-glucan was weaker in the α-1,3-glucanase-treated agsBOE cells (Figure 8) than in untreated agsBOE cells (Supplementary Figure S9). In contrast, fluorescence intensity of β-1,3-glucan was increased after treatment with α-1,3-glucanase in the agsBOE cells (Figure 8) compared to the untreated cells (Supplementary Figure S9). These results suggest that most α-1,3-glucan of agsBOE cells is present in the outermost layer of the cell wall and that of agsAOE cells is masked by β-1,3-glucan.
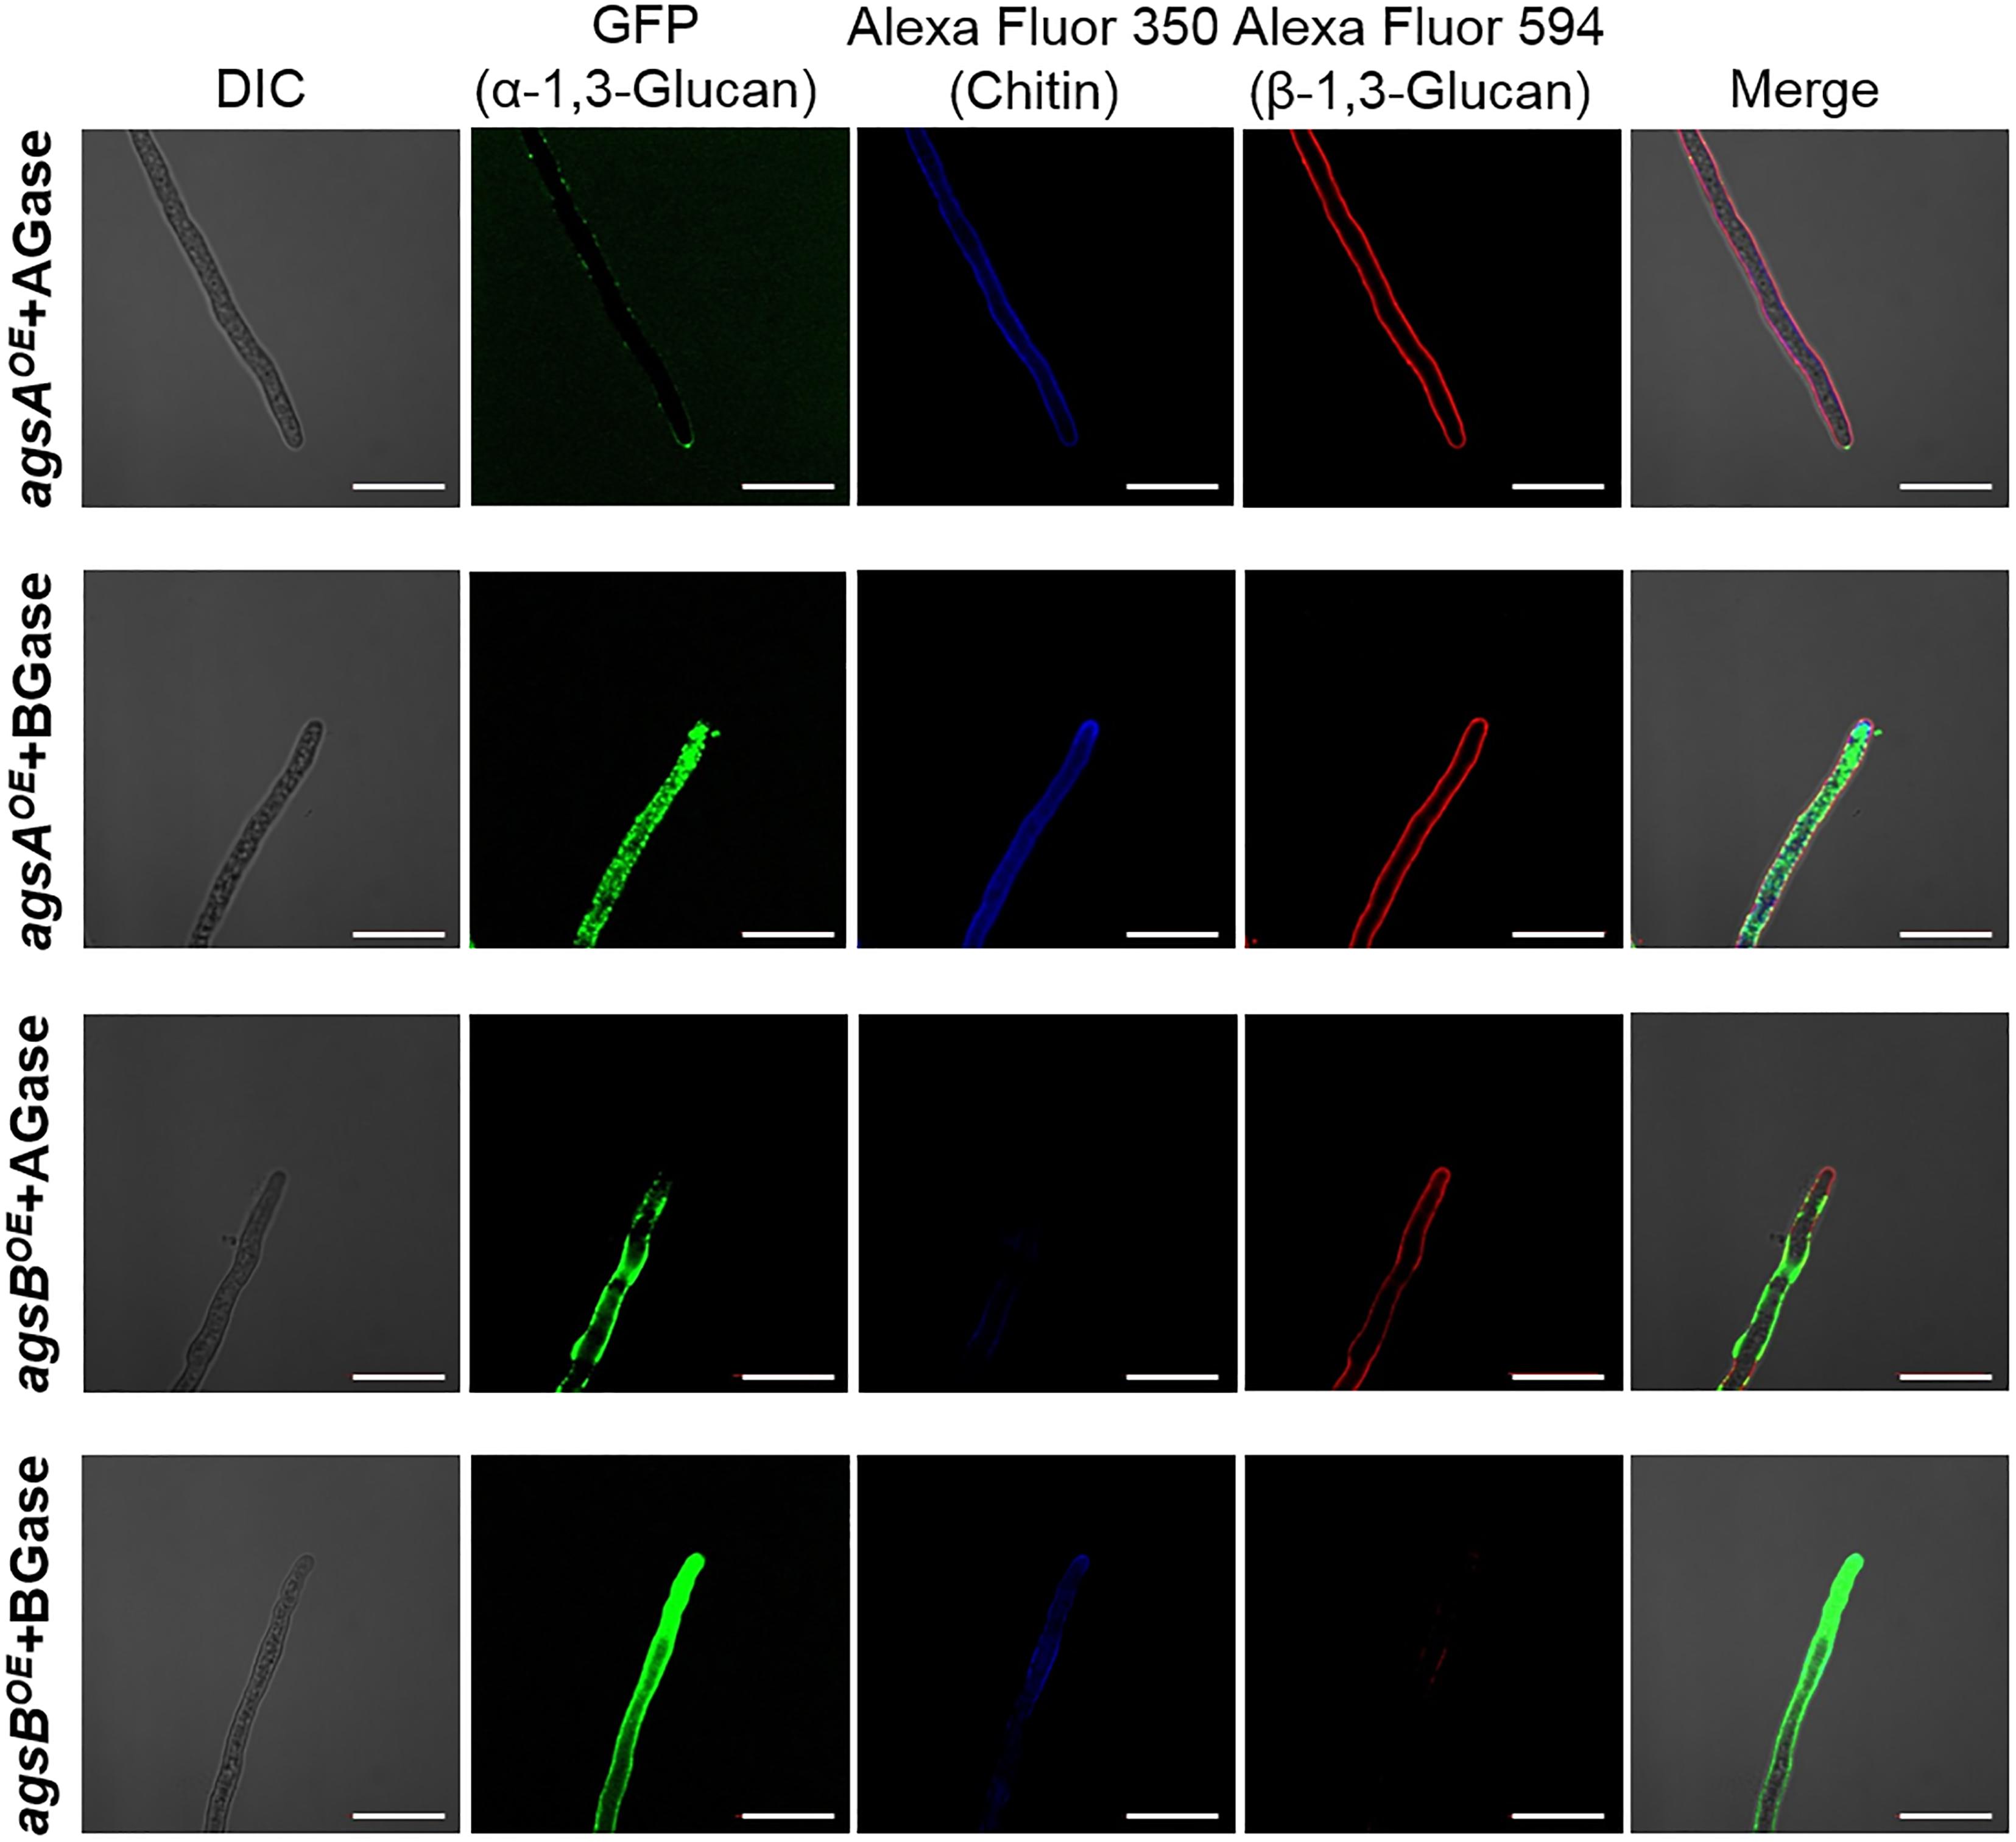
FIGURE 8. Localization of cell wall polysaccharides after treatment with α-1,3-glucanase or β-1,3-glucanase. Vegetative hyphae cultured for 12 h were fixed and treated with α-1,3-glucanase (AGase) or β-1,3-glucanase (BGase) for 6 h. The hyphae were stained with AGBD-GFP for α-1,3-glucan, fluorophore-labeled antibody for β-1,3-glucan, and fluorophore-labeled lectin for chitin. Scale bars are 10 μm.
We constructed agsA- and agsB-promoter GFP reporter strains (i.e., PagsA-EGFP, PagsB-EGFP) and examined the expression of these genes during sexual development. During vegetative growth, clear fluorescence was observed in the hyphae of the PagsB-EGFP strain (Figure 9A), but no fluorescence was detected in the PagsA-EGFP strain (Figure 9B), in agreement with the published data (Yoshimi et al., 2013; He et al., 2014). Interestingly, GFP signals in both the PagsA- and PagsB-EGFP strains were observed in Hülle cells (nursing cells of cleistothecia) during sexual development, but not in cleistothecia or ascospores (Figures 9A,B). These results suggest that the agsA and agsB genes are expressed in Hülle cells during sexual development.
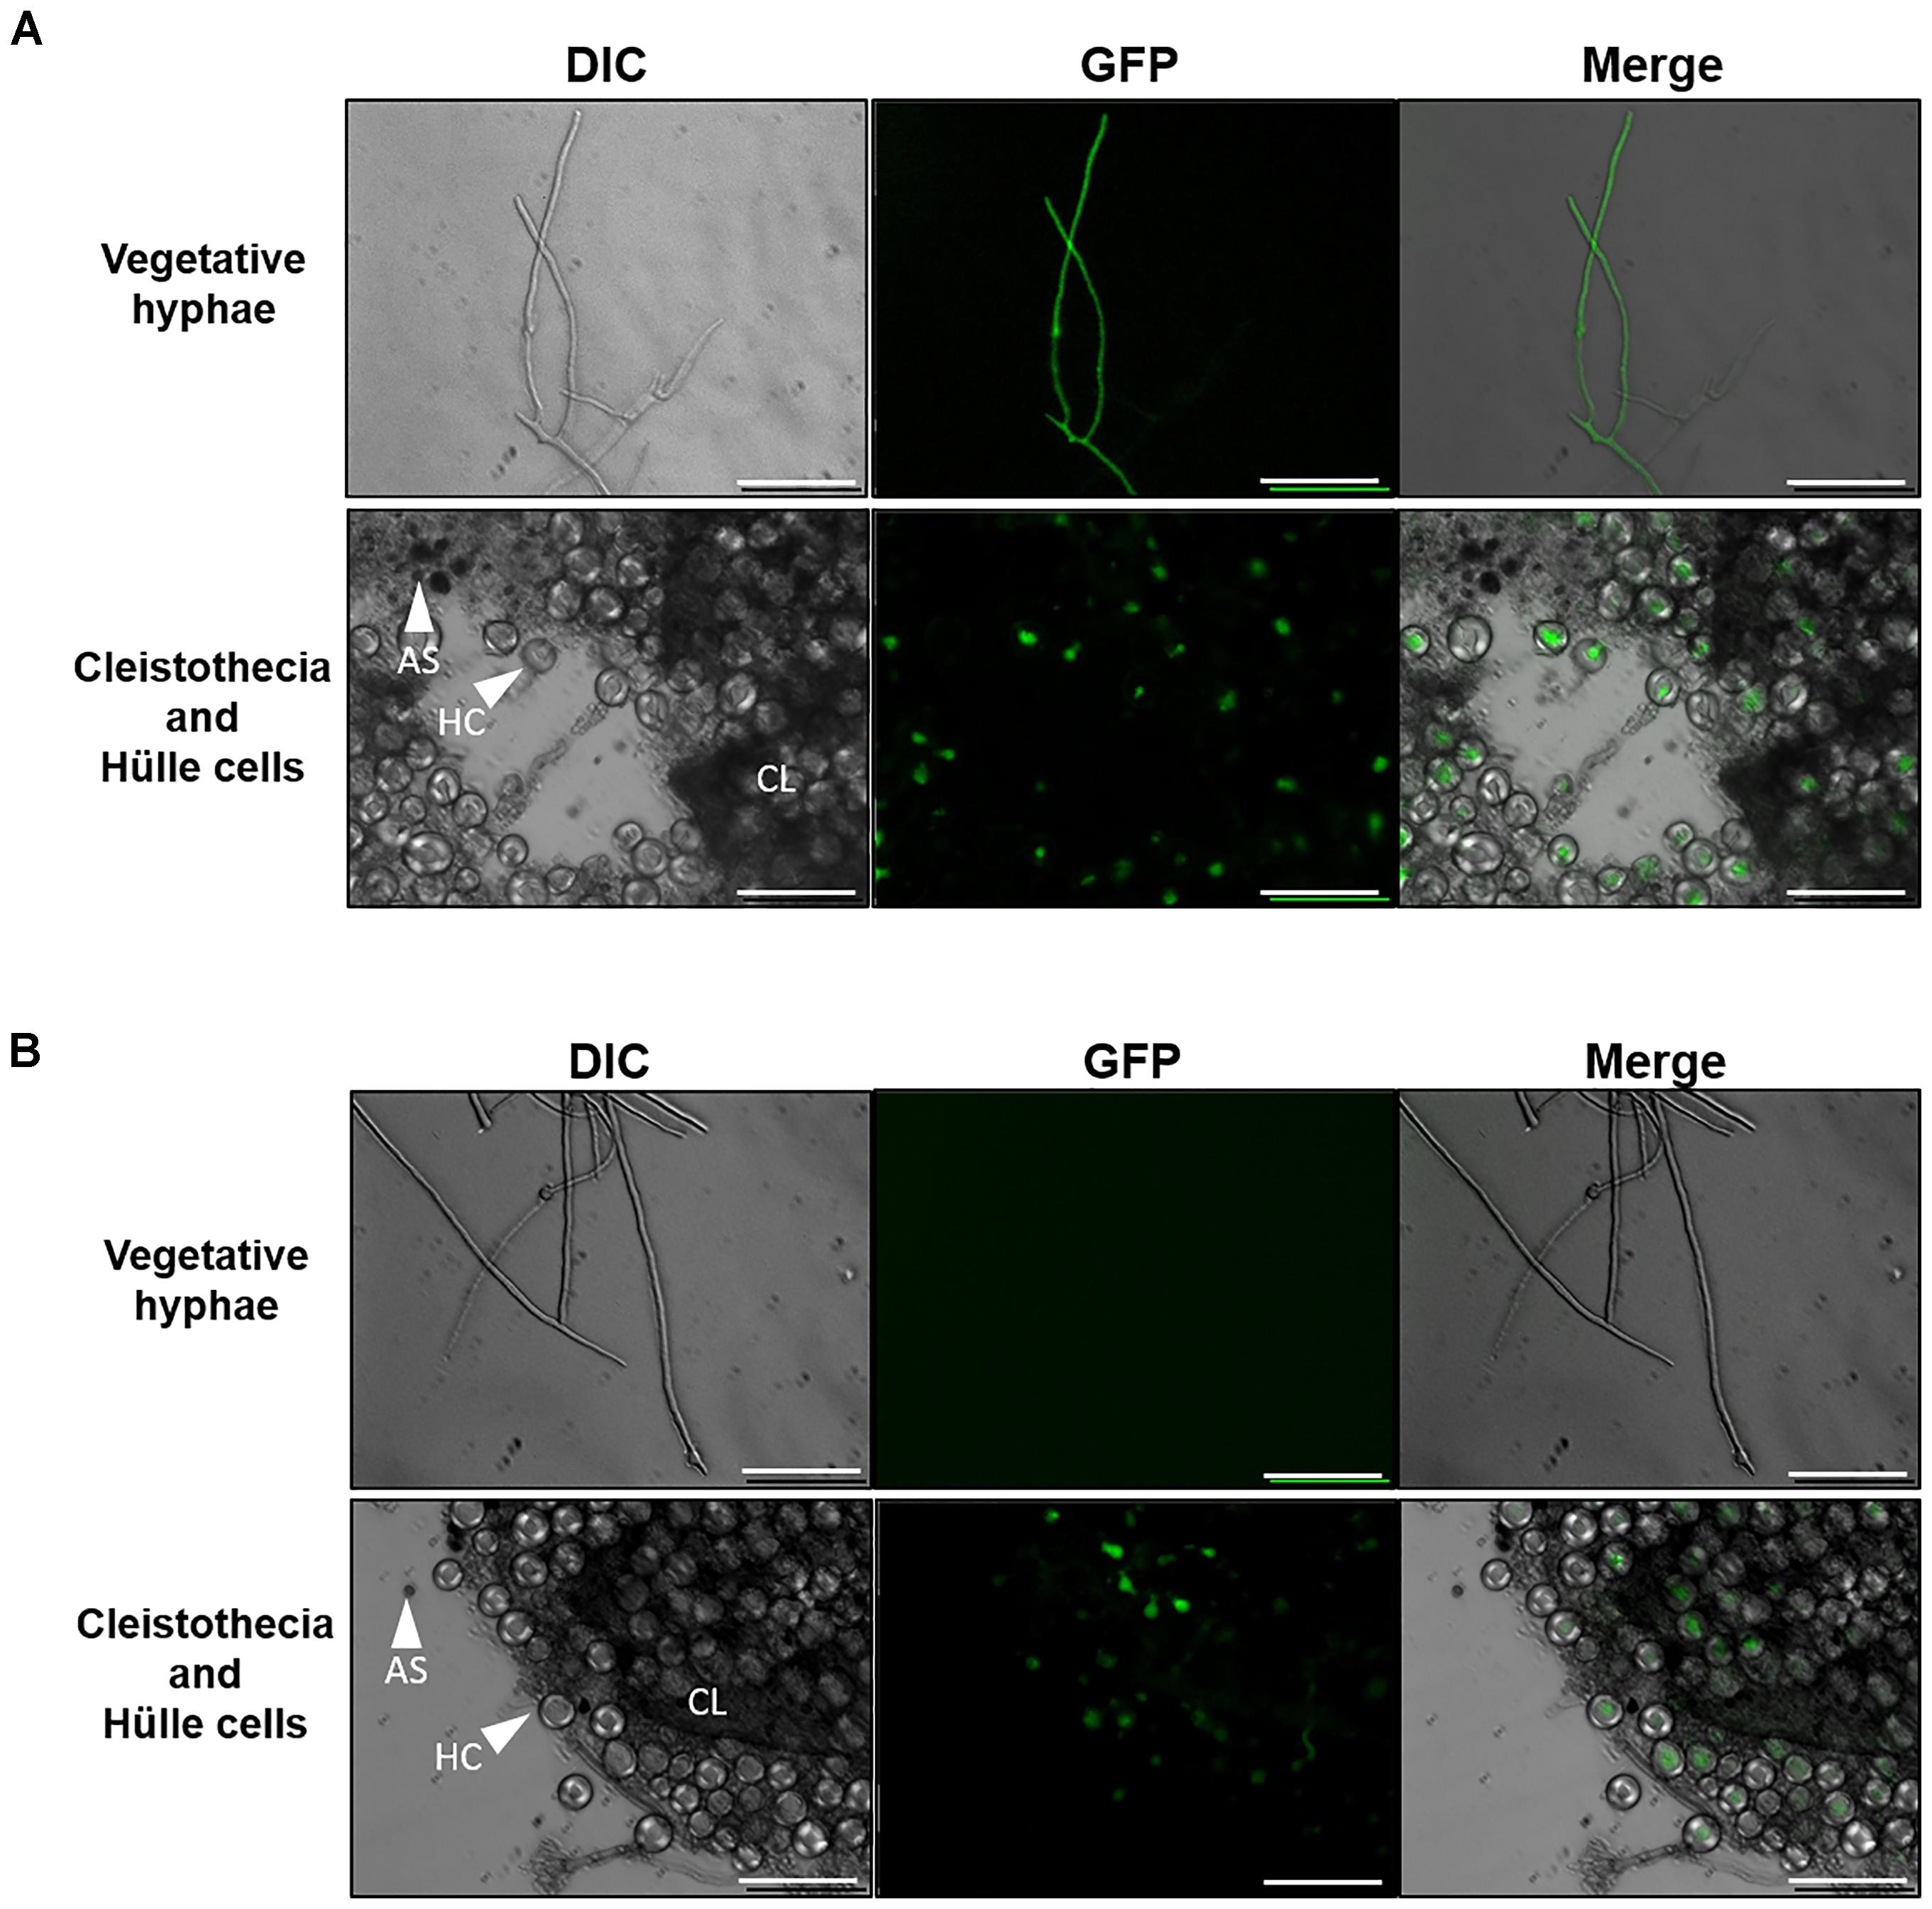
FIGURE 9. Fluorescence microscopy of Aspergillus nidulans PagsA-EGFP and PagsB-EGFP strains. (A) PagsB-EGFP strain. (B) PagsA-EGFP strain. Hyphae during vegetative growth (top) and a fruiting body (bottom) are shown. The vegetative hyphae were cultured in CD liquid medium at 37°C for 24 h. Fruiting bodies were obtained by culture on CD agar medium for 8 days. Scale bars are 50 μm. HC, Hülle cell; AS, ascospore; CL, cleistothecium.
Although Wei et al. (2001) reported the expression of the α-1,3-glucanase gene mutA in Hülle cells in A. nidulans, there was no direct evidence for the presence of α-1,3-glucan in these cells. To examine whether α-1,3-glucan is present in wild-type Hülle cells, we stained them with AGBD-GFP. The vegetative hyphae of the BPU1 strain were clearly stained (Figure 10A). In the fruiting body, fluorescence was observed in Hülle cells and in hyphae near the cleistothecia (Figure 10B). These results show that α-1,3-glucan is present not only in vegetative hyphae but also in the cells of the fruiting body, in particular Hülle cells.
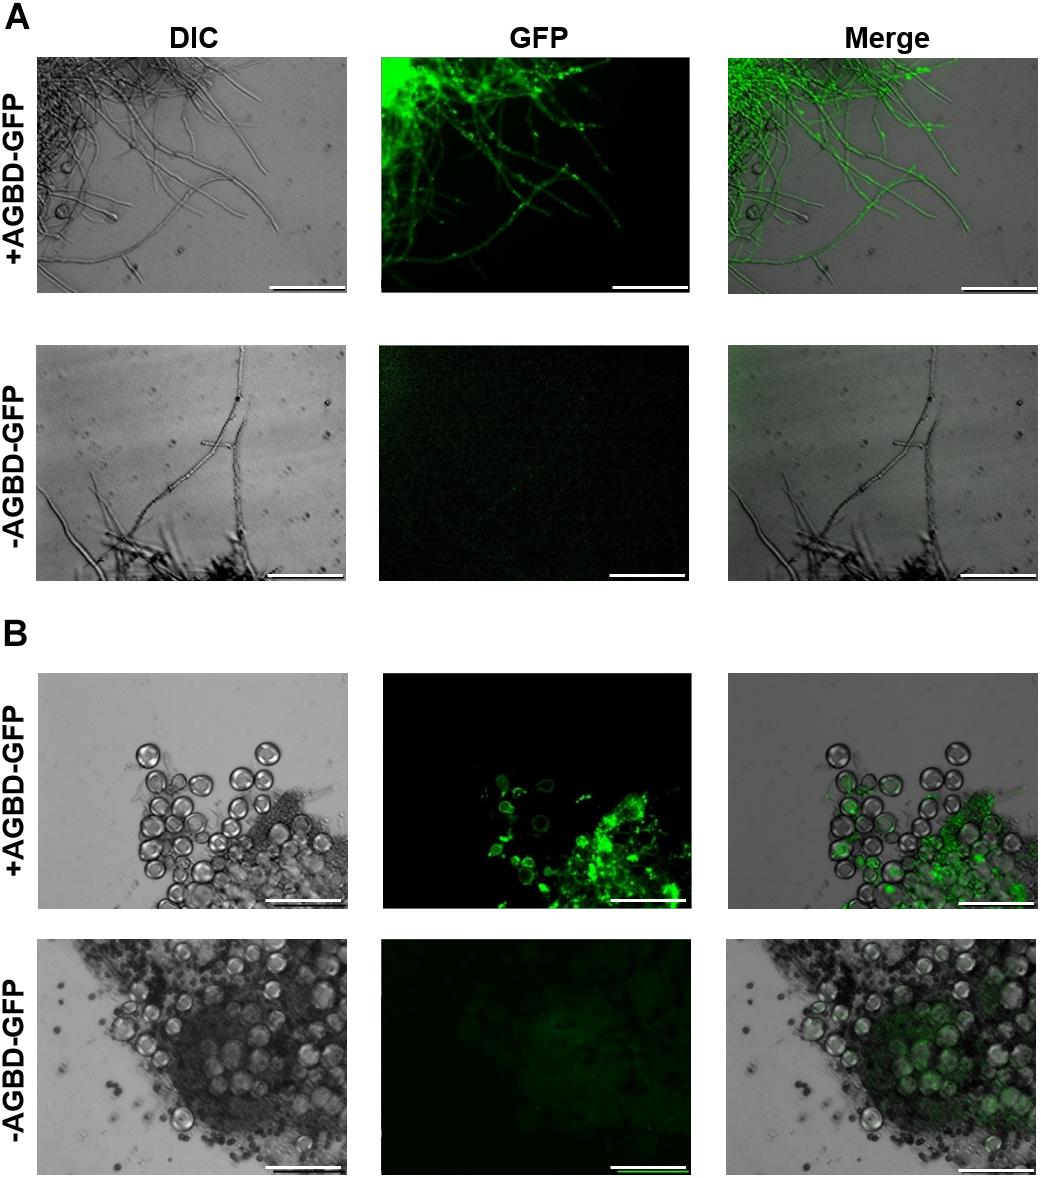
FIGURE 10. Fluorescence microscopy of the BPU1 strain stained with α-1,3-glucan-binding domain–fused GFP (AGBD-GFP). (A) Vegetative growth stage; (B) sexual development. The cells (20 mg) were stained in 50 mM potassium phosphate buffer (pH 6.5) with or without 0.1 mg/mL AGBD-GFP at 30°C for 4 h and then observed under an inverted fluorescence microscope. Scale bars are 50 μm.
To further elucidate the relationship between the molecular mass of alkali-soluble glucan and pellet morphology, we constructed an amyG disruption strain (ΔamyG) of A. nidulans. Disruption of this gene in A. nidulans markedly decreases the amount of cell wall α-1,3-glucan, and the disruptant forms small hyphal pellets in liquid culture (He et al., 2014). In agreement with the results of He et al. (2014), our ΔamyG strain formed smaller and more loosely aggregated pellets than did the parental strain ABPU1 (ΔligD) (Figure 11A). The amount of glucose in the AS2 fraction derived from the ΔamyG strain was significantly decreased (Figure 11B). The amount of alkali-soluble glucan obtained from the mycelia of ΔamyG strain cultured for 24 h was markedly small (data not shown), which caused rapid degradation of α-1,3-glucan by background of α-1,3-glucanase activity in the strain. Therefore, we used mycelia cultured for 16 h to prevent α-1,3-glucan degradation for the analysis of the molecular mass of AS2 glucan, because mycelia of 16 h culture showed lower α-1,3-glucan degradation activity. Interestingly, the molecular mass of alkali-soluble glucan from the ΔamyG strain (93.5 ± 1.4) was significantly smaller than that from the parental strain (355 ± 165; Figure 11C and Table 3; P < 0.05). These results suggest that the appropriate molecular mass of alkali-soluble glucan is required for the formation of tightly aggregated hyphal pellets.
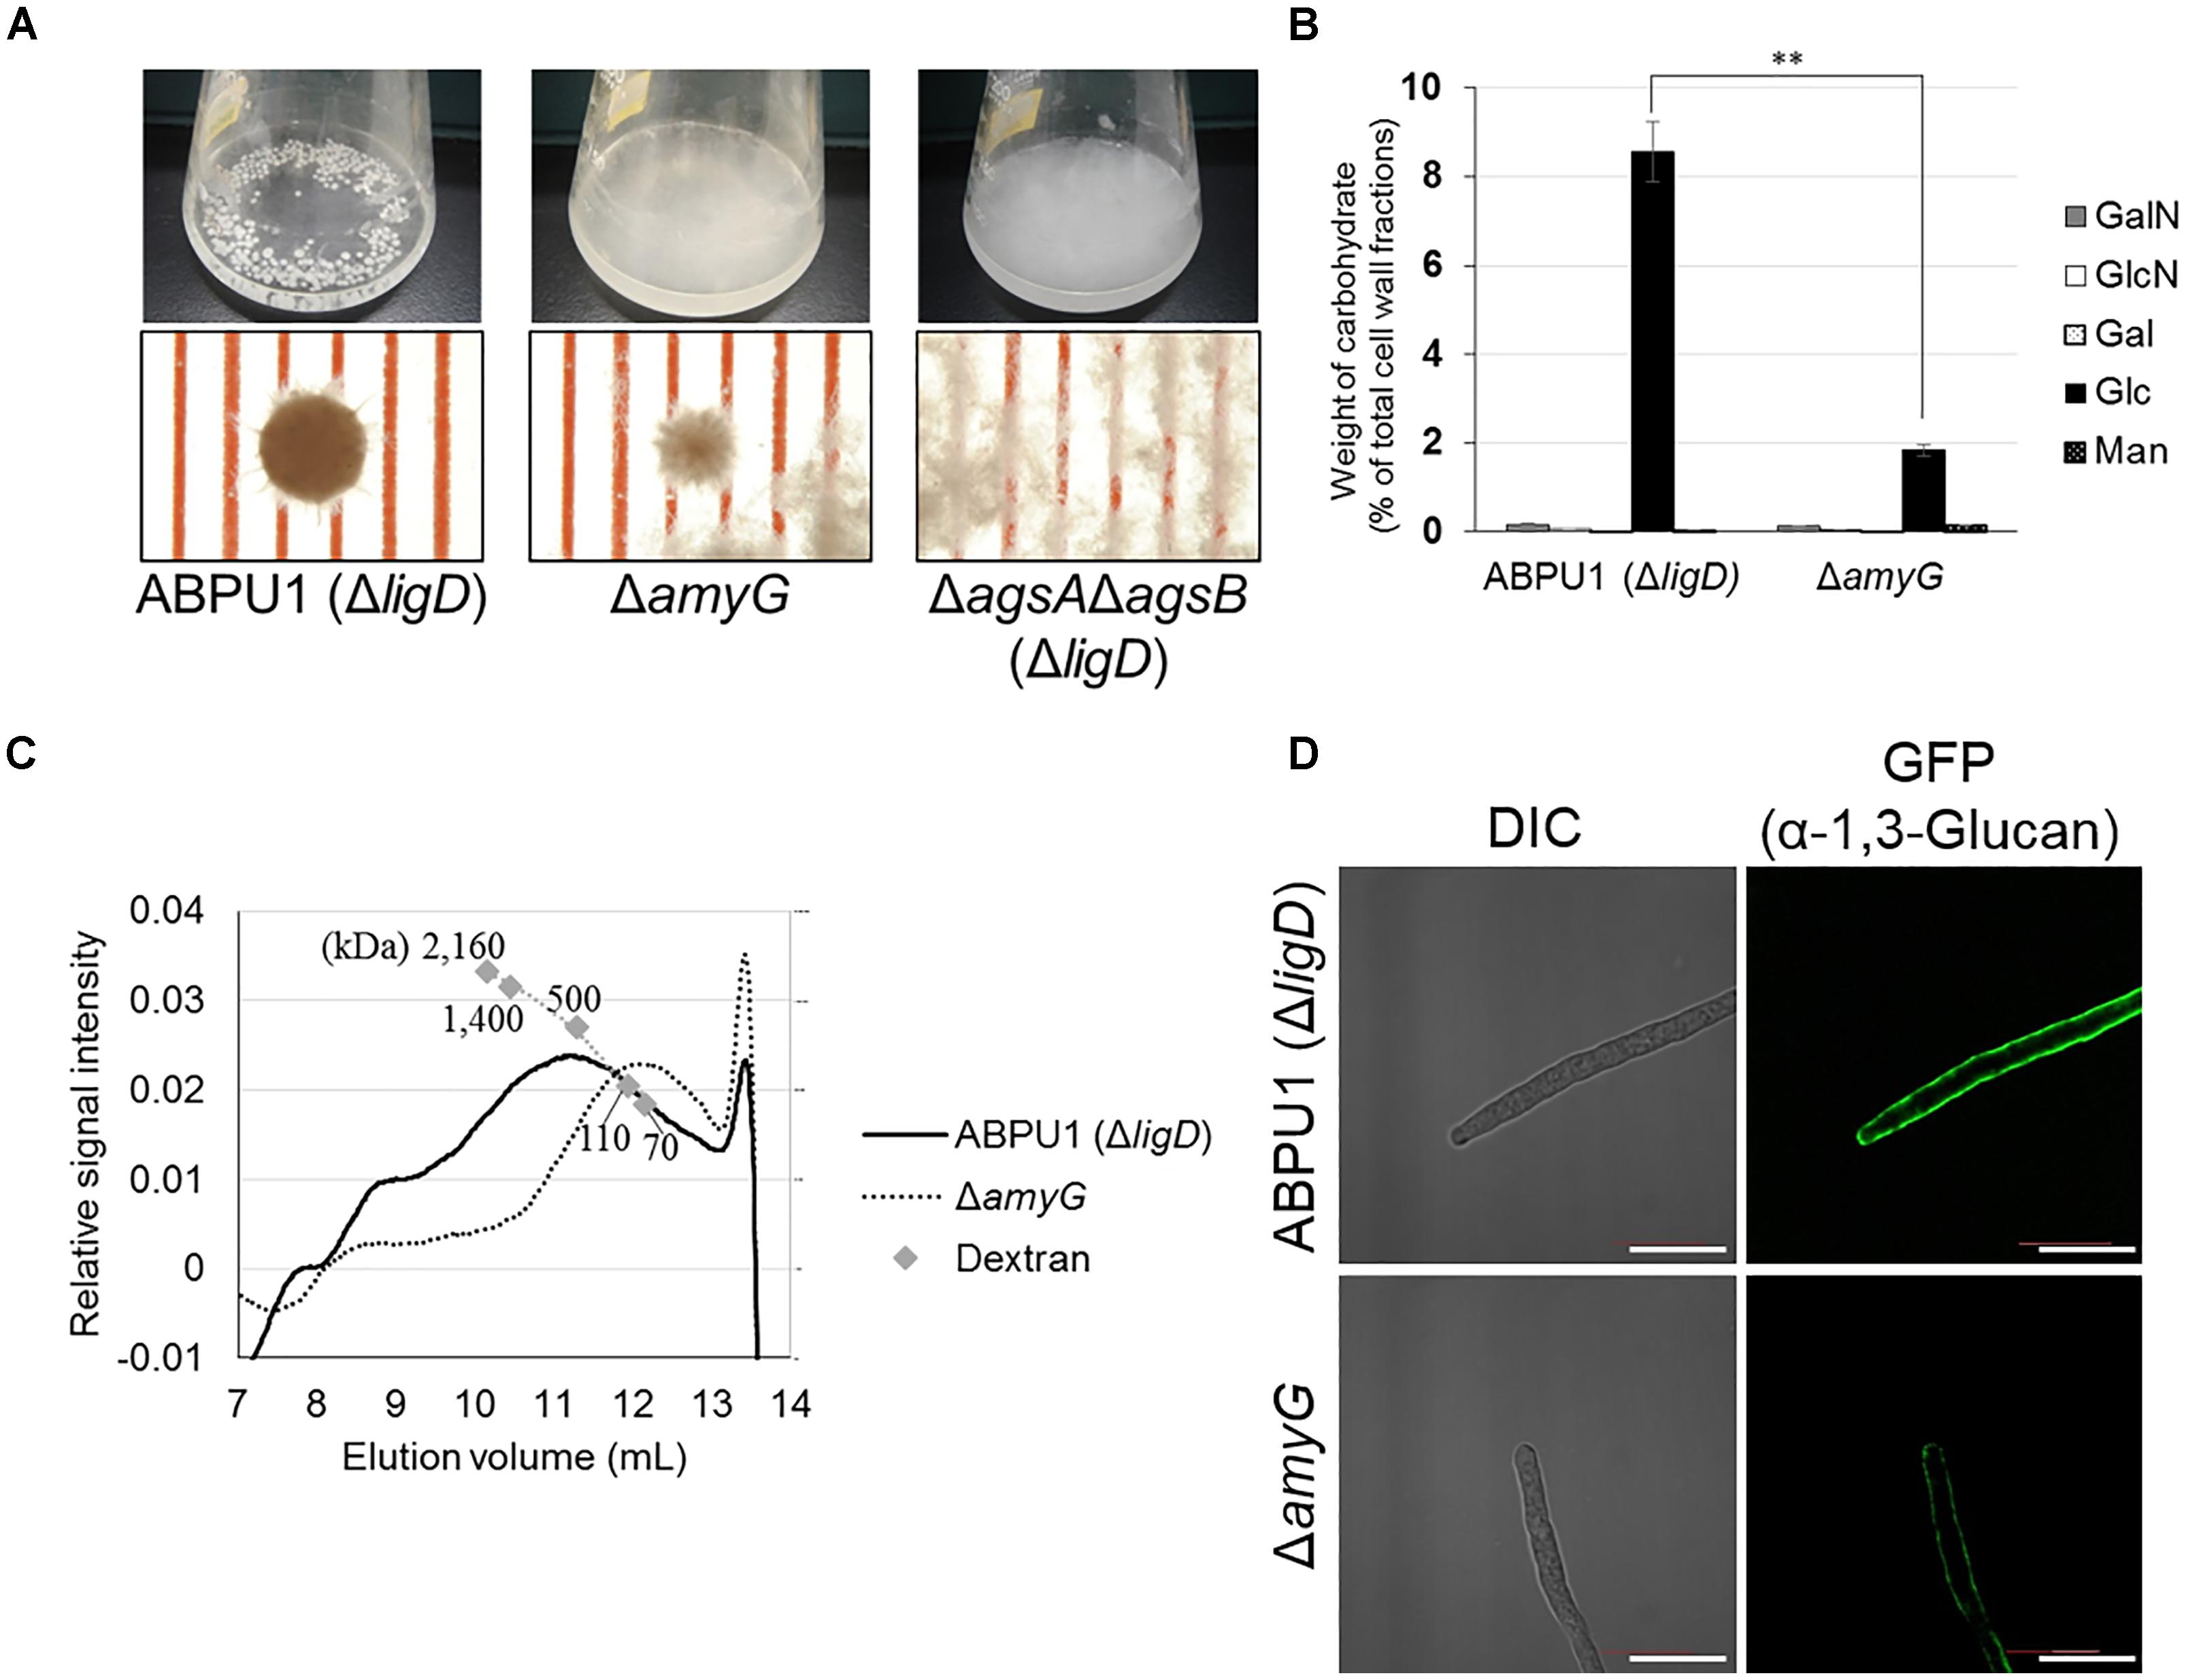
FIGURE 11. Characterization of the amyG disruption (ΔamyG) strain of Aspergillus nidulans. (A) Growth of the ABPU1 (ΔligD), ΔamyG, and ΔagsAΔagsB (ΔligD) strains. Conidia (final concentration, 5.0 × 10⁵/mL) of each strain were inoculated into CD liquid medium and rotated at 160 rpm at 37°C for 24 h. Upper row, photographs of cultures in Erlenmeyer flasks; lower row, representative hyphal pellets under a stereomicroscope. Scale intervals are 1 mm. (B) Monosaccharide composition of the AS2 fractions from ABPU1 (ΔligD) and ΔamyG obtained from mycelia cultured for 24 h. Error bars represent the standard error of the mean calculated from three replicates. Asterisks denote significant differences from ABPU1 (ΔligD) based on Student’s t-test (∗∗P < 0.01). GalN, galactosamine; GlcN, glucosamine; Gal, galactose; Glc, glucose; Man, mannose. (C) Representative HPSEC elution profiles of the AS2 fractions from the ΔamyG and ABPU1 (ΔligD) strains of three experiments. The AS2 fraction (10 mg) obtained from mycelia cultured for 16 h from each strain was dissolved in 1 M NaOH/H2O. Glucan elution was monitored as refractive index. Molecular masses of the glucan peaks were determined from a calibration curve of dextran standards. (D) Vegetative hyphae of the ΔamyG strain cultured in CD liquid medium for 12 h were fixed and stained with AGBD-GFP for α-1,3-glucan, fluorophore-labeled antibody for β-1,3-glucan, and fluorophore-labeled lectin for chitin. Scale bars are 10 μm.

TABLE 3. Molecular mass and degree of polymerization of alkali-soluble glucan from the amyG disruption strain.
We also stained α-1,3-glucan with AGBD-GFP in the cell wall of the ABPU1 (ΔligD) and ΔamyG strains. In the ABPU1 (ΔligD) strain, α-1,3-glucan was clearly stained (Figure 11D), similar to that in the wild-type strain (Figure 7), whereas the labeling was weak but still detectable at the outline of the cells in the ΔamyG strain (Figure 11D). These results suggest that α-1,3-glucan in the ΔamyG strain is localized in the outermost layer of the cell wall.
Although the role of α-1,3-glucan in pathogenesis and hyphal adhesion has been reported in A. fumigatus, A. nidulans, and A. oryzae (Beauvais et al., 2005, 2013; Maubon et al., 2006; Fontaine et al., 2010; Henry et al., 2012; Yoshimi et al., 2013; Miyazawa et al., 2016; Zhang et al., 2017b), the chemical structure of α-1,3-glucan in filamentous fungi has not been analyzed, with one exception. In A. wentii, Choma et al. (2013) reported the chemical structure and properties of alkali-soluble glucan as a substrate for mutanase (α-1,3-glucanase), which can be used as a tooth paste ingredient to prevent the growth of S. mutans. A. nidulans has two α-1,3-glucan synthase genes, agsA and agsB. α-1,3-Glucan in vegetative hyphae is synthesized mainly by AgsB (Yoshimi et al., 2013; He et al., 2014). The agsA gene seems to be associated with conidiation (He et al., 2014). However, the details of the agsA function and the chemical structure of polysaccharides synthesized by AgsA and AgsB remain unclear.
In the present study, we constructed strains overexpressing agsA or agsB (agsAOE and agsBOE) and analyzed in detail the structure of polysaccharides from the cell wall of these strains. The hyphae of the agsAOE strain loosely aggregated to form pellets, whereas the hyphae of the wild-type and agsBOE strains aggregated tightly (Figure 2C). Several analyses of the chemical structure of alkali-soluble glucan revealed that alkali-soluble glucan from the wild-type, agsAOE, and agsBOE strains was mainly composed of α-1,3-glucan (Figures 4, 5 and Table 1), and the Mp values of alkali-soluble glucans from the wild-type and agsBOE strains were ∼150 and ∼370 kDa, respectively, whereas that from the agsAOE strain was 1,480 kDa (Table 2). Smith degradation of the AS2 fractions showed that alkali-soluble glucan in the agsAOE, agsBOE, and wild-type strains was composed of a number of subunits, each consisting of approximately 200 residues of 1,3-linked α-glucose (Table 2). The number of α-1,3-glucan subunits in the agsAOE strain was four times that in the agsBOE strain. The model of alkali-soluble glucan synthesized by AgsA and AgsB of A. nidulans is shown in Figure 12.
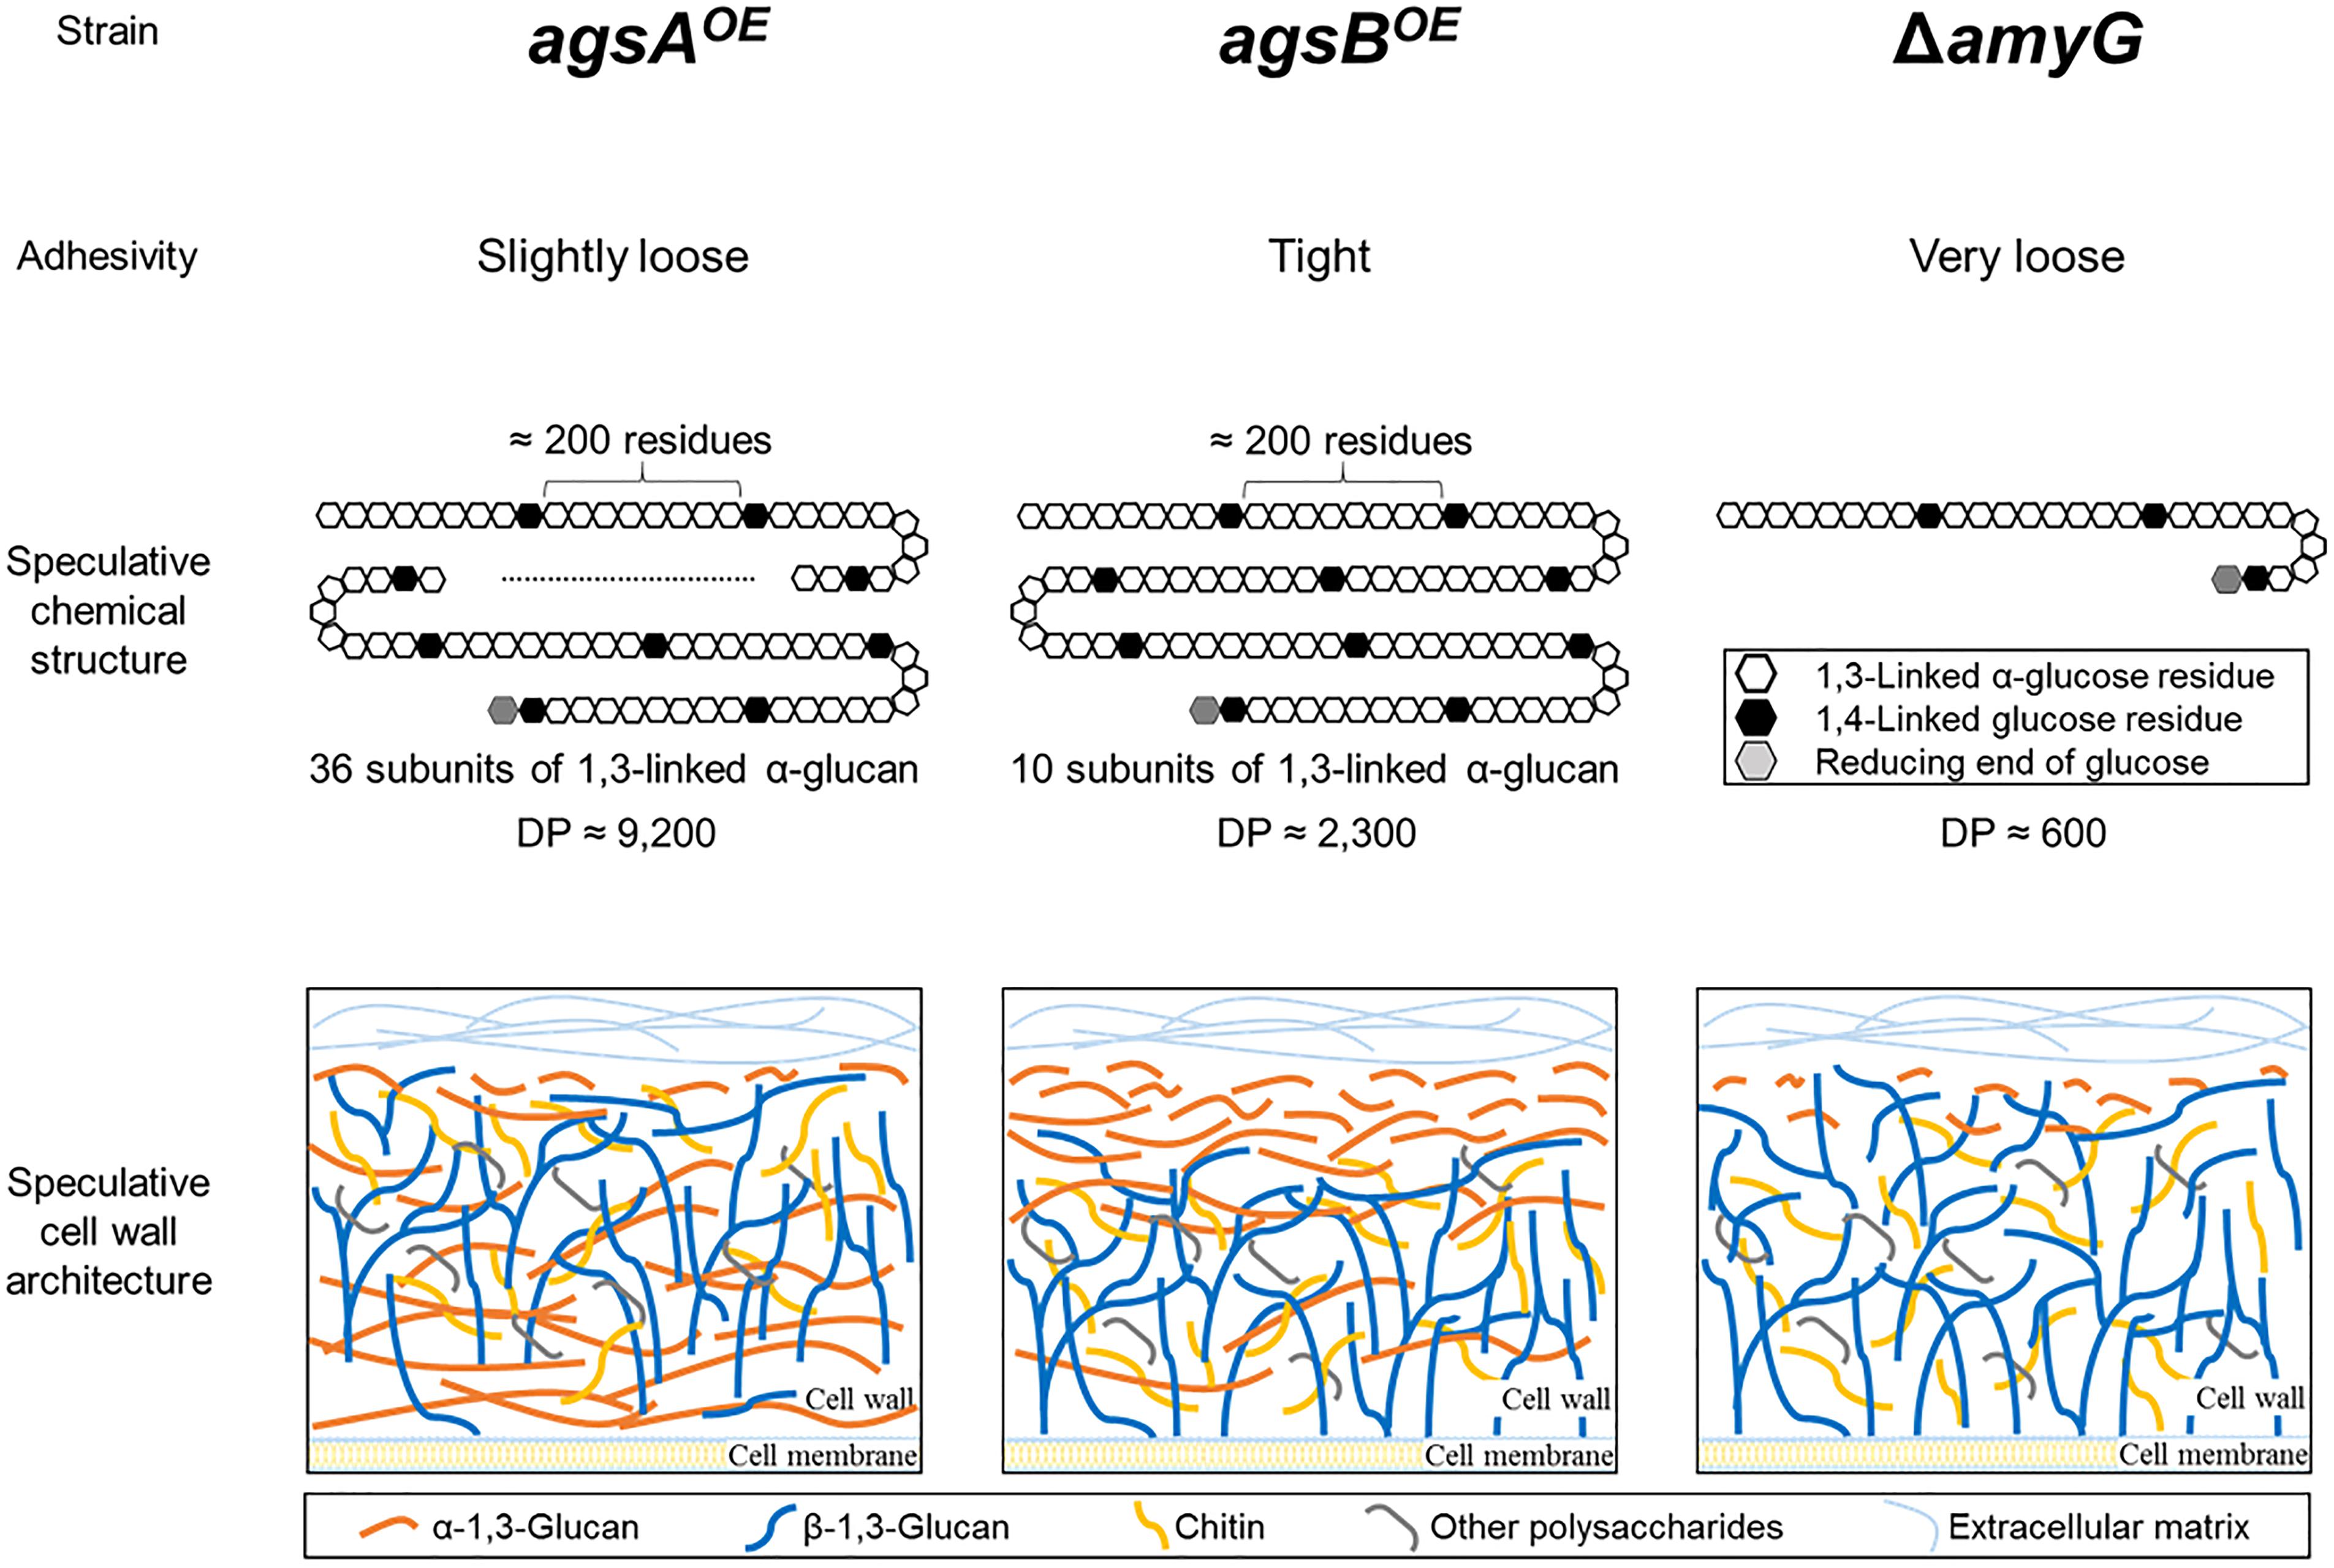
FIGURE 12. Speculative chemical structure of alkali-soluble glucans and cell wall architecture of the agsAOE, agsBOE, and ΔamyG strains of A. nidulans. The alkali-soluble glucan fraction from A. nidulans consists mainly of linear 1,3-linked α-glucan. 1,3-Linked α-glucan subunits (∼200 residues each) might be separated by short 1,4-linked α-glucan spacers. The degree of polymerization (DP) of the alkali-soluble glucans differ markedly among the agsAOE, agsBOE, and ΔamyG strains. The distribution of α-1,3-glucan in the cell wall might differ between the agsAOE (most in the inner layer and some in the outer layer) and agsBOE (outer layer) strains. In the ΔamyG strain, α-1,3-glucan was localized on the outermost layer of the cell wall although the amount of α-1,3-glucan was decreased.
The reason why the molecular mass of alkali-soluble glucan differed between the agsAOE and agsBOE strains remains unclear. α-1,3-Glucan synthase Ags1 of S. pombe contains three functional domains: extracellular, intracellular, and a multipass transmembrane domain. Both AgsA and AgsB of A. nidulans are also predicted to contain these domains (He et al., 2014). 1,3-Linked α-glucan chains are predicted to be synthesized by the intracellular domain (probably with 1,4-linked α-glucan primer), and then exported outside of the cell through the transmembrane domain. Exported α-1,3-glucan chains are interconnected by the transglycosylation reaction catalyzed by the extracellular domain, resulting in mature α-1,3-glucan (Yoshimi et al., 2017). The temperature-sensitive mutant S. pombe strain ags1-1ts, which has the mutation G696S in the extracellular domain, synthesizes immature shortened α-glucan chains because of the probable defect in transglycosylation (Grün et al., 2005). Although G696 is conserved in both AgsA and AgsB of A. nidulans, the surrounding residues are not highly conserved (Miyazawa et al., unpublished data). The difference in the molecular weight of alkali-soluble glucan between the agsAOE and agsBOE strains might depend on the functional difference between the extracellular domains of the two synthases. Further biochemical and enzymatic characterization of AgsA and AgsB is necessary to understand these differences.
Fluorescence microscopy suggests that α-1,3-glucans of the wild-type and agsBOE strains are localized in the outermost layer of the cell wall, but most α-1,3-glucan of the agsAOE strain is localized in an inner layer of the cell wall (Figures 7, 8). This difference might be explained by the probable differences in (1) enzymatic properties of AgsA and AgsB, which may directly affect the spatial localization of α-1,3-glucan, and (2) physicochemical properties (such as solubility in the water phase), which may be affected by the molecular mass of α-1,3-glucan. Cell wall polysaccharides are generally synthesized at the hyphal tips during apical growth (Riquelme et al., 2018). After the biosynthesis of α-1,3-glucan on the plasma membrane, sugar chains are released to the outside of the membrane, insolubilized and immobilized to be a part of the cell wall (Latgé and Beauvais, 2014). Larger polysaccharides are usually less soluble than the smaller ones (Guo et al., 2017). Therefore, larger α-1,3-glucan molecules might be localized in the inner layer of the cell wall, whereas smaller ones might be rather distributed toward the outer layer of the cell wall (Figure 12). The proportion of low-molecular-mass alkali-soluble glucan was greater in the agsBOE cells than in the agsAOE cells (Figure 6A), which might result in more α-1,3-glucan being displayed in the outermost layer of the agsBOE cell wall (Figure 7). The weak fluorescence of AGBD-GFP observed along the outline of agsAOE cells without α-1,3-glucanase treatment (Figure 7) might be attributable to cell-surface α-1,3-glucan (with lower molecular mass values) that contributes to the loose hyphal aggregation (Figure 2C). AGBD-GFP labeling of α-1,3-glucan in the ΔamyG strain (Figure 11D) might be also consistent with the second possibility (Figure 12). Recently, the molecular architecture of the cell wall of A. fumigatus was determined by using solid-state NMR, and α-1,3-glucans were localized in the outer shell and inner domain of the cell wall (Kang et al., 2018). In wild-type A. nidulans, the distribution of α-1,3-glucan synthesized by the two synthases differed in the cell wall; this might depend on the molecular mass of the α-1,3-glucan. Further study of the relationship between localization and physicochemical properties (such as solubility) of α-1,3-glucan with different molecular masses is necessary.
In fungi, not only α-1,3-glucan synthases but also intracellular α-amylases and UTP-glucose-1-phosphate uridylyltransferase are involved in biosynthesis of α-1,3-glucan (Marion et al., 2006; Camacho et al., 2012; He et al., 2014). Intracellular amylases seem to synthesize α-1,4-oligoglucan primers for α-1,3-glucan synthesis (Marion et al., 2006; van der Kaaij et al., 2007; Camacho et al., 2012). The intracellular α-amylase AmyD of A. niger hydrolyzes starch and produces mainly maltotriose (van der Kaaij et al., 2007). Disruption of amyG in A. nidulans significantly decreases the amount of α-1,3-glucan in the cell wall (He et al., 2014). The alkali-soluble glucan in A. wentii contains short spacers of 1,4-linked α-glucose residues that separate α-1,3-glucan subunits (Choma et al., 2013). We determined that the alkali-soluble glucan of A. nidulans consists of about 90% 1,3-linked α-glucan with a small amount of Smith-degradable glucan (maybe 1,4-linked α-glucan); the subunits of α-1,3-glucan may be separated by 1,4-linked glucan (Figures 6, 12 and Table 2). The molecular mass of alkali-soluble glucan derived from the A. nidulans ΔamyG strain was 93.5 kDa, which was significantly smaller than that from the parental strain (Table 3). AmyG might synthesize the spacer structure for α-1,3-glucan. The molecular weight of Smith-degraded alkali-soluble glucan from the A. nidulans ΔamyG strain was smaller than that of non-degraded alkali-soluble glucan (our preliminary data), implying that an unknown factor involved in spacer synthesis besides AmyG is present in A. nidulans. Further study is needed to reveal the mechanism of α-1,3-glucan biosynthesis in filamentous fungi.
In A. nidulans, transcription of the α-1,3-glucan synthase genes is regulated mainly by the cell wall integrity signaling (CWIS) pathway during vegetative growth (Fujioka et al., 2007). This pathway contains a mitogen activated protein (MAP) kinase, MpkA, which regulates transcription of α-1,3-glucan synthase genes via the transcription factor RlmA (Fujioka et al., 2007). We observed the expression of agsA and agsB in Hülle cells during sexual development (Figure 9), and AGBD-GFP staining revealed that Hülle cells contained α-1,3-glucan (Figure 10). No agsB expression was detected in hyphal cells during sexual development (data not shown). Therefore, the expression of agsA and agsB might be regulated by a signaling pathway other than the CWIS pathway. In A. nidulans, the α-1,3-glucanase gene mutA is expressed in Hülle cells (Wei et al., 2001), the hexose transporter gene hxtA is expressed in Hülle cells and vegetative hyphae during carbon starvation (Wei et al., 2004), and α-1,3-glucan seems to be a storage polysaccharide for cleistothecium formation (Zonneveld, 1972). Based on these data, α-1,3-glucan might have the following temporal and spatial localization: (1) synthesis in vegetative hyphae; (2) degradation in vegetative hyphae under starvation; (3) synthesis in Hülle cells; and (4) consumption to develop cleistothecia.
Fontaine et al. (2010) reported that α-1,3-glucan has a role in aggregation of germinating conidia in A. fumigatus, and we reported that α-1,3-glucan in the cell wall contributes to the adhesion of A. nidulans hyphae in liquid culture (Yoshimi et al., 2013). Since the disruption of the amyG gene leads to smaller hyphal pellets than in a wild-type A. nidulans strain (He et al., 2014), formation of hyphal pellets is expected to depend on the amount of α-1,3-glucan. We attributed the phenotypic difference of hyphal pellets between the agsAOE and agsBOE strains in liquid culture to the difference in the molecular mass (Table 2) and localization of alkali-soluble α-1,3-glucan in the cell wall (Figures 7, 8). The A. nidulans ΔamyG strain formed smaller hyphal pellets, and the molecular mass of its α-1,3-glucan was considerably smaller than that of the wild type. α-1,3-Glucan of the ΔamyG strain was still labeled with AGBD-GFP. Thus, this smaller α-1,3-glucan localized in the outermost layer of the cell wall still showed weak adhesive properties, allowing the formation of hyphal pellets (Figure 11). Therefore, the shape and size of hyphal pellets seem to be controlled not only by the amount but also by the molecular mass and localization of α-1,3-glucan in the cell wall. Although we demonstrated that the two α-1,3-glucan synthases synthesize α-1,3-glucans with different molecular masses, the mechanisms by which the two enzymes regulate the molecular mass of α-1,3-glucan remain unclear. The mechanisms that regulate the spatial localization of α-1,3-glucan in the cell wall also need to be investigated in the future. Further studies to determine the molecular mechanism of α-1,3-glucan biosynthesis are underway.
KM, AY, and KA conceived and designed the experiments. KM, AY, and MS constructed fungal mutants. KM and ShK performed methylation analysis and 13C NMR. AS carried out the Southern blot analysis. AK and SY produced α-1,3-glucanase, mutan from S. mutans, and AGBD-GFP. SaK and TI produced mutan from S. salivarius. KM performed most experiments and analyzed the data.
This work was supported by a Grant-in-Aid for Scientific Research (B) [26292037] and (C) [18K05384] from the Japan Society for the Promotion of Science (JSPS) and a Grant-in-Aid for JSPS Fellows [18J11870]. This work was also supported from the Institute for Fermentation, Osaka (Grant No. L-2018-2-014).
The authors declare that the research was conducted in the absence of any commercial or financial relationships that could be construed as a potential conflict of interest.
We are grateful to Prof. Yogo Chiba (Fukushima University) and Prof. Yoji Kato (Hirosaki University) for kindly providing dextran standards. We also grateful to Associate professor Toshikazu Komoda (Miyagi University) for operating NMR.
The Supplementary Material for this article can be found online at: https://www.frontiersin.org/articles/10.3389/fmicb.2018.02623/full#supplementary-material
Beauvais, A., Maubon, D., Park, S., Morelle, W., Tanguy, M., Huerre, M., et al. (2005). Two α(1-3) glucan synthases with different functions in Aspergillus fumigatus. Appl. Environ. Microbiol. 71, 1531–1538. doi: 10.1128/AEM.71.3.1531-1538.2005
Beauvais, A., Silvia, B., Olaf, K., Céline, F., Viviane, B., Christine, H., et al. (2013). Deletion of the α-(1,3)-glucan synthase genes induces a restructuring of the conidial cell wall responsible for the avirulence of Aspergillus fumigatus. PLoS Pathog. 9:e1003716. doi: 10.1371/journal.ppat.1003716
Bernard, M., and Latgé, J. P. (2001). Aspergillus fumigatus cell wall: composition and biosynthesis. Med. Mycol. 39(Suppl. 1), 9–17. doi: 10.1080/mmy.39.1.9.17
Camacho, E., Sepulveda, V. E., Goldman, W. E., San-Blas, G., and Niño-Vega, G. A. (2012). Expression of Paracoccidioides brasiliensis AMY1 in a Histoplasma capsulatum amy1 mutant, relates an α-(1,4)-amylase to cell wall α-(1,3)-glucan synthesis. PLoS One 7:e50201. doi: 10.1371/journal.pone.0050201
Choma, A., Wiater, A., Komaniecka, I., Paduch, R., Pleszczyńska, M., and Szczodrak, J. (2013). Chemical characterization of a water insoluble (1 → 3)-α-D-glucan from an alkaline extract of Aspergillus wentii. Carbohydr. Polym. 91, 603–608. doi: 10.1016/j.carbpol.2012.08.060
Ciucanu, I., and Kerek, F. (1984). A simple and rapid method for the permethylation of carbohydrates. Carbohydr. Res. 131, 209–217. doi: 10.1016/0008-6215(84)85242-8
Damveld, R. A., Arentshorst, M., VanKuyk, P. A., Klis, F. M., van den Hondel, C. A., and Ram, A. F. J. (2005). Expression of agsA, one of five 1,3-α-D-glucan synthase-encoding genes in Aspergillus niger, is induced in response to cell wall stress. Fungal Genet. Biol. 42, 165–177. doi: 10.1016/j.fgb.2004.11.006
Dichtl, K., Samantaray, S., Aimanianda, V., Zhu, Z., Prévost, M. C., Latgé, J. P., et al. (2015). Aspergillus fumigatus devoid of cell wall β-1,3-glucan is viable, massively sheds galactomannan and is killed by septum formation inhibitors. Mol. Microbiol. 95, 458–471. doi: 10.1111/mmi.12877
Fontaine, T., Beauvais, A., Loussert, C., Thevenard, B., Fulgsang, C. C., Ohno, N., et al. (2010). Cell wall α1-3glucans induce the aggregation of germinating conidia of Aspergillus fumigatus. Fungal Genet. Biol. 47, 707–712. doi: 10.1016/j.fgb.2010.04.006
Fontaine, T., Simenel, C., Dubreucq, G., Adam, O., Delepierre, M., Lemoine, J., et al. (2000). Molecular organization of the alkali-insoluble fraction of Aspergillus fumigatus cell wall. J. Biol. Chem. 275, 27594–27607. doi: 10.1074/jbc.M909975199
Fujikawa, T., Kuga, Y., Yano, S., Yoshimi, A., Tachiki, T., Abe, K., et al. (2009). Dynamics of cell wall components of Magnaporthe grisea during infectious structure development. Mol. Microbiol. 73, 553–570. doi: 10.1111/j.1365-2958.2009.06786.x
Fujikawa, T., Sakaguchi, A., Nishizawa, Y., Kouzai, Y., Minami, E., Yano, S., et al. (2012). Surface α-1,3-glucan facilitates fungal stealth infection by interfering with innate immunity in plants. PLoS Pathog. 8:e1002882. doi: 10.1371/journal.ppat.1002882
Fujioka, T., Mizutani, O., Furukawa, K., Sato, N., Yoshimi, A., Yamagata, Y., et al. (2007). MpkA-dependent and -independent cell wall integrity signaling in Aspergillus nidulans. Eukaryot. Cell 6, 1497–1510. doi: 10.1128/EC.00281-06
Furukawa, K., Yoshimi, A., Furukawa, T., Hoshi, Y., Hagiwara, D., Sato, N., et al. (2007). Novel reporter gene expression systems for monitoring activation of the Aspergillus nidulans HOG pathway. Biosci. Biotechnol. Biochem. 71, 1724–1730. doi: 10.1271/bbb.70131
Goldstein, I. J., Hay, G. W., Lewis, B. A., and Smith, F. (1965). “Controlled degradation of polysaccharides by periodate oxidation, reduction, and hydrolysis,” in Methods in Carbohydrate Chemistry, eds R. L. Whistler, J. N. BeMiller, and M. L. V. Wolfrom (New York, NY: Academic Press), 361–370.
Grün, C. H., Hochstenbach, F., Humbel, B. M., Verkleij, A. J., Sietsma, J. H., Klis, F. M., et al. (2005). The structure of cell wall α-glucan from fission yeast. Glycobiology 15, 245–257. doi: 10.1093/glycob/cwi002
Guo, M. Q., Hu, X., and Wang, C. (2017). “Polysaccharides: structure and solubility,” in Solubility of Polysaccharides, ed. Z. Xu (London: IntechOpen), 7–21. doi: 10.5772/intechopen.71570
Hagiwara, D., Asano, Y., Marui, J., Furukawa, K., Kanamaru, K., Kato, M., et al. (2007). The SskA and SrrA response regulators are implicated in oxidative stress responses of hyphae and asexual spores in the phosphorelay signaling network of Aspergillus nidulans. Biosci. Biotechnol. Biochem. 71, 1003–1014. doi: 10.1271/bbb.60665
Hay, G. W., Lewis, B. A., and Smith, F. (1965). “Periodate oxidation of polysaccharides: general procedures,” in Methods in Carbohydrate Chemistry, eds R. L. Whistler, J. N. BeMiller, and M. L. V. Wolfrom (New York, NY: Academic Press), 357–361.
He, X., Li, S., and Kaminskyj, S. G. W. (2014). Characterization of Aspergillus nidulans α-glucan synthesis: roles for two synthases and two amylases. Mol. Microbiol. 91, 579–595. doi: 10.1111/mmi.12480
Henry, C., Latgé, J. P., and Beauvais, A. (2012). α1,3 Glucans are dispensable in Aspergillus fumigatus. Eukaryot. Cell 11, 26–29. doi: 10.1128/EC.0527011
Kang, X., Kirui, A., Muszy, A., Widanage, M. C. D., Azadi, P., Wang, P., et al. (2018). Molecular architecture of fungal cell walls revealed by solid-state NMR. Nat. Commun. 9:2747. doi: 10.1038/s41467-018-05199-0
Latgé, J. P. (2010). Tasting the fungal cell wall. Cell. Microbiol. 12, 863–872. doi: 10.1111/j.1462-5822.2010.01474.x
Latgé, J. P., and Beauvais, A. (2014). Functional duality of the cell wall. Curr. Opin. Microbiol. 20, 111–117. doi: 10.1016/j.mib.2014.05.009
Lee, M. J., and Sheppard, D. C. (2016). Recent advances in the understanding of the Aspergillus fumigatus cell wall. J. Microbiol. 54, 232–242. doi: 10.1007/s12275-016-6045-4
Marion, C. L., Rappleye, C. A., Engle, J. T., and Goldman, W. E. (2006). An α-(1,4)-amylase is essential for α-(1,3)-glucan production and virulence in Histoplasma capsulatum. Mol. Microbiol. 62, 970–983. doi: 10.1111/j.1365-2958.2006.05436.x
Maubon, D., Park, S., Tanguy, M., Huerre, M., Schmitt, C., Prévost, M. C., et al. (2006). AGS3, an α(1-3)glucan synthase gene family member of Aspergillus fumigatus, modulates mycelium growth in the lung of experimentally infected mice. Fungal Genet. Biol. 43, 366–375. doi: 10.1016/j.fgb.2006.01.006
Miyazawa, K., Yoshimi, A., Zhang, S., Sano, M., Nakayama, M., Gomi, K., et al. (2016). Increased enzyme production under liquid culture conditions in the industrial fungus Aspergillus oryzae by disruption of the genes encoding cell wall α-1,3-glucan synthase. Biosci. Biotechnol. Biochem. 80, 1853–1863. doi: 10.1080/09168451.2016.1209968
Muszkieta, L., Aimanianda, V., Mellado, E., Gribaldo, S., Alcàzar-Fuoli, L., Szewczyk, E., et al. (2014). Deciphering the role of the chitin synthase families 1 and 2 in the in vivo and in vitro growth of Aspergillus fumigatus by multiple gene targeting deletion. Cell. Microbiol. 16, 1784–1805. doi: 10.1111/cmi.12326
Puanglek, S., Kimura, S., Enomoto-Rogers, Y., Kabe, T., Yoshida, M., Wada, M., et al. (2016). In vitro synthesis of linear α-1,3-glucan and chemical modification to ester derivatives exhibiting outstanding thermal properties. Sci. Rep. 6:30479. doi: 10.1038/srep30479
Rappleye, C. A., Eissenberg, L. G., Goldman, W. E., Rappleye, C. A., Eissenberg, L. G., and Goldman, W. E. (2007). Histoplasma capsulatum α-(1,3)-glucan blocks innate immune recognition by the β-glucan receptor. Proc. Natl. Acad. Sci. U.S.A. 2006, 1–6. doi: 10.1073/pnas.0609848104
Rappleye, C. A., Engle, J. T., and Goldman, W. E. (2004). RNA interference in Histoplasma capsulatum demonstrates a role for α-(1,3)-glucan in virulence. Mol. Microbiol. 53, 153–165. doi: 10.1111/j.1365-2958.2004.04131.x
Riquelme, M., Aguirre, J., Bartnicki-García, S., Braus, G. H., Feldbrügge, M., Fleig, U., et al. (2018). Fungal morphogenesis, from the polarized growth of hyphae to complex reproduction and infection structures. Microbiol. Mol. Biol. Rev. 82:e0008-17. doi: 10.1128/MMBR.00068-17
Suyotha, W., Yano, S., Takagi, K., Rattanakit-Chandet, N., Tachiki, T., and Wakayama, M. (2013). Domain structure and function of α-1,3-glucanase from Bacillus circulans KA-304, an enzyme essential for degrading basidiomycete cell walls. Biosci. Biotechnol. Biochem. 77, 639–647. doi: 10.1271/bbb.120900
van der Kaaij, R. M., Janeček,Š, van der Maarel, M. J. E. C., and Dijkhuizen, L. (2007). Phylogenetic and biochemical characterization of a novel cluster of intracellular fungal α-amylase enzymes. Microbiology 153, 4003–4015. doi: 10.1099/mic.0.2007/008607-0
Wei, H., Scherer, M., Singh, A., Liese, R., and Fischer, R. (2001). Aspergillus nidulans α-1,3 glucanase (mutanase), mutA, is expressed during sexual development and mobilizes mutan. Fungal Genet. Biol. 34, 217–227. doi: 10.1006/fgbi.2001.1303
Wei, H., Vienken, K., Weber, R., Bunting, S., Requena, N., and Fischer, R. (2004). A putative high affinity hexose transporter, hxtA, of Aspergillus nidulans is induced in vegetative hyphae upon starvation and in ascogenous hyphae during cleistothecium formation. Fungal Genet. Biol. 41, 148–156. doi: 10.1016/j.fgb.2003.10.006
Yano, S., Wakayama, M., and Tachiki, T. (2006). Cloning and expression of an α-1,3-glucanase gene from Bacillus circulans KA-304: the enzyme participates in protoplast formation of Schizophyllum commune. Biosci. Biotechnol. Biochem. 70, 1754–1763. doi: 10.1271/bbb.60095
Yoshimi, A., Fujioka, T., Mizutani, O., Marui, J., Hagiwara, D., and Abe, K. (2015). Mitogen-activated protein kinases MpkA and MpkB independently affect micafungin sensitivity in Aspergillus nidulans. Biosci. Biotechnol. Biochem. 79, 836–844. doi: 10.1080/09168451.2014.998619
Yoshimi, A., Miyazawa, K., and Abe, K. (2016). Cell wall structure and biogenesis in Aspergillus species. Biosci. Biotechnol. Biochem. 80, 1700–1711. doi: 10.1080/09168451.2016.1177446
Yoshimi, A., Miyazawa, K., and Abe, K. (2017). Function and biosynthesis of cell wall α-1,3-glucan in fungi. J. Fungi 3:63. doi: 10.3390/jof3040063
Yoshimi, A., Sano, M., Inaba, A., Kokubun, Y., Fujioka, T., Mizutani, O., et al. (2013). Functional analysis of the α-1,3-glucan synthase genes agsA and agsB in Aspergillus nidulans: AgsB is the major α-1,3-glucan synthase in this fungus. PLoS One 8:e54893. doi: 10.1371/journal.pone.0054893
Zhang, S., Ban, A., Ebara, N., Mizutani, O., Tanaka, M., Shintani, T., et al. (2017a). Self-excising Cre/mutant lox marker recycling system for multiple gene integrations and consecutive gene deletions in Aspergillus oryzae. J. Biosci. Bioeng. 123, 403–411. doi: 10.1016/j.jbiosc.2016.11.001
Zhang, S., Sato, H., Ichinose, S., Tanaka, M., Miyazawa, K., Yoshimi, A., et al. (2017b). cell wall α-1,3-glucan prevents α-amylase adsorption onto fungal cell in submerged culture of Aspergillus oryzae. J. Biosci. Bioeng. 124, 47–53. doi: 10.1016/j.jbiosc.2017.02.013
Keywords: cell wall, α-1, 3-glucan, Aspergillus nidulans, hyphal aggregations, alkali-soluble glucan
Citation: Miyazawa K, Yoshimi A, Kasahara S, Sugahara A, Koizumi A, Yano S, Kimura S, Iwata T, Sano M and Abe K (2018) Molecular Mass and Localization of α-1,3-Glucan in Cell Wall Control the Degree of Hyphal Aggregation in Liquid Culture of Aspergillus nidulans. Front. Microbiol. 9:2623. doi: 10.3389/fmicb.2018.02623
Received: 29 June 2018; Accepted: 15 October 2018;
Published: 06 November 2018.
Edited by:
Raffaella Balestrini, Consiglio Nazionale delle Ricerche (CNR), ItalyReviewed by:
Jean Marie François, UMR5504 Laboratoire d’Ingénierie des Systèmes Biologiques et des Procédés (LISBP), FranceCopyright © 2018 Miyazawa, Yoshimi, Kasahara, Sugahara, Koizumi, Yano, Kimura, Iwata, Sano and Abe. This is an open-access article distributed under the terms of the Creative Commons Attribution License (CC BY). The use, distribution or reproduction in other forums is permitted, provided the original author(s) and the copyright owner(s) are credited and that the original publication in this journal is cited, in accordance with accepted academic practice. No use, distribution or reproduction is permitted which does not comply with these terms.
*Correspondence: Keietsu Abe, a2FiZUBuaWNoZS50b2hva3UuYWMuanA=
Disclaimer: All claims expressed in this article are solely those of the authors and do not necessarily represent those of their affiliated organizations, or those of the publisher, the editors and the reviewers. Any product that may be evaluated in this article or claim that may be made by its manufacturer is not guaranteed or endorsed by the publisher.
Research integrity at Frontiers

Learn more about the work of our research integrity team to safeguard the quality of each article we publish.