 Aubrey Berry
 Chia-wei Wu
 Amanda J. Venturino
 Adel M. Talaat
- The Laboratory of Bacterial Genomics, Department of Pathobiological Sciences, University of Wisconsin–Madison, Madison, WI, United States
Background: Mycobacterium avium subsp. paratuberculosis (M. paratuberculosis) is the causative agent of Johne’s disease, a chronic enteric infection of ruminants. Infection occurs within the first few months of life but remains subclinical for an average of 2–5 years. Current diagnostics to detect early subclinical infections lack diagnostic sensitivity, which hinders disease control resulting in significant economic losses to the dairy industry worldwide. The pathophysiology of early infection with M. paratuberculosis is still not well understood and represents a key hurdle toward the development of better diagnostics.
Methods: The present study employed a large-scale RNA-Sequencing technology to better understand early stages of M. paratuberculosis infection and immunization. Specifically, gene expression profiles of peripheral blood mononuclear cells (PBMCs) from infected or vaccinated goats were compared to controls.
Results: When compared to the naïve control goats, we identified a large number of transcripts (N = 226, 1018, 1714) that were differentially expressed in the M. paratuberculosis-infected goats, goats vaccinated with live attenuated or inactivated vaccines. There were also 1133 differentially expressed (DE) transcripts between vaccinated goats and infected ones. Bioinformatics evaluation of the DE genes indicated the regulation of a large number of genes with immunity and inflammatory functions including IL-18BP, IFN-γ, IL-17A, NOS2, LIPG, and IL-22. Interestingly, a large number of goat genes (N = 667) were regulated whether live or inactivated vaccine were used. Some of the regulated genes (e.g., IL-17A, IFN-γ) continued its unique transcriptional profile up to 12 months post-challenge.
Conclusion: Overall, transcriptome analysis of infected and/or immunized goats identified potential targets for developing early diagnostics for Johne’s disease and a potential approach to differentiate infected from vaccinated animals. A similar approach could be used to analyze later stages of Johne’s disease or other chronic infections.
Introduction
Johne’s disease, caused by Mycobacterium avium subsp. paratuberculosis (M. paratuberculosis) is a chronic progressive gastroenteritis of ruminants. Clinical signs of the disease include chronic diarrhea, weight loss, low milk yield, and higher mortality than uninfected herds (Ott et al., 1999; Bush et al., 2006; Singh et al., 2007). Johne’s disease causes severe economic losses to the dairy industry worldwide, with estimated losses of $200-$250 million a year in the US alone (Ott et al., 1999). Additionally, M. paratuberculosis has been implicated as a potential factor in Crohn’s disease in humans (Waddell et al., 2016). In ruminants, infection primarily occurs early in life through the ingestion of M. paratuberculosis contaminated feces, colostrum, or milk. Although infection mainly begins in neonates, clinical signs do not appear until 2–5 years of age (Tiwari et al., 2006). The pathophysiology of M. paratuberculosis persistence and survival for years in the host before clinical signs develop is not well understood. In the subclinical phase of M. paratuberculosis infection, a cell-mediated immune response is driven by Th1 cytokines with minimal humoral response elicited (Magombedze et al., 2014). M. paratuberculosis is known to be able to survive and replicate within host macrophages by subverting macrophage function through mechanisms such as blocking maturation of phagolysosomes (Souza et al., 2013). Progression from subclinical to clinical disease results in a switch to a predominantly humoral response, driven by Th2 cytokines, which is ineffective at controlling the disease (Magombedze et al., 2014).
Current diagnostic tests, such as fecal culture and ELISA, have poor sensitivity (from 19 to 53%) for detection of the subclinical phase of infection (Sockett et al., 1992; McKenna et al., 2005). During this subclinical phase, the host is intermittently shedding M. paratuberculosis in feces, contaminating the environment and transmitting the pathogen to progeny and others in the herd (Whittington and Sergeant, 2001). Being able to detect infection early on, would allow for more effective disease control within herds. Biomarkers are increasingly examined for other chronic diseases such as M. tuberculosis (Walzl et al., 2011) and have the ability to serve as a detection tool for different stages of disease. Peripheral blood mononuclear cells (PBMCs) have been shown to be a predictor of infection and inflammatory disease (Marteau et al., 2005). Previous studies investigating the gene expression profiles of PBMCs have shown distinct differences between healthy cattle and those with chronic M. paratuberculosis infection (Coussens et al., 2004; Verschoor et al., 2010; David et al., 2014). A study using microarrays to identify gene expression in whole blood from calves 3 months post- infection found several putative biomarkers with roles in the immune response (David et al., 2014). Other studies have focused on cows at 6 months or later times post-infection (PI) (Coussens et al., 2004; Verschoor et al., 2010; David et al., 2014). However, a caveat to these studies is that they all detected subclinically infected cows by use of serum ELISA tests which only become positive later in the course of infection. In the present study, we examined gene expression profiles at a much earlier stage (30 days PI) using an experimental infection model. Understanding differences in gene expression profiles will not only improve understanding of the pathophysiology of disease progression but will also allow the identification of novel targets for earlier diagnosis of the subclinical stage of M. paratuberculosis infection.
While several other studies have investigated the PBMC transcriptome of cattle infected with M. paratuberculosis, this is the first such analysis in goats. Goats are increasingly used as a small ruminant model for Johne’s disease (Hines et al., 2007, 2014; Shippy et al., 2017) and, therefore, understanding the host’s response to infection and differences among ruminant species is vital. One major complication of our preliminary transcriptome analysis of goats (vs. cows) lied in the lack of a fully annotated genome. The ∼2.66-Gb genome draft sequence of the goat (Capra hircus) was released in 2013 and was highly fragmented (Dong et al., 2013; Du et al., 2014). Annotation of the goat genome has been performed through GLEAN and, while many genes have been linked to the Bos taurus genome through ENSEMBL, many gaps in annotation remain (Lin et al., 2015). A combination of analyses from multiple sequencing platforms and scaffolding technologies significantly improved the assembly (Bickhart et al., 2017). The annotation is still highly dependent on the bovine genome and requires more studies such as transcriptomic analysis to improve. In this report, PBMC’s were collected throughout an ongoing Johne’s disease vaccine trial in goats (Shippy et al., 2017). RNA-Sequencing (RNA-Seq) was used to profile the PBMC transcriptomes of goats at 30 days PI or post-vaccination. Our results provided valuable information on differential gene expression in goats during the early subclinical stage of infection and the host response to vaccination by either a live-attenuated vaccine (LAV) or an inactivated vaccine (Mycopar®). These results can be used to identify potential transcripts as early diagnostic biomarkers of infection and to differentiate vaccinated from M. paratuberculosis-infected animals.
Materials and Methods
Animals
Approximately 1 week-old kids were purchased from a farm with no previous history of Johne’s disease. All study kids, and their dams, tested negative for M. paratuberculosis by ELISA for serum antibody (Paracheck®, Biocor Animal Health, Omaha, NE, United States). Additionally, fecal samples collected from the originating farm environment were negative for M. paratuberculosis by culture. All kids were housed in a restricted biosafety animal facility (BSL-2). All animal care was handled in accordance to the standards of the University of Wisconsin-Madison Animal Care and Use Committee. The kids were randomly assigned to one of four groups as shown in Table 1. One group of kids (n = 6 but only 4 used for transcriptome analysis) were vaccinated with a LAV construct [M. paratuberculosisΔlipN mutant (Wu et al., 2007)] at a dose of 1 × 10⁹ CFU/animal. The second groups of kids (n = 4) were vaccinated with the USDA-licensed inactivated vaccine (Mycopar®). A third group inoculated with PBS served as the vaccine control. Both vaccines and PBS were given subcutaneously. At 60 days post-vaccination, kids in these three groups were inoculated with M. paratuberculosis strain JTC1285 at a dose of 1 × 10⁸ CFU administered orally in the milk replacer for three consecutive days. A fourth group (n = 4), inoculated with PBS and not challenged with M. paratuberculosis served as a naïve control. Power analysis was used to determine group sizes (Chow et al., 2008) based on a pilot study by our group. Goat kids were monitored daily for signs of clinical disease and evaluated monthly for potential weight loss. A detailed report on the outcome of this vaccine/challenge study was previously published (Shippy et al., 2017).
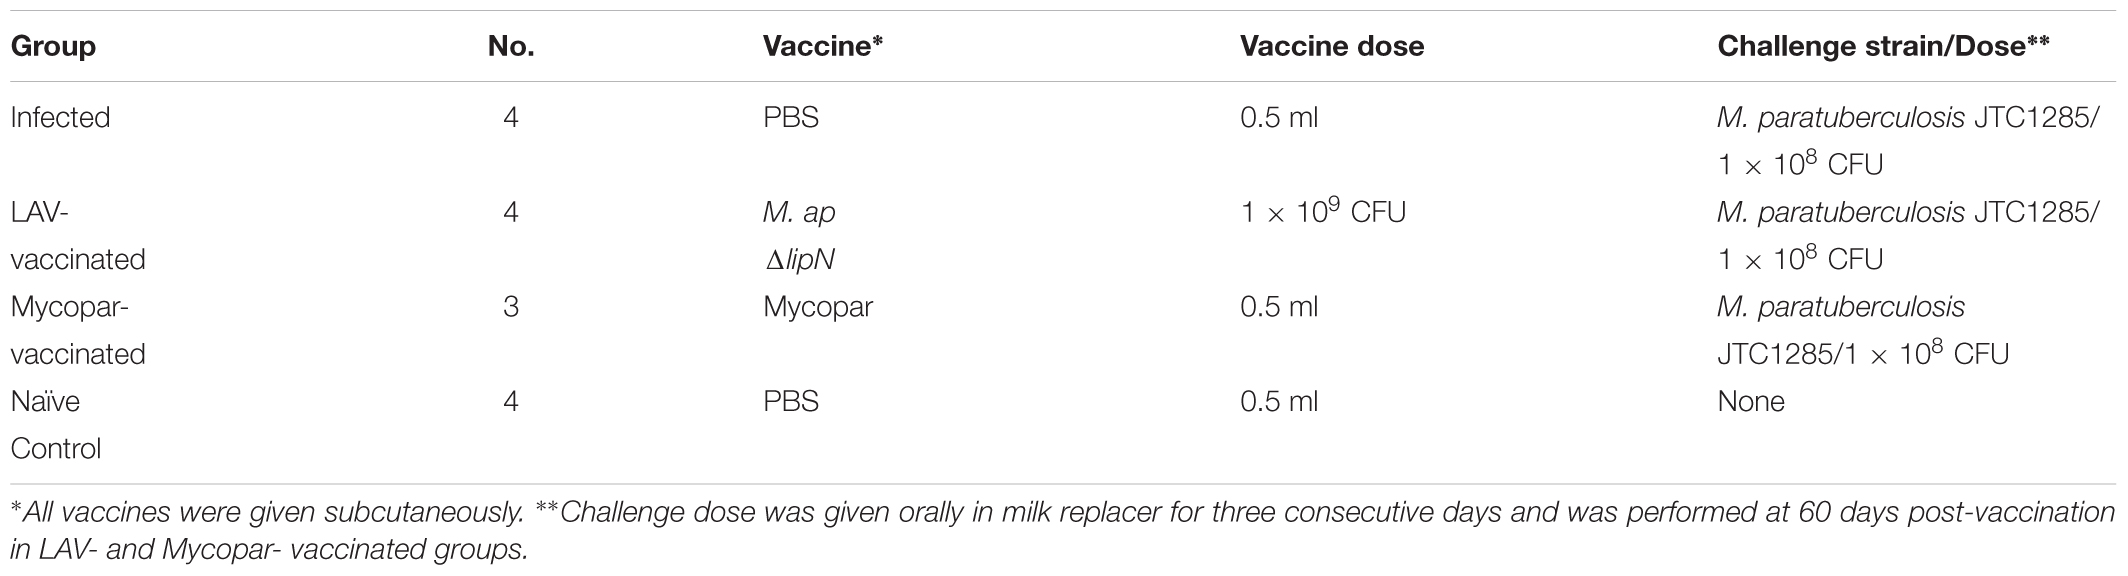
TABLE 1. Experimental groups used to collect RNA samples for transcriptome analysis.
Isolation of Blood Cells
Blood samples (10 ml) were collected from the jugular vein of goats into EDTA vacutainer tubes pre-vaccination, 1 week, 30 days, 60 days post-vaccination and 1 week post-challenge (for 3 groups), and then monthly for 12 months. Peripheral blood mononuclear cells (PBMC) were isolated using Histopaque®-1077 (Sigma–Aldrich®) with the following modifications. Anti-coagulated blood was diluted with an equal volume of RPMI-1640 medium (Sigma Aldrich®), layered over 10 ml of Histopaque®-1077, and centrifuged at 400 ×g for 30 min at room temperature. Following centrifugation, PBMC’s were aspirated from the interface and washed twice with RPMI-1640 medium. Residual red blood cells were lysed with 0.83% NH4Cl2. The PBMC’s were then resuspended in complete culture medium (RPMI-1640 containing 10% fetal bovine serum, 1% L-glutamine, 1% penicillin/streptomycin (final concentration 100 IU/ml), and 1% non-essential amino acids). Cell density was determined by use of 0.4% Trypan blue stain and a hemocytometer.
PBMC Stimulation and RNA Extraction
Peripheral blood mononuclear cells were plated at a density of 1 × 10⁶/well in 96 well plates with either medium alone (non-stimulated) or M. paratuberculosis whole cell lysate (WCL). The WCL was prepared by resuspending the centrifuged cell pellet of actively grown M. paratuberculosis (O.D. ∼1.0) in protein lysis buffer (100 mM Tris–Cl, 100 mM NaCl, 5 mM MgCl2, 1 mM PMSF, complete ultra-protease inhibitor cocktail (Roche, Indianapolis, IN, United States; pH 7.5) and bead-beating to homogenize (maximum pulse for 45 s for a total of 4 pulses; with cooling on ice for 30 s between pulses). The supernatant was then transferred to a new 1.5 ml tube and non-soluble material was removed by centrifugation at 10,000 ×g for 5 min at 4°C. The protein content of the supernatant was measured via the PierceTM BCA protein assay (Thermo Fisher Scientific), aliquoted and stored at -80°C until used. Final concentrations of WCL was 10 μg/ml. IL-2 was added to all wells at a concentration of 100 U/ml. Plates were incubated at 37°C with 5% CO2 for 24 h. Supernatants were then removed and cell pellets were stored in 100 μl TRIzol® and frozen at -80°C until used for RNA extraction. RNA was extracted from stimulated PBMC’s using TRIzol® and RNeasy® Mini Kit (Qiagen®) according to manufacturer’s directions for the remainder of the extraction. TURBO DNA-freeTM DNase Treatment (Ambion®) was used to eliminate residual genomic DNA. RNA quantity and quality was assessed using the RNA Pico Series Chip on the Bioanalyzer 2100 (Agilent). RNA integrity numbers (RINs) > 8 were obtained for all total RNA samples purified.
RNA Sequence Analysis
RNA-Sequencing (RNA-Seq) was performed by the University of Wisconsin–Madison Biotechnology Center on RNA extracted from WCL-stimulated PBMC’s from goats at 30 days post-vaccination, 30 days post-challenge (PBS vaccinated), or at the same time for the naïve control group (4 goats/biological replicates per group). A total of 1 μg of RNA was used as input for TruSeq RNA Sample Prep Rev.F (March 2014; Illumina). Paired-end RNA Sequencing was performed on the Illumina HiSeq 2000 sequencer according to manufacturer’s instructions.
Raw RNA-Seq reads were uploaded to CLC Genomics Workbench 8.5 (Qiagen, Redwood City, CA, United States) for processing. Two read files from one RNA sample were paired and trimmed. The ambiguous trim limit was set at 1 and quality trim limit was at 0.05. Reads shorter than 25 nucleotides were excluded. The trimmed sequences were then mapped to the reference genome sequence of Capra hircus assembly ARS1 (Bickhart et al., 2017) and read counts against the reference genome annotation tracks, generated with files, available at ftp://ftp.ncbi.nlm.nih.gov/genomes/Capra_hircus, were compiled and tabulated using the CLC Genomics Workbench NGS tools. The mapping parameters were set as follows: mismatch cost, 2; insertion and deletion cost, 3; length and similarity fraction, 0.8. Unique gene reads from each sample were exported from CLC Genomics Workbench and used for normalization and differential gene expression analysis with an R package, DESeq2 version 1.16.1 (Love et al., 2014). Transcripts that had an average of normalized read count < 3 in all three tested groups were excluded from the analysis (N = 11,541). Differentially expressed (DE) transcripts are defined as transcripts with fold changes ≥ 2.0 or ≤-2.0 (or Log2-transformed fold changes ≥ 1.0 or ≤-1.0), and p-value < 0.05 when compared to the naïve control group.
Gene ontology (GO) analysis was performed for the DE genes with agriGO, an automated tool to identify enriched GO terms, which is specially focused on agricultural species (Du et al., 2010). The gene products are categorized with respect to biological processes, cellular components, and molecular functions. Because the GO in the goat genome is poorly annotated, we chose the Bos taurus ENSEMBL genome B2G list (2010 version) as the reference genome. Goat genes (assembly ARS1) with an Entrez gene name were mapped to the counterparts in the bovine genome, resulting in a total gene list of 9,115 GO-annotated genes. Goat DE genes identified in the RNA-Seq analysis were also mapped to the bovine genome and used as query lists against the 9,115-gene reference. FDR was calculated using the Fisher test.
Network analysis was performed using the STRING database (Szklarczyk et al., 2015) with DE transcripts identified in this study. The input DE transcripts were treated as homologues of Bos taurus because of availability in the database.
Quantitative RT-PCR
cDNA was synthesized from each RNA sample using SuperScript III Reverse Transcriptase (Invitrogen, Waltham, MA, United States) and oligo(dT)12-18 Primer according to manufacturer’s instructions. Quantitative PCR (qPCR) assays were performed in triplicates for each cDNA sample. Primers were designed across adjacent exons in order to differentiate products from genomic DNA and cDNA (Supplementary Table S9). The GAPDH gene served as an internal control to normalize the data for the ΔΔCt relative quantitation method. The assays were performed on an Applied Biosystems StepOne Plus Real-Time PCR System (Foster City, CA, United States), and the cDNA amplifications were monitored by the measurement of SYBR Green fluorescence at a specific cycle threshold. Each reaction was carried out in a 20 μl volume that contained 10 μl of 2× GoTaq qPCR Master Mix (Promega, Madison, WI, United States), 5.0 μl of ddH2O, 0.5 μl of each primer (10 μm) and 4.0 μl of the template (100–150 ng/ul). The qPCR amplification process began with the temperature at 95°C for 2 min, followed by 40 cycles of the amplification process (95°C for 3 s, 60°C for 30 s). Subsequent to the cycling process, melting curves were generated by inclining the temperature from 60°C to 95°C at 0.3°C/s increments. With the exception of the infected group at 1 month post-challenge where two samples were used, cDNA samples from three animals in each group were included in the qPCR analysis. Average ΔΔCt values and standard errors of the mean (SEM) of the three measurements were calculated and transformed to linear fold change.
Results
Transcriptome Analysis of Goat Groups
The transcriptome analysis of goats infected with M. paratuberculosis and/or vaccinated LAV vaccine strain M. apΔlipN is a proportion of a larger study that examined the performance of this vaccine published earlier (Shippy et al., 2017). The transcriptome analysis is the focus of this report. The summary statistics of the RNA-Seq data for each replicate are shown in Table 2. Mean values of 58.88 million raw reads were generated per library (each RNA sample). Following trimming of reads based on read length, quality score and adapter sequences, an average of 20.04 million paired reads remained. Alignment of the trimmed RNA-Seq reads to the Capra hircus reference genome yielded mean values per library of 18.71 million paired reads (93.32%) mapped to unique locations.
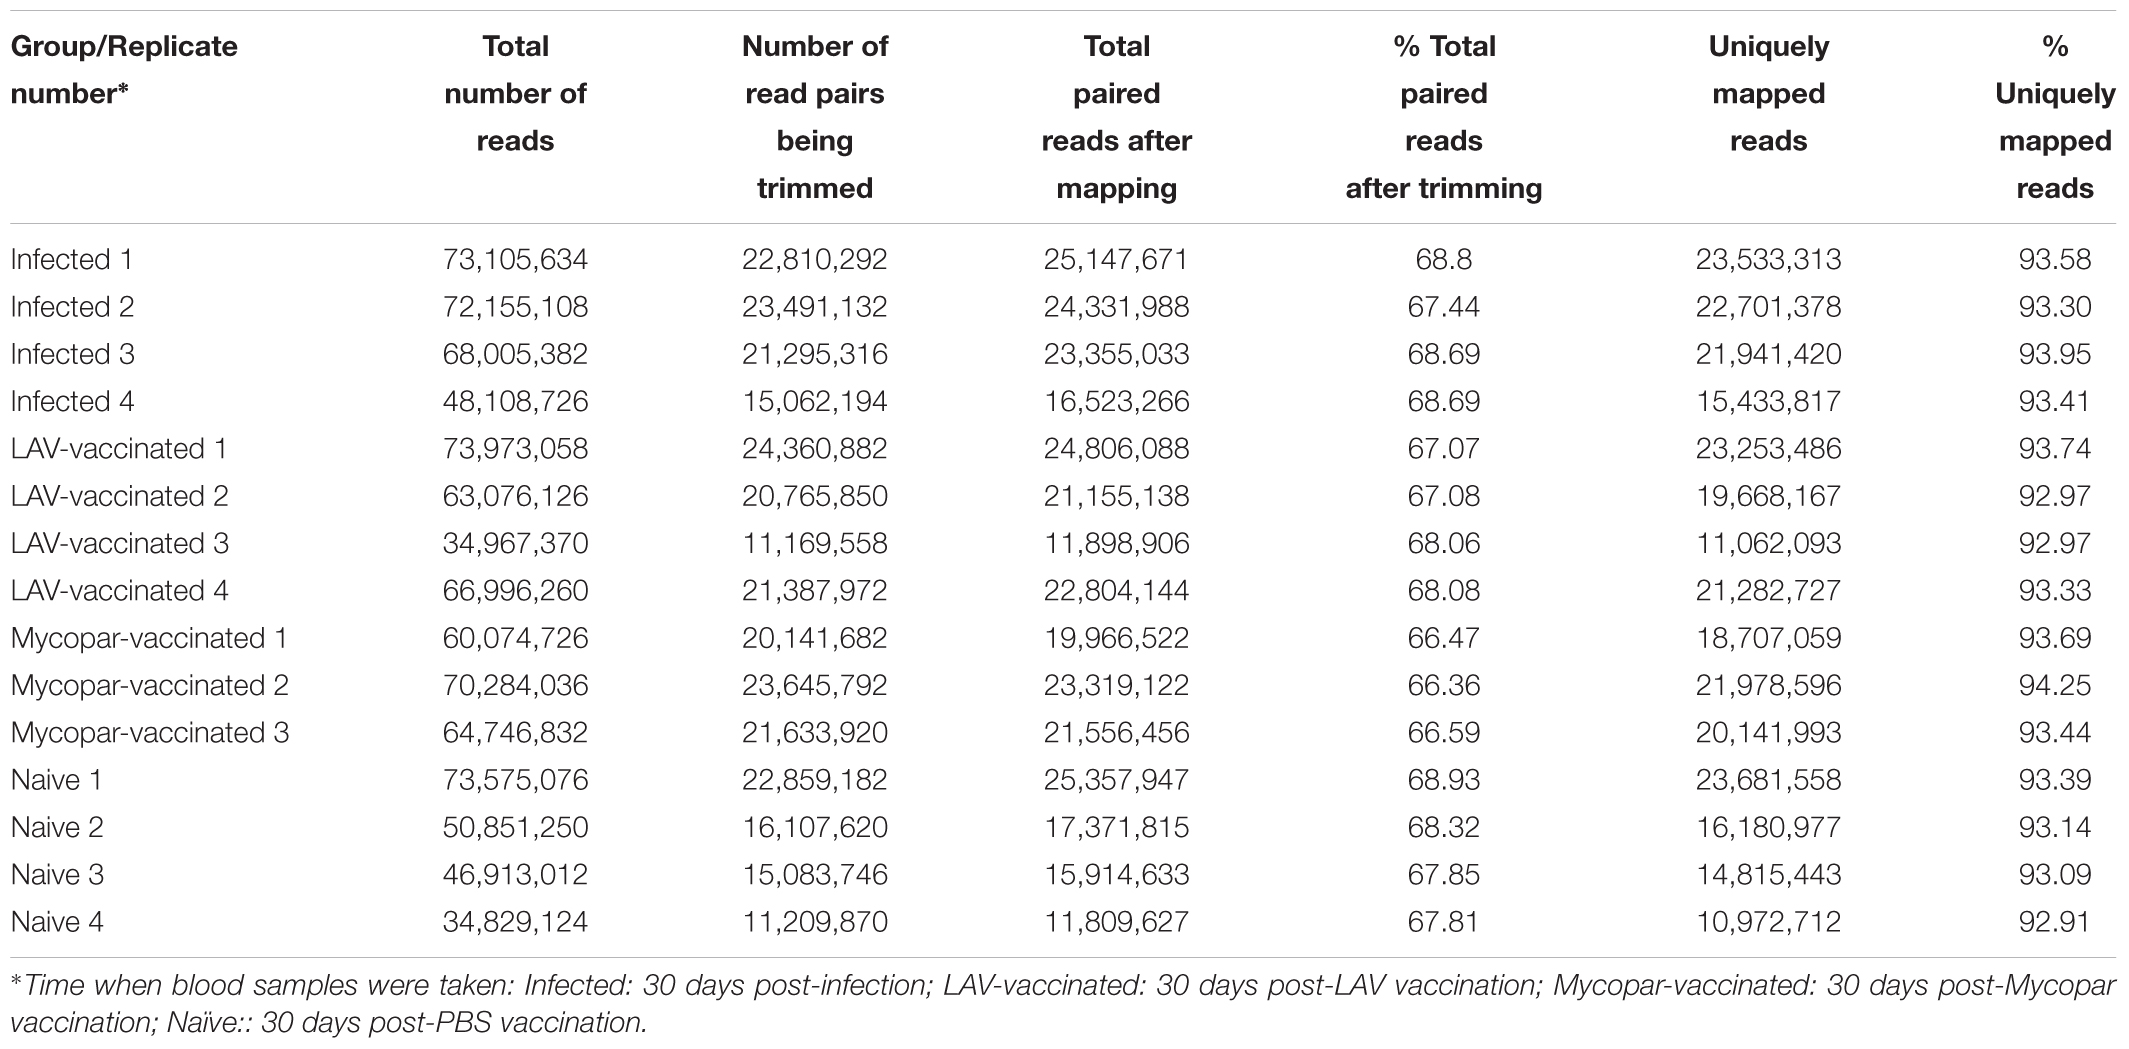
TABLE 2. Summary statistics for Illumina RNA sequencing data from individual animals.
Changes in the Goat Transcriptomes Related to Infection or Vaccination
Transcriptomes of different animal groups were analyzed to identify DE genes with significant change using a p-value threshold of ≥ 0.05 and ≥ 2-fold change (Supplementary Table S1). A summary of comparative numbers of DE genes is presented in Table 3. MA-plots in Figure 1 depict the distributions of the DE transcripts PI and post-vaccination groups compared to naïve control group. Generally, the infected goat group had 226 significantly DE transcripts out of 17,380 (total goat transcripts identified by RNA-Seq) at 30 days PI in comparison to the naïve, non-infected controls. Of the 226 significantly DE transcripts, 113 were up-regulated in the PI group, while the other 113 were down-regulated. A total of 106 out of the 226 DE transcripts had more than a 2.8-fold change (or 1.5 log2 fold change) with a selected group of known function listed in Table 4. On the other hand, the LAV-vaccinated goat group had 1018 significantly DE transcripts out of 17,380 compared to the naïve, non-infected control group. A total of 628 and 390 transcripts were up- and down-regulated, respectively. A total of 517 out of the 1018 DE transcripts had ≥2.8 fold change with a selected group of known function listed in Table 5. Additionally, when the transcripts of both LAV-vaccinated and infected groups were compared, at total of 1133 transcripts were significantly DE out of 17,380 (Table 3). Of these transcripts, 629 and 504 transcripts were up- and down-regulated, respectively. A total of 575 out of the 1133 DE transcripts were greater than a 2.8 fold change. Interestingly, the immunization with the inactivated, oil-based vaccine (Mycopar) triggered significant changes in a large number of goat genes (N = 1714) including key genes involved in immune responses (Table 6).

TABLE 3. Differentially expressed (DE) genes for each comparison group.
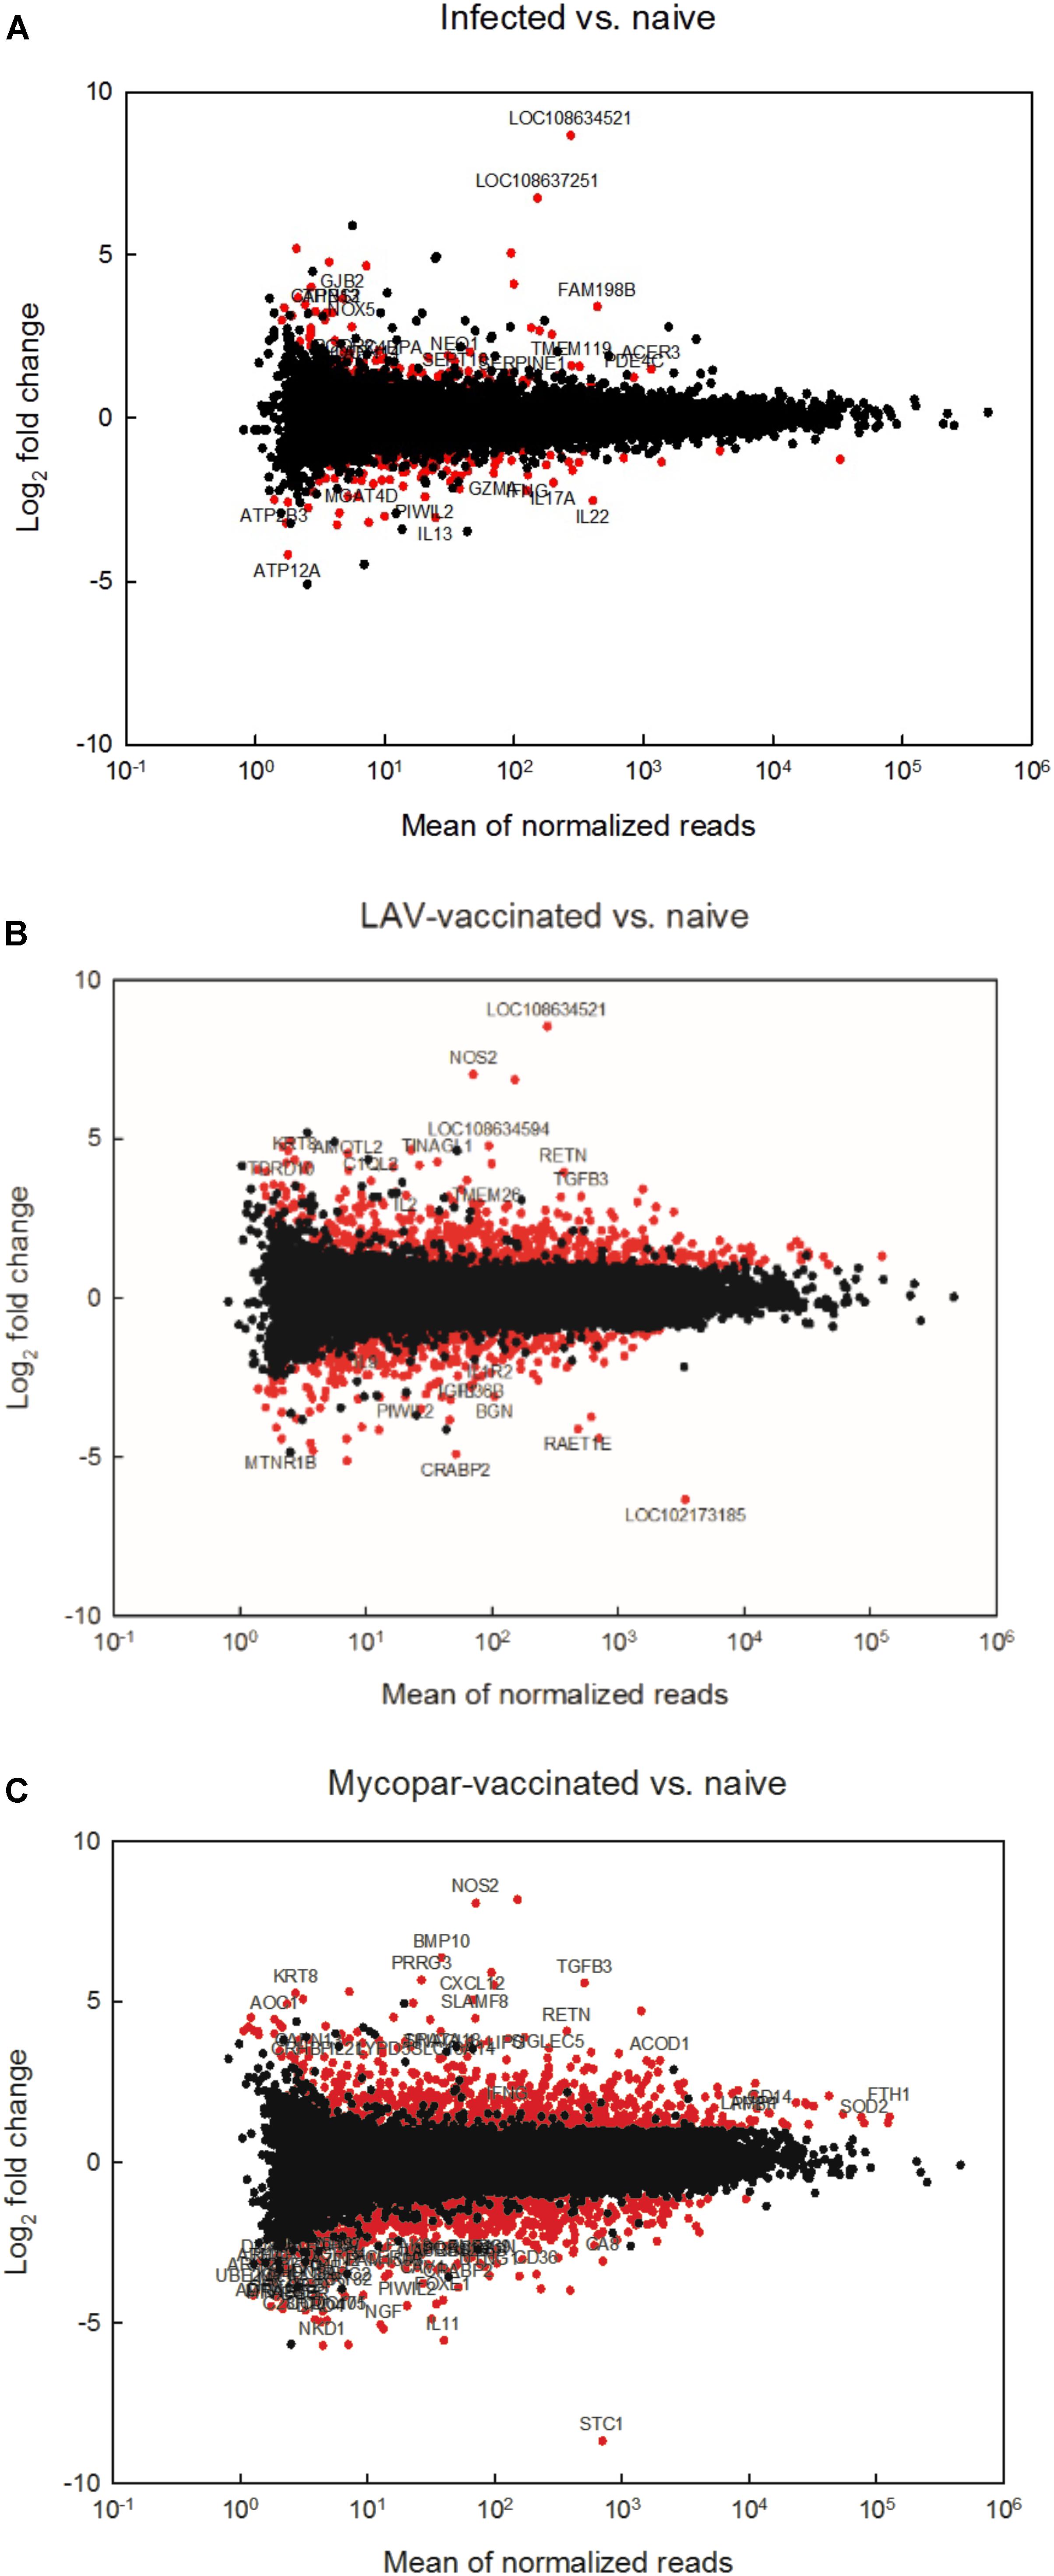
FIGURE 1. RNA sequencing analysis of different goat groups following infection or vaccination with LAV or Mycopar® vaccines. MAplots of (A) the infected group compared to the naïve group, (B) the LAV-vaccinated group compared to the naïve group and (C) the Mycopar-vaccinated group compared to the naïve group are shown. Red dots represent differentially expressed transcripts (fold change > 2.0 or <–2.0, p < 0.05).
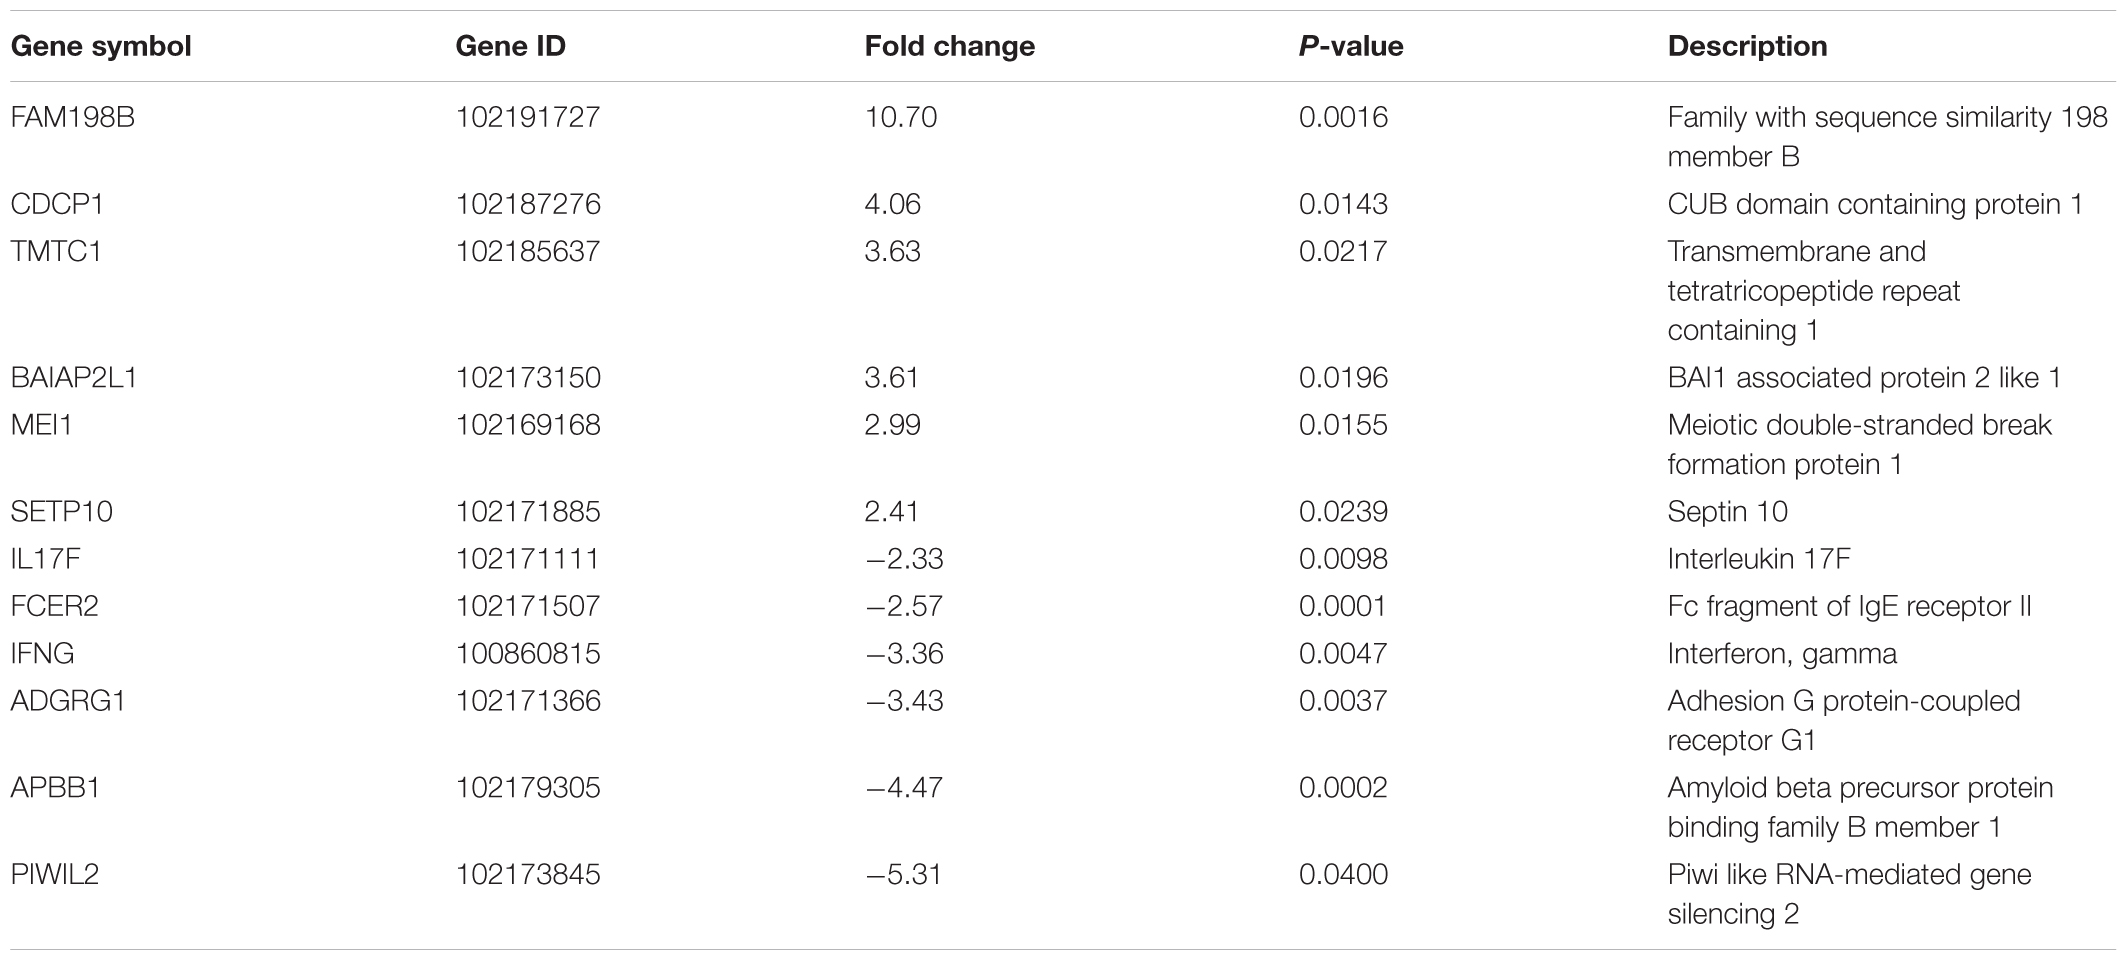
TABLE 4. Selected differentially up- or down-regulated genes by fold change, between 30 days post-infection and naïve groups among 226 genes with significant differential expression.
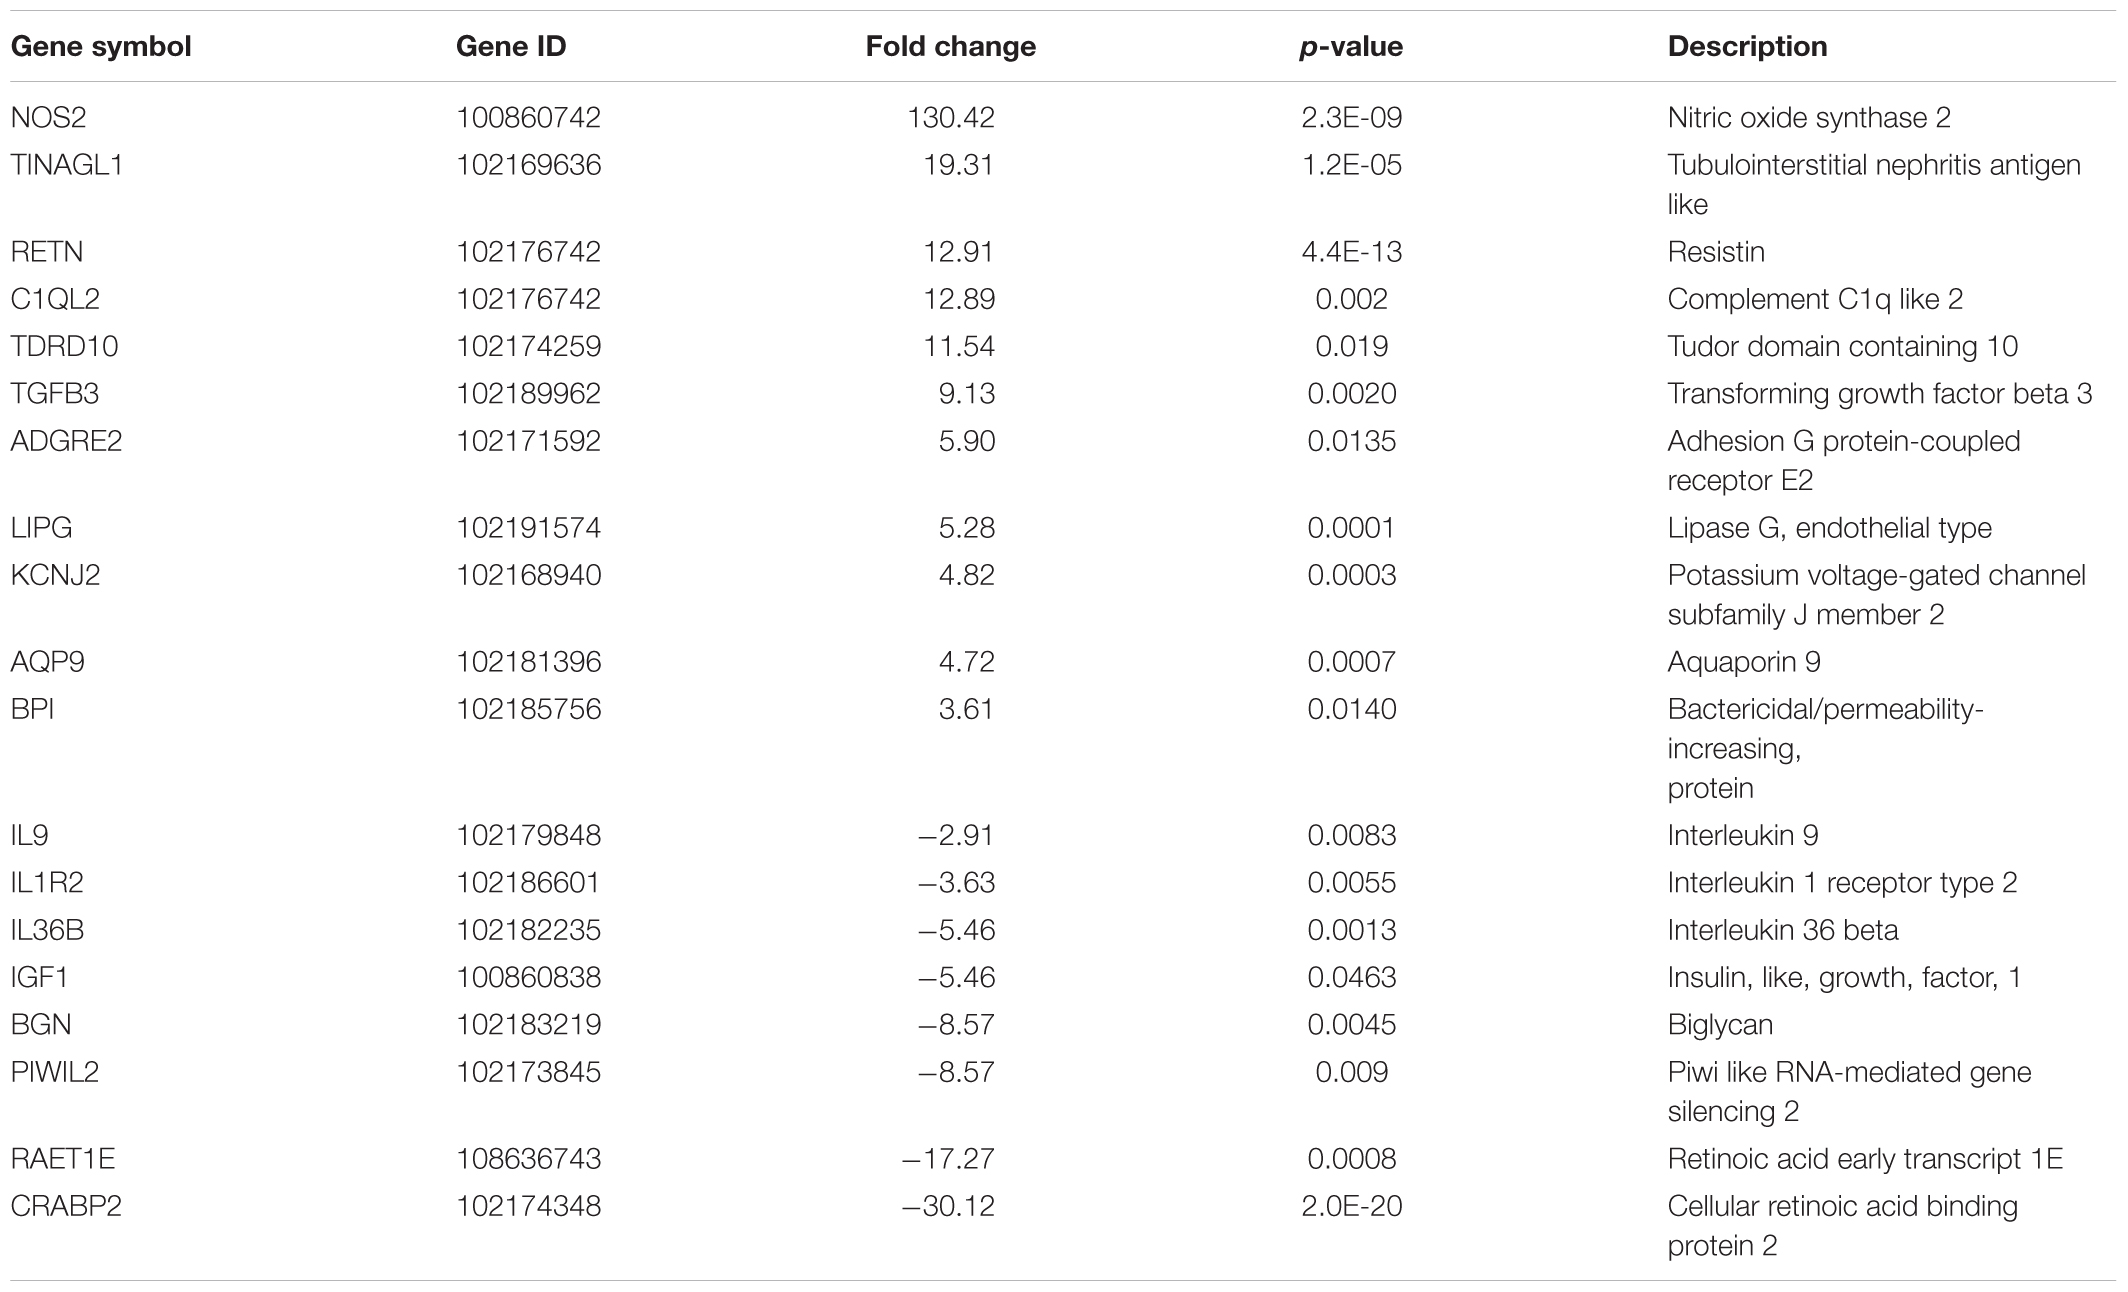
TABLE 5. Selected differentially up- or down-regulated genes by fold change, between 30 days post-LAV-vaccination and naïve groups among 1018 genes with significant differential expression.
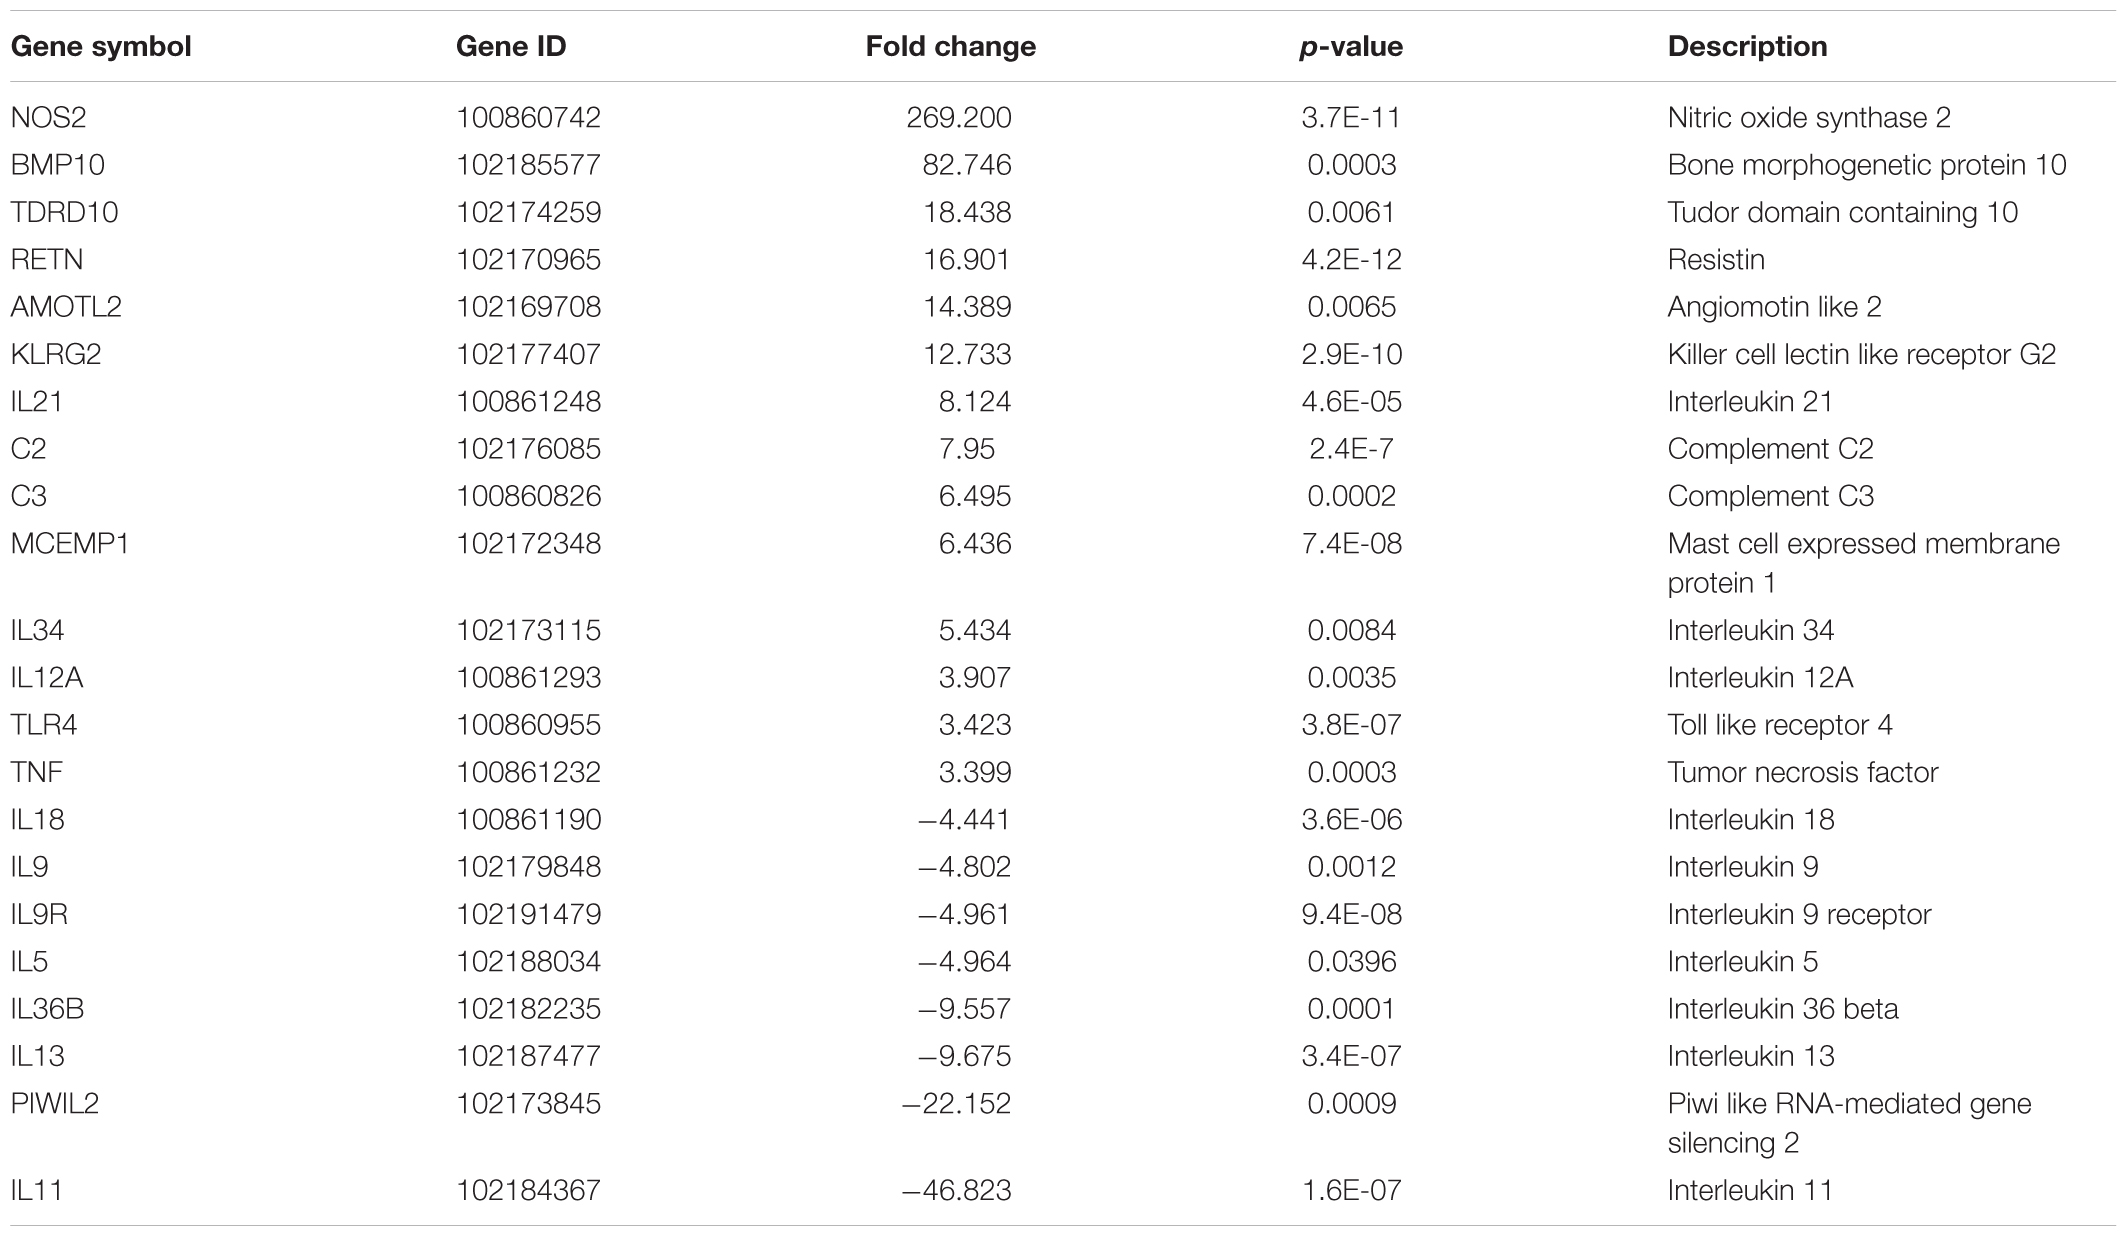
TABLE 6. Selected differentially up- or down-regulated genes by fold change, between 30 days post-Mycopar-vaccination and naïve groups among 1714 genes with significant differential expression.
Several genes involved in immune responses were significantly regulated in all goat groups. For example, leukemia inhibitory factor (LIF), interferon-gamma (IFN-γ), and interleukin 22 (IL-22), were found to be DE genes in the infected group when compared to both the control and the LAV-vaccinated groups. More gene lists are provided in Supplementary Tables S2–S8. In the infected group, LIF was down-regulated by -2.51 fold change when compared to the control group and by 3.84 fold when compared to the vaccinated group. IL-22, a Th17-related cytokine, was also down-regulated by a -5.78 fold in the infected group vs. the control group and by -33.82 fold when compared to the LAV-vaccinated group. Interestingly, NOS2 gene involved in controlling infection of a closely related mycobacteria, M. tuberculosis (Kutsch et al., 1999; Velez et al., 2009), was significantly induced (>100 fold) in both vaccine groups, suggesting an important role of this gene in adaptive immune responses following immunization with LAV (Table 5) or inactivated (Table 6) vaccine. A group of genes with unique diphasic regulatory responses in both LAV and infected goats included immune response genes (e.g., IFN-γ, Granulysin) as well as basic cell metabolic process (e.g., ART5). This list of genes (Table 7) could expand gene categories utilized as targets for developing a sensitive assay to differentiate infected from vaccinated animals (DIVA).
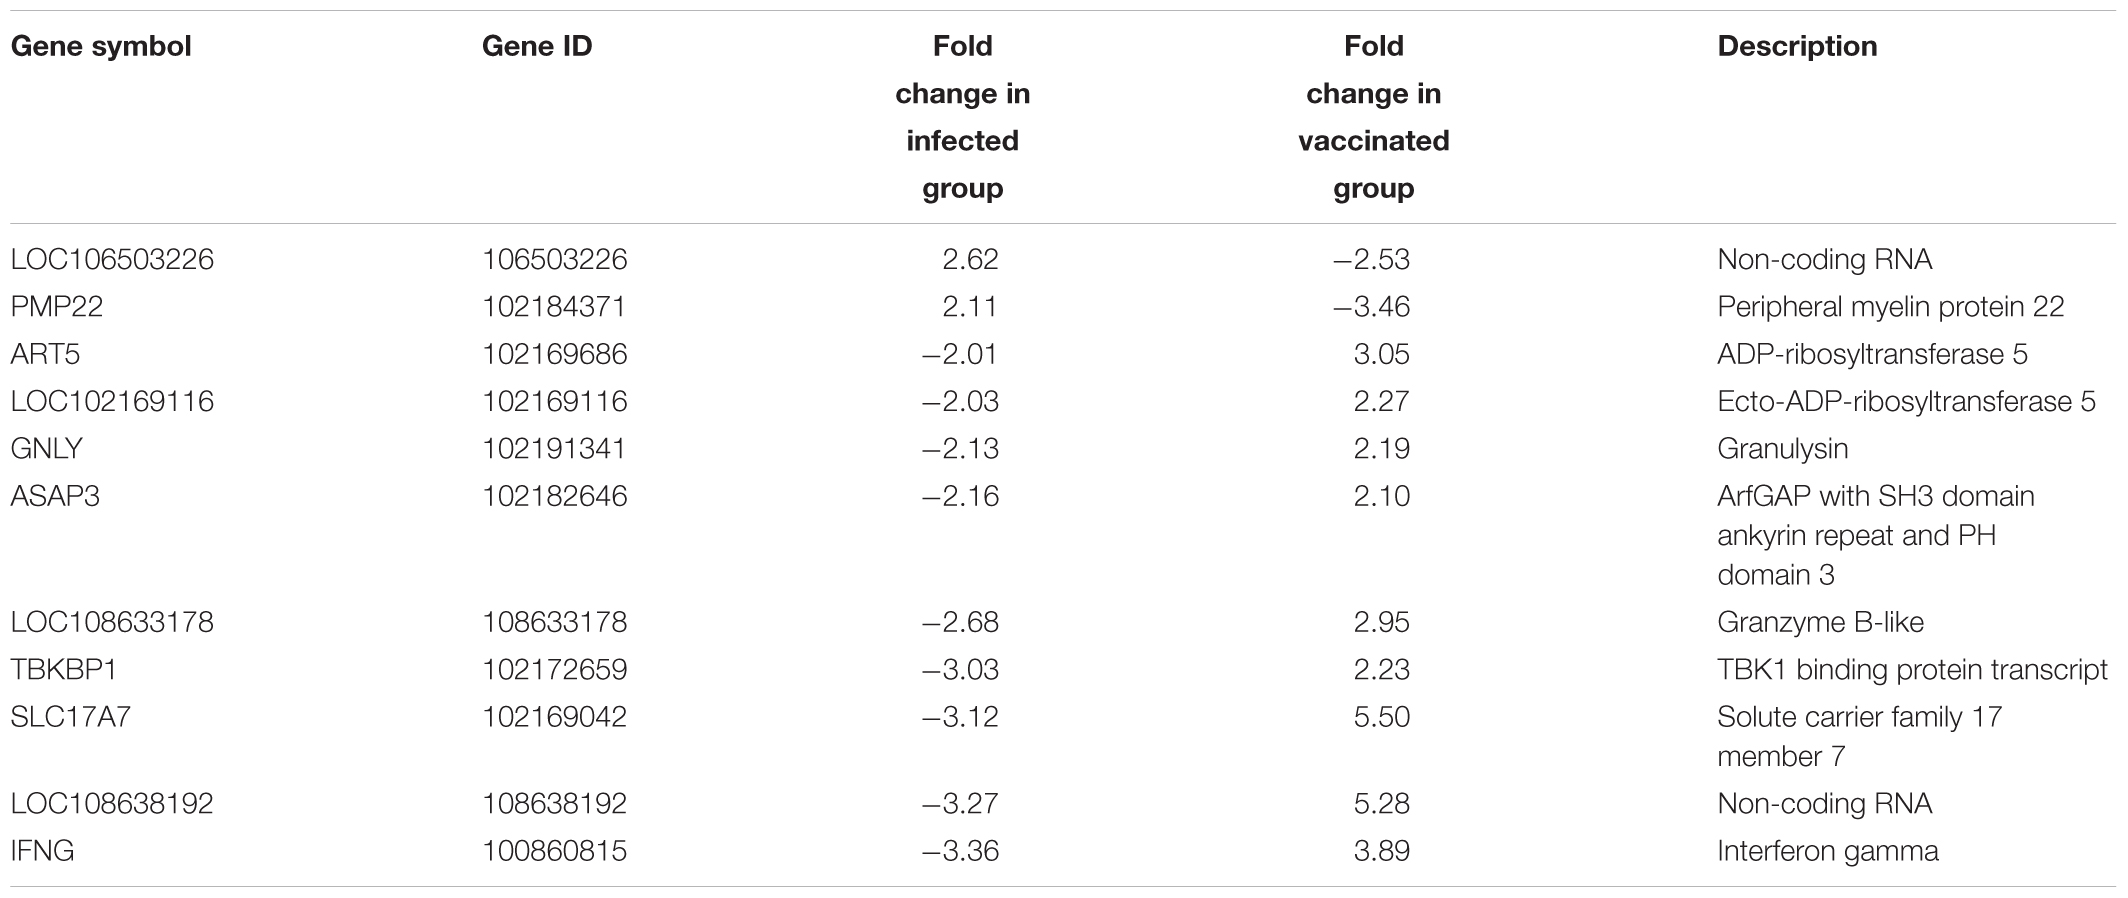
TABLE 7. Common differentially expressed genes regulated in opposite direction between 30 days post-infection and 30 days post-LAV-vaccinated groups, each compared to the naïve group.
Among those identified DE transcripts in the infected and LAV-vaccinated groups (each referenced against the naïve group), there were 68 transcripts in common (Figure 2A). The majority of those transcripts were regulated in the same direction in both groups, but 11 transcripts were regulated in the opposite direction. A non-coding RNA transcript, LOC106503226 and a gene, PMP22, were the only two that were up-regulated 30 days PI and down-regulated 30 days post-vaccination. The remaining 9 transcripts (e.g., ART5 and IFNG) were down-regulated 30 days PI and up-regulated 30 days post-vaccination (Table 6). More comparative analysis of transcript profiles identified 76 transcripts commonly up- or down-regulated shared between the lists of genes from comparing infected vs. naïve control and M. paratuberculosis-infected vs. LAV-vaccinated transcripts (Figure 2B). Those common genes could be considered the core responsive genes for M. paratuberculosis infection or vaccination with an LAV vaccine. For the inactivated vaccine, a total of 667 core genes (Figure 2C) were also regulated when compared to the LAV-vaccine group (Supplementary Table S7). Such core genes included those with potential rules in immunity (e.g., NOS2, RETN, and IL21), another indication of core genes responsive to any M. paratuberculosis-specific vaccines whether live-attenuated or inactivated were used.
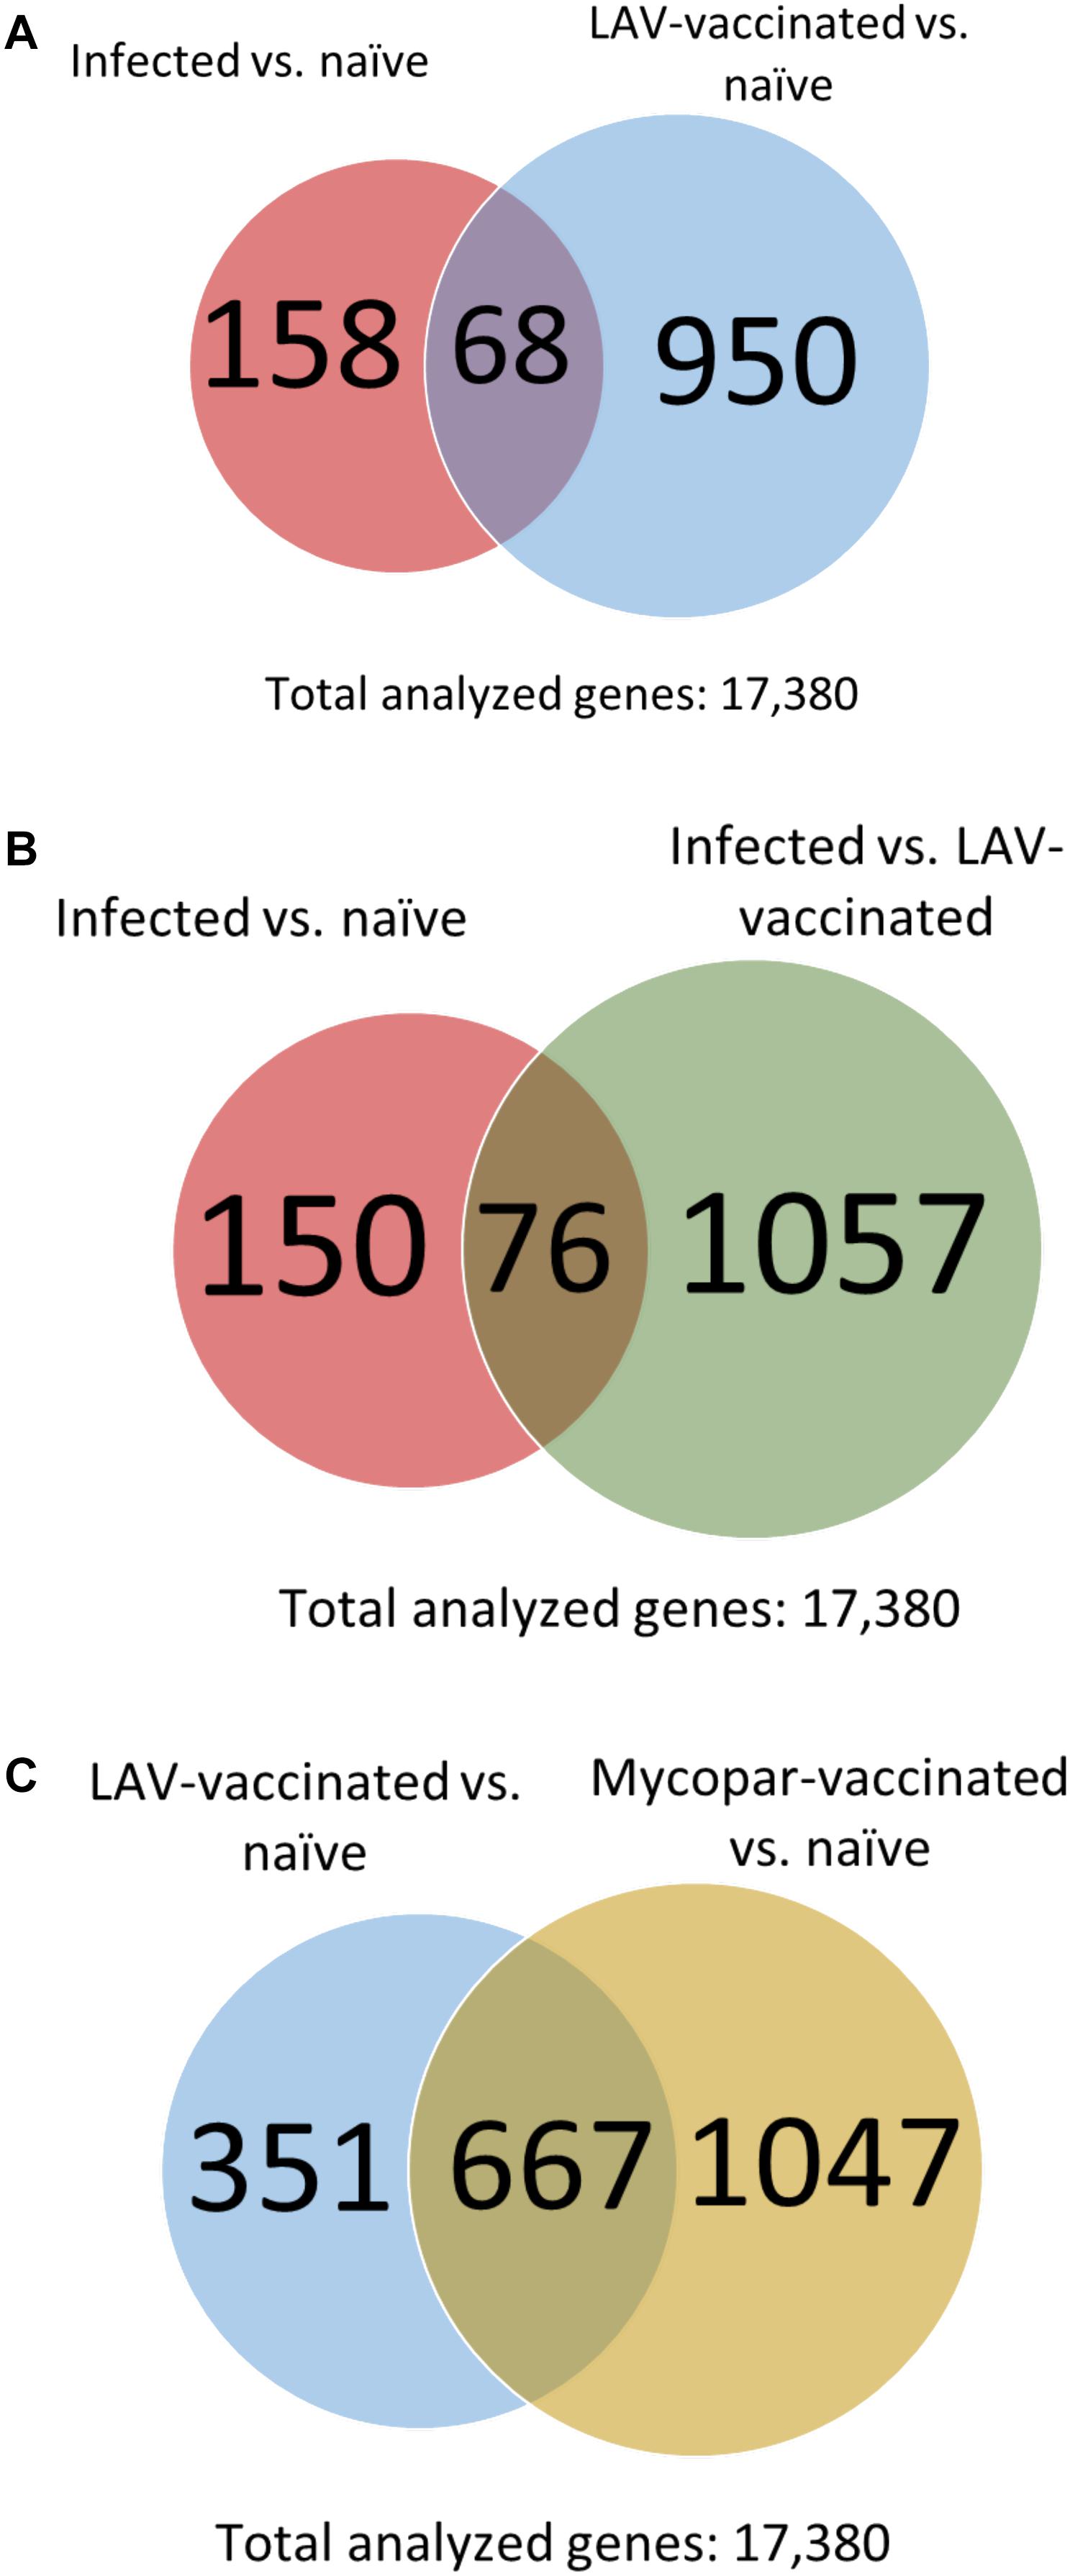
FIGURE 2. Comparative transcriptome analysis of the infected and vaccinated goat groups. Venn diagrams show numbers of common DE transcripts between (A) the infected and vaccinated groups, each compared to the naïve group. (B) Infected vs. naïve and infected vs. LAV-vaccinated groups and (C) LAV-vaccinated vs. naïve and Mycopar-vaccinated vs. naïve groups.
Pathways and Networks of Differentially Expressed Genes
To better define gene pathways involved in M. paratuberculosis infection, genes with significant differential expression were evaluated through GO analysis using agriGO. This analysis provides categories of genes involved in different biological or molecular functions and those integral for different cellular components. Interestingly, the most abundant significant terms for the GO analysis for the infected vs. naïve control group included genes involved in protein binding, regulation of cellular process and response to stimulus, which includes significant subcategories immune responses (GO:0006955) and inflammatory response (GO:0006954) (Figure 3), suggesting the importance of controlling immune genes by M. paratuberculosis following infection. On the other hand, the largest gene groups with significant GO terms for the Mycopar- or LAV-vaccinated vs. infected groups included genes involved in binding, cellular process and metabolic process while those for the LAV-vaccinated vs. infected group included genes involved in cellular process and biological regulation (Supplementary Figure S1).
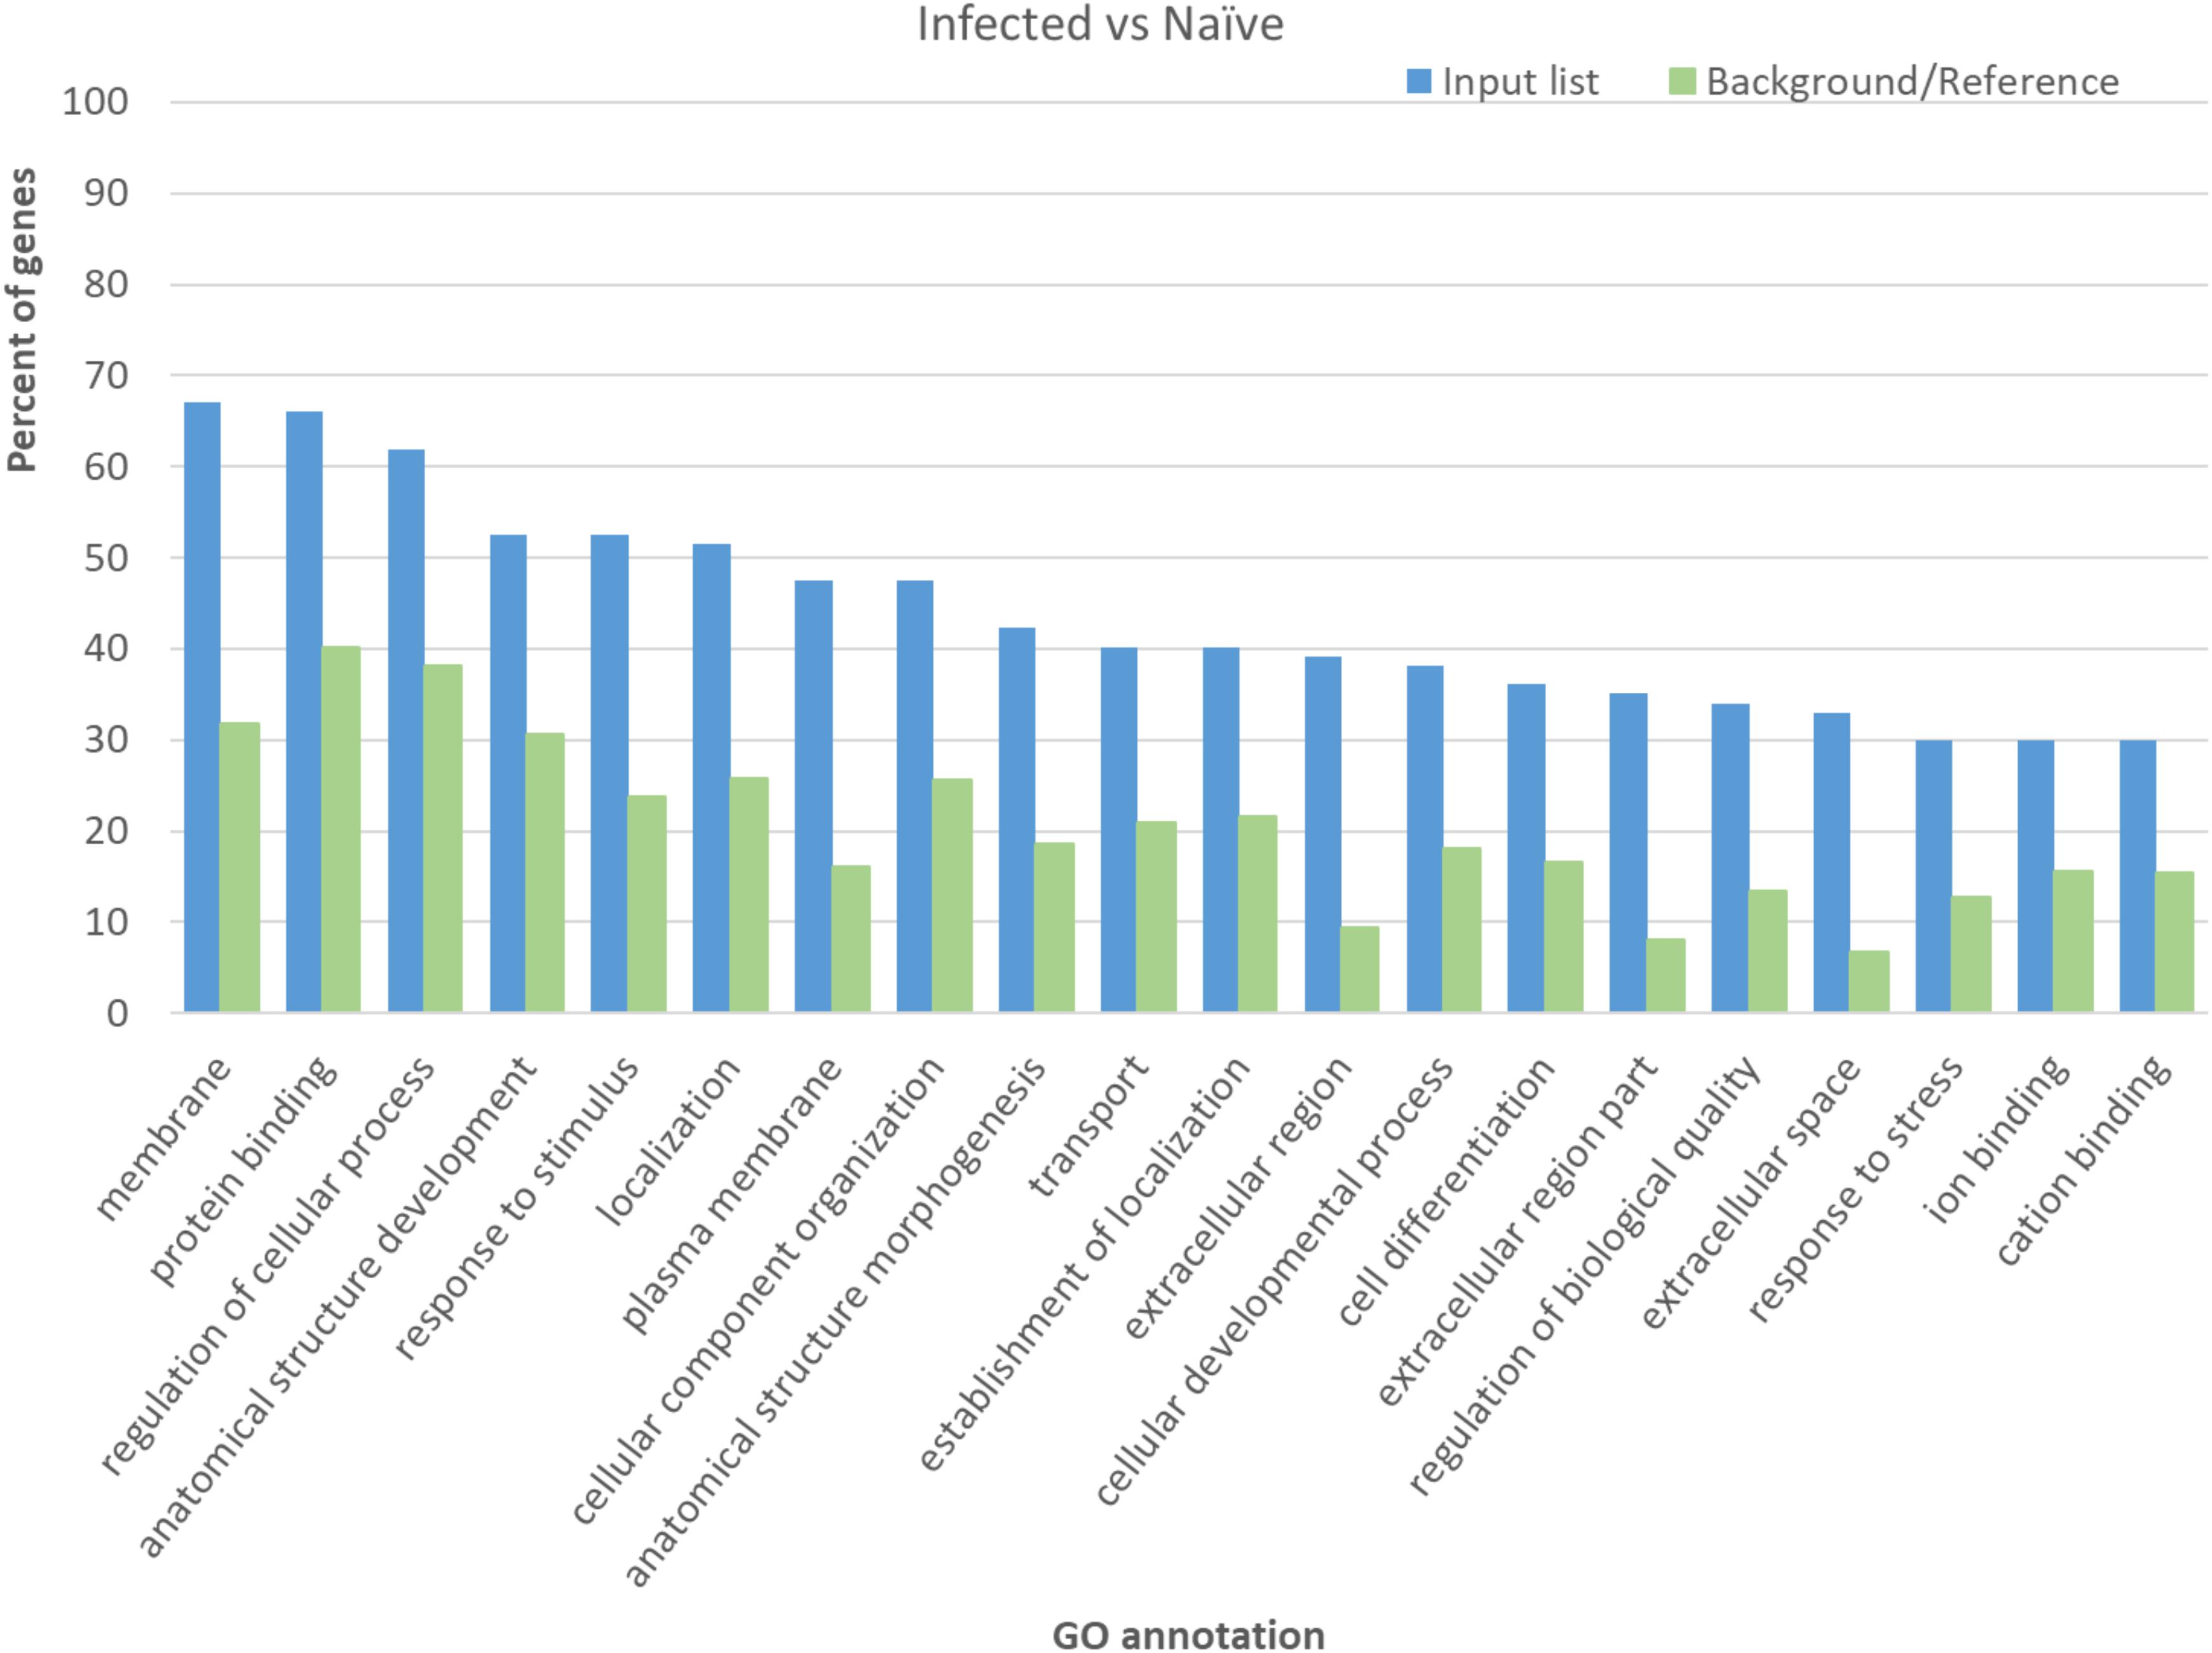
FIGURE 3. Significant terms in gene ontology analysis for the differentially expressed genes in infected goats compared to naïve control goats. The agriGO for automated identification of GO terms were used on the list of genes with significant differential expression when the transcriptomes of infected and naïve goats were compared.
To better characterize gene networks activated during infection and vaccination, gene transcripts were further analyzed to identify co-regulated genes. Figure 4 displays gene network analysis in the post-infection group. Several in the up-regulated group of genes (Figure 4A), such as ACER3, SYNJ2, CORO6 and PLS1, showed physical associations and co-expression among transcripts of the M. paratuberculosis-infected group. In addition, homologs of PDE4C and TSKU were also found associated (Halls and Cooper, 2010; Schlecht et al., 2012; Costanzo et al., 2016) and suggested to be involved in signaling and relaxin regulation (Halls and Cooper, 2010). In Figure 4B, a co-down-regulation of ATP7B, ATP12A and ATP2B3 suggests a possible reduced activity of calcium transport in infected cells. This analysis also highlighted the negative regulation by M. paratuberculosis of host cytokines such as IFN-γ, IL-13, IL-17A, IL-17F, and IL-22.
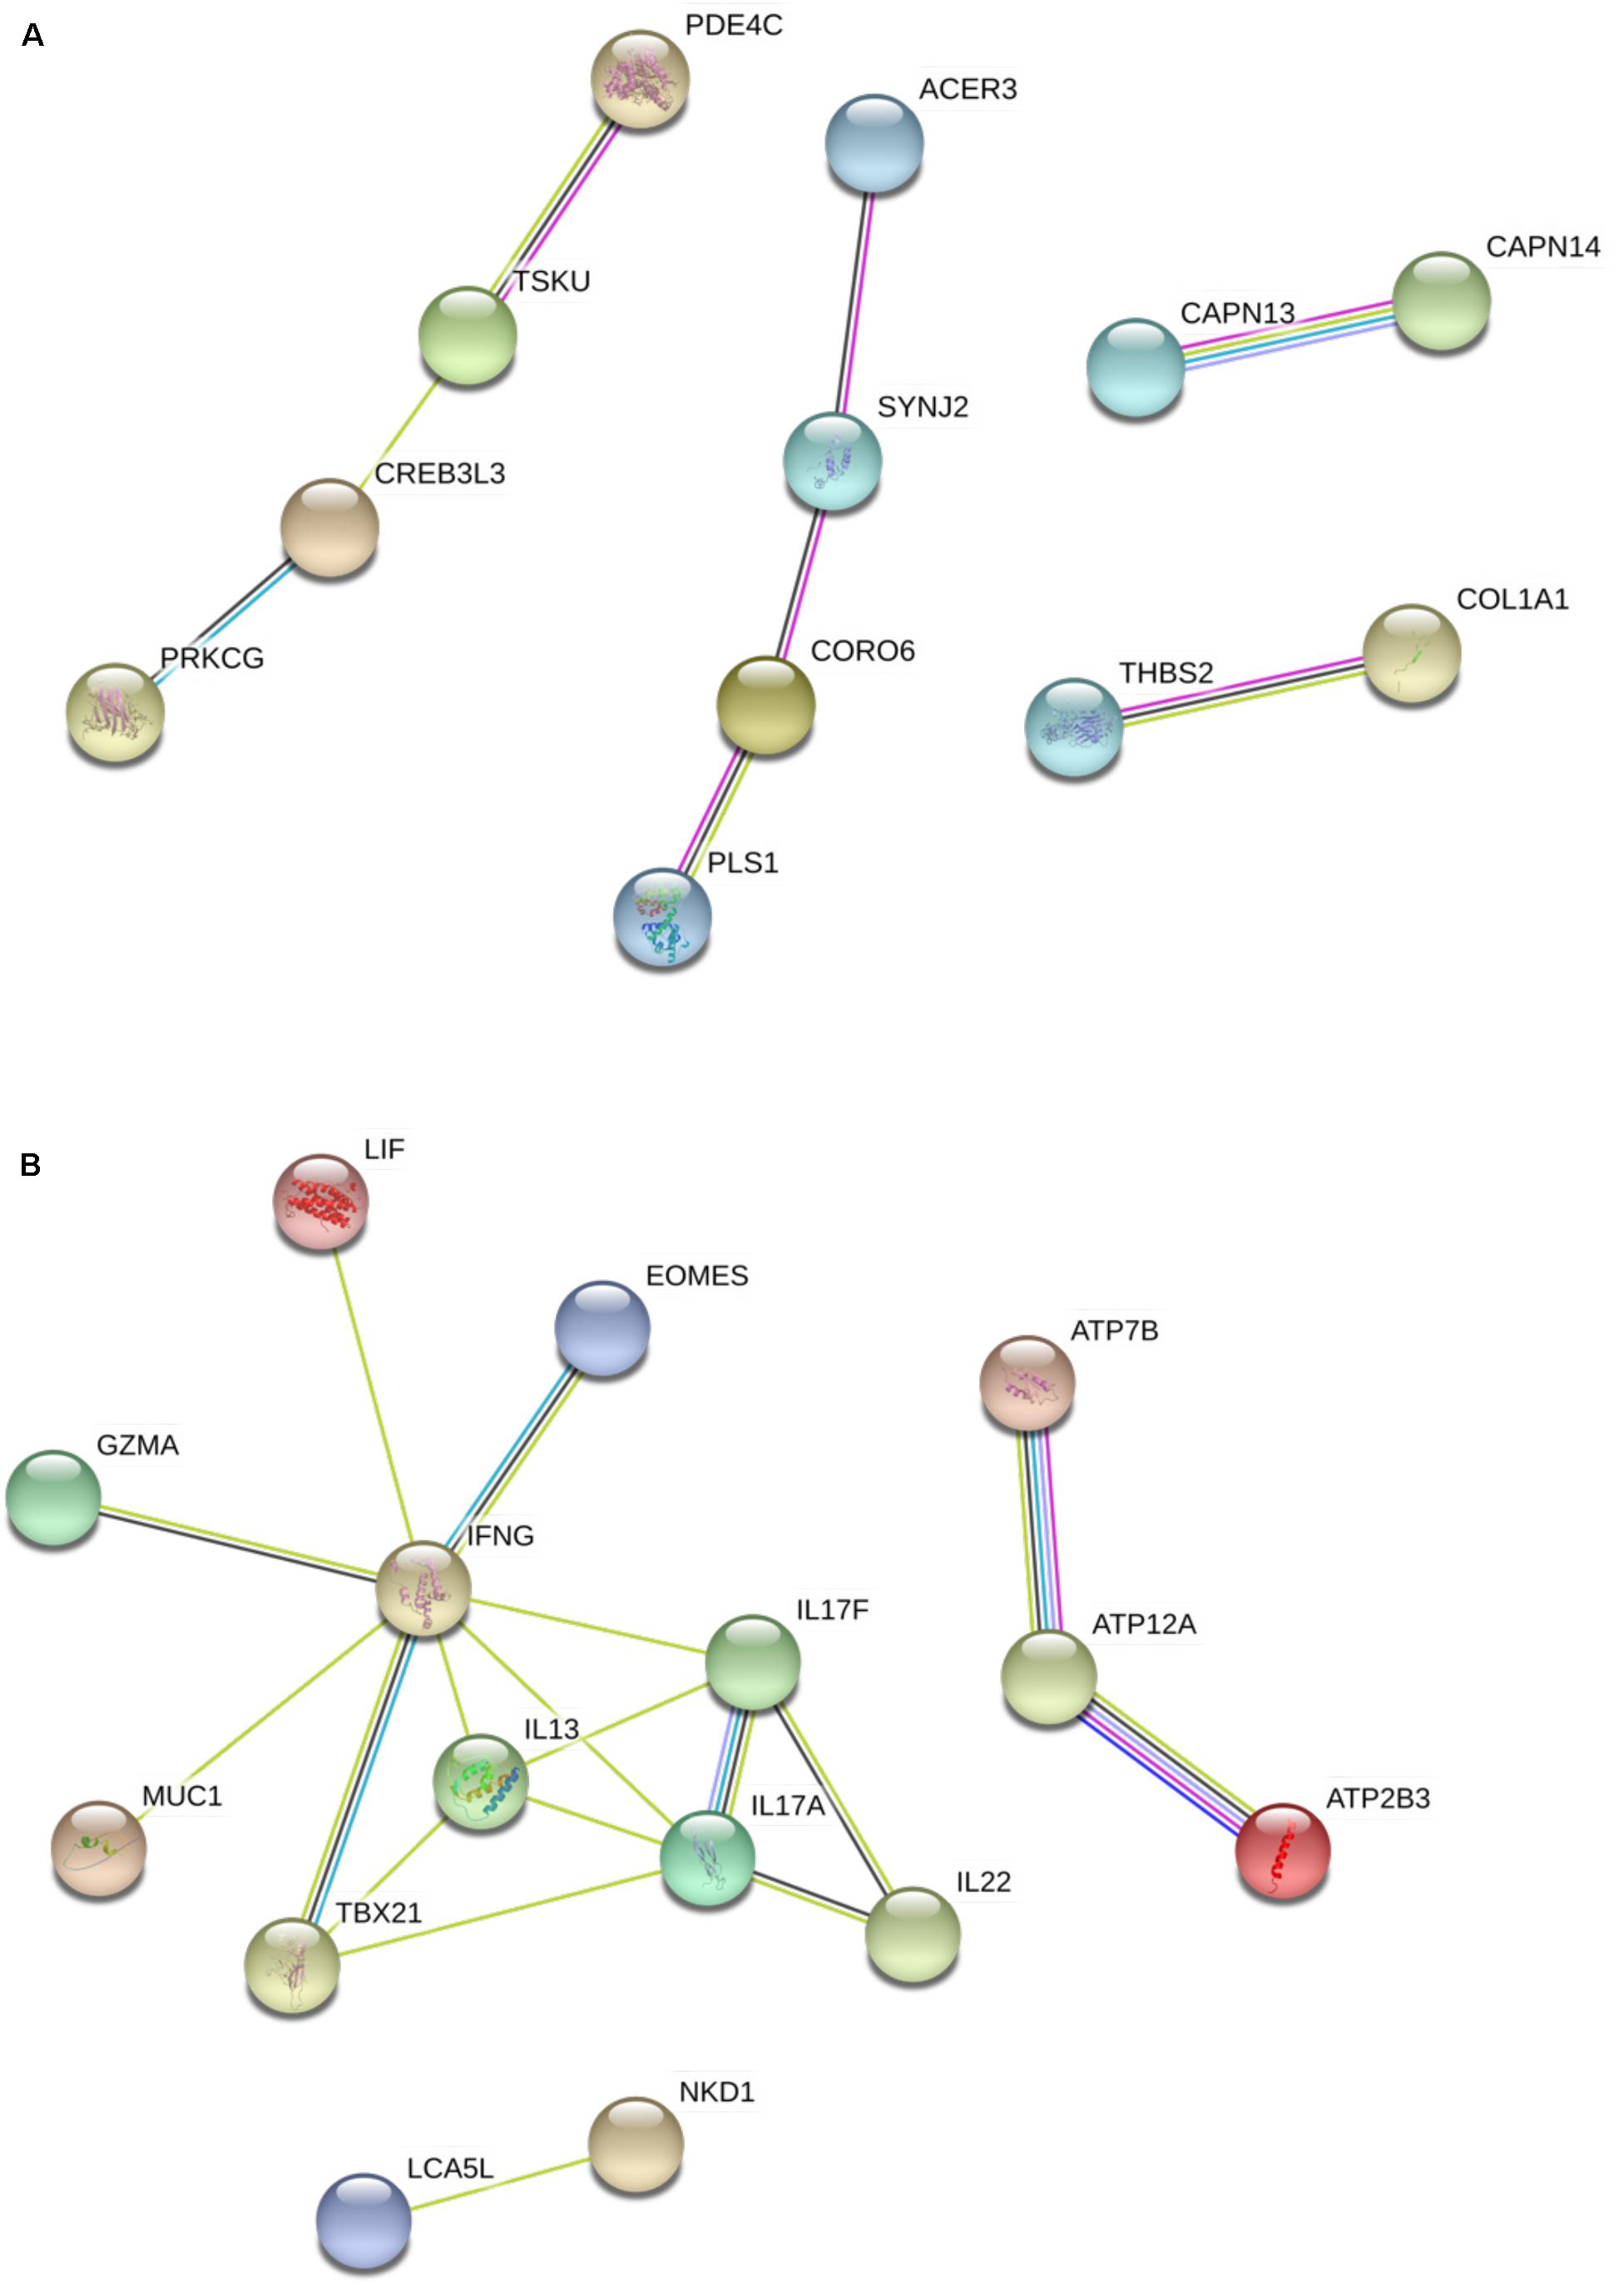
FIGURE 4. Gene network analysis of DE genes in the infected group. (A) Genes that were significantly up-regulated. (B) Genes that were significantly down-regulated. IL-17A and IL-17F are two homologs in the IL-17 family. Light green lines represent connection between genes co-mentioned in an abstract in published studies, cyan lines represent putative pathway connections found in homologs in other species, black lines represent co-expression in Bos taurus or homologs in other species and pink lines represent experimentally determined association.
Prolonged Changes of Key Host Genes
To further analyze the utility of transcriptome analysis for prediction of unique transcripts associated with infection or vaccination, we used real-time, quantitative PCR to compare transcript levels among animal groups over 12 months post-challenge (MPC) (Figure 5). Interestingly, IL-17 cytokine was repressed in the challenged and Mycopar® and LAV-vaccinated goats compared to the naïve control group for all examined times, except for the infected group at 2 MPC. Similarly, the Sept10 gene was induced, only at 2 MPC. On the other hand, IL-36 was activated soon after vaccination (1 and 2 MPC) but then repressed for the rest of the examined time points, i.e., 6 and 12 MPC. More interestingly, the IFN-γ expression profile was refractive to elicited immune responses. IFN-γ was induced soon in the LAV-vaccine group (1 MPC) but then continued to be expressed in the Mycopar®-vaccinated and M. paratuberculosis-challenged groups starting from 2 MPC until the end of the experiment. At all of these sampling times, the IFN-γ was consistently higher in the LAV-vaccine group compared to the challenged group.
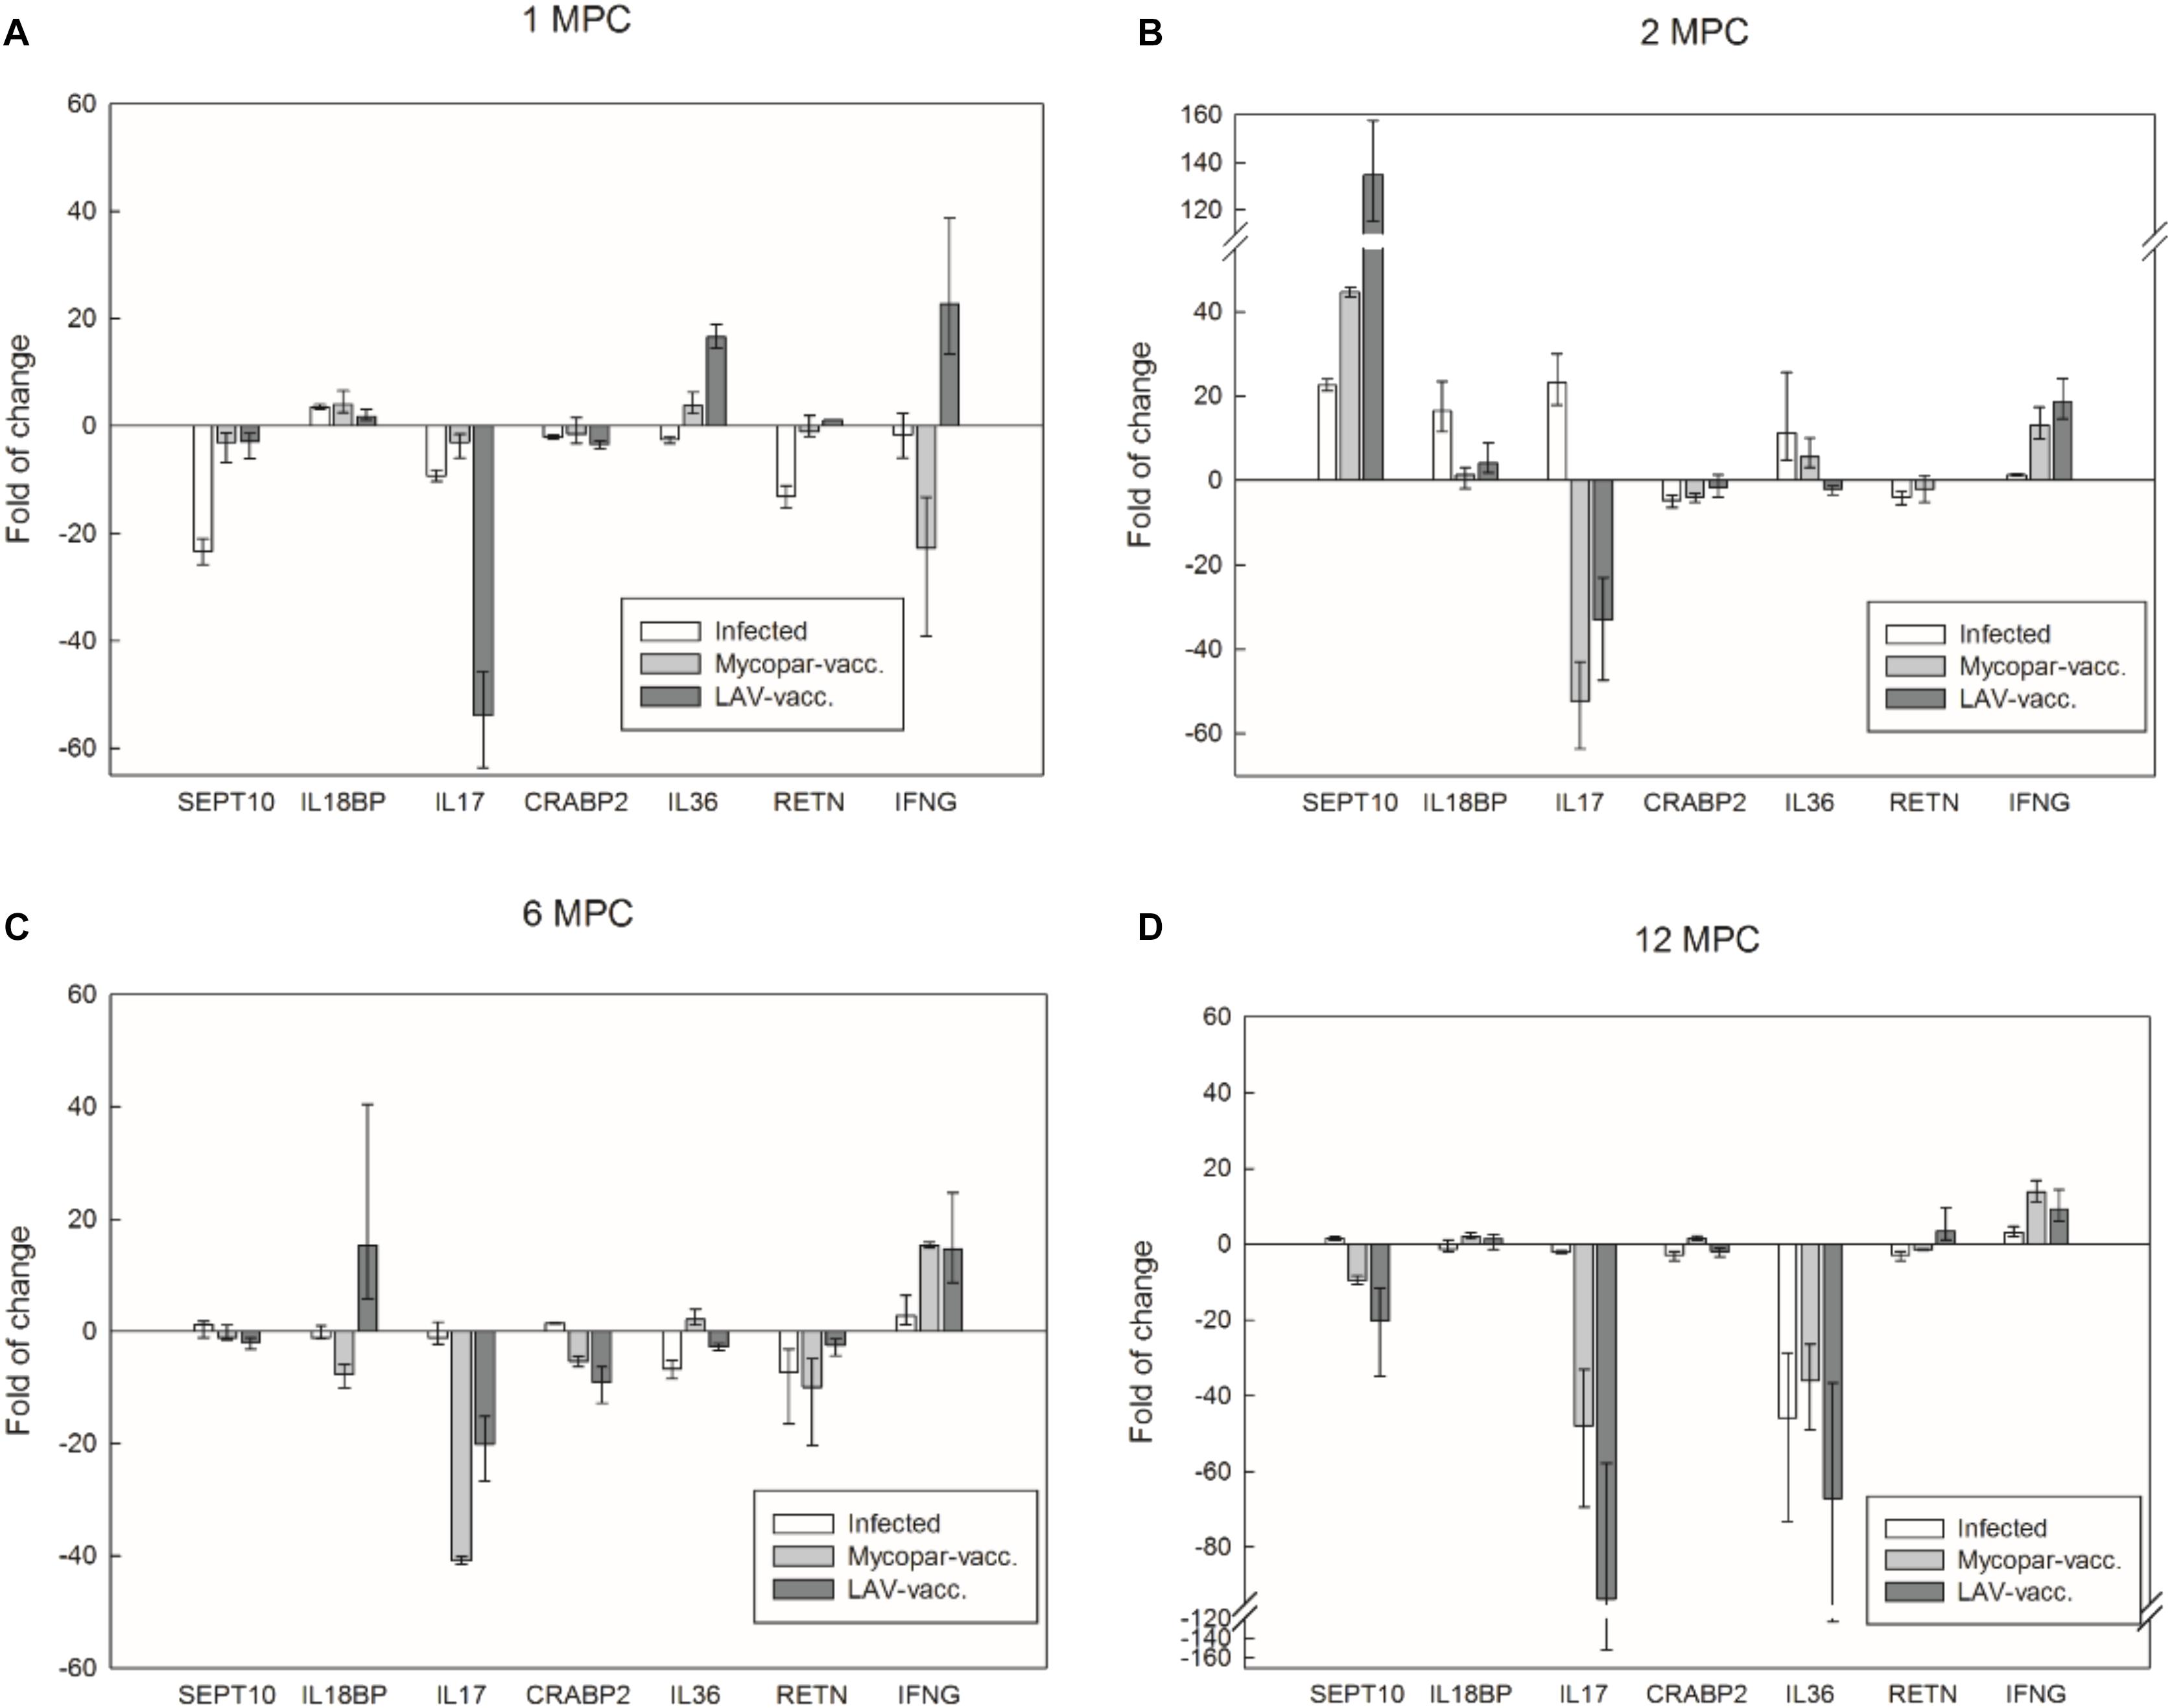
FIGURE 5. Transcriptional profile of key caprine genes over 12 months post challenge with M. paratuberculosis. Panels display quantitative real-time PCR analysis of total RNA extracted from blood samples collected from goat groups at 1 (A), 2 (B), 6 (C), and 12 (D) months post challenge (MPC). Expression levels were calculated with ΔΔCt relative quantitation method relative to the GAPDH gene expression in the naïve group. Target gene names are listed below each panel and fold change for the infected, Mycopar or LAV-vaccinated relative to naïve goat groups are listed on the Y-axis. At each time point, samples from three animals in each group except the infected group at 1 MPC (N = 2) were included and standard errors of the mean (SEM) of the three measurements were presented as error bars.
Discussion
Infection with M. paratuberculosis is costing the dairy industry significant economic losses (Cho et al., 2012) and is difficult to detect its presence, especially during early disease stages (Li et al., 2017). In this project, the goat PBMC transcriptome was profiled using RNA-Sequencing (RNA-Seq) to compare the early gene expression, 30 days post-infection and post-vaccination, compared to healthy, naïve controls. In addition to better understanding of disease progression, such analysis is expected to yield targets for further development into a diagnostic assay for early stages of Johne’s disease. Similar to others (Aranday-Cortes et al., 2012; Bhuju et al., 2012; Churbanov and Milligan, 2012; Kohler et al., 2015), we focused our analysis on the transcriptome of PBMC stimulated cells with M. paratuberculosis lysate to further increase biomarker specificity to M. paratuberculosis infection and/or vaccination. Many transcriptomic analyzing tools largely depend on information from an annotated genome. In this study, our quality of transcriptomic analyses improved as the goat genome assembly was significantly refined (Bickhart et al., 2017). According to NCBI Capra hircus Annotation Release 102, of 20,593 predicted coding genes, 20,256 had a protein aligned 50% or more of the query against the UniProtKB/Swiss-Prot curated proteins (NCBI, 2016). The updated annotation thus provides a much more reliable reference to our analysis. The generated RNA-Seq dataset could also benefit further improvement of goat genome annotation. As expected, a large number of DE transcripts were found between the vaccinated and infected groups (1133 genes) and between the vaccinated and naïve control group (1018 genes). In contrast, there was a relatively small number (226) of DE transcripts when comparing the infected and naïve control group. This large difference in the number of DE transcripts is most likely associated with the route of administration since both vaccines were administered subcutaneously (contrary to oral infection), allowing for increased contact with PBMCs in the bloodstream, while challenge dose of M. paratuberculosis could reach PBMC following intestinal invasion (Stabel et al., 2009). Our analysis, further illustrated the importance of route of infection and/or vaccination for the type and magnitude of the generated host responses.
Although the comparison between the infected and naïve control group produced a relatively small number of DE transcripts, preliminary evaluation of these genes indicated a large number of genes with immunological and inflammatory functions, including interferon gamma (IFN-γ), IL-18 binding protein, IL-17A, and IL-22. IFN-γ is an important player in the defense against intracellular pathogens including mycobacteria (Arsenault et al., 2012). A previous study in cattle showed that in the subclinical stages of infection, IFN-γ expression increased at the site of infection (Sweeney et al., 1998). Other studies indicate that M. paratuberculosis-infected animals produce IFN-γ but are unresponsive to it (Arsenault et al., 2012). In that study, IFN-γ was secreted significantly less (-3.36 fold change) in subclinically infected goats compared with the naïve, control goats. This IFN-γ profile was also evident in subclinically infected goats vs. vaccinated goats (-13.0 fold change). Previously, IFN-γ was reported to be induced in PBMC’s stimulated with M. paratuberculosis whole-cell sonicate from subclinically infected cows (Stabel, 2000). However, these cows ranged from 2 to 10 years of age and therefore were much further along in the infection pathogenesis than in the current study, which tested goats 30 days PI. The host response clearly changes over time and this data may demonstrate that. Potentially linked to the identified repression of IFN-γ, is the moderate up-regulation (+1.30 fold change) of interleukin 18 binding protein (IL-18 bp) in the infected vs. naïve control group. IL-18 bp binds to IL-18 to block its biological activity (Novick et al., 1999). IL-18 is a pro-inflammatory cytokine that functions in the early Th1 cytokine response and induces IFN-γ production. A major source of IL-18 bp is from intestinal endothelial cells and macrophages (Corbaz et al., 2002). Therefore, IL-18 bp serves to modulate the early Th1 immune response in the intestine, the site of M. paratuberculosis infection. Interestingly, IL-18 bp has been found to be up-regulated during active Crohn’s disease, an inflammatory bowel disease in humans with potential association to M. paratuberculosis infection (Corbaz et al., 2002).
As expected, genes involved in immune responses (e.g., LIF, IFN-γ, and IL-22), were found to be DE among examined goat groups. LIF is a pleiotropic cytokine belonging to the IL-6 cytokine family with receptors primarily on monocytes/macrophages (Nicola and Babon, 2015). In the infected group, both LIF and IL-22, a Th17-related cytokine, were down-regulated in the infected group vs. the control or the vaccinated groups. These three genes, along with IL-13 and IL-17, were also found having associations in the protein network analysis. IL-17 was also down-regulated in the infected vs. control group. Down-regulation of IFN-γ, IL-22 and IL-17 genes may suggest overall down-regulation of Th1 and Th17 cell activities and reduced cellular immunity against infections. Several studies in Mycobacterium tuberculosis and Mycobacterium bovis have shown significant IL-17 responses (Blanco et al., 2011; Jurado et al., 2012). A recent study on RNA-Seq analysis in cattle infected with M. bovis showed an up-regulation of IL-17, IL-22, and IFN-γ at 1-month PI (Waters et al., 2015). This is in contrast to some of our findings in the present study (in case of IL-17) which was further confirmed by prolonged analysis of key genes up to 12 months post infection (Figure 5). Such difference could be attributed to the difference in host response to M. bovis vs. M. paratuberculosis. Further investigation into these key immune regulated genes as will aid in understanding how the host is dynamically responding to M. paratuberculosis infection or vaccination.
Our gene network analysis also shows associations among genes that were up-regulated in the infected group (Figure 4A). Interestingly, homologs of ACER3, SYNJ2, CORO6 and PLS1 in animal species other than goats (mainly bovine, Bos Taurus) were also shown to have physical associations (Schlecht et al., 2012; Hein et al., 2015) and co-expression (Clancy et al., 2003; Janji et al., 2010) as well. Particularly, homologs of CORO6, an actin binding protein, was suggested to be involved in cytokinesis. In M. tuberculosis-infected macrophages, CORO6 homolog coronin-1a was suggested to inhibit auto-phagosome formation and facilitate M. tuberculosis survival (Seto et al., 2012). In addition, homologs of PDE4C and TSKU were also found associated (Halls and Cooper, 2010; Schlecht et al., 2012; Costanzo et al., 2016) and suggested to be involved in signaling and relaxin regulation (Halls and Cooper, 2010). It may thus imply a status of progression of an M. paratuberculosis infection in hosts as observed in M. tuberculosis infection (Seto et al., 2012). This observation, along with the likely reduced cellular immunity discussed above, is consistent with the infection status of the host. It is unclear, however, how bacterial or host factors regulate the expression of those genes. Understanding the host-pathogen interaction early in infection will allow for the identification of genes upregulated during initial infection. A useful biomarker for infection must be specific, detectable over the course of the disease with varying inoculation doses, and easily measurable. Moreover, it would improve interpretation of early disease detection if the biomarkers could differentiate infected and vaccinated animals. In our analyses, we identified 9 transcripts (out of 11 in Table 7) that were down-regulated 30 days PI and up-regulated 30 days post-vaccination. This biphasic regulation of those genes or transcripts might make them specific markers for differentiating vaccinated animals that are healthy or those infected with M. paratuberculosis.
The RNA-Seq analysis was performed only on samples taken 1 month post-infection or post-vaccination to identify early gene regulations in tested groups, notably, between 1 month after vaccinated only and infected only groups. This comparison differentiates host gene regulating responses after exposure to vaccine strains or virulent strains of M. paratuberculosis. The vaccinated animals were then challenged 2 months after the vaccination and several key gene expressions were profiled with quantitative PCR (Figure 5). The temporal expression patterns within the tested 1 year period could reflect unique characteristics of host responses after exposure to virulent M. paratuberculosis with or without prior vaccinations and could also benefit development of diagnostics. For example, IL-17 expressions in the vaccinated animals remained highly repressed at all time while peaking at 2 month post-challenge in the infected only group.
Future work includes evaluation of these target genes in calves at various time points of infection phase to confirm our analysis of experimentally infected animals. Similarly, we could identify specific biomarkers for the differentiation of infected from vaccinated animals, a goal that could further improve the utility of using vaccines to control Johne’s disease in cattle.
Data Availability
All data presented in this manuscript are available through this report or the accompanied Supplementary Tables and Supplementary Figures. RNA-Seq data were deposited in NCBI Gene Expression Omnibus (GEO) database under accession number GSE117799.
Author Contributions
AT perceived the original idea and supervised the whole project. AB and CWW conducted all of the experiments while AV was responsible for the real-time PCR section. All the authors contributed to the writing and editing of the manuscript.
Funding
This work was partially supported by grants USDA (NIFA-2015-07821, NIFA-SBIR-2013-67015-21347) and Animal formula fund # WIS01814 awarded to AT.
Conflict of Interest Statement
AT has an ownership interest in Pan Genome Systems, Inc., which is working in the area of animal vaccine development.
The remaining authors declare that the research was conducted in the absence of any commercial or financial relationships that could be construed as a potential conflict of interest.
Acknowledgments
The authors would like to thank Dr. Michael T. Collins for reading the manuscript, Dr. Justin Lemke and Dr. Daniel Shippy for technical support during collection of goat samples. The authors also thank the University of Wisconsin Biotechnology Center DNA Sequencing Facility for providing facilities and services.
Supplementary Material
The Supplementary Material for this article can be found online at: https://www.frontiersin.org/articles/10.3389/fmicb.2018.02284/full#supplementary-material
References
Aranday-Cortes, E., Hogarth, P. J., Kaveh, D. A., Whelan, A. O., Villarreal-Ramos, B., Lalvani, A., et al. (2012). Transcriptional profiling of disease-induced host responses in bovine tuberculosis and the identification of potential diagnostic biomarkers. PLoS One 7:e30626. doi: 10.1371/journal.pone.0030626
Arsenault, R. J., Li, Y., Bell, K., Doig, K., Potter, A., Griebel, P. J., et al. (2012). Mycobacterium avium subsp. paratuberculosis inhibits gamma interferon-induced signaling in bovine monocytes: insights into the cellular mechanisms of Johne’s disease. Infect. Immun. 80, 3039–3048. doi: 10.1128/IAI.00406-12
Bhuju, S., Aranday-Cortes, E., Villarreal-Ramos, B., Xing, Z., Singh, M., and Vordermeier, H. M. (2012). Global gene transcriptome analysis in vaccinated cattle revealed a dominant role of IL-22 for protection against bovine tuberculosis. PLoS Pathog. 8:e1003077. doi: 10.1371/journal.ppat.1003077
Bickhart, D. M., Rosen, B. D., Koren, S., Sayre, B. L., Hastie, A. R., Chan, S., et al. (2017). Single-molecule sequencing and chromatin conformation capture enable de novo reference assembly of the domestic goat genome. Nat. Genet. 49, 643–650. doi: 10.1038/ng.3802
Blanco, F. C., Bianco, M. V., Meikle, V., Garbaccio, S., Vagnoni, L., Forrellad, M., et al. (2011). Increased IL-17 expression is associated with pathology in a bovine model of tuberculosis. Tuberculosis 91, 57–63. doi: 10.1016/j.tube.2010.11.007
Bush, R. D., Windsor, P. A., and Toribio, J. A. (2006). Losses of adult sheep due to ovine Johne’s disease in 12 infected flocks over a 3-year period. Aust. Vet. J. 84, 246–253.
Cho, J., Tauer, L. W., Schukken, Y. H., Gómez, M. I., Smith, R. L., Lu, Z., et al. (2012). Economic analysis of Mycobacterium avium subspecies paratuberculosis vaccines in dairy herds. J. Dairy Sci. 95, 1855–1872. doi: 10.3168/jds.2011-4787
Chow, S.-C., Shao, J., and Wang, H. (2008). Sample Size Calculations in Clinical Research. Boca Raton: Chapman & Hall/CRC.
Churbanov, A., and Milligan, B. (2012). Accurate diagnostics for bovine tuberculosis based on high-throughput sequencing. PLoS One 7:e50147. doi: 10.1371/journal.pone.0050147
Clancy, B. M., Johnson, J. D., Lambert, A. J., Rezvankhah, S., Wong, A., Resmini, C., et al. (2003). A gene expression profile for endochondral bone formation: oligonucleotide microarrays establish novel connections between known genes and BMP-2-induced bone formation in mouse quadriceps. Bone 33, 46–63.
Corbaz, A., ten Hove, T., Herren, S., Graber, P., Schwartsburd, B., Belzer, I., et al. (2002). IL-18-binding protein expression by endothelial cells and macrophages is up-regulated during active Crohn’s disease. J. Immunol. 168, 3608–3616.
Costanzo, M., VanderSluis, B., Koch, E. N., Baryshnikova, A., Pons, C., Tan, G., et al. (2016). A global genetic interaction network maps a wiring diagram of cellular function. Science 353:aaf1420. doi: 10.1126/science.aaf1420
Coussens, P. M., Verman, N., Coussens, M. A., Elftman, M. D., and McNulty, A. M. (2004). Cytokine gene expression in peripheral blood mononuclear cells and tissues of cattle infected with Mycobacterium avium subsp. paratuberculosis: evidence for an inherent proinflammatory gene expression pattern. Infect. Immun. 72, 1409–1422.
David, J., Barkema, H. W., Mortier, R., Ghosh, S., Guan le, L., and De Buck, J. (2014). Gene expression profiling and putative biomarkers of calves 3 months after infection with Mycobacterium avium subspecies paratuberculosis. Vet. Immunol. Immunopathol. 160, 107–117. doi: 10.1016/j.vetimm.2014.04.006
Dong, Y., Xie, M., Jiang, Y., Xiao, N., Du, X., Zhang, W., et al. (2013). Sequencing and automated whole-genome optical mapping of the genome of a domestic goat (Capra hircus). Nat. Biotechnol. 31, 135–141. doi: 10.1038/nbt.2478
Du, X., Servin, B., Womack, J. E., Cao, J., Yu, M., Dong, Y., et al. (2014). An update of the goat genome assembly using dense radiation hybrid maps allows detailed analysis of evolutionary rearrangements in Bovidae. BMC Genomics 15:625. doi: 10.1186/1471-2164-15-625
Du, Z., Zhou, X., Ling, Y., Zhang, Z., and Su, Z. (2010). agriGO: a GO analysis toolkit for the agricultural community. Nucleic Acids Res. 38, W64–W70. doi: 10.1093/nar/gkq310
Halls, M. L., and Cooper, D. M. (2010). Sub-picomolar relaxin signalling by a pre-assembled RXFP1, AKAP79, AC2, beta-arrestin 2, PDE4D3 complex. EMBO J. 29, 2772–2787. doi: 10.1038/emboj.2010.168
Hein, M. Y., Hubner, N. C., Poser, I., Cox, J., Nagaraj, N., Toyoda, Y., et al. (2015). A human interactome in three quantitative dimensions organized by stoichiometries and abundances. Cell 163, 712–723. doi: 10.1016/j.cell.2015.09.053
Hines, M. E. II, Stiver, S., Giri, D., Whittington, L., Watson, C., Johnson, J., et al. (2007). Efficacy of spheroplastic and cell-wall competent vaccines for Mycobacterium avium subsp. paratuberculosis in experimentally-challenged baby goats. Vet. Microbiol. 120, 261–283. doi: 10.1016/j.vetmic.2006.10.030
Hines, M. E. II, Turnquist, S. E., Ilha, M. R., Rajeev, S., Jones, A. L., Whittington, L., et al. (2014). Evaluation of novel oral vaccine candidates and validation of a caprine model of Johne’s disease. Front. Cell. Infect. Microbiol. 4:26. doi: 10.3389/fcimb.2014.00026
Janji, B., Vallar, L., Al Tanoury, Z., Bernardin, F., Vetter, G., Schaffner-Reckinger, E., et al. (2010). The actin filament cross-linker L-plastin confers resistance to TNF-alpha in MCF-7 breast cancer cells in a phosphorylation-dependent manner. J. Cell. Mol. Med. 14, 1264–1275. doi: 10.1111/j.1582-4934.2009.00918.x
Jurado, J. O., Pasquinelli, V., Alvarez, I. B., Pena, D., Rovetta, A. I., Tateosian, N. L., et al. (2012). IL-17 and IFN-gamma expression in lymphocytes from patients with active tuberculosis correlates with the severity of the disease. J. Leukoc. Biol. 91, 991–1002. doi: 10.1189/jlb.1211619
Kohler, H., Soschinka, A., Meyer, M., Kather, A., Reinhold, P., and Liebler-Tenorio, E. (2015). Characterization of a caprine model for the subclinical initial phase of Mycobacterium avium subsp. paratuberculosis infection. BMC Vet. Res. 11:74. doi: 10.1186/s12917-015-0381-1
Kutsch, S., Benini, J., Cooper, A., Hahn, C., Gerdes, J., Orme, I., et al. (1999). NOS2-derived nitric oxide regulates the size, quantity and quality of granuloma formation in Mycobacterium avium-infected mice without affecting bacterial loads. Immunology 98, 313–323.
Li, L., Wagner, B., Freer, H., Schilling, M., Bannantine, J. P., Campo, J. J., et al. (2017). Early detection of Mycobacterium avium subsp. paratuberculosis infection in cattle with multiplex-bead based immunoassays. PLoS One 12:e0189783. doi: 10.1371/journal.pone.0189783
Lin, J., Bao, Z. K., Zhang, Q., Hu, W. W., Yu, Q. H., and Yang, Q. (2015). Transcriptome analysis of the mammary gland from GH transgenic goats during involution. Gene 565, 228–234. doi: 10.1016/j.gene.2015.04.017
Love, M. I., Huber, W., and Anders, S. (2014). Moderated estimation of fold change and dispersion for RNA-seq data with DESeq2. Genome Biol. 15:550. doi: 10.1186/s13059-014-0550-8
Magombedze, G., Eda, S., and Ganusov, V. V. (2014). Competition for antigen between Th1 and Th2 responses determines the timing of the immune response switch during Mycobaterium avium subspecies paratuberulosis infection in ruminants. PLoS Comput. Biol. 10:e1003414. doi: 10.1371/journal.pcbi.1003414
Marteau, J. B., Mohr, S., Pfister, M., and Visvikis-Siest, S. (2005). Collection and storage of human blood cells for mRNA expression profiling: a 15-month stability study. Clin. Chem. 51, 1250–1252. doi: 10.1373/clinchem.2005.048546
McKenna, S. L., Sockett, D. C., Keefe, G. P., McClure, J., VanLeeuwen, J. A., and Barkema, H. W. (2005). Comparison of two enzyme-linked immunosorbent assays for diagnosis of Mycobacterium avium subsp. paratuberculosis. J. Vet. Diagn. Invest. 17, 463–466. doi: 10.1177/104063870501700510
NCBI (2016). NCBI Capra hircus Annotation Release 102. Available: https://www.ncbi.nlm.nih.gov/genome/annotation_euk/Capra_hircus/102/
Nicola, N. A., and Babon, J. J. (2015). Leukemia inhibitory factor (LIF). Cytokine Growth Factor Rev. 26, 533–544. doi: 10.1016/j.cytogfr.2015.07.001
Novick, D., Kim, S. H., Fantuzzi, G., Reznikov, L. L., Dinarello, C. A., and Rubinstein, M. (1999). Interleukin-18 binding protein: a novel modulator of the Th1 cytokine response. Immunity 10, 127–136.
Ott, S. L., Wells, S. J., and Wagner, B. A. (1999). Herd-level economic losses associated with Johne’s disease on US dairy operations. Prev. Vet. Med. 40, 179–192.
Schlecht, U., Miranda, M., Suresh, S., Davis, R. W., and St Onge, R. P. (2012). Multiplex assay for condition-dependent changes in protein-protein interactions. Proc. Natl. Acad. Sci. U.S.A. 109, 9213–9218. doi: 10.1073/pnas.1204952109
Seto, S., Tsujimura, K., and Koide, Y. (2012). Coronin-1a inhibits autophagosome formation around Mycobacterium tuberculosis-containing phagosomes and assists mycobacterial survival in macrophages. Cell. Microbiol. 14, 710–727. doi: 10.1111/j.1462-5822.2012.01754.x
Shippy, D. C., Lemke, J. J., Berry, A., Nelson, K., Hines, M. E. II, and Talaat, A. M. (2017). Superior protection from live-attenuated vaccines directed against Johne’s disease. Clin. Vaccine Immunol. 24:e00478-16. doi: 10.1128/CVI.00478-16
Singh, S. V., Singh, P. K., Singh, A. V., Sohal, J. S., Gupta, V. K., and Vihan, V. S. (2007). Comparative efficacy of an indigenous ’inactivated vaccine’ using highly pathogenic field strain of Mycobacterium avium subspecies paratuberculosis ’Bison type’ with a commercial vaccine for the control of Capri-paratuberculosis in India. Vaccine 25, 7102–7110. doi: 10.1016/j.vaccine.2007.07.054
Sockett, D. C., Carr, D. J., and Collins, M. T. (1992). Evaluation of conventional and radiometric fecal culture and a commercial DNA probe for diagnosis of Mycobacterium paratuberculosis infections in cattle. Can. J. Vet. Res. 56, 148–153.
Souza, C., Davis, W. C., Eckstein, T. M., Sreevatsan, S., and Weiss, D. J. (2013). Mannosylated lipoarabinomannans from Mycobacterium avium subsp. paratuberculosis alters the inflammatory response by bovine macrophages and suppresses killing of Mycobacterium avium subsp. avium organisms. PLoS One 8:e75924. doi: 10.1371/journal.pone.0075924
Stabel, J. R. (2000). Cytokine secretion by peripheral blood mononuclear cells from cows infected with Mycobacterium paratuberculosis. Am. J. Vet. Res. 61, 754–760.
Stabel, J. R., Palmer, M. V., Harris, B., Plattner, B., Hostetter, J., and Robbe-Austerman, S. (2009). Pathogenesis of Mycobacterium avium subsp. paratuberculosis in neonatal calves after oral or intraperitoneal experimental infection. Vet. Microbiol. 136, 306–313. doi: 10.1016/j.vetmic.2008.11.025
Sweeney, R. W., Jones, D. E., Habecker, P., and Scott, P. (1998). Interferon-gamma and interleukin 4 gene expression in cows infected with Mycobacterium paratuberculosis. Am. J. Vet. Res. 59, 842–847.
Szklarczyk, D., Franceschini, A., Wyder, S., Forslund, K., Heller, D., Huerta-Cepas, J., et al. (2015). STRING v10: protein-protein interaction networks, integrated over the tree of life. Nucleic Acids Res. 43, D447–D452. doi: 10.1093/nar/gku1003
Tiwari, A., VanLeeuwen, J. A., McKenna, S. L., Keefe, G. P., and Barkema, H. W. (2006). Johne’s disease in Canada Part I: clinical symptoms, pathophysiology, diagnosis, and prevalence in dairy herds. Can. Vet. J. 47, 874–882.
Velez, D., Hulme, W., Myers, J., Weinberg, J., Levesque, M., Stryjewski, M., et al. (2009). NOS2A, TLR4, and IFNGR1 interactions influence pulmonary tuberculosis susceptibility in African-Americans. Hum. Genet. 126, 643–653. doi: 10.1007/s00439-009-0713-y
Verschoor, C. P., Pant, S. D., You, Q., Kelton, D. F., and Karrow, N. A. (2010). Gene expression profiling of PBMCs from Holstein and Jersey cows sub-clinically infected with Mycobacterium avium ssp. paratuberculosis. Vet. Immunol. Immunopathol. 137, 1–11. doi: 10.1016/j.vetimm.2010.03.026
Waddell, L. A., Rajic, A., Stark, K. D., and McEwen, S. A. (2016). The potential public health impact of Mycobacterium avium ssp. paratuberculosis: global opinion survey of topic specialists. Zoonoses Public Health 63, 212–222. doi: 10.1111/zph.12221
Walzl, G., Ronacher, K., Hanekom, W., Scriba, T. J., and Zumla, A. (2011). Immunological biomarkers of tuberculosis. Nat. Rev. Immunol. 11, 343–354. doi: 10.1038/nri2960
Waters, W. R., Maggioli, M. F., Palmer, M. V., Thacker, T. C., McGill, J. L., Vordermeier, H. M., et al. (2015). Interleukin-17A as a biomarker for bovine tuberculosis. Clin. Vaccine Immunol. 23, 168–180. doi: 10.1128/CVI.00637-15
Whittington, R. J., and Sergeant, E. S. G. (2001). Progress towards understanding the spread, detection and control of Mycobacterium avium subsp. paratuberculosis in animal populations. Aust. Vet. J. 79, 267–278.
Keywords: Johne’s disease, goats, transcription, genetic, biomarkers, pathogenesis
Citation: Berry A, Wu C-w, Venturino AJ and Talaat AM (2018) Biomarkers for Early Stages of Johne’s Disease Infection and Immunization in Goats. Front. Microbiol. 9:2284. doi: 10.3389/fmicb.2018.02284
Received: 02 May 2018; Accepted: 07 September 2018;
Published: 28 September 2018.
Edited by:
Juarez Antonio Simões Quaresma, Instituto Evandro Chagas, BrazilReviewed by:
Vikram Saini, All India Institute of Medical Sciences, IndiaJavier Bezos, Complutense University of Madrid, Spain
Copyright © 2018 Berry, Wu, Venturino and Talaat. This is an open-access article distributed under the terms of the Creative Commons Attribution License (CC BY). The use, distribution or reproduction in other forums is permitted, provided the original author(s) and the copyright owner(s) are credited and that the original publication in this journal is cited, in accordance with accepted academic practice. No use, distribution or reproduction is permitted which does not comply with these terms.
*Correspondence: Adel M. Talaat, YXRhbGFhdEB3aXNjLmVkdQ==
†These authors have contributed equally to this work