- 1FISIOCOMP Laboratory, PPGMC, Universidade Federal de Juiz de Fora, Juiz de Fora, Brazil
- 2Department of Mathematics and Center for Infectious Disease Dynamics, The Pennsylvania State University, State College, PA, United States
- 3Mathematics Department, Tulane University, New Orleans, LA, United States
- 4IAME, UMR 1137, Institut National de la Santé et de la Recherche Médicale, Université Paris Diderot, Sorbonne Paris Cité, Paris, France
- 5Theoretical Biology and Biophysics, Los Alamos National Laboratory, Los Alamos, NM, United States
The dynamics of hepatitis C virus (HCV) RNA during translation and replication within infected cells were added to a previous age-structured multiscale mathematical model of HCV infection and treatment. The model allows the study of the dynamics of HCV RNA inside infected cells as well as the release of virus from infected cells and the dynamics of subsequent new cell infections. The model was used to fit in vitro data and estimate parameters characterizing HCV replication. This is the first model to our knowledge to consider both positive and negative strands of HCV RNA with an age-structured multiscale modeling approach. Using this model we also studied the effects of direct-acting antiviral agents (DAAs) in blocking HCV RNA intracellular replication and the release of new virions and fit the model to in vivo data obtained from HCV-infected subjects under therapy.
Introduction
Chronic hepatitis C virus (HCV) infection affects about 130–150 million people worldwide and is the primary cause of liver cirrhosis and liver cancer (WHO, 2016). HCV has a linear positive strand RNA molecule with ~9,600 nucleotides as its genome and has been classified as belonging to the genus Hepacivirus in the Flaviridae family (Appel et al., 2006; Gastaminza et al., 2008). For many years HCV replication was not completely understood due to the inability to culture virus in vitro. However, the development of an HCV cell culture (HCVcc) system has allowed investigation of the processes that govern HCV replication and other features of its life cycle (Appel et al., 2006; Elliot et al., 2009; Afzal et al., 2015). Moreover, new means of distinguishing and quantifying both positive and negative HCV RNA strands have been developed and improved (Bessaud et al., 2001; Craggs et al., 2001).
HCV primarily infects liver cells, called hepatocytes. After entry into a hepatocyte, the positive strand HCV RNA is uncoated and translated into a polyprotein from which all HCV proteins are produced. The HCV NS5B RNA-dependent RNA polymerase copies the positive HCV RNA into one or more HCV RNA negative strands. The nonstructural HCV proteins together with negative strand HCV RNA form replication complexes, the molecular machines responsible for producing more positive strands of HCV RNA (Quinkert et al., 2005). The newly produced positive strands can either be used for translation, replication or be assembled into virus particles and exported from the infected cell. How the decision among the options is made remains unclear (Appel et al., 2006; Elliot et al., 2009; Bisceglie, 2010). HCV RNA replication depends not only on HCV proteins but host factors also play an important role (Scheller et al., 2009; Jangra et al., 2010).
Guedj et al. (2013) developed an age-structured multiscale model of HCV infection and treatment including the dynamics of intracellular viral RNA (vRNA). The model has been analyzed mathematically and various approximate solutions derived (Rong et al., 2013; Rong and Perelson, 2013).
Age-structured models have been widely used to study the epidemiology of infectious diseases, such as HIV (Thieme and Castillo-Chavez, 1993), hepatitis C (Martcheva and Castillo-Chavez, 2003) and tuberculosis (Castillo-Chavez and Feng, 1997; Thieme and Castillo-Chavez, 2002). Nelson et al. (2004) presented an age-structured model of the dynamics of within host HIV. Gilchrist et al. (2004) used an age-structured model to explore how the intracellular HIV production rate influenced the virus' fitness. One advantage of using such an approach is the possibility of considering that individuals or cells with distinct ages could behave differently (Li and Brauer, 2008). Using that approach in modeling the dynamics of virus within a host allows a realistic representation of infection biology in which the rate of production and release of new virus is not constant but rather depends on the length of time a cell has been infected. Moreover, the model can also account for an infected cell death rate that depends on the time the cell has been infected.
The Guedj et al. (2013) age-structured multiscale model of HCV infection only considered the dynamics of positive strand HCV RNA. Guedj and Neumann (2010) studied the intracellular dynamics of both positive- and negative-strand viral RNA. They used ordinary differential equations to represent the number of positive-strands of viral RNA, available for transcription and translation, and the number of negative-strands of viral RNA or “replication units.” Benzine et al. (2017) developed a more detailed ordinary differential equation model in which they distinguished positive strand HCV RNA used for translation, replication and viral assembly. However, both Guedj and Neumann (2010) and Benzine et al. (2017) did not consider that the number of positive and negative strands of viral RNA depend on how long a cell has been infected.
Here we used a three-equation age-structured model for intracellular HCV RNA dynamics, introduced by Quintela et al. (2017), which incorporated negative strand HCV RNA as well as the positive-strand HCV RNA available for translation and replication separately and validated the model by comparison to in vitro experiments. We then coupled this intracellular model to a well-established cell infection model and showed the model was able to fit in vivo viral load data obtained from patients treated with direct acting antiviral (DAA) therapy.
Materials and Methods
Intracellular Model of HCV Replication
We developed a mathematical model to represent the intracellular replication of HCV shown schematically in Figure 1. The model allows the study of aspects such as translation of positive-strand HCV RNA after cell entry, transfer of the positive strand to the membranous web where it is used for replication, production of negative- and positive-strand HCV RNA within replication complexes and secretion of positive-strand RNA as virions. The replication of HCV RNA has been studied in detail c.f. (Chatel-Chaix and Bartenschlager, 2014; Li et al., 2015).
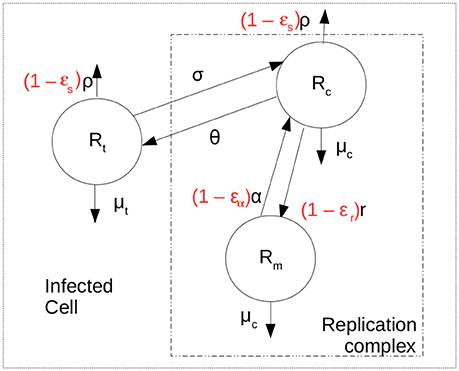
Figure 1. Intracellular model scheme. After cell entry positive strand HCV RNA is available for translation, represented by Rt. It can be exported at rate ρ and decay at rate μt. Negative or minus strand HCV RNA (Rm) is produced at maximum rate r and forms the replication complexes that produce more positive strand RNA (Rc) at rate α. It is assumed that HCV RNA inside the replication complex in both orientations have the same decay rate μc. The positive strand HCV RNA available for translation is assumed to move into replication complexes at rate σ and from replication complexes at rate θ. The terms in red represent the action of therapy in blocking secretion and production of viral RNA.
The system of ordinary differential equations used to represent the dynamics of intracellular infection over time is
where Rt represents positive strand HCV RNA used for translation, Rc represents positive strands within replication complexes used for replication, Rm represents minus (or negative) strand RNA and a represents the time a cell has been infected. Positive strand HCV RNA forms the viral genome. After cell entry, cellular machinery translates this positive strand RNA into a polyprotein in the cytoplasm (Shi and Lai, 2006). However, after polyproteins are made the positive strand must also be used for replication and must be copied into minus stand RNA. We assume that the positive-strand HCV RNA used for translation (Rt in Equation 1) moves from the cytoplasm into what is called the membranous web and interacts with the proteins needed for replication to become a species we call Rc at rate σ per strand. We also assume the positive strand in the cytoplasm, Rt has a natural decay rate of μt per strand. Lastly, positive strands need to be assembled into virions which are then exported from the infected cell. Virion assembly occurs in association with cytosolic lipid droplets (Chatel-Chaix and Bartenschlager, 2014). As it is not clear whether the positive strand RNA in the membranous web needs first to be transported into the cytosol for viral assembly, we assume both Rt and Rc can be assembled into virions and exported at rate ρ(a). The time-dependence of ρ will be discussed below. Further, we assume positive-strand HCV RNA in the replication complex (Rc) can move out of the replication complex and membranous web and back into the cytoplasm to become Rt at rate θ. More detailed models can be developed that separate virion assembly from secretion and that include a separate compartment of positive strand RNA used for virion assembly (cf. Benzine et al., 2017), but here for simplicity we have combined these steps.
Minus-strand HCV RNA (Rm) is formed in the replication complex by copying the positive strand Rc at maximum rate r. As in Guedj and Neumann (2010), it is assumed that host factors limit the replication of negative-strand RNAs, so that as the maximum number Rmax is reached replication slows according to a logistic growth law. The positive strands in replication complexes, Rc, are copied from the negative strand template at rate α per template. We consider that both Rc and Rm are in the replication complex and decay at the same per capita rate μc.
In order to have a positive equilibrium when the model represents an established infection, the parameters need to satisfy the relations: and in which ϕ1 = θ + ρ + μt and ϕ2 = σ + ρ + μc.
Delay in Particle Assembly
Following translation and replication, positive-strand HCV RNA is assembled into a virus particle that can then be exported out of the cell (Lindenbach and Rice, 2013). Such assembly can not begin immediately after infection as viral proteins are needed as components of the virion and hence first need to be produced. The release of virus by an infected cell in vitro is observed approximately 12 h after infection (Keum et al., 2012).
To incorporate this biological delay, τ, we assume the viral secretion rate is a function of the length of time a cell has been infected, i.e., its age of infection. The function we use is
where a = 0 is the time of infection and the constant ρ is the maximum secretion rate. This functional form was chosen to avoid any discontinuities.
When we analyze in vitro experiments, the kinetics of secreted HCV RNA, Rs can be represented by the differential equation
where ρ(a) is the secretion rate and cs is the rate of clearance or degradation of secreted HCV RNA, which is estimated from the data.
Coupling of Multiple Scales
We also analyze in vivo data in which the effects of antiviral treatment on kinetics of HCV RNA levels in plasma are measured. To fit this data we introduced a new multiscale model depicted in Figure 2.
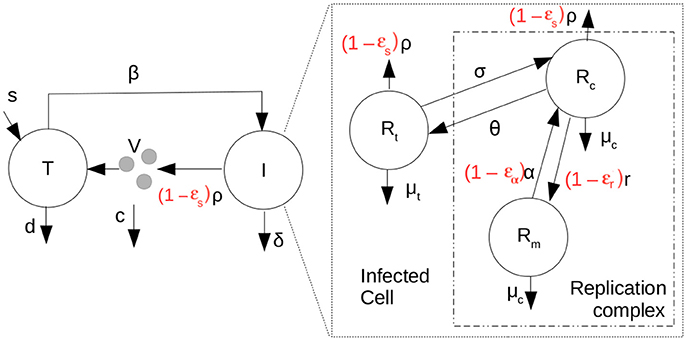
Figure 2. Scheme representing the coupled multiscale model with therapy (parameters in red). T are target cells, I, infected cells and V, the HCV RNA concentration in plasma. Target cells become infected at rate β.
The intracellular portion of the multiscale model with treatment is represented by the following partial differential equations (PDEs) in which t represents clock time and a the age of an infected cell:
We have assumed that intracellular infection is initiated by the introduction of Rt0 positive HCV RNA strands into the cytoplasm of a cell. Typically, we shall assume that infection is the result of a single virion, carrying a single positive-strand HCV RNA, entering a cell, so that Rt0 = 1. Further, we shall assume that the individual's being treated with antivirals are chronically infected and have reached steady state in which , and are the steady state distributions of positive-strand HCV RNA in translation and in replication complexes and negative-strand HCV RNA in replication complexes, respectively, in the absence of treatment and are given by the steady state solutions of the ODEs in Equation (1). Further, we let ϵα be the effectiveness of therapy in decreasing or blocking positive-strand RNA replication, ϵr the effectiveness of therapy in decreasing or blocking negative-strand RNA replication, and ϵs the effectiveness of therapy in decreasing or blocking secretion of positive-strand RNA, where for each of the ϵ's, ϵ = 1 corresponds to a 100% effective drug and ϵ = 0 corresponds to a completely ineffective or absent drug. Further κt is a factor by which therapy changes the degradation rate of positive-strand RNA used for translation and κc is the factor by which therapy changes the degradation rate of both positive and negative strand RNA in replication complexes.
To complete the multiscale model, we then coupled the intracellular model to an established HCV cellular infection model (Equation 5) (Neumann et al., 1998; Canini and Perelson, 2014).
in which, T are target cells, I, infected cells and V the HCV RNA concentration in plasma. Target cells become infected at rate β, have a constant source rate s and a natural per capita decay rate d. The parameter δ(a) represents the death rate of an infected cell of age “a” and the effects of therapy on the virus export are given by ϵs. Here for simplicity we shall only analyze the case in which δ(a) is a constant, δ. Virus in the plasma is cleared from the circulation at per capita rate c. Here we have assumed that at t = 0, the time therapy starts, the system is in steady state, where Ī(a) is the steady-state distribution of infected cells, which can be shown to be Ī(a) = . , where N is the steady state total amount of virus secreted by an infected cell over its lifetime, , and . See Rong et al. (2013). The coupling between the intracellular and extracellular models occurs through the equation for V, the virus in the plasma. The amount of plasma virus depends on the number of infected cells and number of virions being packaged and exported per infected cell. This coupling has been used before (Guedj et al., 2013; Rong et al., 2013; Rong and Perelson, 2013).
Numerical Algorithms
The model equations were discretized in space, i.e., age, and integrated in time using the method of lines (MOL) approach (Sadiku and Obiozor, 2000; Shakeri and Dehghan, 2008) where the partial derivatives in age were approximated by finite-differences and the solution at the grid points was integrated along lines in time. We integrated the equations using the Matlab® ordinary differential equation Runge-Kutta solver ode45.
The domain was discretized on a uniform grid of 201 mesh points between ages 0 and 50 days, as it is unlikely for an infected cell to live longer than this. The boundary of domain at a = 50 was defined as a simple outflow boundary condition and was incorporated into the numerical solution by linearly extrapolating the solution to two buffer grid points outside the domain. The partial derivatives in age were approximated with fourth-order centered finite differences.
We verified the convergence of the numerical solution to an accuracy of 10−3 by varying the number of spatial grid points and the time integration error tolerance.
The simulation time was varied according to the length of time that virus was detected in plasma after therapy initiation in the data we analyzed. The computer run time were typically a few seconds for a single simulation using a laptop computer.
We used the Matlab® nonlinear optimization program fmincon to fit the solutions of the model to the experimental data by minimizing the L2 norm of the residual difference between the model solution and the data. This routine was chosen due to the possibility of specifying lower and upper bounds for the parameters we wanted to estimate. The algorithm we used was “interior-point” as it satisfies the bounds at all iterations.
The data we fit to validate the model was obtained from different sources. We extracted in vitro data from Keum et al. (2012) and Binder et al. (2013) using the on-line tool WebPlotDigitizer (Rohatgi, 2016). We also fit clinical trial data from Guedj et al. (2013) that we had access to.
Because our models have a large number of parameters we numerically approximated the Hessian of the objective function at the optimal parameter values. At a minimum, the gradient of the objective function is zero. If an eigenvalue of the Hessian is zero at the minimum, then the gradient remains zero along the direction of the associated eigenvector. That is, the solution is not unique (identifiable) (Beck, 2014). Here, for each of the data sets we fit, at the optimum, all of the eigenvalues of the Hessian were positive, and the condition number was below 104, indicating that the parameters were locally identifiable.
Results
Calibrating Intracellular Parameters in the Absence of Therapy
To validate the intracellular mathematical model, we first compared the results of Equation (1) to transfection experiments performed by Binder et al. (2013). In that paper the authors used two distinct cell lines to assess HCV RNA replication over 72 h: (a) Huh7-Lunet cells which are highly permissive to HCV RNA replication and (b) Huh7 cells (Huh7-lp) which presents lower levels of HCV RNA replication. They measured positive-strand and negative-strand RNA by strand specific quantitative Northern blotting. Binder et al. (2013) developed a complex mathematical model that included 13 molecular species with 16 parameters in two compartments: the cytoplasm and a replication compartment.
Using the three equation mathematical model, Equation (1), we were able to fit the dynamics of both positive and negative strand HCV RNA in both the high and low permissive cell lines (Figure 3). Our model was able to replicate the initial decay seen after transfection with both types of cells and the plateau during the 72 h measured (Figures 3A,B).
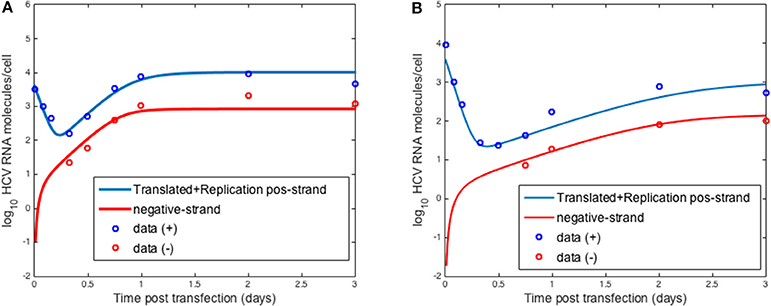
Figure 3. HCV RNA replication. Circles represent experimental data from Binder et al. (2013) and lines show the results obtained with the model described herein with distinct sets of parameters for (A) high and (B) low permissive cells.
In fitting the data, the parameters used to describe the age-dependent virion export rate, ρ(a), were fixed at ρ = 0.1 d−1, τ = 0.5 d−1 and k = 0.8 d−1. We set τ at 0.5 d−1 based on the fact that Keum et al. (2012) could not detect any extracellular virus until 12 h post-infection. We further tested different values of τ and k and chose the values that gave the best fits to the data in both the Binder and Keum experiments. Choosing the export rate as a time-dependent function rather than a constant allowed us to have an initial delay followed by a smooth transition to the maximum export ρ. Regarding the maximum export rate, ρ, we at first chose the value estimated by Guedj et al. (2013) based on fitting in vivo data. However, using this value did not give good fits to the in vitro data. We then scanned through different values and chose the one giving the best fit. HCV uses the host cell export machinery and thus it is not surprising that these parameters differ between in vitro and in vivo systems.
The initial number of HCV positive strands introduced into these cells to initiate HCV replication in this in vitro system was Rt0 = 4, 000 molecules cell−1. Other parameters of the model were estimated using the fmincon routine in Matlab and are shown in Table 1.
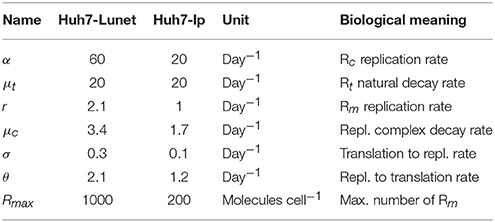
Table 1. Model parameter values estimated for the in vitro transfection experiments in Binder et al. (2013).
Another form of validation we performed was testing the model predictions by comparing to positive-strand measurements using a replication deficient replicon (Binder et al., 2013). By setting the rate at which positive-strand RNA goes from use in translation to use in replication (σ) to zero we could compare the results obtained with the model to the measurements reported by Binder et al. (2013) Without replication, the initial amount of transfected HCV RNA decays exponentially and no negative-strand is formed. Further as Binder et al. show the decay of positive strand RNA is similar in both the high permissive and low permissive cell lines. We simulated the intracellular model with the parameters that were estimated for the highly-permissive cell line (Table 1) and the results are shown in Figure 4. The results using the parameters for the low permissive cell line are the same.
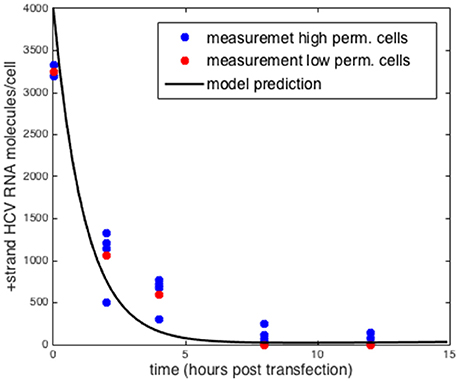
Figure 4. Comparison to measurements of replication deficient HCV RNA in high and low permissive cells. Model prediction setting σ = 0 for both sets of parameters. Data taken from Binder et al. (2013).
Sensitivity Analysis of the Intracellular Model
Forward sensitivity analysis was performed to estimate how the model solution is affected by small perturbations to each model parameter. The sensitivity index was defined as the ratio:
in which, J denotes a model output that depends on a parameter p, δ is some perturbation to the parameter p and δJ is the resulting perturbation to the output J.
The sensitivity index is a measure of the percentage of change in the output given a perturbation in each parameter. We varied by 10% the value of each parameter, while other parameters were kept the same, and calculated the sensitivity index of each parameter to the resulting value of Rt, Rc and Rm at 72 h (Figure 5). Positive values indicate an increase in the output given the increase in the parameter and negative values indicate that the output decreases as we increase the parameter.
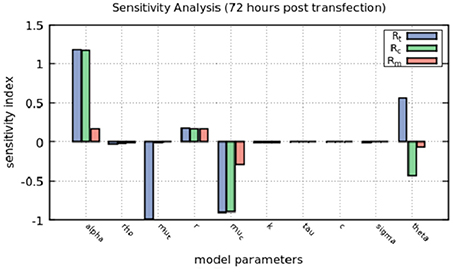
Figure 5. Sensitivity analysis of the model at 72 h. The positive-strand RNA replication rate, α, the natural decay rates for positive-strand RNA used for translation and within replication complexes, μt and μc, repectively and the rate at which positive-strand RNA goes from replication complexes to the cytoplasm to be translated, θ, are the most sensitive parameters in the model.
The sensitivity index confirms that perturbing α, the positive-strand RNA replication rate, increases by more than 10% the amount of positive-strand RNA used for translation and in replication complexes. μt represents the natural decay rate of translated RNA and changes in that parameter decreases positive-strand RNA in translation and μc, the natural decay rate for both positive and negative strands in the replication complex, affects mainly the positive-strand RNA.
Calibrating the Intracellular Parameters for a Different in Vitro Experiment
We also compared the intracellular model to experiments in vitro performed by Keum et al. (2012) in which a high multiplicity of infection was used (MOI = 5 or 6) so that only one round of infection occurred. Theoretically, with an MOI of 5, 99.3% of cells should be infected with a least one infectious virion (Keum et al., 2012). A cell culture adapted HCV, JFH-m4, was incubated with Huh7.5.1 cells for 3 h to initiate infection. At subsequent times cells and supernatant were harvested to measure HCV RNA levels intra-cellularly and the amount secreted into the medium. Keum et al. quantified the number of positive and negative HCV RNA strands using real-time RT-PCR. As shown in Figure 6 the number of cell-associated positive strands initially decreased reaching a minimum of about 1 positive strand per cell at 6 h post-infection (pi). Intracellular negative strand, which serves as a template for making new positive strands, was first detected at 6 h pi. Our model was able to reproduce the observed intracellular HCV RNA dynamics (Figure 6) as well as the dynamics of positive strand HCV RNA secreted into the media (Figure 7). As before we fixed the export rate with ρ = 0.1 d−1, τ = 0.5 d−1, and k = 0.8 d−1. The initial time t0 = 0, Rt0 = 12.8 and no therapy was given (Figure 7). Other parameters were estimated and were found to be α = 30 d−1, μt = 24 d−1, r = 3.18 d−1, μc = 1.05 d−1, Rmax = 100 molecules, σ = 0.1 d−1 and θ = 1.2 d−1. As both the cell line and virus used in these experiments are different than the ones used by Binder et al. (2013), it is surprising that resulting parameters do not differ very much from those we estimated in the previous section for high and low-permissive cells.
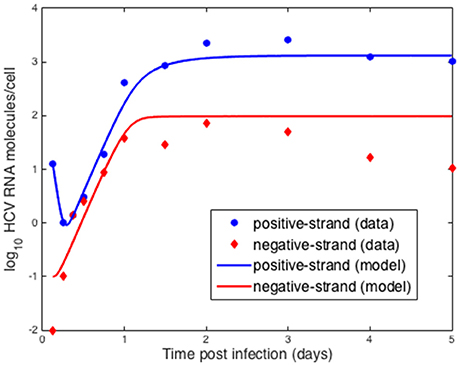
Figure 6. Comparison of model results to in vitro infection data. Data points were extracted from Keum et al. (2012) and the lines were obtained by fitting the intracellular model to the data where we assumed the measured positive strands were the sum of the positive strands used for translation, Rt and in replication complexes, Rc. As before we fixed the export rate with ρ = 0.1 d−1, τ = 0.5 d−1, and k = 0.8 d−1. The initial time t0 = 0. Based on the data we set Rt0 = 12.8. Other parameters were estimated and were found to be α = 30 d−1, μt = 24 d−1, r = 3.18 d−1, μc = 1.05 d−1, Rmax = 100 molecules, σ = 0.1 d−1 and θ = 1.2 d−1.
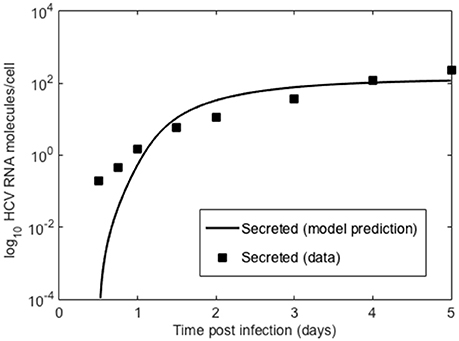
Figure 7. Secreted HCV RNA. Data points from Keum et al. (2012) and lines are the model prediction based on Equation (1).
In Vivo Effect of Therapy With an NS5A Inhibitor
We validated the coupled multiscale model by fitting Equations (4) and (5) to data obtained from patients treated with one dose of 10 or 100 mg of daclatasvir (DCV) (Guedj et al., 2013). DCV inhibits the action of the HCV NS5A protein, which has been shown to play an important role in HCV RNA replication and secretion (Lee, 2013; Scheel and Rice, 2013). This data was previously analyzed by Guedj et al. (2013) using a much simpler multiscale model that only considered HCV positive strand RNA dynamics.
We assumed that the parameters that represent in vivo infection dynamics are different from those we estimated for in vitro infection as both the virus and target cells are different. We also assumed that there was no superinfection, so that only one virus infects each cell. Using the same approach as for the intracellular model, we performed a sensitivity analysis of the coupled model parameters in order to determine how sensitive the predicted viral load is to each parameter. We chose to vary each parameter one at a time and compared how they affected the predicted viral load at day 2 on therapy.
The sensitivity index was calculated using Equation (6) and the results are shown in Figure 8. Intracellular parameters such as the replication and decay rates of HCV RNA, α, r, μc are the ones which the viral load is most sensitive to. The parameters that represents the export rate, ρ, and infected cell decay rate δ, are also important to define the viral load.
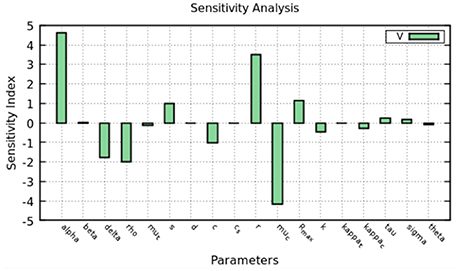
Figure 8. Sensitivity analysis of the model at 2 days. The figure shows how much a perturbation of the parameters influence the viral load (V).
A baseline in vivo set of parameters was fixed based on the literature: α = 30 d−1, ρ = 8.18 d−1, δ = 0.14 d−1, and c = 22.3 d−1 were taken from Rong et al. (2013) and ϵs = 0.998 was taken from Guedj et al. (2013). The remaining parameters were estimated and their values are shown in Table 2.
Figures 9, 10 depict the results obtained with the multiscale model for each patient. We fixed the replication rate of positive strand HCV RNA α = 30 d−1 and considered no enhancement in HCV RNA decay with therapy, κt = κc = 1. Our model predicted that initiation of therapy affects the replication of both positive and negative strands and that initially there is a slightly increase in the number of positive strand HCV RNAs used for translation (Figure 10). This increase is most likely due to the fact that DCV effectively blocks secretion of positive strands thus allowing them to accumulate in the cytoplasm. Therapy also blocks the appearance of new replication complexes, which only decrease in the presence of the drug (Figure 10).
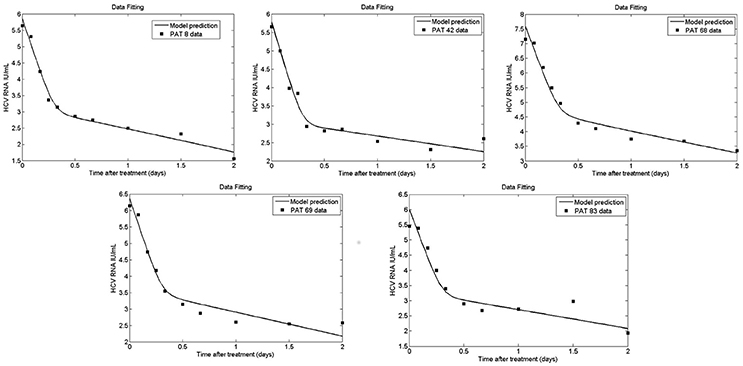
Figure 9. Fit of coupled multiscale model (solid line) to patient viral load data (squares) from Guedj et al. (2013). All 5 patients were treated with one dose of 10 or 100 mg of daclatasvir. The best-fit parameters are shown in Table 2.
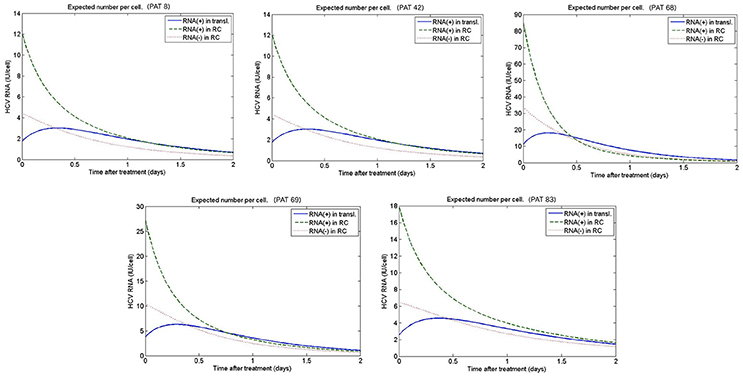
Figure 10. Predicted intracellular HCV RNA obtained from fitting the patient data from Guedj et al. (2013). The best-fit parameters are shown in Table 2.
Discussion
HCV infection and treatment has been modeled using variants of the basic model of viral infection starting with the work of Neumann et al. (1998). This initial ordinary differential equation model was followed by others and various clinical applications were shown (Layden et al., 2003; Layden-Almer et al., 2003; Powers et al., 2003; Ribeiro et al., 2003; Dixit and Perelson, 2004; Dahari et al., 2005, 2006, 2007a,b; Shudo et al., 2008a,b; Dahari et al., 2009; Reluga et al., 2009). These models were all based on the standard treatment at the time using type I interferon alone or in combination with ribavirin. When new small molecule inhibitors of HCV replication, such as the protease inhibitor telaprevir, were introduced parameters that were thought to reflect the host response to infection, such as the loss rate of infected cells (Guedj and Perelson, 2011) and the clearance rate of free virus (Adiwijaya et al., 2009) were found to change with the drug being used. To make sense of these findings a multiscale model was introduced by Guedj et al. (2013) that showed that the protease inhibitor telaprevir and the HCV NS5A inhibitor daclatasvir affected both viral replication and viral production. The Guedj et al. model only included postive strand HCV RNA and did not distinguish between the various functions of this RNA. However, the model showed that to fully understand the modes of action of anti-HCV drugs one would need to develop more detailed models of the viral lifecycle and couple them to models of cellular infection. Here we have done just that.
As negative-strand HCV RNA is only synthesized during viral replication, it should be considered a more reliable marker of viral replication than positive-strand HCV RNA (Yuki et al., 2005). In this work, the dynamics of negative-strand HCV RNA during replication was added to a multiscale age-structured model of HCV infection to better represent the steps of HCV replication inside of infected cells. Moreover, the addition of positive-strand RNA used for translation to the model is a new feature that allowed us to understand the initial decay in positive strand HCV RNA observed in in vitro experiments (Keum et al., 2012; Binder et al., 2013) before viral replication expanded the population of positive strands. This pool of HCV RNA is also a possible target of therapy and hence it is valuable to represent it in models. Another novel feature of our model was that we modeled the rate of export of positive strand HCV RNA not as a constant but rather as an increasing function of the time a cell has been infected. In this way, the initial positive strand RNA used to infect a cell has time to replicate before it is assembled into virions. The intracellular model was fit to two different in vitro experiments and was able to account for the intracellular dynamics seen in both as well as for the amount of positive strand HCV RNA secreted as virions into the medium in the experiment by Keum et al. (2012).
A sensitivity analysis of both the intracellular model and the multiscale model was performed indicating that the results are more sensitive to some parameters than others. In particular, the viral load is sensitive to the choice of intracellular parameters. The choice of parameters to be estimated or fixed was based on the availability of their values in the literature and which were more influential in determining the viral load during the sensitivity analysis.
The multiscale model presented here was able to reproduce the viral load during therapy and also the intracellular concentrations of positive and negative strands of HCV RNA observed during in vitro transfection experiments. Interestingly, the estimates of some parameters made from in vitro experiments were similar to estimates made from patient data. For example, we estimated that the replication rate constant for negative strand HCV RNA in the highly permissive Huh7-Lunet cells was 2.1 d−1, whereas our in vivo estimates varied between 1.1 d−1 and 5.1 d−1 with a mean of 2.3 d−1. Similarly, we estimated that the rate of decay of replication complexes, μc in Huh7-Lunet cells was 3.4 d−1, whereas our in vivo estimates ranged between 1.7 d−1 and 3.4 d−1, with a mean of 2.6 d−1. The estimate of the rate of decay of positive strands used for translation differed significantly between in vivo and in vitro, possibly due to more efficient depletion of positive strands in vivo by packaging into virions and secretion.
The model allows the effects of therapy to be estimated in terms of the targets: production of positive and negative stranded HCV RNA, secretion of new virions, and the enhancement in degradation of both strands of HCV RNA. Our estimate of the effectiveness of daclatasvir (DCV) treatment in blocking positive strand synthesis was between 0.91 and 0.99, whereas in Guedj et al. the mean was 0.99. More strikingly, we estimated that DCV was not nearly efficient in blocking negative strand synthesis, with estimates of ϵr ranging from 0.12 to 0.61 with a mean of 0.37. Thus, our model predicts that the NS5A inhibitor DCV is not very effective at blocking negative strand synthesis. This is consistent with the in vitro finding of McGivern et al. (2014) that NS5A inhibitors have no activity against preformed replication complexes and only inhibit the formation of new ones. If this is also true in vivo, then production of negative strand HCV RNA from existing replication complexes would continue in the presence of an NS5A inhibitor yielding a very low effectiveness of DCV in blocking this step of the HCV life cycle. However, preformed replication complexes also produce positive strands and why this production seems to be efficiently inhibited remains to be explained.
In summary, we have developed a new multiscale model of HCV replication and spread by cellular infection. The model is more realistic than the simple model developed by Guedj et al. (2013) that only contained positive strand RNA and more realistic than the prior model of Guedj and Neumann, which tracked positive strand RNA and replication complexes (Guedj and Neumann, 2010) but that was never fit to data. Here we showed that a model with positive strands used for translation separate from those used for replication as well as negative strands could fit both in vitro and in vivo data. More tests and refinement of the model may be needed, but it seems apparent that one does not need to introduce the complexity of the Binder model (Binder et al., 2013) or the earlier Dahari et al. model (Dahari et al., 2007c), both of which modeled HCV replication in enormous detail, in order to explain the in vitro and on vivo data analyzed here.
Author Contributions
AP, JC, and JG contributed to conception and design of the study; BQ worked on the simulations, performed the statistical analysis and wrote the first draft of the manuscript; JH developed the MATLAB® solver and wrote sections of the manuscript. All authors contributed to manuscript revision, read and approved the submitted version.
Funding
Portions of this work were performed under the auspices of the U.S. Department of Energy under contract DE-AC52-06NA25396. This work was developed with the support of CAPES Proc. number 99999.002789/2014-00 and the Center for Nonlinear Studies, Los Alamos National Laboratory. AP acknowledges support from National Institutes Health grants R01-AI078881, R01-AI116868, R01-AI028433, and R01-OD011095. ML and RdS acknowledge support from UFJF, FAPEMIG, CNPq, and CAPES.
Conflict of Interest Statement
The authors declare that the research was conducted in the absence of any commercial or financial relationships that could be construed as a potential conflict of interest.
References
Adiwijaya, B. S., Hare, B., Caron, P. R., Randle, J. C., Neumann, A. U., Reesink, H. W., et al. (2009). Rapid decrease of wild-type hepatitis C virus on telaprevir treatment. Antivir. Ther. 14, 591–595. Available online at: https://www.intmedpress.com/journals/avt/abstract.cfm?id=23&pid=88
Afzal, M. S., Alsaleh, K., Farhat, R., Belouzard, S., Danneels, A., Descamps, V., et al. (2015). Regulation of core expression during the hepatitis C virus life cycle. J. Gen. Virol. 96, 311–321. doi: 10.1099/vir.0.070433-0
Appel, N., Schaller, T., Penin, F., and Bartenschlager, R. (2006). From structure to function: new insights into hepatitis C virus RNA replication. J. Biol. Chem. 281, 9833–9836. doi: 10.1074/jbc.R500026200
Beck, A. (2014). Introduction to Nonlinear Optimization: Theory, Algorithms, and Applications with MATLAB, Vol. 19 (Siam). Natick, MA: The MathWorks, Inc.
Benzine, T., Brandt, R., Lovell, W. C., Yamane, D., Neddermann, P., de Francesco, R., et al. (2017). NS5A inhibitors unmask differences in functional replicase complex half-life between different hepatitis C virus strains. PLoS Pathog. 13:e1006343. doi: 10.1371/journal.ppat.1006343
Bessaud, M., Autret, A., Jegouic, S., Balanant, J., Joffret, M., and Delpeyroux, F. (2001). Development of a Taqman RT-PCR assay for the detection and quantification of negatively stranded RNA of human enteroviruses: evidence for false-priming and improvement by tagged RT-PCR. J. Virol Methods 153, 182–189. doi: 10.1016/j.jviromet.2008.07.010
Binder, M., Sulaimanov, N., Clausznitzer, D., Schulze, M., Huber, C. M., Lenz, S. M., et al. (2013). Replication vesicles are load- and choke-points in the hepatitis C virus lifecycle. PLoS Pathog. 9:e1003561. doi: 10.1371/journal.ppat.1003561
Canini, L., and Perelson, A. S. (2014). Viral kinetic modeling: state of the art. J. Pharmacokinet. Pharmacodyn. 41, 431–443. doi: 10.1007/s10928-014-9363-3
Castillo-Chavez, C., and Feng, Z. (1997). To treat or not to treat: the case of tuberculosis. JMB 35, 629–656. doi: 10.1007/s002850050069
Chatel-Chaix, L., and Bartenschlager, R. (2014). Dengue virus- and hepatitis C virus-induced replication and assembly compartments: the enemy inside — caught in the web. J. Virol. 88, 5907–5911. doi: 10.1128/JVI.03404-13
Craggs, J. K., Ball, J. K., Thomson, B. J., Irving, W. L., and Grabowska, A. (2001). Development of a strand-specific RT-PCR based assay to detect the replicative form of hepatitis C virus RNA. J. Virol Methods 94, 111–120. doi: 10.1016/S0166-0934(01)00281-6
Dahari, H., Forns, X., Neumann, A. U., and Perelson, A. S. (2006). The extrahepatic contribution to HCV plasma viremia. J. Hepatol. 45, 459–464. doi: 10.1016/j.jhep.2006.07.004
Dahari, H., Lo, A., Ribeiro, R. M., and Perelson, A. S. (2007a). Modeling hepatitis C virus dynamics: liver regeneration and critical drug efficacy. J. Theor. Biol. 247, 371–381. doi: 10.1016/j.jtbi.2007.03.006
Dahari, H., Major, M., Zhang, X., Mihalik, K., Rice, C. M., Perelson, A. S., et al. (2005). Mathematical modeling of primary hepatitis C infection: non-cytolytic clearance and early blockage of virion production. Gastroenterology 128, 1056–1066. doi: 10.1053/j.gastro.2005.01.049
Dahari, H., Ribeiro, R. M., and Perelson, A. S. (2007b). Triphasic decline in HCV RNA during antiviral therapy. Hepatology 46, 16–21. doi: 10.1002/hep.21657
Dahari, H., Ribeiro, R. M., Rice, C. M., and Perelson, A. S. (2007c). Mathematical modeling of subgenomic hepatitis C viral replication in Huh-7 cells. J. Virol. 81, 750–760. doi: 10.1128/JVI.01304-06
Dahari, H., Shudo, E., Cotler, S. J., Layden, T. J., and Perelson, A. S. (2009). Modelling hepatitis C virus kinetics: the relationship between the infected cell loss rate and the final slope of viral decay. Antiviral Ther. 14, 459–464.
Dixit, N. M., Layden-Almer, J. E., Layden, T. J., and Perelson, A. S. (2004). Modelling how ribavirin improves interferon response rates in hepatitis C virus infection. Nature 432, 922–924. doi: 10.1038/nature03153
Elliot, R. M., Armstrong, V. J., and McLauchlan, J. (2009). “Structural molecular virology,” in Hepatitis C Virus, eds P. Karaylannis, J. Main, and H. Thomas (International Medical Press).
Gastaminza, P., Cheng, G., Wieland, S., Zhong, J., Liao, W., and Chisari, F. V. (2008). Cellular determinants of hepatitis C virus assembly, maturation, degradation, and secretion. J. Virol. 82, 2120–2129. doi: 10.1128/JVI.02053-07
Gilchrist, M. A., Coombs, D., and Perelson, A. S. (2004). Optimizing within-host viral fitness: infected cell lifespan and virion production rate. J. Theor. Biol. 229, 281–288. doi: 10.1016/j.jtbi.2004.04.015
Guedj, J., Dahari, H., Rong, L., Sansone, N. D., Nettles, R. E., Cotler, S. J., et al. (2013). Modeling Shows that the NS5A inhibitor dacatasvir has two modes of action and yields a shorter estimate of the hepatitis C virus half-life. Proc. Natl. Acad. Sci. U.S.A. 110, 3991–3996. doi: 10.1073/pnas.1203110110
Guedj, J., and Neumann, A. (2010). Understanding hepatitis C viral dynamics with direct-acting antiviral agents due to the interplay between intracellular replication and cellular infection dynamics. J. Theor. Biol. 267, 330–340. doi: 10.1016/j.jtbi.2010.08.036
Guedj, J., and Perelson, A. S. (2011). Second-phase hepatitis C virus RNA decline during telaprevir-based therapy increases with drug effectiveness: implications for treatment duration. Viral Hepatitis 53, 1801–1808. doi: 10.1002/hep.24272
Jangra, R. K., Yi, M., and Lemon, S. M. (2010). Regulation of hepatitis C virus translation and infectious virus production by the MicroRNA miR-122. J. Virol. 84, 6615–6625. doi: 10.1128/JVI.00417-10
Keum, S., Park, S., Park, J., Jung, J., Shin, E., and Jang, S. (2012). The specific infectivity of hepatitis C virus changes through its life cycle. Virol 433, 462–470. doi: 10.1016/j.virol.2012.08.046
Layden, T. J., Layden, J. E., Ribeiro, R. M., and Perelson, A. S. (2003). Mathematical modeling of viral kinetics: a tool to understand and optimize therapy. Clin. Liver Dis. 7, 163–178. doi: 10.1016/S1089-3261(02)00063-6
Layden-Almer, J. E., Ribeiro, R. M., Wiley, T., Perelson, A. S., and Layden, T. J. (2003). Viral dynamics and response differences in HCV-infected African American and white patients treated with IFN and ribavirin. Hepatology 37, 1343–1350. doi: 10.1053/jhep.2003.50217
Lee, C. (2013). Daclatasvir: potential role in hepatitis C. Drug Des. Dev. Ther. 7, 1223–1233. doi: 10.2147/DDDT.S40310
Li, J., and Brauer, F. (2008). “Continuous-time age-structured models in population dynamics and epidemiology,” in Math Epidemiol, volume 1945 of Lecture Notes in Mathematics, eds F. Brauer, P. van den Driessche, and J. Wu (Berlin; Heidelberg: Springer), 205–227.
Li, Y., Yamane, D., Masaki, T., and Lemon, S. M. (2015). The yin and yang of hepatitis C: synthesis and decay of hepatitis C virus RNA. Nat. Rev. Microbiol. 13, 554–558. doi: 10.1038/nrmicro3506
Lindenbach, B. D., and Rice, C. M. (2013). The ins and outs of hepatitis C virus entry and assembly. Nat. Rev. Microbiol. 11, 688–700. doi: 10.1038/nrmicro3098
Martcheva, M., and Castillo-Chavez, C. (2003). Diseases with chronic stage in population with varying size? Math. Biosci. 182, 1–25. doi: 10.1016/S0025-5564(02)00184-0
McGivern, D., Masaki, T., Williford, S., Ingravallo, P., Feng, Z., Lahser, F., et al. (2014). Kinetic analyses reveal potent and early blockade of hepatitis C virus assembly by NS5A inhibitors. Gastroenterology 147, 453–462. doi: 10.1053/j.gastro.2014.04.021
Nelson, P. W., Gilchrist, M. A., Coombs, D., Hyman, J. M., and Perelson, A. S. (2004). An age-structured model of HIV infection that allows for variations in the death rate of productively infected cells. Math. Biosci. 1, 267–288. doi: 10.3934/mbe.2004.1.267
Neumann, A. U., Lam, N., Dahari, H., Gretch, D., and Wiley, T. E. (1998). Hepatitis C viral dynamics in vivo and the antiviral efficacy of interferon-alpha therapy. Science 282, 103–107. doi: 10.1126/science.282.5386.103
Powers, K. A., Dixit, N. M., Ribeiro, R. M., Golia, P., Talal, A. H., and Perelson, A. S. (2003). Modeling viral and drug kinetics: hepatitis C virus treatment with pegylated interferon alpha-2b. Semin. Liver Dis. 23(Suppl. 1), 13–18. doi: 10.1055/s-2003-41630
Quinkert, D., Bartenschlager, R., and Lohmann, V. (2005). Quantitative analysis of the hepatitis C virus replication complex. J. Virol. 79, 13594–13605. doi: 10.1128/JVI.79.21.13594-13605.2005
Quintela, B. M., Conway, J. M., Hyman, J. M., Reis, R. F., dos Santos, R. W., Lobosco, M., et al. (2017). “An age-based multiscale mathematical model of the hepatitis C virus life-cycle during infection and therapy: including translation and replication,” in VII Latin American Congress on Biomedical Engineering CLAIB 2016, IFMBE Proceedings, Vol. 60, eds I. Torres, J. Bustamante, and D. Sierra (Bucaramanga: Santander), 508–511.
Reluga, T., Dahari, H., and Perelson, A. S. (2009). Analysis of hepatitis C virus infection models with hepatocyte homeostasis. SIAM J. Appl. Math 69, 999–1023. doi: 10.1137/080714579
Ribeiro, R. M., Layden-Almer, J., Powers, K. A., Layden, T. J., and Perelson, A. S. (2003). Dynamics of alanine aminotransferase during hepatitis C virus treatment. Hepatology 38, 509–517. doi: 10.1053/jhep.2003.50344
Rohatgi, A. (2016). WebPlotDigitizer: Web Based Tool to Extract Data from Plots, Images, and Maps. Version 4.0. Available online at: https://automeris.io/WebPlotDigitizer
Rong, L., Guedj, J., Dahari, H., Coffield, D. J., Levi, M., Smith, P., et al. (2013). Analysis of hepatitis C virus decline during treatment with the protease inhibitor danoprevir using a multiscale model. PLoS Comput. Biol. 9:e1002959. doi: 10.1371/journal.pcbi.1002959
Rong, L., and Perelson, A. S. (2013). Mathematical analysis of multiscale models for hepatitis C virus dynamics under therapy with direct-acting antiviral agents. Math. Biosci. 245, 22–30. doi: 10.1016/j.mbs.2013.04.012
Sadiku, M. N. O., and Obiozor, C. N. (2000). A simple introduction to the method of lines. Intl. J. Elect. Eng. Educ. 37, 282–296. doi: 10.7227/IJEEE.37.3.8
Scheel, T. K. H., and Rice, C. M. (2013). Understanding the hepatitis C virus life cycle paves the way for highly effective therapies. Nat. Med. 19, 837–849. doi: 10.1038/nm.3248
Scheller, N., Mina, L., Galão, R., Chari, A., Giménez-Barcons, M., Noueiry, A., et al. (2009). Translation and replication of hepatitis C virus genomic RNA depends on ancient cellular proteins that control mRNA fates. Proc. Natl. Acad. Sci. U.S.A. 106, 13517–13522. doi: 10.1073/pnas.0906413106
Shakeri, F., and Dehghan, M. (2008). The method of lines for solution of the one-dimensional wave equation subject to an integral conservation condition. Comput. Math. Appl. 56, 2175–2188. doi: 10.1016/j.camwa.2008.03.055
Shi, S. T., and Lai, M. M. C. (2006). “HCV 5' and 3'UTR: when translation meets replication,” in Hepatitis C Viruses: Genomes and Molecular Biology, ed S. L. Tan (Norfolk: Horizon Bioscience). Available online at: http://www.ncbi.nlm.nih.gov/books/NBK1624/
Shudo, E., Ribeiro, R. M., and Perelson, A. S. (2008a). Modeling the kinetics of hepatitis C RNA decline over four weeks of treatment with pegylated interferon alpha-2b. J. Viral Hepat. 15, 379–382. doi: 10.1111/j.1365-2893.2008.00977.x
Shudo, E., Ribeiro, R. M., Talal, A. H., and Perelson, A. S. (2008b). A hepatitis C viral kinetic model that allows for time-varying drug effectiveness. Antiviral. Ther. 13, 919–926. Available online at: https://www.intmedpress.com/journals/avt/abstract.cfm?id=107&pid=88
Thieme, H., and Castillo-Chavez, C. (1993). How may infection-age-dependent infectivity affect the dynamics of HIV/AIDS? SIAM J. Appl. Math. 53, 1337–1379. doi: 10.1137/0153068
Thieme, H., and Castillo-Chavez, C. (2002). A two-strain tuberculosis model with age infection. SIAM J. Appl. Math. 62, 1634–1656. doi: 10.1137/S003613990038205X
WHO (2016). Guidelines for the Screening, Care and Treatment of Persons With Chronic Hepatitis C Infection. Geneva: WHO. (Accessed July 8, 2016).
Keywords: computational biology, HCV, RNA, DAAs, differential equations
Citation: Quintela BM, Conway JM, Hyman JM, Guedj J, dos Santos RW, Lobosco M and Perelson AS (2018) A New Age-Structured Multiscale Model of the Hepatitis C Virus Life-Cycle During Infection and Therapy With Direct-Acting Antiviral Agents. Front. Microbiol. 9:601. doi: 10.3389/fmicb.2018.00601
Received: 08 January 2018; Accepted: 15 March 2018;
Published: 04 April 2018.
Edited by:
Esteban A. Hernandez-Vargas, Frankfurt Institute for Advanced Studies, GermanyReviewed by:
Hana Dobrovolny, Texas Christian University, United StatesPeter Sehoon Kim, University of Utah, United States
Copyright © 2018 Quintela, Conway, Hyman, Guedj, dos Santos, Lobosco and Perelson. This is an open-access article distributed under the terms of the Creative Commons Attribution License (CC BY). The use, distribution or reproduction in other forums is permitted, provided the original author(s) and the copyright owner are credited and that the original publication in this journal is cited, in accordance with accepted academic practice. No use, distribution or reproduction is permitted which does not comply with these terms.
*Correspondence: Alan S. Perelson, YXNwQGxhbmwuZ292
 Barbara de M. Quintela
 Jessica M. Conway2
 James M. Hyman
 Jeremie Guedj
 Rodrigo W. dos Santos
 Marcelo Lobosco
 Alan S. Perelson