- Division of Plant Microbe Interaction, CSIR-National Botanical Research Institute, Lucknow, India
The occurrence of Microsatellites (SSRs) has been witnessed in most of the fungal genomes however its abundance varies across species. In the present study, we analyzed the frequency of SSRs in the whole genome and transcripts of two phyto-pathogenic (Aspergillus niger and Aspergillus terreus) and compared them with two non-pathogenic (Aspergillus nidulans and Aspergillus oryzae) Aspergillus. Higher relative abundance and relative density of SSRs were observed in the whole genome and transcript sequences of the pathogenic Aspergillus when compared to the non-pathogenic. The relative abundance and density of SSRs were positively correlated with the G+C content of transcripts. Among the different classes of SSR, the percentage of tetra-nucleotide SSRs were maximum in A. niger (36.7%) and A. oryzae (35.9%) whereas A. nidulans and A. terreus preferred tri-nucleotide SSRs (38.2 and 42.1%) in whole genome sequences. In transcripts, tri-nucleotide SSRs were the most abundant whereas di-nucleotide SSRs were the least favored. Motif conservation study among the transcripts revealed conservation of only 27% motif within Aspergillus species. Furthermore, a similar relationship among the Ascomycetes was obtained on the basis of motif conservation and conserved genes (rDNA). To analyze the diversity present within the Indian isolates of Aspergillus, primers were successfully designed for 692 motifs in A. niger and A. terreus of which 20 were selected for diversity analysis. Among all the markers amplified, 10 markers (83.3%) were polymorphic, whereas remaining two markers (16.6%) were monomorphic. Ten polymorphic markers acquired in this investigation showed the utility of recently created SSR markers in the assessment of genetic diversity among various isolates of Aspergillus.
Introduction
Species of the filamentous fungal genus Aspergillus displays a wide variation and are of high significance to people (Gibbons and Rokas, 2013). Among many species, Aspergillus niger is a soil saprobe and widely used in fermentation industry for the production of enzymes and organic acids (Pel et al., 2007). It is also responsible for the degradation of various organic substances including fruits, vegetables, beans, and cereals (Baker, 2006). In India, A. niger has been reported for causing necrotic leaf spot disease in Zingiber officinale (Pawar et al., 2008). Aspergillus terreus has been widely known for the production of Lovastatin, a polyketide derivative used for lowering cholesterol. This fungus is having a reputation for being the third most common reason of invasive aspergillosis in humans. Mycotoxins produced by it causes food spoilage in several cereals and nuts grown in tropical and subtropical climates (Kuck et al., 2014). A recent report suggests its involvement in causing foliar blight of potato in India (Louis et al., 2013).
The genome of this genus is widely studied, curated, and annotated under the Aspergillus Genome Database (AspGD) where the whole genome sequences of several members of this genus are publically available (Arnaud et al., 2012). With the availability of the genome sequences from various species along with the development of many bioinformatics tools, it is now possible for the researchers to use the sequence information for various purposes. These tools provide an ease for developing high throughput in-silico methods for the better understanding and characterization of the Aspergillus population and developing markers for their identification.
Though the molecular marker technologies such as random amplified polymorphic DNA (RAPD), restriction fragment length polymorphism (RFLP), amplified fragment length polymorphism (AFLP), and inter simple sequence repeats (ISSR) were utilized in Aspergillus yet they tend to exhibit reproducibility issues and were insufficient in evaluating intra species variation (Semighini et al., 2001; Baddley et al., 2003; Schmidt et al., 2004; Kermani et al., 2016).
Microsatellites or Simple Sequence Repeats (SSRs) are the parts of the genome comprising a succession of repeats of a given series of nucleotides having lengths from one to six bases. A large instability in the number of repeats is witnessed due to the addition or deletion of repeated units prompting variation in the number of motifs (Gur-Arie et al., 2000; Lim et al., 2004; Olango et al., 2015). Microsatellites can be found in the protein-coding (Li et al., 2004; Garnica et al., 2006; Lawson and Zhang, 2006; Mahfooz et al., 2012a) and non-coding regions of the genome (Kim et al., 2008; Araujo et al., 2012). Microsatellite loci show extensive length polymorphism, and hence they are widely used for DNA fingerprinting and diversity studies in bacteria (Mrazek et al., 2007; Guo and Mrazek, 2008), fungi (Kim et al., 2008; Araujo et al., 2012; Mahfooz et al., 2012a,b), plants (Datta et al., 2010; Yu et al., 2017), and human (Subramanian et al., 2003; Shin et al., 2017). The utility of microsatellites as a molecular marker is well-known, however, its presence and absence in a particular species are of great functional and evolutionary significance (Gibbons and Rokas, 2009; Mahfooz et al., 2015, 2016).
In spite of the fact that the genome sequences of Aspergillus species are freely available, SSRs were analyzed only in intergenic sequences (Gibbons and Rokas, 2009), leaving the remaining portion of the genome unexplored. In the present study we wanted to address (1) whether there is any difference between the frequency and distribution among phytopathogenic SSRs (2) the strength of phylogenetic signal at the species level (3) the level of motif conservation among Aspergillus species, and (4) the level of motif conservation among Ascomycota. We observed that the frequency of SSRs was higher in the phyto-pathogenic SSRs as compared to its non-pathogenic neighbor. Primers were designed and validated for their ability to revealed polymorphism in Indian isolates of Aspergillus isolated from different hosts.
Materials and Methods
SSR Mining
The entire genome sequence of A. niger, A. terreus, A. nidulans, and A. oryzae were downloaded from the Aspergillus Genome Database (AspGD; http://www.aspgd.org; Arnaud et al., 2012). The scanning of microsatellites was performed using online tool WebSat (Martins et al., 2009). Repeats more than 12 bp were considered as SSRs, which means that only more than six occurrences of a di-nucleotide repeats, four occurrences of a tri-nucleotide repeats, three occurrence of a tetra-, penta-, and hexa-nucleotide repeats will be considered as SSRs. All SSRs were analyzed for their frequency of occurrence, density, and relative abundance. Density was calculated by dividing the number of base pairs contributed by each SSR by total length analyzed (Mb). Relative abundance was calculated as the number of SSRs per Mb of a sequence. While scanning di- to hexa-nucleotide SSRs, combinations involving runs of the same nucleotide were considered. In the current analysis, each SSR was considered as unique.
For a superior comparison of the developmental relationship among the Aspergillus species, sharing of repeats was analyzed within the transcribed sequences. As previously reported (Mahfooz et al., 2015), motif sharing within the transcripts of Aspergillus species was investigated manually in Microsoft Excel workbook, 2007. Every motif obtained in the transcripts of each species was placed in Microsoft Excel sheet and searched for its counterpart in the transcripts of remaining species. If motif was available in all the four transcripts, it was deemed as common. Thus, the motifs shared between two and three transcript sequences were also analyzed. The motif which did not have any match was considered as novel. PRIMER 3 online software program (frodo.wi.mit.edu/) was used to design primers complementary to the flanking regions of microsatellites. We expected the primers to be 18–24 bp in length, with annealing temperature in the range of 54–62°C, and product lengths between 150 and 400 bp. A total of 2,169 primers were designed from the four Aspergillus species (Supplementary Table 1). Online software GC content calculator (http://www.sciencebuddies.org/science-fair-ojects/project_ideas/Genom_GC_Calcu-lator.shtml) was used to calculate the G+C content of the genomes and transcripts. Pearson correlation coefficient was calculated using SPSS package (SPSS V16.0, SPSS Inc., Chicago, IL, USA).
Fungal Isolates
A total of 23 different Aspergillus isolates representing 11 each from A. niger and A. terreus along with one from A. nidulans was obtained from Department of Plant Pathology, Indian Agricultural Research Institute, Pusa, New Delhi, India (Supplementary Table 2). These isolates represent the diverse agro-climatic zones of India.
DNA Isolation and SSR Amplification
Total genomic DNA from 23 Aspergillus isolates was extracted using HiPurA™ Fungal DNA Purification Kit (HIMEDIA, India). The PCR was performed in 10.0 μl reaction volume containing PCR buffer (10 mM Tris-HCl pH 9.0, 1.5 mM MgCl2, 50 mM KCl, 0.01% gelatine), 200 μM each of dNTP (Merck), 0.2 U of Taq DNA polymerase (Merck), 10 pM each of forward and reverse primers, and 10 ng of genomic DNA was used as template in each PCR reaction. PCR program was as follows: after initial denaturation at 95°C for 3 min, five touch-down PCR cycles comprising of 94°C for 20 s, 60/55°C for 20 s, and 72°C for 30 s were performed. These cycles were subsequently followed by 40 cycles of denaturation at 94°C for 20 s with a constant annealing temperature of 54–60°C (depending on primer) for 20 s, and extension at 72°C for 20 s, and a final extension at 72°C for 20 min. All PCR amplicons were resolved by electrophoresis on 2% agarose gel to identify the informative SSR loci across all the isolates.
Statistical Analysis
The amplification information produced by SSR primers was examined using SIMQUAL (Nei and Li, 1979) to create a Jaccard's similarity coefficient utilizing NTSYS-PC, programming version 2.1. These similarity coefficients were utilized to develop a dendrogram delineating hereditary relationship among the Aspergillus isolates by utilizing the Unweighted Paired Group Method of Arithmetic Averages (UPGMA). The allelic differences or polymorphism information content (PIC) was measured as described by Botstein et al. (1980). PIC is characterized as the likelihood that two randomly picked duplicates of a gene will represent different alleles within a population. The PIC value was calculated with the equation as follows:
where Pi represents the frequency of the jth pattern for marker i, and summation extends over n patterns. A phylogenetic tree of the 18S rRNA gene was also constructed using Clustal W programme in the MEGA 5.2 software (Treangen and Messeguer, 2006) using the neighbor-joining algorithm with bootstrap analysis for 1,000 replicates.
Results
Relative Abundance and Density of SSRs in the Genomic Sequences of Aspergillus spp.
The maximum frequency of SSRs in whole genome sequences was identified in the genome of A. niger (8,896) which was much higher when compared with A. oryzae (5,226), A. terreus (4,823), and A. nidulans (2,919). The data suggested that A. oryzae which had the largest genome size contains the second highest frequency of SSRs whereas A. niger which had the second largest genome harbors maximum SSRs. Genome size may impact the frequency of SSRs, hence we have estimated the SSRs by taking 1 Mb length of each set of sequences analyzed as a reference. In this way, total relative abundance and total relative density were calculated. While maintaining the position of A. niger (256.4 and 1059.6) with the maximum frequency of SSRs, this promoted A. terreus (161.3 and 636.8) to the second place ahead of A. oryzae (140.8625 and 568.4367; Table 1). We further analyzed the percentage of different classes of repeats in their respective genomes. In A. nidulans and A. terreus, tri-nucleotide repeats constituted the maximum percentage of SSRs (38.25 and 42.15%) followed by tetra-nucleotide repeats (32.0 and 30.7%) while di-nucleotide repeats were the least (6.3 and 8.1%; Table 2). In A. niger and A. oryzae, tetra-nucleotide repeats (36.7 and 35.9%) were the most abundant repeats which were closely followed by tri-nucleotide repeats (35.7 and 30.1%), hexa-nucleotide repeats constituted the minimum number of repeats (7.5 and 10.0%). While comparing the most abundant motif, we observed that tri-nucleotide motif aag/ctt was the most favored motif in the genome of A. nidulans. Similarly, A. terreus genome showed preference for another tri-nucleotide repeat cgc/gcg (2.52%). Di-nucleotide repeat motif ga/tc (2.92%) was the most abundant motif in A. niger genome whereas A. oryzae preferred tetra-nucleotide repeat motif gaaa/tttc (2.64%; Table 3).
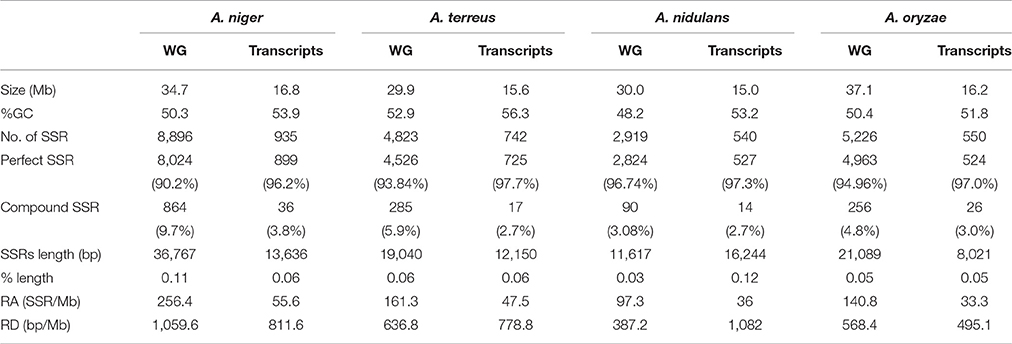
Table 1. Occurrence, relative abundance, and relative density of SSRs in the whole genome and transcript sequences of pathogenic and non-pathogenic Aspergillus species.
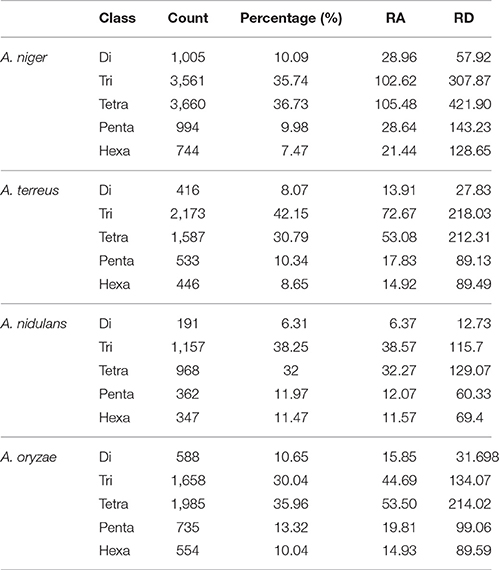
Table 2. Percentage, relative abundance, and relative density of SSRs in whole genome sequence sets of different species of Aspergillus.
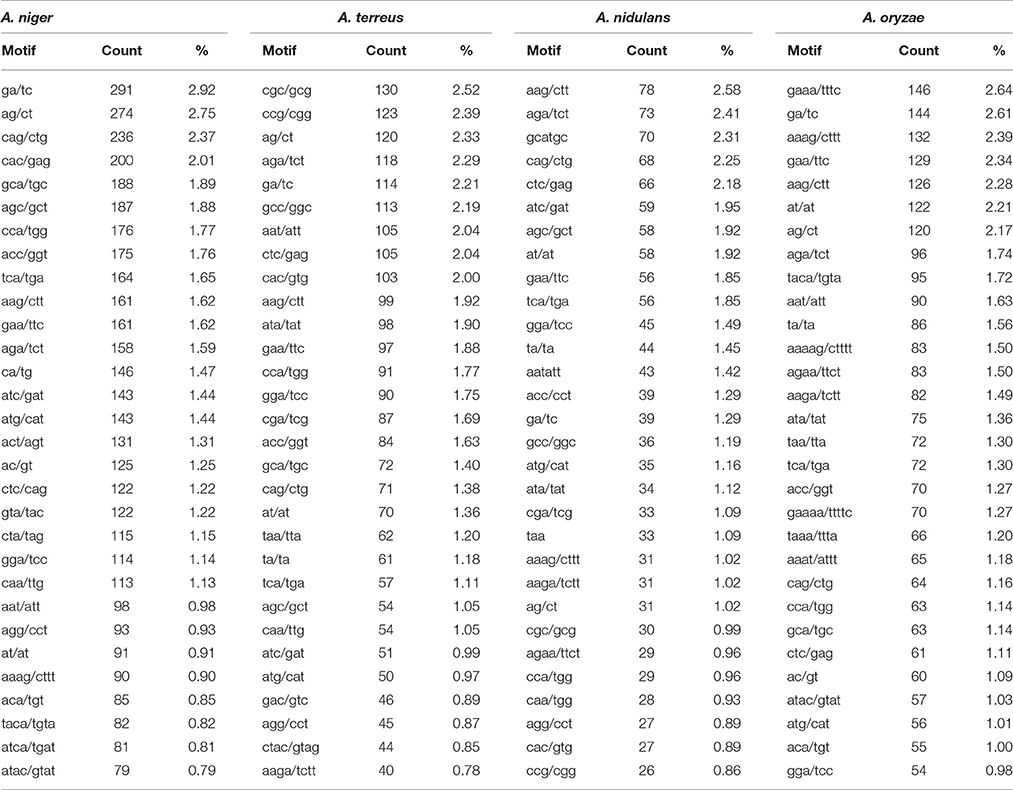
Table 3. Most common repeat motif identified from perfect and compound microsatellite in the whole genome sequence of four Aspergillus species.
Relative Abundance and Density of SSRs in the Transcripts of Aspergillus spp.
In genic sequences, the maximum frequency of SSRs was observed in A. niger (935) transcripts which were followed by A. terreus (742) and A. oryzae (550). The relative abundance and relative density of SSRs also follow the same pattern as highest relative abundance and relative density of SSRs was observed in A. niger (55.6 and 811.0) while it was found lowest in A. oryzae (33.3 and 495.1; Table 1). While comparing the different classes of SSRs, we observed that the percentage of tri-nucleotide motifs were undoubtedly highest in all the transcripts. Hexa-nucleotide repeats were the second highest motifs in A. nidulans whereas in A. niger, A. oryzae, and A. terreus it was tetra-nucleotide repeats. Di-nucleotide motifs were the least abundant motifs in the transcripts (Supplementary Table 3). Overall, the frequency of SSR in the transcripts is much lower when compared to other Ascomycetes (Mahfooz et al., 2015, 2016). Analysis of most common repeats reveals preference of specific trinucleotide motifs in the transcripts of Aspergillus species. Motif aag/ctt was the most preferred motif in A. nidulans and A. oryzae however its percentage was significantly higher in A. oryae (6.60%) as compared to A. nidulans (5.22%). In remaining species, A. niger preferred cag/ctg motifs (5.30%) whereas A. terreus preferred ccg/cgg motifs (6.32%; Supplementary Table 4).
Conservation of Motifs among Aspergillus spp.
To analyze the developmental relationship among the Aspergillus species and to recognize unique motifs, every motif was examined for its counterpart in the transcripts of remaining species. The greatest number of motifs shared between all four transcripts was tri-nucleotide repeats (168, 84.8%) which were followed by di-nucleotide repeats (8, 33.3%), and tetra-nucleotide repeats (76, 20.1%; Figure 1A). Interestingly, none of the penta-nucleotide motifs were found to be shared within the transcripts of four species studied. Among the unique motifs, maximum unique motifs were observed as penta-nucleotide repeats in A. nidulans (Supplementary Table 5). While comparing the sharing of all classes of repeats among two species, it was noticed that A. niger-A. nidulans shared maximum percent of motifs (5.9%) whereas the least sharing was observed among A. niger-A. oryzae (1.3%). Among three species, it was the trio A. nidulans–A. oryzae–A. niger which showed the maximum conservation of motifs whereas least was observed within A. oryzae–A. niger–A. terreus. Maximum number of unique motifs was observed in A. nidulans (15.3%) which was followed by A. terreus (8.9%) and A. niger (8.7%), least was observed in A. oryzae (7.4%). A total of 27.8% of motifs were found conserved within all four species (Figure 1B).
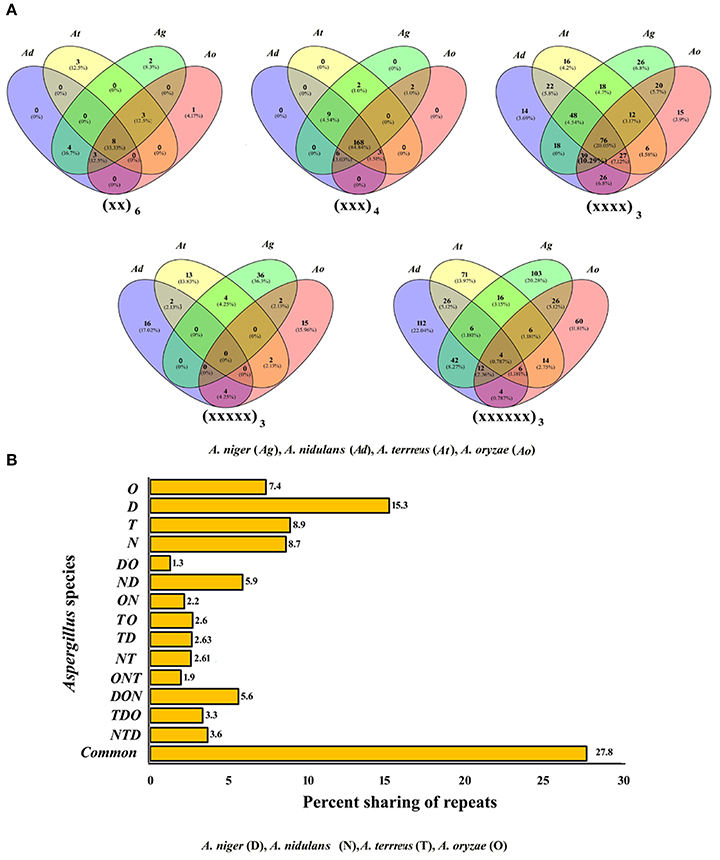
Figure 1. (A) Venn diagram showing sharing of different classes of motifs in the transcripts of Aspergillus species. (B) Graphical representation of sharing of all types of motifs in the transcripts of Aspergillus.
Conservation of motifs was further analyzed at genus level among the members of Ascomycota. We have incorporated the most common motifs of Fusarium and Trichoderma from our previous analysis along with the common motifs identified in this study. As expected, tri-nucleotide repeats were the most common class of repeats shared between the three genera (Figure 2A), this was followed by tetra-nucleotide repeats. Interestingly, di-, penta-, and hexa-nucleotide repeats did not exhibit any conservation among the three genera. Further analysis of motif sharing among all classes revealed 20.3% conservation. Maximum conservation of motifs was witnessed among Trichoderma and Fusarium (18.7%) which was followed by Aspergillus and Trichoderma (7.2%). It is noteworthy that not a single motif was conserved within Aspergillus and Fusarium (Figure 2B). The maximum numbers of unique motifs were identified in Trichoderma while Aspergillus showed the least. In addition to the relationship we obtained through the conservation of motifs, we wanted to compare this relationship with the conserved region (18S) based phylogeny. To our surprise, both the methodologies resulted in an almost similar relationship within the Ascomycetes (Figure 2C).
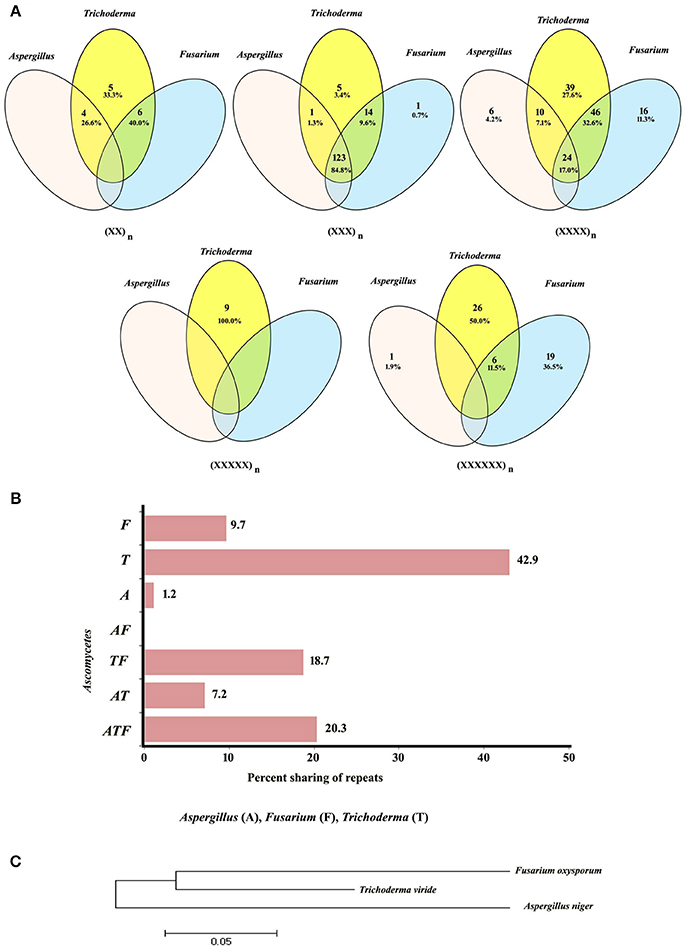
Figure 2. (A) Venn diagram showing sharing of different classes of motifs in the transcripts of Ascomycetes. (B) Graphical representation of sharing of all types of motifs in the transcripts of Ascomycetes. (C) Conserved gene (rRNA) based phylogeny.
Codon Usage
Tri-nucleotide repeats in the transcripts have maximum chances of translation into protein. We analyzed all the trinucleotide repeats in order to get an insight of amino acids encoded by them. In A. nidulans and A. terreus, arginine coding motifs were in maximum whereas, in A. niger, glutamine coding motifs were in abundance. A. oryzae showed a preference for serine coding motifs. On the basis of amino acids encoded by different tri-nucleotide motifs, we intended to deduce a relationship among the four species. For this, we performed principal component analysis, a mathematical algorithm that reduces the dimensionality of the data while retaining most of the variation in the data set. The percentage of variance explained by the first component was 44.8% whereas it was 16.5% for the second (Figure 3). The PCA plot showed close clustering among A. niger, A. nidulans, and A. oryzae. The preference of amino acid is different in A. terreus as it clustered separately in the PCA plot.
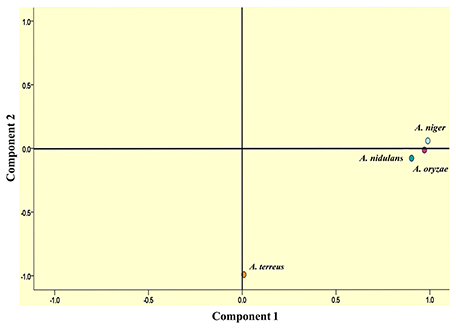
Figure 3. Distant clustering of A. terreus in PCA plot on the basis of amino acids encoded by tri-nucleotide SSRs in the transcript sequences.
Diversity Assessment among Different Isolates of Aspergillus
Out of 21, an aggregate of 12 SSR markers (six each from A. niger and A. terreus) amplified easily scorable amplicons running from 70 to 400 bp in all the isolates. Ten tri-nucleotide repeats and two di-nucleotide repeats were successfully amplified. Percentage polymorphism, number of alleles per locus and PIC value was utilized to demonstrate SSR polymorphism level. Among all the amplified markers, 10 markers (83.3%) were polymorphic, while rest two markers (16.6%) were monomorphic. A total of 22 alleles were amplified by 12 markers. We identified 1–4 alleles for every microsatellite locus with an average of 1.83 alleles for each marker. A. niger primers amplified 12 alleles with 2.0 alleles for every locus, while A. terreus primers amplified 10.0 alleles with 1.6 alleles for every locus. The highest number of alleles (4) were amplified by primer At539, while least of one allele was amplified with five markers viz. An868, At193, At257, At648, At660 (Table 4).

Table 4. Detail of locus, primer sequence, Tm, Motif, percentage polymorphism, No. of alleles, and PIC value of different primers used to evaluate genetic diversity within Aspergillus isolates.
The coefficient values between isolates extended from 0.28 to 1.0 with a mean of 0.62 for each of the 276 isolates combination utilized as a part of the present investigation. For microsatellite markers obtained from A. niger, the similarity coefficient value between isolates ranges from 0.54 to 1.00 with an average genetic diversity of 33.1%. Similarly, with A. terreus SSR markers, the similarity coefficients between isolates ranges from 0.69 to 1.00 with 34.5% genetic diversity (Table 5).
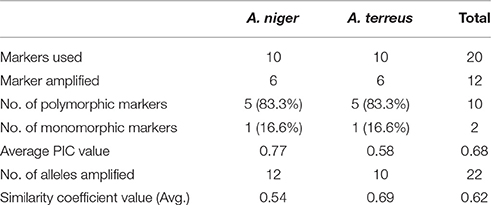
Table 5. A comparison between A. niger and A. terreus markers in order to estimate the level of polymorphism revealed by them.
The most elevated similarity coefficient (1.0) was seen between A. terreus isolates At2167-At2457, At6369-At6514, At6544-At6369, and At6514-At6544 whereas the most diverse (similarity coefficient value 0.29) isolates were An423 and At5564. The dendrogram constructed based on similarity index resulted in two main clusters A and B. Most of the isolates from A. niger, A. nidulans, and A. terreus grouped together in cluster A whereas cluster B contained only A. niger isolates. Cluster A was further subdivided into subgroups 1A and 2A. 1A comprised exclusively of A. niger isolates, whereas 2A contained a majority of A. terreus isolates (Figures 4A,B).
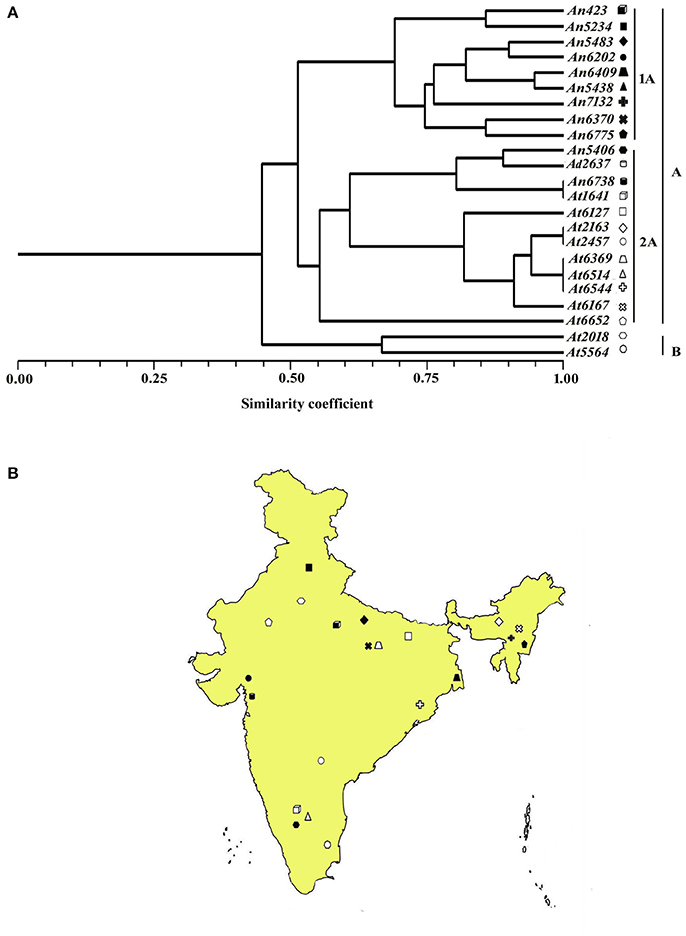
Figure 4. (A) Dendrogram showing genetic relationship among the Aspergillus isolates based on 12 microsatellite markers. Scale indicates Jaccard's coefficient of similarity. A and B indicates main clusters. 1A, 2A, indicate sub-clusters within main cluster A. (B) Map of India showing the geographical location of different isolates used for diversity analysis in this study.
Discussion
The members of genus Aspergillus is having the reputation of being the most diverse. It has been reported that the most closely related species are as divergent as human and mice (Machida et al., 2005; Fedorova et al., 2008). This divergence is evident in the large variation among the frequency of microsatellite obtained in our study as well. The occurrence of significantly higher frequency of SSR in A. niger was surprising. In earlier studies, it has been reported that the frequency of SSRs is positively correlated with the G+C content of the genome (Tian et al., 2011; Mahfooz et al., 2016) however this is not true for Aspergillus where no such correlation was observed. This uneven frequency of SSR distribution was also observed among the species of Drosophylla as well (Ross et al., 2003). The most probable reason for the higher SSR frequency in A. niger is the presence of a large number of tetra- and di-nucleotide repeats in the whole genome, however, this also fall short in explaining the higher frequency of SSRs in A. niger. We further analyzed the frequency of SSR in the transcripts of Aspergillus species where the frequency of SSRs was found to be positively correlated with the G+C content of transcripts. Although, we obtained a weak correlation value (r2 = 0.247), this might explain the difference in frequency of SSRs among the transcripts. We further noticed a significantly lower frequency of SSRs in the transcripts of A. oryzae as compared to other species. This was interesting as A. oryzae has been reported to display two-fold higher rate of insertion which is in parallel with its largest genome size (Machida et al., 2005). The most potential explanation of lower frequency of SSRs in the A. oryzae transcript is the acquisition of lineage-specific sequences, since we are estimating the frequency of SSR per Mb of transcripts, the presence of extra sequences might have diluted the frequency of SSRs. It is evident from the results that pathogenic species of Aspergillus contained more repeats as compared to the non-pathogenic one in both whole genomes as well as in the transcripts. It has been reported that in pathogens, SSRs can improve antigenic fluctuation of the pathogen population in a procedure that balances the host immune response (Mrazek et al., 2007).
Tri-nucleotide SSRs were unanimously the most abundant class of SSRs in the transcripts of Aspergillus species. The higher abundance of tri-nucleotide SSRs in the transcripts is expected as any expansion or contraction within these repeats did not disturb the reading frame, hence these repeats are well-tolerated in the coding region (Katti et al., 2001; Garnica et al., 2006). The higher occurrence of aag/ctt repeats in A. nidulans and A. oryzae was expected as it has been reported that due to positive selection, aag repeats are predominant in 5′ flanks close to those genes whose products are preferentially involved in transcription (Zhang et al., 2004). Our previous analysis in Fusarium also reveals the predominance of these repeats among its three species (Mahfooz et al., 2015). Since cag codes for glutamine, its abundance in the transcripts of A. niger might be attributed to its reputation of being a polar zipper protein-protein interaction domain (Michelitsch and Weissman, 2000).
We further analyzed the conservation of motifs among Aspergillus species, which resulted in a low conservation (27.8%) was obtained when compared to other Ascomycetes (Mahfooz et al., 2015, 2016), this again reflected its diverse genome architecture (Rokas et al., 2007; Fedorova et al., 2008). Among the three species, maximum conservation was obtained in the trio A. niger–A. nidulans–A. oryzae (5.3%) which may be explained on the basis of sequence conservation within 5,000 non-coding regions with the abundance of repeats actively conserved within these species (Galagan et al., 2005). It has been reported that of 8,695 genes in A. niger, 78% showed conservation of neighboring orthologs in at least one species (Pel et al., 2007). This might be the reason why A. niger and A. nidulans showed maximum motif sharing among themselves. Our previous analysis of motifs conservation in Fusarium and Trichoderma prompted us to analyze it at the genus level. The three genus shared only 20.3% common motifs despite the fact that 80% of genes in Aspergillus have homologs in other lineages of fungi (de Vries et al., 2017). Higher conservation of motifs among Fusarium and Trichoderma (18.7%) was anticipated as Trichoderma and Fusarium belongs to Sordariomycetes whereas Aspergillus falls under Eurotiomyceties (Grigoriev et al., 2014). The least number of unique motifs obtained in Aspergillus suggests a low level of genetic heterogeneity in Aspergillus as compared to other Ascomycetes. It was thought provoking to witness similar relationship on the basis of hyper-variable and conserved regions. The possible explanation for this might be attributed to the fact that within the genes, apart from long stretches of nucleotides, short stretches are also conserved with a possibility of change in a number of repeats.
Due to positive selection, changes in amino acids has been witnessed in domesticated fungi probably because of the strong selection pressure exerted by humans. The genetic code itself can also provide unexpected adaptive amino acid changes. In Candida albicans, incorporated serine residues were witnessed at sites where leucine was previously placed and this replacement was well-tolerated in the genome (Miranda et al., 2013). This might be one of the reasons why A. terreus distantly clustered in the PCA plot. Apart from this, higher abundance of arginine, alanine, and proline coding repeats might also be responsible for the distant clustering of A. terreus in PCA plot. The acquisition of additional repeats in proteins of A. terreus may help to fine tune its function and/or modify some of its properties (Mularoni et al., 2010).
The primers designed in the present study were further validated for its ability to detect polymorphism. Till date, only six polymorphic microsatellites were developed for A. niger (Esteban et al., 2005) which were insufficient for estimating genetic diversity. Earlier RAPD markers were widely used for genetic characterization of Aspergillus isolates. Diversity and phylogenetic relationship of 12 Aspergillus species isolated from Tehran were studied using 11 RAPD markers (Kermani et al., 2016). The authors obtained similarity coefficient ranged from 0.02 to 0.40 indicating a wide diversity within Aspergillus isolates. Higher genetic diversity was also obtained in A. terreus isolates collected from Houston, Texas, and Innsbruck using RAPD markers (Lass-Florl et al., 2007). A higher range of similarity coefficient obtained in our study with SSR markers might be attributed to the fact that in our analysis only three species were analyzed. The newly develop markers in A. niger and A. terreus along with previously published marker in A. niger revealed that for the distinction of a broad range of A. niger and A. terreus strains and to analyze intraspecies variation among them, these markers are sufficient. The available markers can address issues such as pathogenicity, ecology, and species differentiation within the genus Aspergillus. In addition to this, the unique motifs obtained in this study may be utilized for the development of species-specific markers.
Author Contributions
Conceived and designed the experiments: SM, AM. Performed the experiments: SM, SS, NM. Analyzed the data: SM. Wrote the manuscript: SM, AM.
Conflict of Interest Statement
The authors declare that the research was conducted in the absence of any commercial or financial relationships that could be construed as a potential conflict of interest.
Acknowledgments
This work was supported by the financial assistance from Science and Engineering Board of Department of Science and Technology, Government of India (GAP-3349).
Supplementary Material
The Supplementary Material for this article can be found online at: http://journal.frontiersin.org/article/10.3389/fmicb.2017.01774/full#supplementary-material
Supplementary Table 1. Primers to amplify motifs in different Aspergillus species.
Supplementary Table 2. Accession number, name of species source of isolation and place of collection of different Aspergillus isolates used in the present study.
Supplementary Table 3. Percentage, relative abundance, and relative density of SSRs in transcripts of different species of Aspergillus.
Supplementary Table 4. Most common repeat motif identified from perfect and compound microsatellite in the transcripts genome sequence of four Aspergillus species.
Supplementary Table 5. A list of unique motifs obtained in the transcript sequences of four Aspergillus species analyzed.
References
Araujo, R., Amorim, A., and Gusmao, L. (2012). Diversity and specificity of microsatellites within Aspergillus section Fumigati. BMC Microbiol. 12:154. doi: 10.1186/1471-2180-12-154
Arnaud, M. B., Cerqueira, G. C., Inglis, D. O., Skrzypek, M. S., et al. (2012). The Aspergillus Genome Database (AspGD): recent developments in comprehensive multispecies curation, comparative genomics and community resources. Nucleic Acids Res. 40, D653–D659. doi: 10.1093/nar/gkr875
Baddley, J. W., Pappas, P. G., Smith, A. C., and Moser, S. A. (2003). Epidemiology of Aspergillus terreus at a university hospital. J. Clin. Microbiol. 41, 5525–5529. doi: 10.1128/JCM.41.12.5525-5529.2003
Baker, S. E. (2006). Aspergillus niger genomics: past, present and into the future. Med. Mycol. 44(Suppl. 1), S17–S21. doi: 10.1080/13693780600921037
Botstein, D., White, R. L., Skolnick, M., and Davis, R. W. (1980). Construction of a genetic linkage map in man using restriction fragment length polymorphisms. Am. J. Hum. Genet. 32, 314–331.
Datta, S., Mahfooz, S., Singh, P., Choudhary, A. K., Singh, F., and Kumar, S. (2010). Cross-genera amplification of informative microsatellite markers from common bean and lentil for the assessment of genetic diversity in pigeonpea. Physiol. Mol. Biol. Plants 16, 123–134. doi: 10.1007/s12298-010-0014-x
de Vries, R. P., Riley, R., Wiebenga, A., Aguilar-Osorio, G., et al. (2017). Comparative genomics reveals high biological diversity and specific adaptations in the industrially and medically important fungal genus Aspergillus. Genome Biol. 18, 28. doi: 10.1186/s13059-017-1151-0
Esteban, A., Leong, S. L. L., and Tran-Dinh, N. (2005). Isolation and characterization of six polymorphic microsatellite loci in Aspergillus niger. Mol. Ecol. Notes 5, 375–377. doi: 10.1111/j.1471-8286.2005.00932.x
Fedorova, N. D., Khaldi, N., Joardar, V. S., Maiti, R., et al. (2008). Genomic islands in the pathogenic filamentous fungus Aspergillus fumigatus. PLoS Genet. 4:e1000046. doi: 10.1371/journal.pgen.1000046
Galagan, J. E., Calvo, S. E., Cuomo, C., Ma, L. J., et al. (2005). Sequencing of Aspergillus nidulans and comparative analysis with A. fumigatus and A. oryzae. Nature 438, 1105–1115. doi: 10.1038/nature04341
Garnica, D. P., Pinzon, A. M., Quesada-Ocampo, L. M., Bernal, A. J., Barreto, E., Grunwald, N. J., et al. (2006). Survey and analysis of microsatellites from transcript sequences in Phytophthora species: frequency, distribution, and potential as markers for the genus. BMC Genomics 7:245. doi: 10.1186/1471-2164-7-245
Gibbons, J. G., and Rokas, A. (2009). Comparative and functional characterization of intragenic tandem repeats in 10 Aspergillus genomes. Mol. Biol. Evol. 26, 591–602. doi: 10.1093/molbev/msn277
Gibbons, J. G., and Rokas, A. (2013). The function and evolution of the Aspergillus genome. Trends Microbiol. 21, 14–22. doi: 10.1016/j.tim.2012.09.005
Grigoriev, I. V., Nikitin, R., Haridas, S., Kuo, A., Ohm, R., Otillar, R., et al. (2014). MycoCosm portal: gearing up for 1000 fungal genomes. Nucleic Acids Res. 42, D699–D704. doi: 10.1093/nar/gkt1183
Guo, X., and Mrazek, J. (2008). Long simple sequence repeats in host-adapted pathogens localize near genes encoding antigens, housekeeping genes, and pseudogenes. J. Mol. Evol. 67, 497–509. doi: 10.1007/s00239-008-9166-5
Gur-Arie, R., Cohen, C. J., Eitan, Y., Shelef, L., Hallerman, E. M., and Kashi, Y. (2000). Simple sequence repeats in Escherichia coli: abundance, distribution, composition, and polymorphism. Genome Res. 10, 62–71. doi: 10.1101/gr.10.1.62
Katti, M. V., Ranjekar, P. K., and Gupta, V. S. (2001). Differential distribution of simple sequence repeats in eukaryotic genome sequences. Mol. Biol. Evol. 18, 1161–1167. doi: 10.1093/oxfordjournals.molbev.a003903
Kermani, F., Shams-Ghahfarokhi, M., Gholami-Shabani, M., and Razzaghi-Abyaneh, M. (2016). Diversity, molecular phylogeny and fingerprint profiles of airborne Aspergillus species using random amplified polymorphic DNA. World J. Microbiol. Biotechnol. 32, 96. doi: 10.1007/s11274-016-2052-1
Kim, T. S., Booth, J. G., Gauch, H. G. Jr., Sun, Q., Park, J., Lee, Y. H., et al. (2008). Simple sequence repeats in Neurospora crassa: distribution, polymorphism and evolutionary inference. BMC Genomics 9:31. doi: 10.1186/1471-2164-9-31
Kuck, U., Bloemendal, S., and Teichert, I. (2014). Putting fungi to work: harvesting a cornucopia of drugs, toxins, and antibiotics. PLoS Pathog. 10:e1003950. doi: 10.1371/journal.ppat.1003950
Lass-Florl, C., Grif, K., and Kontoyiannis, D. P. (2007). Molecular typing of Aspergillus terreus isolates collected in Houston, Texas, and Innsbruck, Austria: evidence of great genetic diversity. J. Clin. Microbiol. 45, 2686–2690. doi: 10.1128/JCM.00917-07
Lawson, M. J., and Zhang, L. (2006). Distinct patterns of SSR distribution in the Arabidopsis thaliana and rice genomes. Genome Biol. 7:R14. doi: 10.1186/gb-2006-7-2-r14
Li, Y. C., Korol, A. B., Fahima, T., and Nevo, E. (2004). Microsatellites within genes: structure, function, and evolution. Mol. Biol. Evol. 21, 991–1007. doi: 10.1093/molbev/msh073
Lim, S., Notley-McRobb, L., Lim, M., and Carter, D. A. (2004). A comparison of the nature and abundance of microsatellites in 14 fungal genomes. Fungal Genet. Biol. 41, 1025–1036. doi: 10.1016/j.fgb.2004.08.004
Louis, B., Roy, P., Sayanika, D. W., and Talukdar, N. C. (2013). Aspergillus terreus thom a new pathogen that causes foliar blight of potato. Plant Pathol. Quarant. 3, 29–33. doi: 10.5943/ppq/3/1/5
Machida, M., Asai, K., Sano, M., Tanaka, T., Kumagai, T., Terai, G., et al. (2005). Genome sequencing and analysis of Aspergillus oryzae. Nature 438, 1157–1161. doi: 10.1038/nature04300
Mahfooz, S., Maurya, D. K., Srivastava, A. K., Kumar, S., and Arora, D. K. (2012a). A comparative in silico analysis on frequency and distribution of microsatellites in coding regions of three formae speciales of Fusarium oxysporum and development of EST-SSR markers for polymorphism studies. FEMS Microbiol. Lett. 328, 54–60. doi: 10.1111/j.1574-6968.2011.02483.x
Mahfooz, S., Singh, P., Maurya, D. K., Yadav, M. C., Tahoor, A., Sahay, H., et al. (2012b). Microsatellite repeat dynamics in mitochondrial genomes of phytopathogenic fungi: frequency and distribution in the genic and intergenic regions. Bioinformation 8, 1171–1175. doi: 10.6026/97320630081171
Mahfooz, S., Singh, S. P., Rakh, R., Bhattacharya, A., Mishra, N., Singh, P. C., et al. (2016). A comprehensive characterization of simple sequence repeats in the sequenced Trichoderma genomes provides valuable resources for marker development. Front. Microbiol. 7:575. doi: 10.3389/fmicb.2016.00575
Mahfooz, S., Srivastava, A., Srivastava, A. K., and Arora, D. K. (2015). A comparative analysis of distribution and conservation of microsatellites in the transcripts of sequenced Fusarium species and development of genic-SSR markers for polymorphism analysis. FEMS Microbiol. Lett. 362. doi: 10.1093/femsle/fnv131
Martins, W. S., Lucas, D. C., Neves, K. F., and Bertioli, D. J. (2009). WebSat–a web software for microsatellite marker development. Bioinformation 3, 282–283. doi: 10.6026/97320630003282
Michelitsch, M. D., and Weissman, J. S. (2000). A census of glutamine/asparagine-rich regions: implications for their conserved function and the prediction of novel prions. Proc. Natl. Acad. Sci. U.S.A 97, 11910–11915. doi: 10.1073/pnas.97.22.11910
Miranda, I., Silva-Dias, A., Rocha, R., Teixeira-Santos, R., et al. (2013). Candida albicans CUG mistranslation is a mechanism to create cell surface variation. MBio 4:e00285–13. doi: 10.1128/mBio.00285-13
Mrazek, J., Guo, X., and Shah, A. (2007). Simple sequence repeats in prokaryotic genomes. Proc. Natl. Acad. Sci. U.S.A 104, 8472–8477. doi: 10.1073/pnas.0702412104
Mularoni, L., Ledda, A., Toll-Riera, M., and Alba, M. M. (2010). Natural selection drives the accumulation of amino acid tandem repeats in human proteins. Genome Res. 20, 745–754. doi: 10.1101/gr.101261.109
Nei, M., and Li, W. H. (1979). Mathematical model for studying genetic variation in terms of restriction endonucleases. Proc. Natl. Acad. Sci. U.S.A. 76, 5269–5273. doi: 10.1073/pnas.76.10.5269
Olango, T. M., Tesfaye, B., Pagnotta, M. A., Pe, M. E., and Catellani, M. (2015). Development of SSR markers and genetic diversity analysis in enset (Ensete ventricosum (Welw.) Cheesman), an orphan food security crop from Southern Ethiopia. BMC Genet. 16:98. doi: 10.1186/s12863-015-0250-8
Pawar, N. V., Patil, V. B., Kamble, S. S., and Dixit, G. B. (2008). First report of Aspergillus niger as a plant pathogen on Zingiber officinale from India. Plant Dis. 92, 1368–1368. doi: 10.1094/PDIS-92-9-1368C
Pel, H. J., de Winde, J. H., Archer, D. B., Dyer, P. S., Hofmann, G., Schaap, P. J., et al. (2007). Genome sequencing and analysis of the versatile cell factory Aspergillus niger CBS 513, 88. Nat. Biotechnol. 25, 221–231. doi: 10.1038/nbt1282
Rokas, A., Payne, G., Fedorova, N. D., Baker, S. E., Machida, M., Yu, J., et al. (2007). What can comparative genomics tell us about species concepts in the genus Aspergillus? Stud. Mycol. 59, 11–17. doi: 10.3114/sim.2007.59.02
Ross, C. L., Dyer, K. A., Erez, T., Miller, S. J., Jaenike, J., and Markow, T. A. (2003). Rapid divergence of microsatellite abundance among species of Drosophila. Mol. Biol. Evol. 20, 1143–1157. doi: 10.1093/molbev/msg137
Schmidt, H., Taniwaki, M. H., Vogel, R. F., and Niessen, L. (2004). Utilization of AFLP markers for PCR-based identification of Aspergillus carbonarius and indication of its presence in green coffee samples. J. Appl. Microbiol. 97, 899–909. doi: 10.1111/j.1365-2672.2004.02405.x
Semighini, C. P., Delmas, G., Park, S., Amstrong, D., Perlin, D., and Goldman, G. H. (2001). New restriction fragment length polymorphism (RFLP) markers for Aspergillus fumigatus. FEMS Immunol. Med. Microbiol. 31, 15–19. doi: 10.1111/j.1574-695X.2001.tb01580.x
Shin, G., Grimes, S. M., Lee, H., Lau, B. T., Xia, L. C., and Ji, H. P. (2017). CRISPR-Cas9-targeted fragmentation and selective sequencing enable massively parallel microsatellite analysis. Nat. Commun. 8:14291. doi: 10.1038/ncomms14291
Subramanian, S., Mishra, R. K., and Singh, L. (2003). Genome-wide analysis of microsatellite repeats in humans: their abundance and density in specific genomic regions. Genome Biol. 4:R13. doi: 10.1186/gb-2003-4-2-r13
Tian, X., Strassmann, J. E., and Queller, D. C. (2011). Genome nucleotide composition shapes variation in simple sequence repeats. Mol. Biol. Evol. 28, 899–909. doi: 10.1093/molbev/msq266
Treangen, T. J., and Messeguer, X. (2006). M-GCAT: interactively and efficiently constructing large-scale multiple genome comparison frameworks in closely related species. BMC Bioinformatics 7:433. doi: 10.1186/1471-2105-7-433
Yu, J., Dossa, K., Wang, L., Zhang, Y., Wei, X., Liao, B., et al. (2017). PMDBase: a database for studying microsatellite DNA and marker development in plants. Nucleic Acids Res. 45, D1046–D1053. doi: 10.1093/nar/gkw906
Keywords: microsatellite, comparative genomics, Aspergillus, polymorphism, motif conservation
Citation: Mahfooz S, Singh SP, Mishra N and Mishra A (2017) A Comparison of Microsatellites in Phytopathogenic Aspergillus Species in Order to Develop Markers for the Assessment of Genetic Diversity among Its Isolates. Front. Microbiol. 8:1774. doi: 10.3389/fmicb.2017.01774
Received: 22 June 2017; Accepted: 31 August 2017;
Published: 20 September 2017.
Edited by:
Hector Mora Montes, Universidad de Guanajuato, MexicoReviewed by:
Aleksandra Barac, University of Belgrade, SerbiaLuis Antonio Pérez-García, Universidad Autónoma de San Luis Potosí, Mexico
Copyright © 2017 Mahfooz, Singh, Mishra and Mishra. This is an open-access article distributed under the terms of the Creative Commons Attribution License (CC BY). The use, distribution or reproduction in other forums is permitted, provided the original author(s) or licensor are credited and that the original publication in this journal is cited, in accordance with accepted academic practice. No use, distribution or reproduction is permitted which does not comply with these terms.
*Correspondence: Aradhana Mishra, bWlzaHJhbXljb0B5YWhvby5jb20=
 Sahil Mahfooz
 Satyendra P. Singh
 Nishtha Mishra
 Aradhana Mishra