
94% of researchers rate our articles as excellent or good
Learn more about the work of our research integrity team to safeguard the quality of each article we publish.
Find out more
ORIGINAL RESEARCH article
Front. Microbiol., 18 December 2015
Sec. Plant Pathogen Interactions
Volume 6 - 2015 | https://doi.org/10.3389/fmicb.2015.01412
This article is part of the Research TopicSmelly Fumes: Volatile-Mediated Communication Between Bacteria and Other OrganismsView all 19 articles
The importance of volatile organic compounds for functioning of microbes is receiving increased research attention. However, to date very little is known on how inter-specific bacterial interactions effect volatiles production as most studies have been focused on volatiles produced by monocultures of well-described bacterial genera. In this study we aimed to understand how inter-specific bacterial interactions affect the composition, production and activity of volatiles. Four phylogenetically different bacterial species namely: Chryseobacterium, Dyella, Janthinobacterium, and Tsukamurella were selected. Earlier results had shown that pairwise combinations of these bacteria induced antimicrobial activity in agar media whereas this was not the case for monocultures. In the current study, we examined if these observations were also reflected by the production of antimicrobial volatiles. Thus, the identity and antimicrobial activity of volatiles produced by the bacteria were determined in monoculture as well in pairwise combinations. Antimicrobial activity of the volatiles was assessed against fungal, oomycetal, and bacterial model organisms. Our results revealed that inter-specific bacterial interactions affected volatiles blend composition. Fungi and oomycetes showed high sensitivity to bacterial volatiles whereas the effect of volatiles on bacteria varied between no effects, growth inhibition to growth promotion depending on the volatile blend composition. In total 35 volatile compounds were detected most of which were sulfur-containing compounds. Two commonly produced sulfur-containing volatile compounds (dimethyl disulfide and dimethyl trisulfide) were tested for their effect on three target bacteria. Here, we display the importance of inter-specific interactions on bacterial volatiles production and their antimicrobial activities.
Soil bacteria produce an astounding array of secondary metabolites. Gaseous secondary metabolites, commonly known as volatile organic compounds (VOCs) are small molecules (<300 Da) belonging to different chemical classes that can evaporate and diffuse easily through air- and water-filled pores (Schulz and Dickschat, 2007; Penuelas et al., 2014). These physiochemical properties make volatiles ideal metabolites for communication and antagonistic interactions between soil microorganisms living at a certain distance from each other. Indeed, recent studies indicate that soil microorganisms can employ volatile compounds as info-chemicals, growth stimulants, growth inhibitors, and inhibitors of quorum-sensing (Kai et al., 2009; Chernin et al., 2011; Effmert et al., 2012; Kim et al., 2013). Furthermore, rhizosphere bacteria emit volatiles that can promote plant growth and elicit induced systemic resistance (ISR) and induced systemic tolerance (IST) in plants (Ryu et al., 2003, 2004). However, the role of volatiles in competitive interactions between soil bacteria is so far poorly understood.
In the past few years the research on volatiles emitted by bacteria received increased attention from a more applied point of view as these compounds have intriguing properties which are of great interest for agriculture (pathogen suppression), food preparation (aroma), and cosmetics industry (perfume odors; Krings and Berger, 1998; Wheatley, 2002; Beshkova et al., 2003; Schwab et al., 2008; Deetae et al., 2009; Effmert et al., 2012; Kanchiswamy et al., 2015).
Bacterial volatiles belong to different chemical classes like alkenes, alcohols, ketones, terpenes, benzenoids, pyrazines, acids, and esters. However, the composition of emitted volatiles (volatile blend composition) may vary with cultivation conditions, in particular with respect to the substrate composition of the growth media (Cleason, 2006; Blom et al., 2011; Groenhagen et al., 2013; Garbeva et al., 2014a). Other factors known to influence volatile production are microbial physiological state, oxygen availability, moisture, temperature and pH (Bjurman, 1999; Insam and Seewald, 2010; Romoli et al., 2014).
The technical developments that have been made in recent years in the field of mass spectrometry have led to the improvement of volatile compounds detection. The details of these developments have recently been summarized by Carter (2014). However, the main challenge in volatolomics is the ability to identify and quantify the entire set of emitted volatiles. The detected volatile blends are mostly quite complex and make the identification of biologically relevant volatiles a demanding and challenging task (Farag et al., 2012; Tait et al., 2014).
To date more than over 1000 microbial volatiles are reported and described in a special database for microbial VOCs called mVOC1 (Lemfack et al., 2014). Nevertheless, this number is rather low compared to the high diversity of bacterial taxa in soil, suggesting a big underestimation of the actual real number of microbial volatiles (Kai et al., 2009; Lemfack et al., 2014). Moreover, most of the studies on microbial volatile detection have dealt with monocultures of already well-described bacterial genera. Thus, very little is known on how inter-specific interactions affect the volatile production. The investigation of volatiles production in more complex communities is of great interest since it could help to reveal the ecological role of these compounds. In the last years several independent studies reported that the production of secondary metabolites by soil bacteria can be influenced by interactions with microorganisms in their vicinity (Garbeva et al., 2011b; Traxler et al., 2013; Tyc et al., 2014). A high-throughput screening performed recently in our lab revealed that interactions between soil bacterial species have major effects in both directions: induction and suppression of antimicrobial activity (Tyc et al., 2014).
In this study we aimed to understand how inter-specific bacterial interactions affect the emission of volatiles and their activity. For this we selected four strains belonging to different bacteria species that have been isolated from the soil bacterial community associated with sand sedge (Carex arenaria L.) namely Chryseobacterium sp. AD48, Dyella sp. AD56, Janthinobacterium sp. AD80, and Tsukamurella sp. AD106 (Tyc et al., 2014). In an earlier screening it was observed that these bacteria showed induced antimicrobial activity during interactions but not in monocultures. In the current study, it was examined if these observations were also reflected by the volatiles emission. To this end the effects of volatiles on growth of fungal, oomycetal, and bacterial model organisms produced by the bacteria in monocultures as well in pairwise combinations were tested. Our overall hypothesis is that the blend composition volatiles produced during interactions differs from that of monocultures and consequently has different effect on model target organisms.
The bacterial isolates applied in this work were selected based on a previous observations of antimicrobial activity triggered by inter-specific interactions (Tyc et al., 2014). Four bacterial isolates were used: Chryseobacterium sp. AD48 (Class: Flavobacteriia) GenBank: KJ685263, Dyella sp. AD56 (Class: Gammaproteobacteria) GenBank: KJ685269, Janthinobacterium sp. AD80 (Class: Betaproteobacteria) GenBank: KJ685292, and Tsukamurella sp. AD106 (Class: Actinobacteria) GenBank: KJ685317. The bacterial isolates were pre-cultured from -80°C glycerol stocks on 1/10th TSBA (5.0 g L-1 NaCl, 1.0 g L-1 KH2PO4; 3 g L-1 oxoid tryptic soy broth (TSBA); 20 g L-1 Merck Agar, pH 6.5; Garbeva and de Boer, 2009) and incubated for 3 days at 24°C before starting the experiments.
To test the effect of bacterial volatile compounds on bacterial growth and colony morphology three indicator bacteria were used: Escherichia coli WA321, Staphylococcus aureus 533R4 (Meyer and Schleifer, 1978; Tyc et al., 2014) and Serratia marcescens P87 (Garbeva et al., 2014b). All three indicator bacteria were pre-cultured from -80°C glycerol stocks either on LBA media (LB-Medium Lennox, Carl Roth GmbH + Co. KG, Netherlands, art.no. X964.2, 20 g L-1 Merck Agar; E. coli WA321 and S. aureus 533R4; Sambrook and Russell, 2001) or on 1/10th TSBA (S. marcescens P87). The indicator organisms E. coli and S. aureus were incubated overnight at 37°C prior application, S. marcescens P87 was incubated at 24°C for 4 days prior usage. All bacterial isolates used in this study are listed in Table 1.
The fungi Rhizoctonia solani AG2.2IIIB and Fusarium culmorum PV and the oomycete Pythium ultimum P17 were used in this study (Garbeva et al., 2014b). The fungi and oomycete were pre-cultured on 1/5th potato dextrose agar (PDA; 29 g L-1 Oxoid CM 139; Fiddaman and Rossall, 1993) and incubated at 24°C for 7 days prior usage. All fungal and oomycetal organisms are listed in Table 1.
Ten different treatments were performed in triplicates. These treatments were: monoculture 1 (Chryseobacterium sp. AD48), monoculture 2 (Tsukamurella sp. AD106), monoculture 3 (Dyella sp. AD56), monoculture 4 (Janthinobacterium sp. AD80) and pairwise interaction of the isolates: interaction 1 (Chryseobacterium sp. AD48 + Tsukamurella AD106), interaction 2 (Dyella sp. AD56 + Janthinobacterium sp. AD80), Control 1 (glass Petri dish with TSBA media without inoculated bacteria, as background control in GC/MS measurement), Control 2 (two compartment Petri dish inoculated with model organisms without exposure to bacterial volatiles), Control 3 (top bottom Petri dish inoculated with fungal/oomycetal model organisms without exposure to bacterial volatile compounds). Control 4 (two compartment Petri dish inoculated with model organisms without exposure to the tested pure volatile compounds). The effect of the produced volatiles was tested on fungal, oomycetal, and bacterial growth via determination of hyphal biomass or growth inhibition assays. For the inoculation of the experiments a single colony of each test isolate was picked from a plate and inoculated in 20 mL 1/10th TSB (5.0 g L-1 NaCl, 1.0 g L-1 KH2PO4; 3 g L-1 TSBA) and incubated overnight at 24°C, 220 rpm. On the next day the OD600 of each isolate was measured on a GENESYSTM 20 spectrophotometer (Thermoscientific, Netherlands, Cat# 4001-000) and a inoculation suspension for each treatment was prepared in 20 mL of 10 mM P-Buffer (pH 6.5) containing bacterial cells in a concentration of ∼1 × 10∧5 CFU/mL.
Next to the inhibition experiments, bacterial volatiles emitted in monocultures and pairwise combinations were trapped and analyzed. For trapping of VOCs emitted by bacteria a volume of 100 μl of inoculation suspension was spread on 1/10th TSBA (20 mL) in glass Petri dishes designed for headspace volatile trapping (Garbeva et al., 2014b). The Petri dishes were closed by a lid with an outlet connected to a steel trap containing 150 mg Tenax TA and 150 mg Carbopack B (Markes International, Ltd., Llantrisant, UK; Supplementary Figure S1). All treatments were inoculated in triplicate. The volatiles were collected after 48 and 72 h of incubation and the Tenax steel traps were stored at 4°C until GC-Q-TOF analysis.
The trapped VOCs were desorbed from the traps using an automated thermodesorption unit (Unity TD-100, Markes International, Ltd., Llantrisant, UK) at 210°C for 12 min (He flow 50 mL/min) and trapped on a cold trap at -10°C. The trapped volatiles were introduced into the GC-QTOF (model Agilent 7890B GC and the Agilent 7200A QTOF, Santa Clara, CA, USA) by heating the cold trap for 3 min to 280°C. Split ratio was set to 1:10, and the column used was a 30 mm × 0.25 mm ID RXI-5MS, film thickness 0.25 μm (Restek 13424-6850, Bellefonte, PA, USA). Temperature program used was as follows: 39°C for 2 min, from 39 to 95°C at 3.5°C/min, then to 165°C at 6°C/min, to 250°C at 15°C/min and finally to 300°C at 40°C/min, hold 20 min. The VOCs were detected by the MS operating at 70 eV in EI mode. Mass spectra were acquired in full-scan-mode (30–400 AMU, 4 scans/s). Mass-spectra’s were extracted with MassHunter Qualitative Analysis Software V B.06.00 Build 6.0.633.0 (Agilent Technologies, Santa Clara, CA, USA) using the GC-Q-TOF qualitative analysis module. The obtained mass spectra’s were exported as mzData files for further processing in MZmine V2.14.2. The files were imported to MZmine V2.14.2 (Copyright 2005–2012 MZmine Development Team; Katajamaa et al., 2006; Pluskal et al., 2010) and compounds were identified via their mass spectra using deconvolution function (Local-Maximum algorithm) in combination with two mass-spectral-libraries: NIST 2014 V2.20 (National Institute of Standards and Technology, USA2) and Wiley 7th edition spectral libraries and by their linear retention indexes (LRIs). The LRI values were calculated using an alkane calibration mix before the measurements in combination with AMDIS 2.72 (National Institute of Standards and Technology, USA). The calculated LRI were compared with those found in the NIST and in the in-house NIOO LRI database. After deconvolution and mass identification peak lists containing the mass features of each treatment (MZ-value/Retention time and the peak intensity) were created and exported as CSV files for statistical processing. The whole volatolomic workflow is shown in Supplementary Figure S2.
To test the effect of the emitted bacterial volatiles on fungal/oomycete growth the hyphal extension and biomass were measured. The assays were performed in Petri dishes containing top and bottom growth areas (Supplementary Figure S3). At the bottom of the Petri dish, 100 μl of bacterial suspensions in 10 mM phosphate buffer (pH 6.5) containing ∼1 × 10∧5 CFU/mL were spread on 20 mL 1/10th TSBA. At the lid of the Petri dish 12.5 mL of water-agar medium (WA; 20 g L-1 MERCK agar) was added and inoculated in the middle with a 6-mm-diameter PDA agar plug containing fungal (R. solani, F. culmorum) or oomycete (P. ultimum) hyphae. The plates were sealed with two layers of parafilm and incubated at 24°C for 5 days. In this way the tested fungi were exposed (without direct physical contact) to the volatiles produced by the bacteria in the bottom compartment. On the fifth day the extension of the hyphae was measured in 4 evenly spaced directions and compared to the hyphae extension in the control plates (fungi exposed to 1/10th TSBA growth medium without bacteria).
Fungal biomass was determined as described by Garbeva et al. (2014b). The whole growth area in the lids containing water agar and fungal hyphae was cut in ∼2 cm2 pieces and transferred to a glass beaker containing 100 mL of sterile demi-water (H2O). The agar was melted for ∼2.5 min in a microwave oven (temperature increased to about 100°C). The melted agar containing the hyphae was filtered over a tea strainer and the remaining hyphae were rinsed with about 150–200 mL of hot water (∼80°C). The hyphae were picked with tweezers from the tea strainer and transferred to a micro centrifuge tube and stored at -20°C until analysis. For determination of fungal/oomycete biomass the frozen hyphae were transferred to a glass tube with lids with small holes and subjected to freeze-drying for 48 h (Labconco Freezone 12 with Labconco Clear Drying Chamber nr.7867000). The samples were stored in an exsiccator with dried silica gel for 3 h (Silica Gel Orange, 2–5 mm, indicator, Roth, art.nr.P077.2) prior weighing the dry biomass.
The assays were performed in two-compartment Petri dishes (Greiner bio-one B.V., Alphen a/d Rijn, The Netherlands, Cat# 635102) containing two separated compartments (Supplementary Figure S4). In such way the growth response of target bacteria to volatile producing bacteria could be determined without direct physical contacts. One compartment was supplemented with 12.5 mL TSBA and contained the volatile producing bacteria either in monoculture or in pairwise interactions. The second compartment contained the indicator bacteria and was supplemented either with 12.5 mL LBA (E. coli WA321, S. aureus 533R4) or with 12.5 mL TSBA (S. marcescens P87). The compartment for the volatile producing bacteria was inoculated with 100 μl bacterial suspensions master mix of monocultures or pairwise interactions prepared with 20 mL of 10 mM phosphate buffer (pH 6.5) containing ∼1 × 10∧5 CFU/mL. The compartment for the indicator organisms was inoculated with four droplets (5 μL) of each indicator bacteria. The droplets of the indicator bacteria were placed in a distance of 2 cm to each other and contained 1 × 10∧5, 1 × 10∧4, 1 × 10∧3, and 1 × 10∧2 CFU/mL of either E. coli WA321, S. aureus 533R4, or S. marcescens P87 (Supplementary Figure S4). As controls the first compartment of the Petri dish was kept empty. After 4 days of incubation at 24°C the plates were examined and digital photographs were taken. The digital images were analyzed using the AXIO VISION v4.8 imaging Software (Carl Zeiss Imaging Solutions GmbH, Germany) for enumeration and surface-area determination (in pixelˆ2) of the bacterial colonies. All treatments were performed in triplicate.
The effect on growth, colony morphology and pigmentation by pure dimethyl disulfide (DMDS; CH3S2CH3), dimethyl trisulfide (DMTS; CH3S3CH3) and the mixture of both compounds was tested on E. coli WA321, S. aureus 533R4 and S. marcescens P87. The assays were performed in two-compartment Petri dishes (Greiner bio-one B.V., Alphen a/d Rijn, The Netherlands, Cat# 635102). Both compartments were supplemented with either 12.5 mL LBA (assay performed with E. coli WA321 and S. aureus 533R4) or with 12.5 mL TSBA (assay performed with S. marcescens P87). In one compartment a filter paper with a diameter of ∼5.5 mm (WhatmanTM filter paper Cat# 1003-150, 6 μm pore size) was placed on the agar surface in the middle of the compartment. Stock solutions with a concentration of 10, 1, and 0.1 μM of the pure volatile compounds (DMDS or DMTS) and the mixture of both compounds (DMDS + DMTS) were prepared by serial dilution of the pure compounds in Methanol (LiChrosolv®, Index-No: 603-001-00-X, Merck, Darmstadt, Germany). For the test a volume of 5 μl of each of the pure volatile stock solutions was added directly onto the filter paper resulting in a final concentration of 50, 5, and 0.5 μM, respectively. The other compartment was inoculated with the target bacteria E. coli WA321, S. aureus 533R4 or S. marcescens P87 by inoculating four spots in a distance of 2 cm from each other containing 1 × 10∧5, 1 × 10∧4, 1 × 10∧3, and 1 × 10∧2 CFU/mL (Supplementary Figure S4). As controls bacteria exposed to filter papers with no added volatile compounds were applied. The Petri dishes were sealed with a double layer of parafilm and incubated for 4 days at 24°C. After incubation digital photographs were taken and the effect on colony growth, colony morphology and pigment production (prodigiosin) in S. marcescens P87 was examined. All digital images were analyzed using the AXIO VISION v4.8 imaging Software (Carl Zeiss Imaging Solutions GmbH, Germany) for enumeration and surface-area determination (in pixelˆ2) of the bacterial colonies. All treatments were performed in triplicate.
Statistical analysis on volatolomic data was performed using the statistical analysis module of MetaboAnalyst V3.0, www.metaboanalyst.ca (Xia et al., 2012, 2015). Prior to statistical analysis data normalization was performed via log-transformation. To identify significant abundant mass features one-way-ANOVA with post hoc Tukey test (HSD- test) was performed between the data sets. To identify important mass features in the samples PLS-D analysis was performed. Mass features were considered to be statistical relevant if p-values were ≤0.05. Statistical relevant mass features were further used for the compound identification. Statistical analyses on fungal dry biomass and bacterial colony sizes were performed with IBM SPSS Statistics 23 (IBM, Somers, NY, USA) using one-way ANOVA and post hoc Tukey test between the data sets. The 5% level was taken as threshold for significance between control and volatile treatments.
All bacterial strains used in this study were tested for the emission of ammonia and HCN as well as for the ability to change the pH- value of the growth medium where the target organisms were inoculated. For these tests the bacteria were inoculated in two-compartment Petri dishes (start density ∼1 × 10∧5 CFU/mL) on 12.5 mL 1/10th TSBA. The second compartment was supplemented with 12.5 mL WA. After 4 days of growth the HCN and ammonia emission as well the pH-value of the target organism growth medium (WA) was determined. To test for the presence of Hydrocyanic acid the gaseous content of the Petri dish headspace was sucked through a Hydrocyanic acid test tube (Dräger Safety AG and CO. KGaA, Lübeck, Germany, order number: CH25701) using the Dräger accuro® gas detection pump (Dräger Safety AG and CO. KGaA, Lübeck, Germany). Presence of Hydrocyanic acid was determined by color change of the test tube (formation of a red reaction product; Supplementary Figure S5). The pH of the target organism growth medium (WA) exposed to bacterial volatiles was determined by slightly pressing a pH test-strip VWR PROLABO dosatest® (VWR international, Cat# 35309.606UK) for 30 s into the agar surface. The pH values were determined by color change of the test strip and compared to the color scale on the package (Supplementary Figure S6). The ammonia concentration was determined using the MQuantTM ammonium test kit (Merck, Darmstadt, Germany, Cat# 110024) by placing a reaction activated test-strip on the lid of the Petri dish directly opposite to the bacterial culture and fixed with tape. The Petri-dish were closed and sealed with parafilm and incubated for 2 h at 24°C. After incubation the presence of ammonium was determined by color change of the test strip (Supplementary Figure S7).
GC/MS-Q-TOF based volatolomic analysis revealed a total number of 35 compounds that were not detected in the non-inoculated controls (Table 2). 27 compounds were obtained from the monocultures of Chryseobacterium sp. AD48, 15 compounds were obtained from the monocultures of Tsukamurella sp. AD106 and 26 compounds were detected in the interactions between these two bacteria (Table 2; Figure 1A). For the combinations of Dyella sp. AD56 and Janthinobacterium sp. AD80 we obtained a total number of 18 compounds, whereas 16 compounds were detected in the monoculture of Janthinobacterium sp. AD80 and only 13 compounds in the monoculture of Dyella sp. AD56 (Table 2; Figure 1B). We were able to tentatively identify 19 VOCs belonging to seven different chemical classes including alcohols, amines, esters, indole, thiocyanates, thioesters, and sulfides. However, a vast number of the detected compounds (n = 16) could not be assigned with certainty to a VOC and remained unknown. The most prominent detected headspace VOCs were sulfur containing compounds (such as sulfordioxide, methyl thioacetate, dimethyl sulfoxide, etc.). Two sulfur compounds DMDS (C2H6S2) and DMTS (C2H6S3) were produced by all bacteria (except DMTS which was not detected for Janthinobacterium sp. AD80).
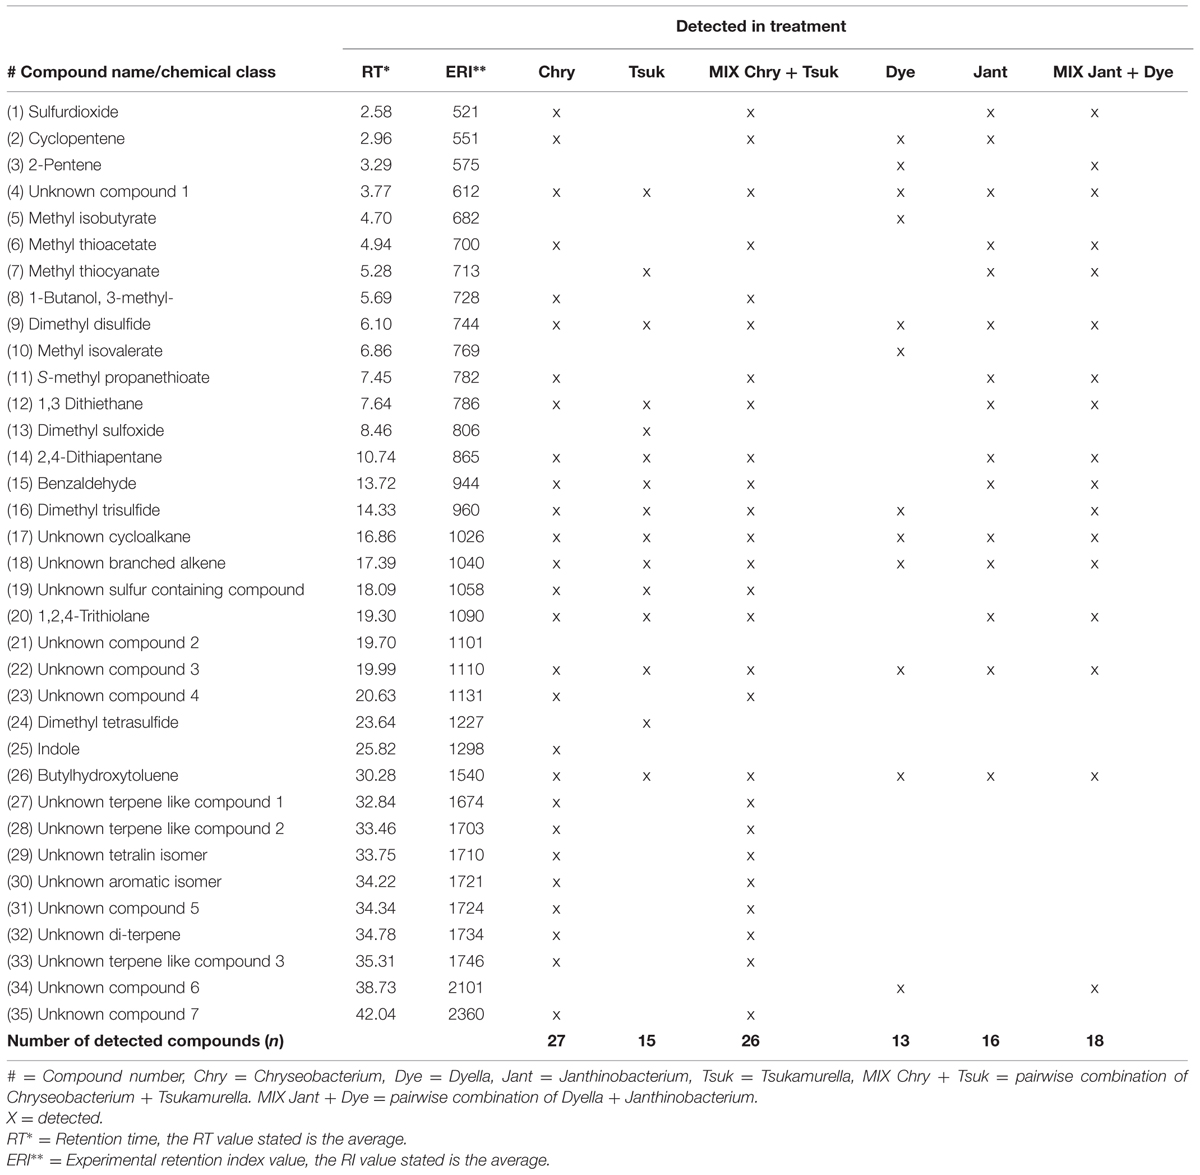
TABLE 2. Tentatively identified volatile organic compounds emitted by four bacterial strains cultivated either in monoculture or in pairwise combination.
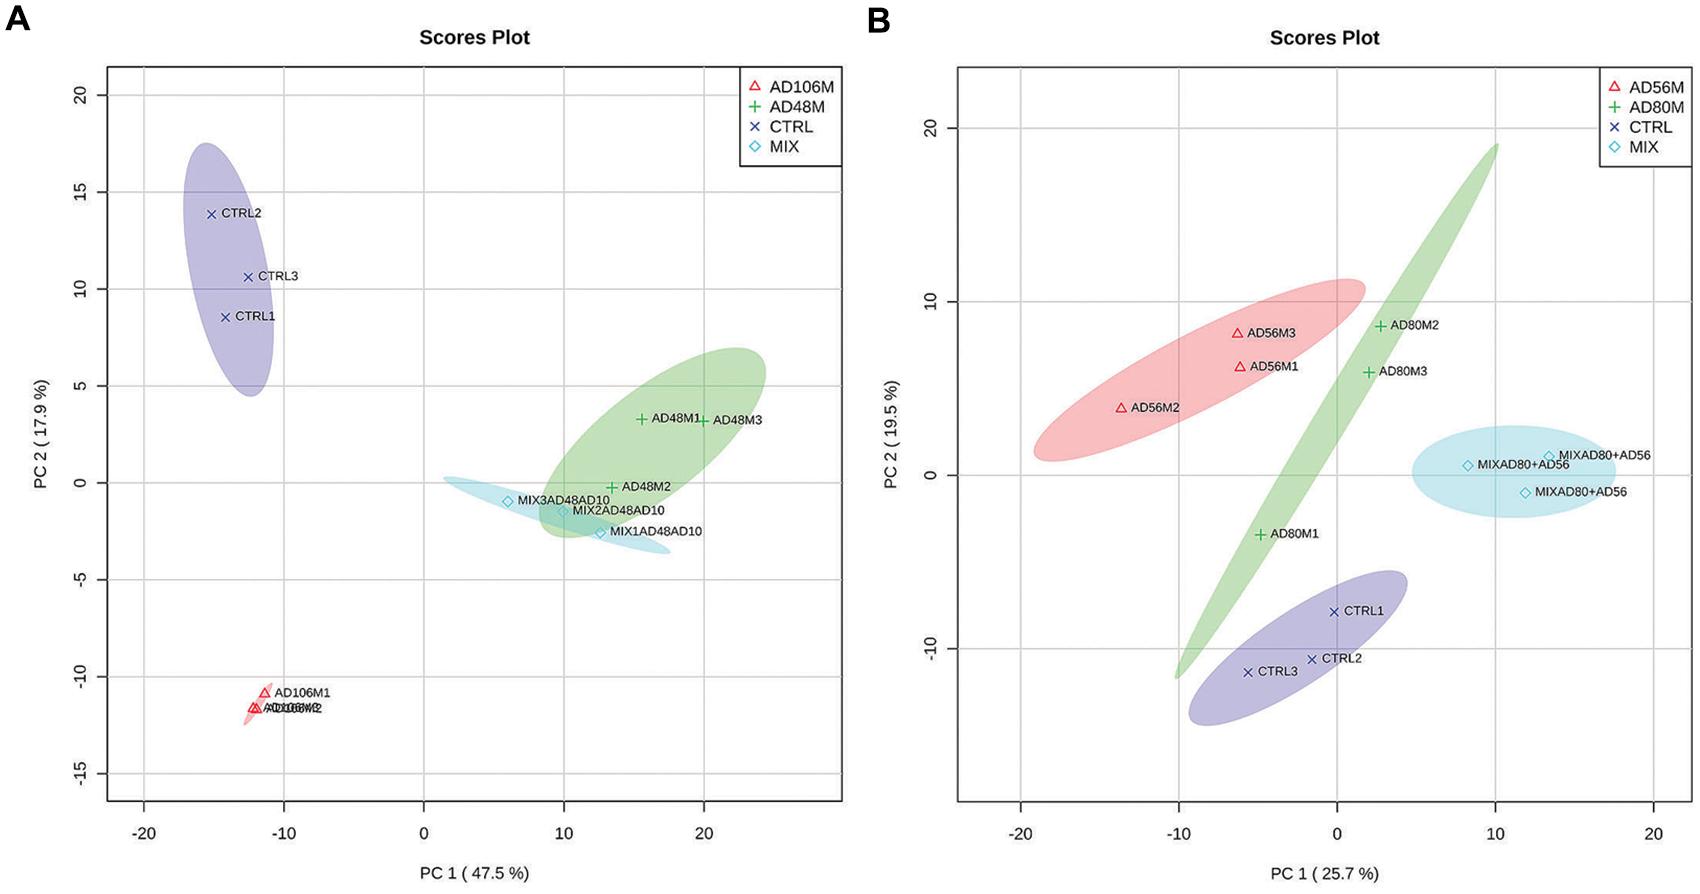
FIGURE 1. PCA 2D- plots of volatiles emitted by monocultures and pairwise combinations of bacteria including confidence intervals (in semi-transparent colors). (A) Monocultures and mixtures of Tsukamurella sp. AD106 and Chryseobacterium sp. AD48 and (B) monocultures and mixtures of Dyella sp. AD56 and Janthinobacterium sp. AD80.
Volatolomic analysis on monocultures and pairwise combinations of Chryseobacterium sp. AD48 with Tsukamurella sp. AD106 revealed that the volatile composition of the monocultures differed from that of the mixtures (Figure 1A; Table 2). Clear separations between controls, monocultures and pairwise combinations of Chryseobacterium sp. AD48 with Tsukamurella sp. AD106 were obtained in PCA score plots (Figure 1A). The volatile composition of the pairwise combinations resembled that of the monocultures of Chryseobacterium sp. AD48 (Figure 1A; Table 2). The indole produced by the monoculture of Chryseobacterium sp. AD48 was not detected in the interactions (Table 2).
The analysis on the volatiles emitted by monocultures and pairwise combinations of Dyella sp. AD56 and Janthinobacterium sp. AD80 revealed that the volatile profiles of the monocultures differed from that of the mixtures (Figure 1B; Table 2). Different PCA score plots were obtained between controls, monocultures and pairwise combinations of Dyella sp. AD56 with Janthinobacterium sp. AD80 (Figure 1B). A higher number of volatile compounds were detected in the pairwise combinations of these two bacteria. However, the higher number of detected volatiles is most probably due to the combination of the volatile blends of these two bacterial isolates. We did not detect any novel or different volatile compounds which production was triggered during the pairwise interaction of these two bacteria. Interestingly the volatile compound cyclopentene produced by the monocultures of Dyella sp. AD56 and Janthinobacterium sp. AD80 was not detected in the interactions (Table 2).
Volatiles produced by all treatments including monocultures and pairwise combinations of the selected bacteria revealed strong growth inhibition of the plant pathogenic fungi and oomycete. The dry biomass of fungi and oomycete exposed to bacterial volatiles was significantly reduced as compared to the controls without bacterial volatiles (Table 3; Figures 2 and 3).
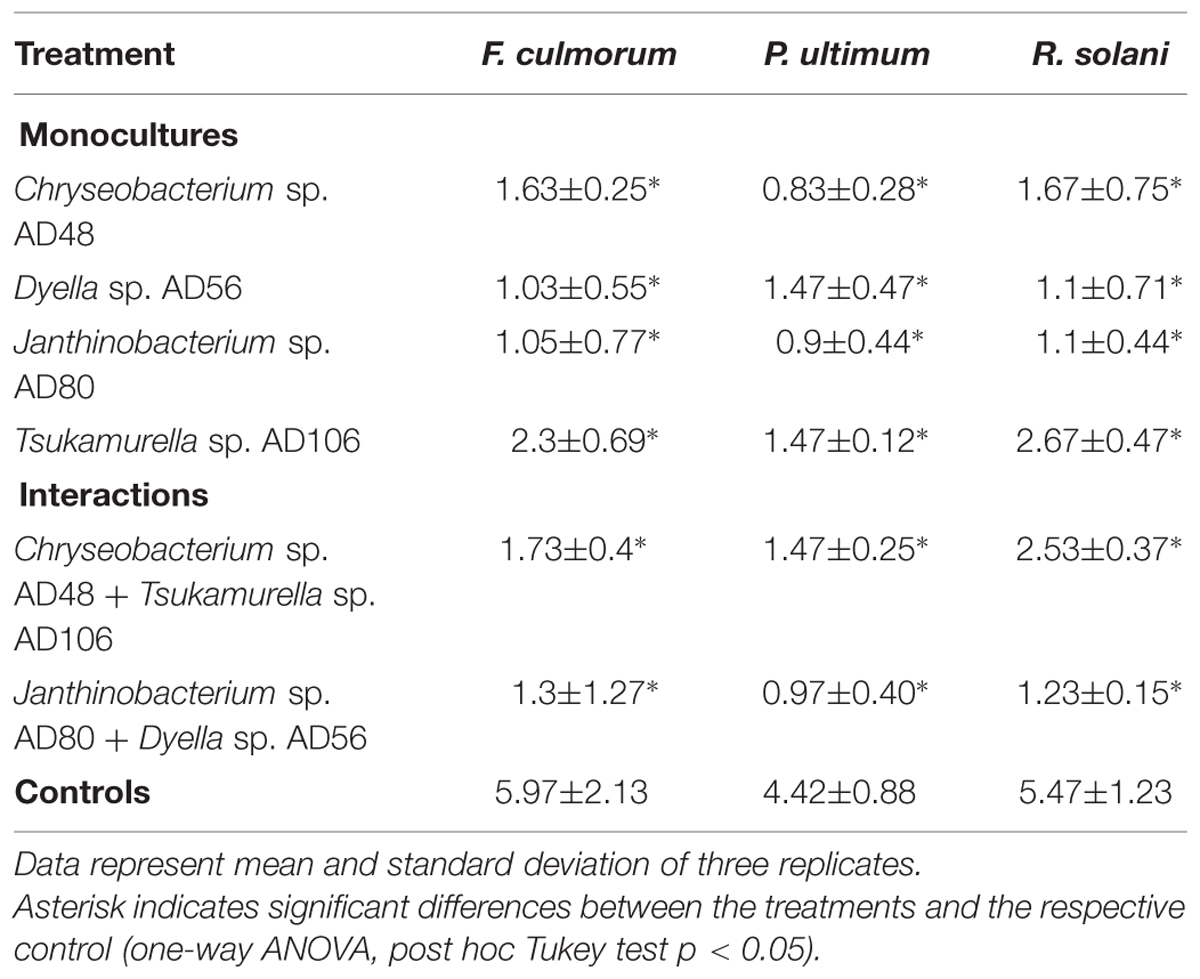
TABLE 3. Effect of bacterial volatiles on fungal and oomycetal biomass production (mg/dry weight of fungal/oomycetal biomass).
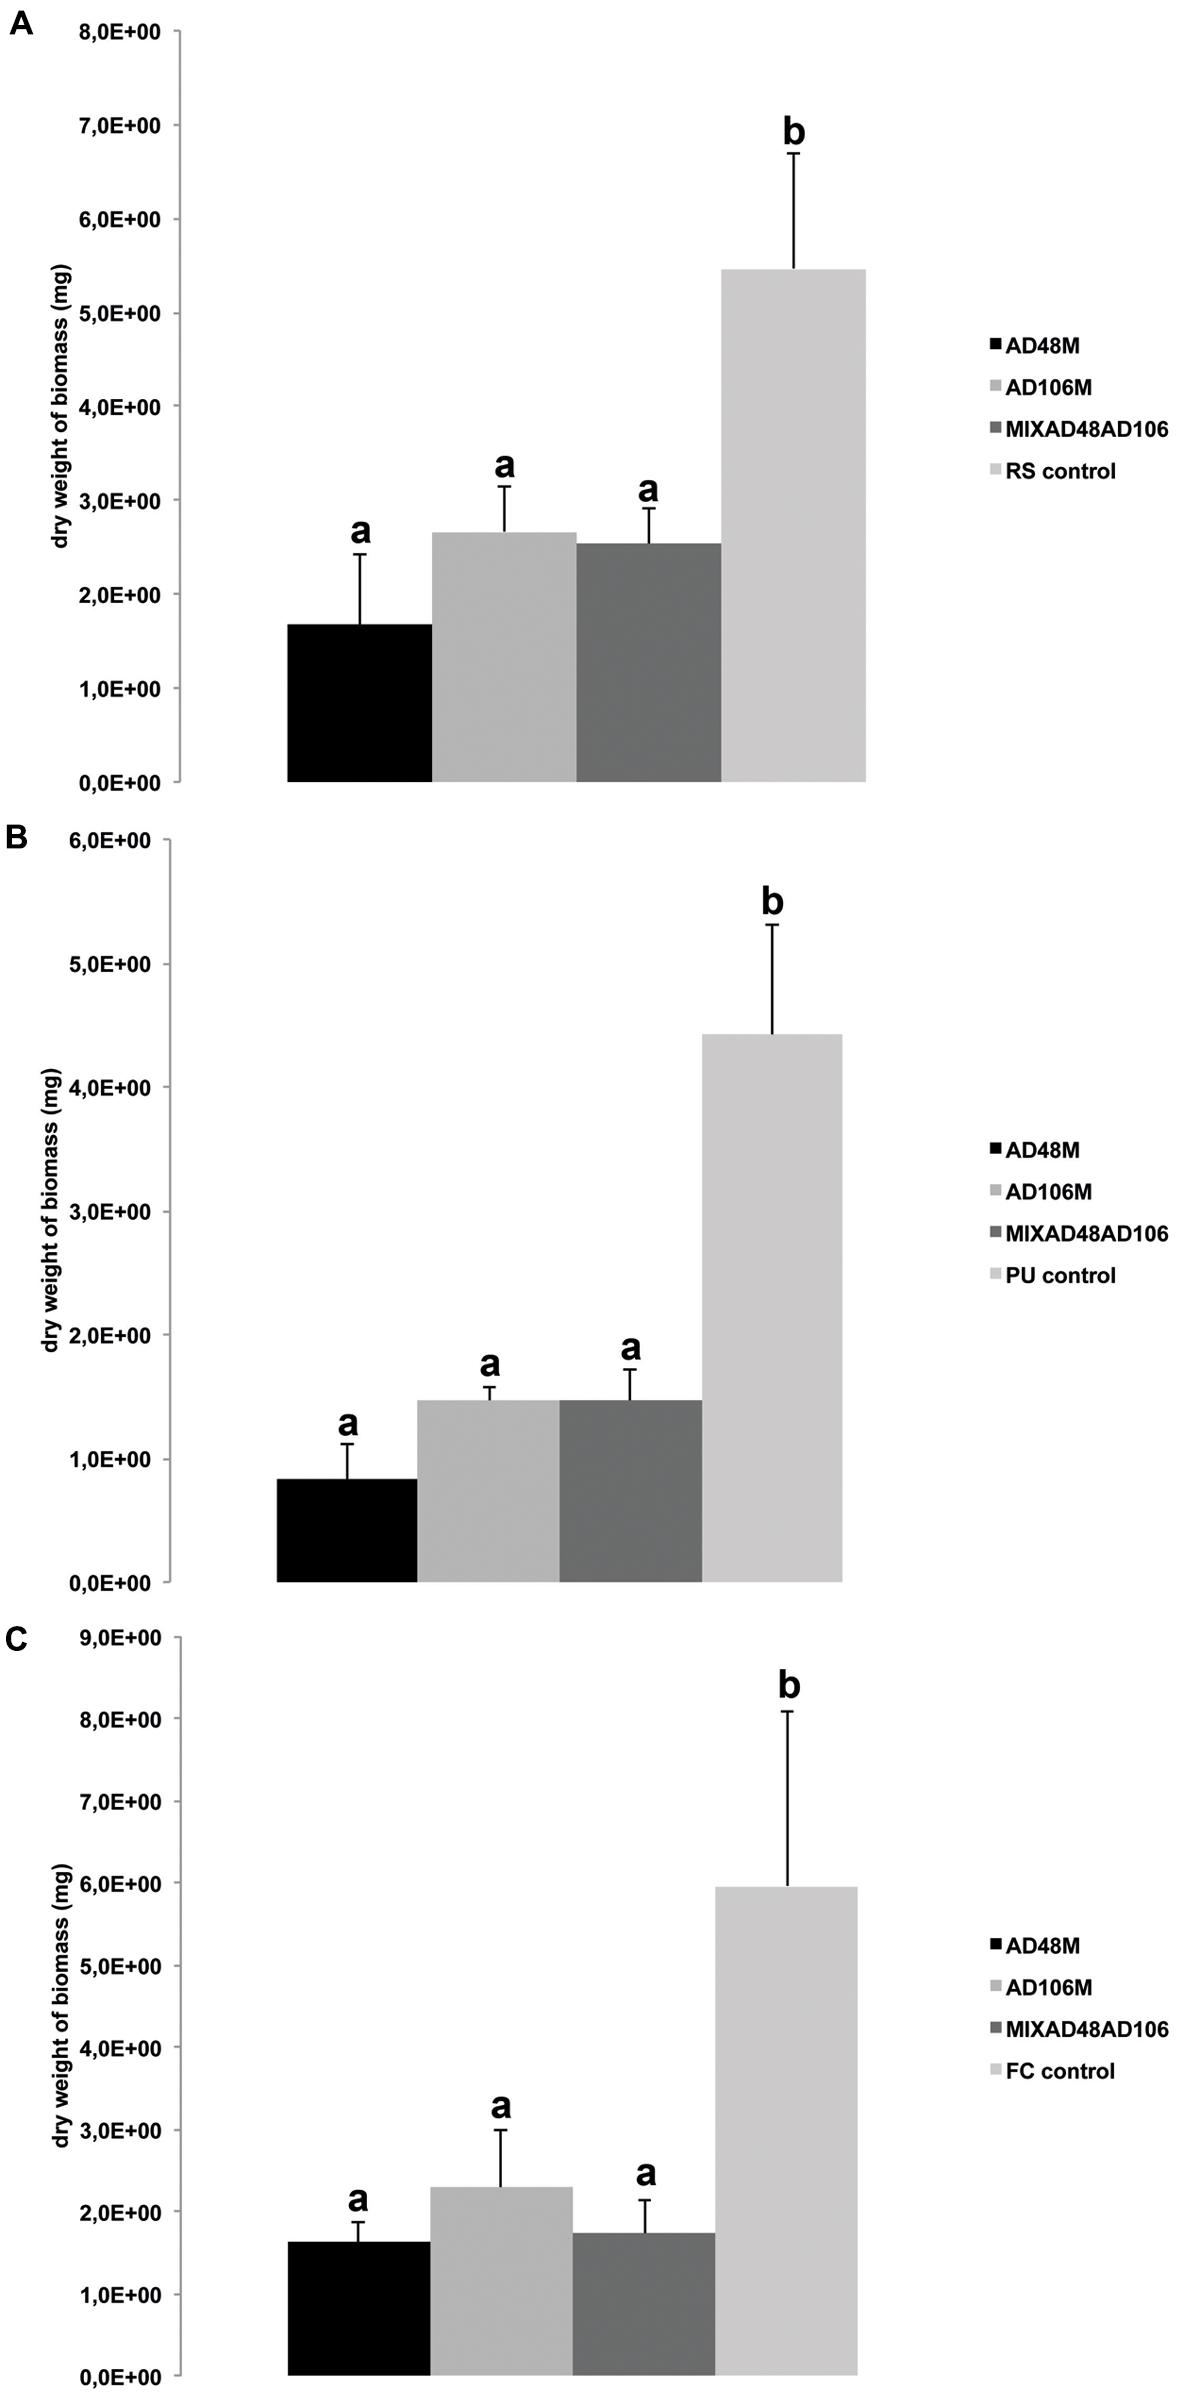
FIGURE 2. Effect of volatiles produced by monocultures and mixtures of Tsukamurella sp. AD106 and Chryseobacterium sp. AD48 on growth of eukaryotic plant-pathogens. Bars represent the average values for fungal and oomycetal biomass dry weight and error bars represent standard deviation of the mean. (A) Dry weight of Rhizoctonia solani; (B) dry weight of Pythium ultimum; (C) dry weight of Fusarium culmorum. Significant differences between treatments and the control are indicated by different letters (one-way ANOVA, post hoc Tukey test p < 0.05).
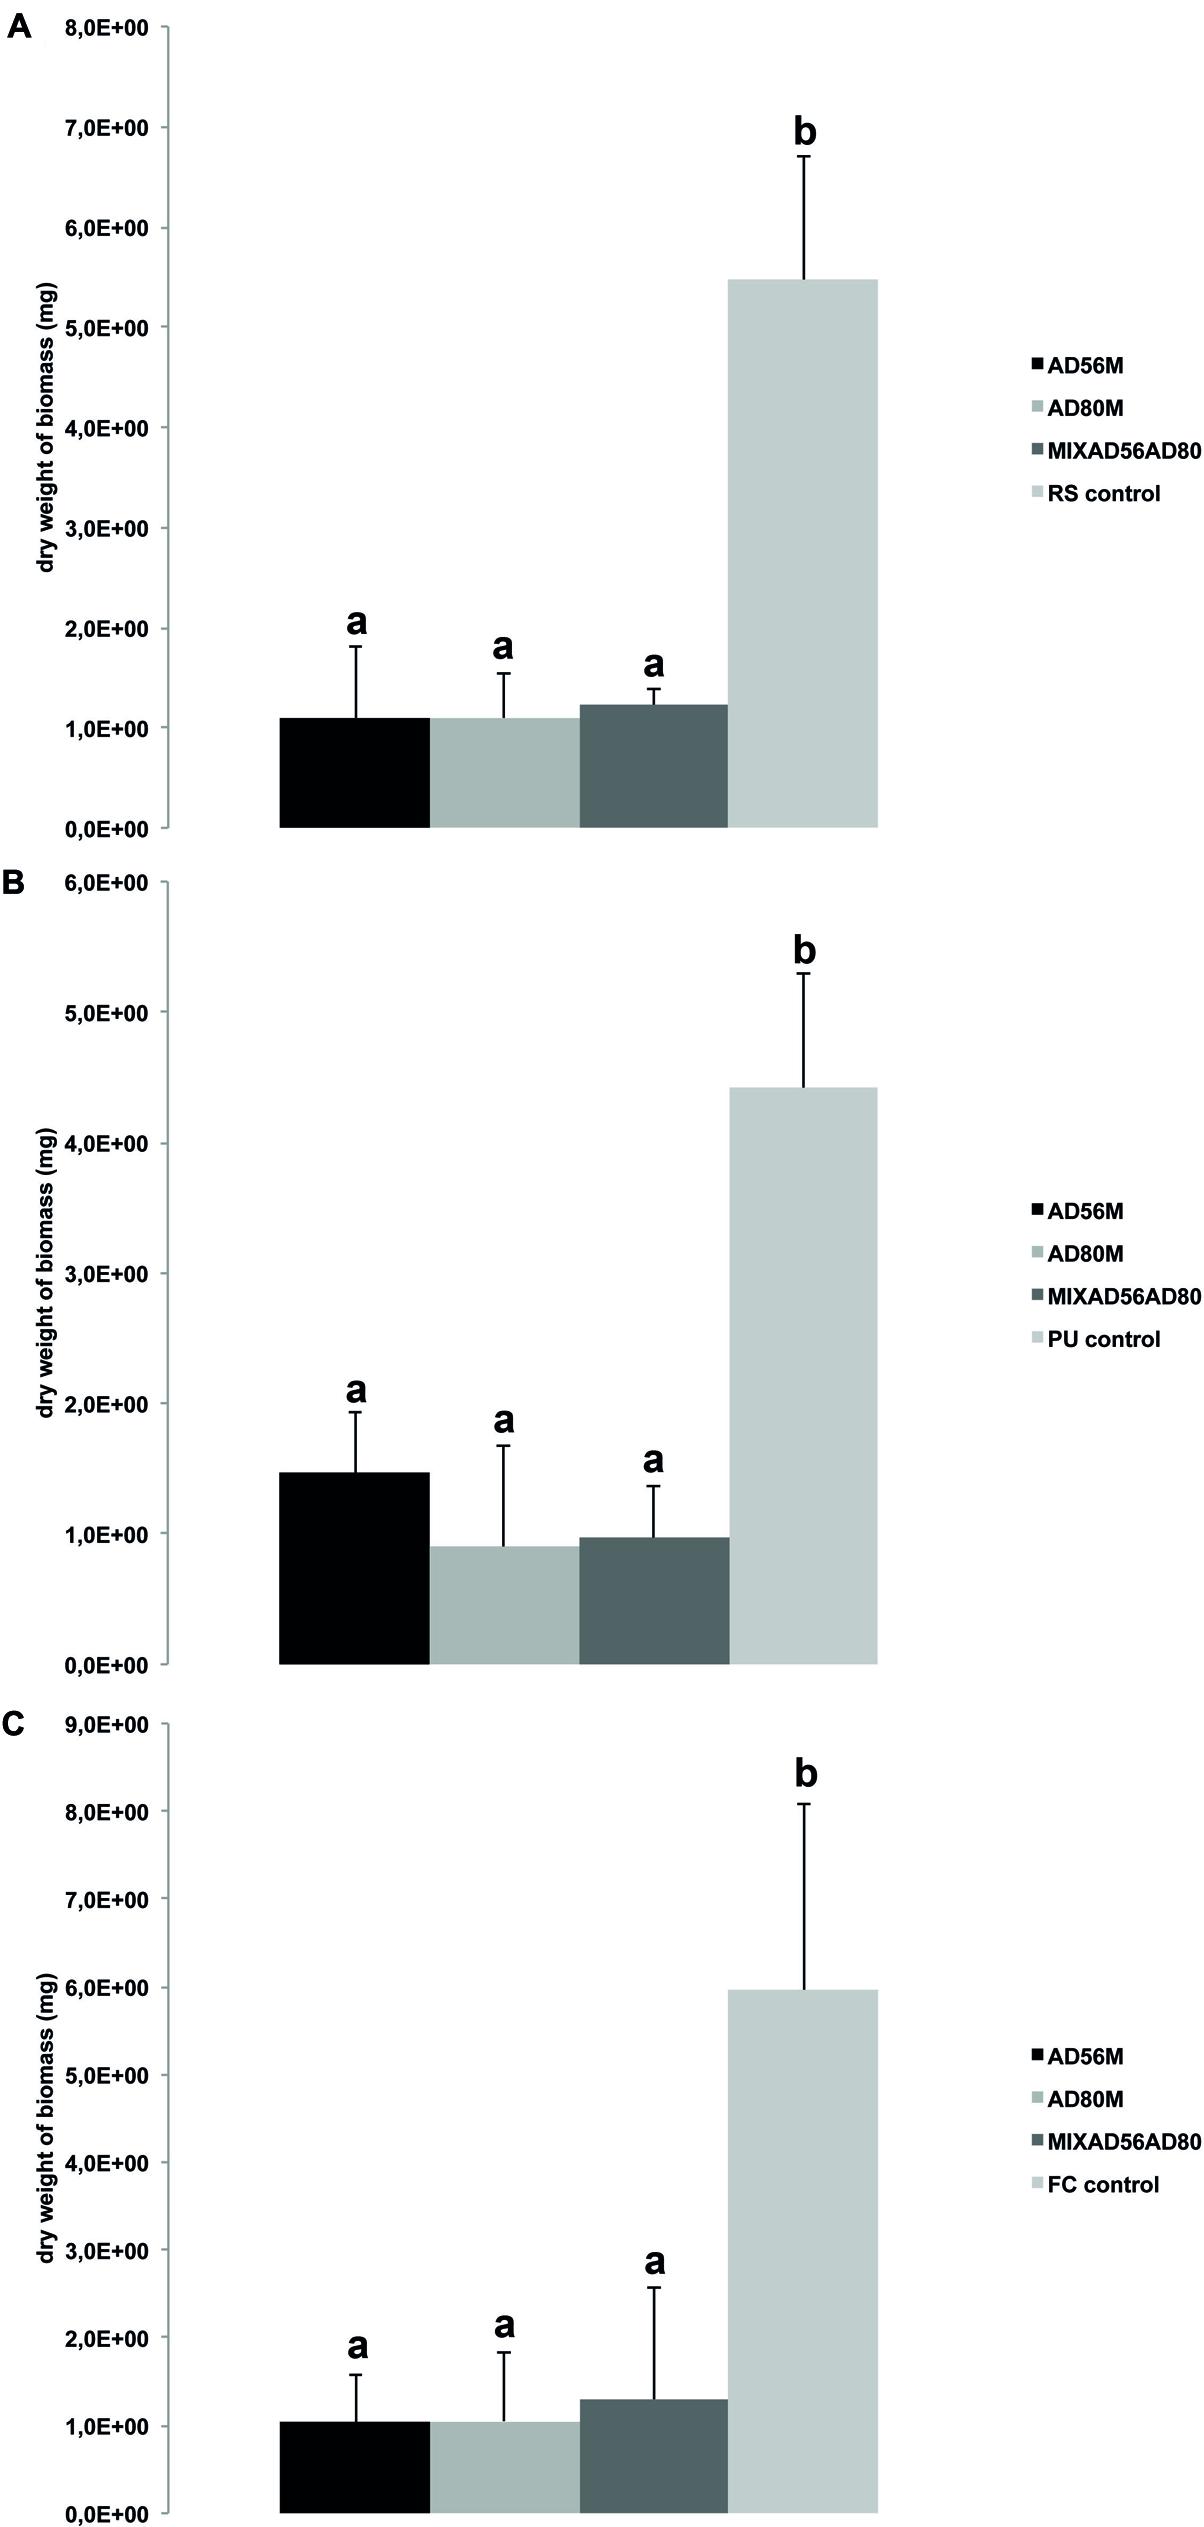
FIGURE 3. Effect of volatiles produced by monocultures and mixtures of volatile emitting Dyella sp. AD56 and Janthinobacterium sp. AD80 on growth of eukaryotic plant-pathogens. Bars represent the average values for fungal and oomycetal biomass dry weight and error bars represent standard deviation of the mean. (A) Dry weight of R. solani; (B) dry weight of P. ultimum; (C) dry weight of F. culmorum. Significant differences between treatments and the control are indicated by different letters (one-way ANOVA, post hoc Tukey test p < 0.05).
Volatiles emitted by Chryseobacterium sp. AD48 and the mixture of Chryseobacterium sp. AD48 and Tsukamurella sp. AD106 inhibited the growth of E. coli WA321 significantly as compared to the control (Figure 4A). This observation is in agreement with the observed volatolomic profile (Figure 1A) which revealed that the volatolomic profile of the mixture is dominated by the volatiles produced by the monoculture of Chryseobacterium sp. AD48.
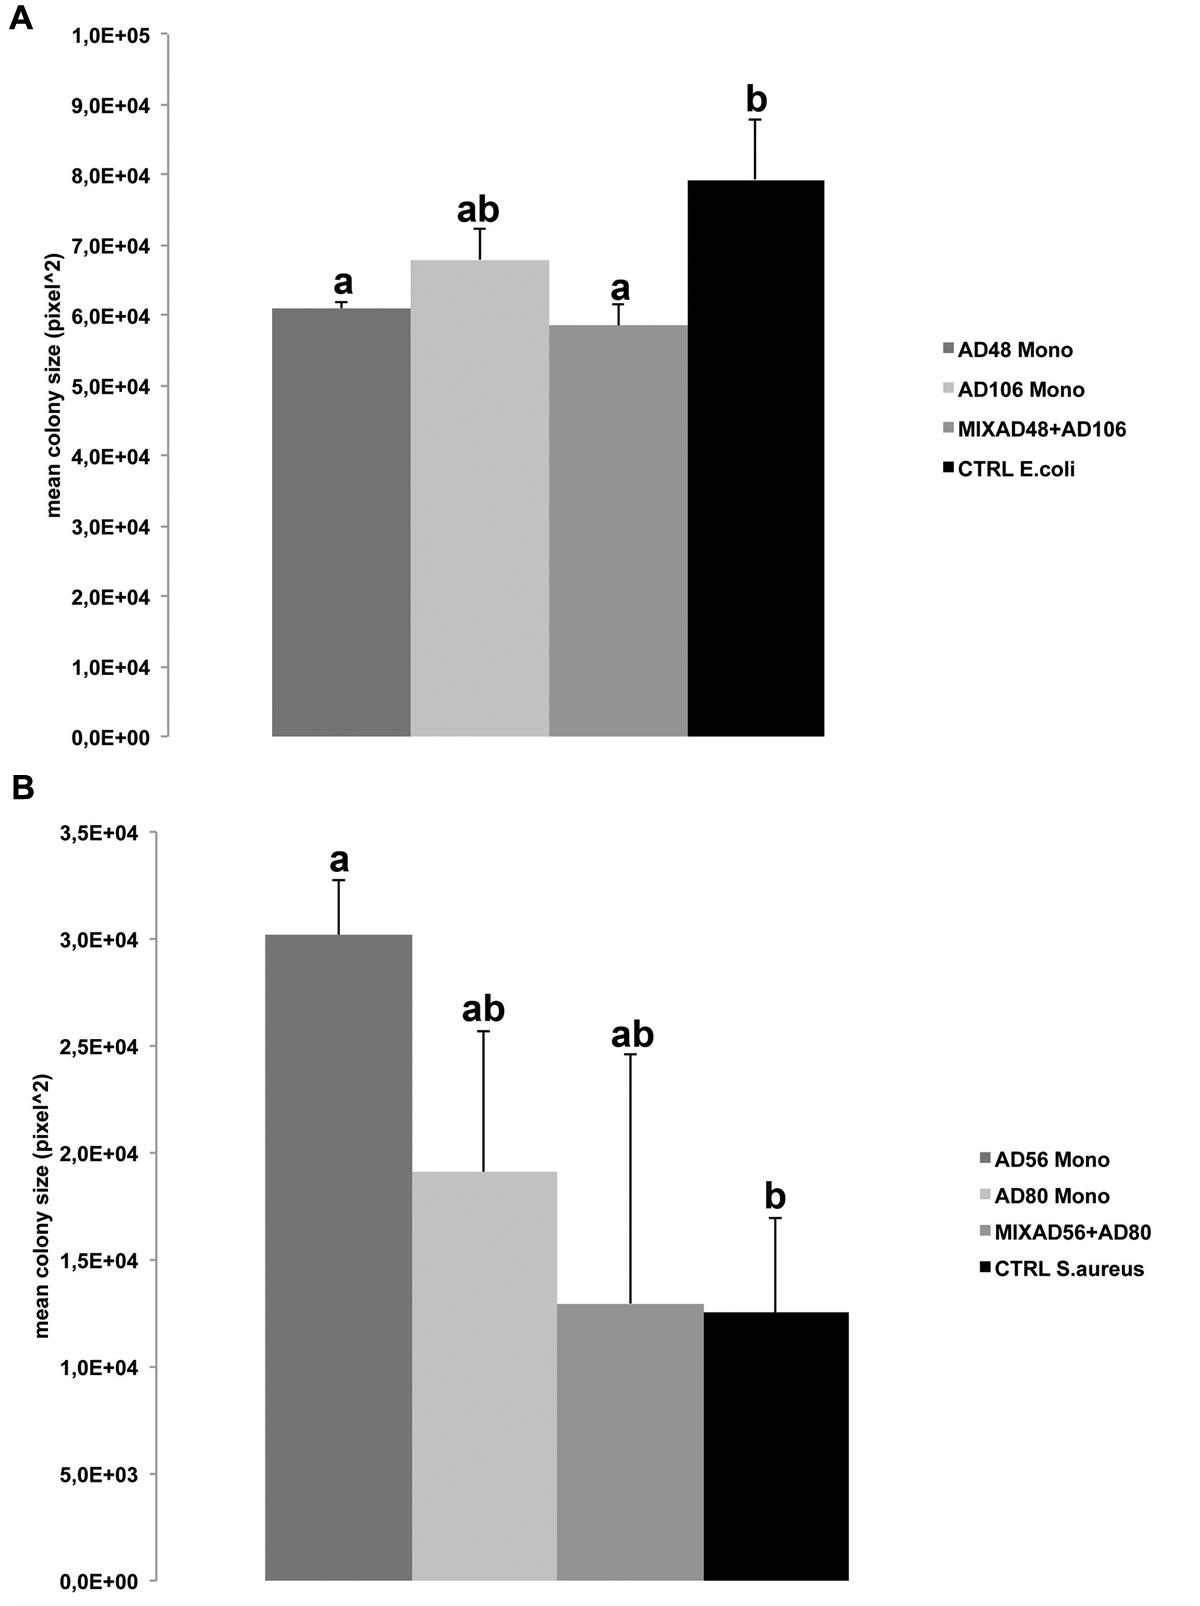
FIGURE 4. Effect of volatiles produced by monocultures and pair-wise combinations of the four selected rhizosphere bacterial strains on average colony size of the target bacteria. (A) Mean colony size of Escherichia coli WA321 exposed to volatile compounds of Chryseobacterium sp. AD48 and Tsukamurella sp. AD106 and the mixture of both bacteria. (B) Mean colony sizes of Staphylococcus aureus 533R4 exposed to volatile compounds of Dyella sp. AD56, Janthinobacterium sp. AD80 and the mixture of both bacteria. Significant differences between treatments and the control are indicated by different letters (one-way ANOVA, post hoc Tukey test p < 0.05). Data represented are the mean of three replicates, error bars represent standard deviation of the mean.
Besides growth inhibition we observed significant growth promotion of S. aureus 533R4 when exposed to volatiles emitted by the monocultures of Dyella sp. AD56 (Figure 4B).
Changes in colony morphology of S. marcescens P87 were observed when exposed to volatiles emitted by Chryseobacterium sp. AD48 and to volatiles emitted by the mixtures of Dyella sp. AD56 with Janthinobacterium sp. AD80. The S. marcescens P87 colonies were more circular and round shaped (Supplementary Figure S8). However, no significant effects of bacterial volatiles on the growth of the target bacteria were also observed (Supplementary Figure S9).
We applied a two-compartment Petri dish testing system (Supplementary Figure S4) in which the model organisms could grow without direct physical contacts to the tested pure volatile compounds. After 4 days of growth S. marcescens P87 colonies were small and showed a white phenotype when exposed to 50 μM of DMTS, indicating the lack of prodigiosin production (Figure 5A). Furthermore we observed significant inhibition of growth of S. marcescens P87, E. coli WA321 and S. aureus 533R4 when exposed to 50 μM of DMTS (Figures 5–7).
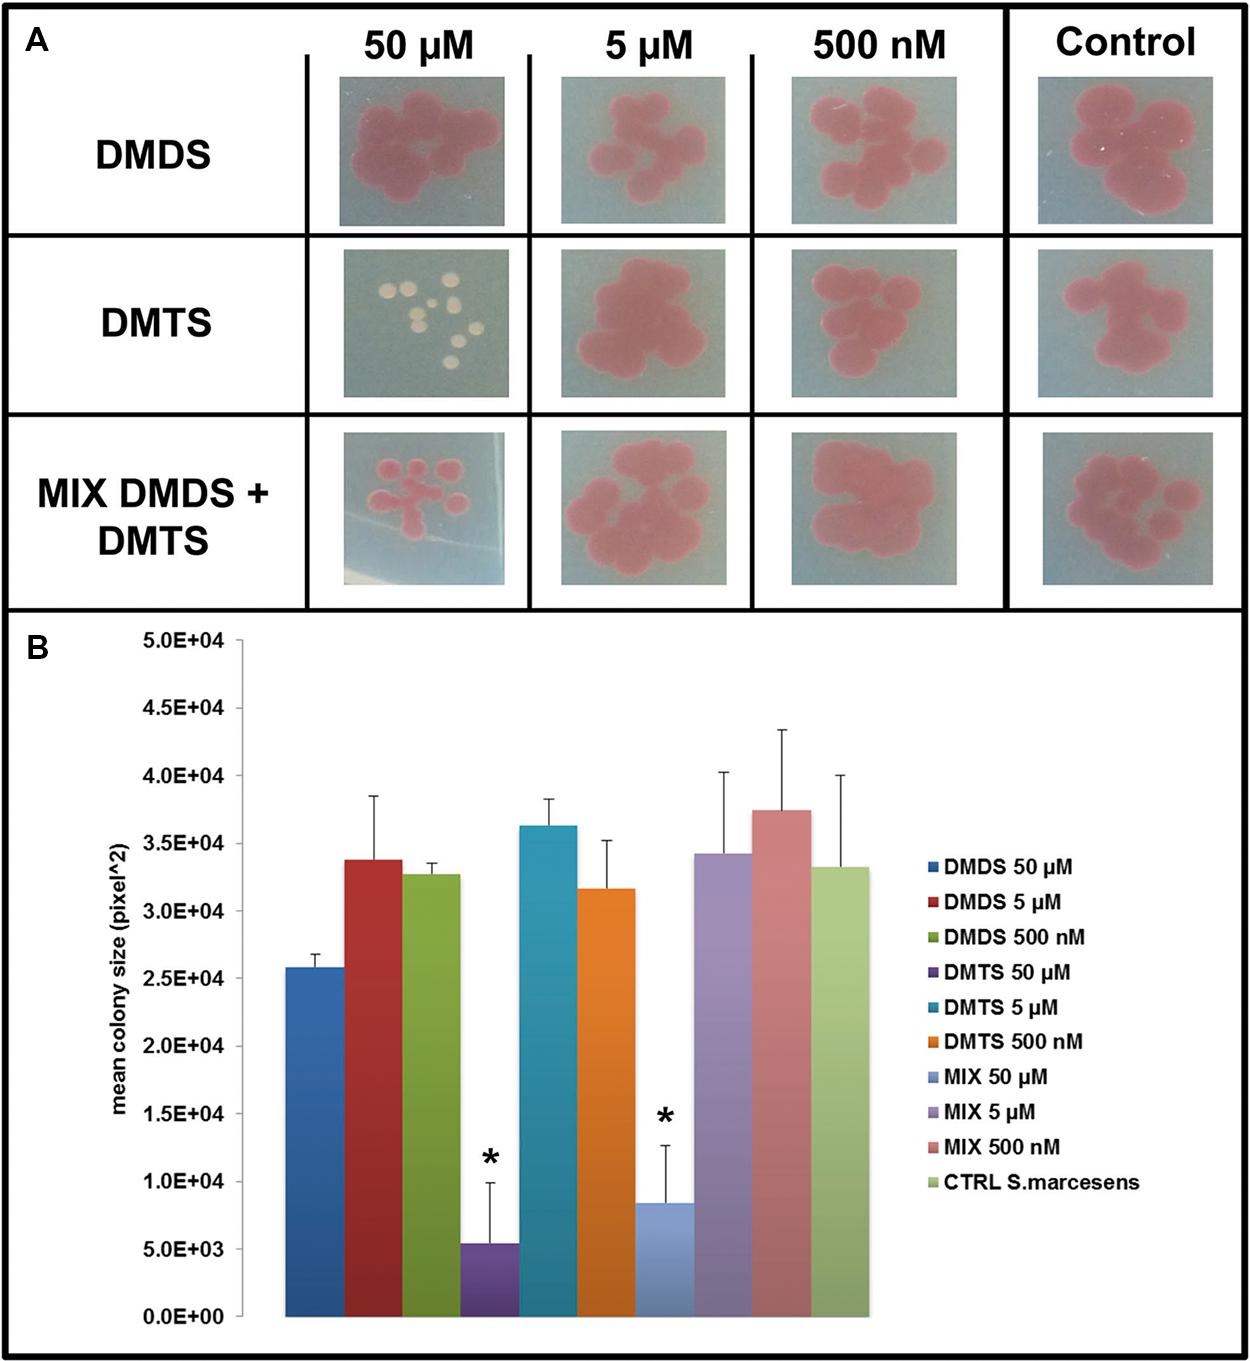
FIGURE 5. Effect of dimethyl disulfide (DMDS), dimethyl trisulfide (DMTS), and the mixture of both volatile compounds (DMDS + DMTS) on colony development of S. marcescens. (A) Colony morphology and growth of S. marcescens P87 after 4 days of incubation. The pure volatile compounds were applied in a concentration ranging from 500 nM to 50 μM. Control S. marcescens P87 grown without exposure to the compounds. (B) Mean colony sizes of S. marcescens P87 exposed to volatile compounds of DMDS, DMTS, and the mixture of both volatile compounds (DMDS + DMTS). Asterisk indicates significant differences between the treatments and the control (one-way ANOVA, post hoc Tukey test p < 0.05). Data represented are the mean of three replicates, error bars represent standard deviation of the mean.
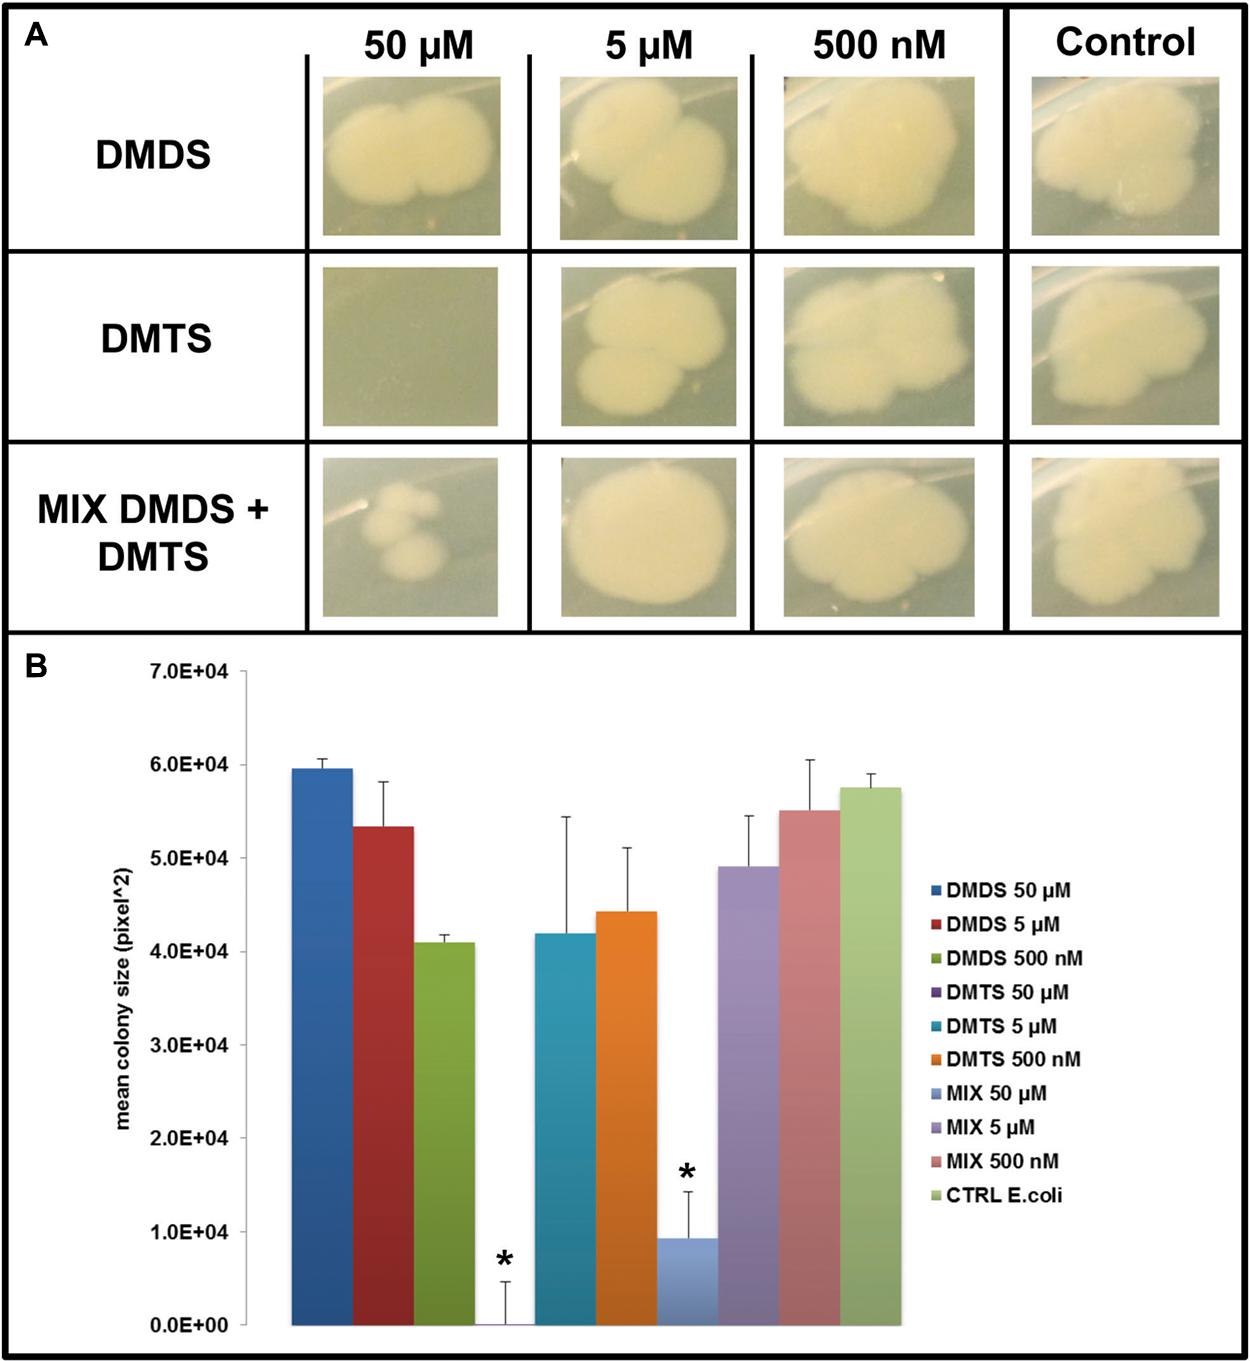
FIGURE 6. Effect of DMDS, DMTS, and the mixture of both volatile compounds (DMDS + DMTS). (A) Colony morphology and growth of E. coli WA321 after 4 days of incubation. The pure volatile compounds were applied in a concentration ranging from 500 nM to 50 μM. Control E. coli WA321 grown without exposure to the compounds. (B) Mean colony sizes of E. coli WA321 exposed to volatile compounds of DMDS, DMTS, and the mixture of both volatile compounds (DMDS + DMTS). Asterisk indicates significant differences between the treatments and the control (one-way ANOVA, post hoc Tukey test p < 0.05). Data represented are the mean of three replicates, error bars represent standard deviation of the mean.
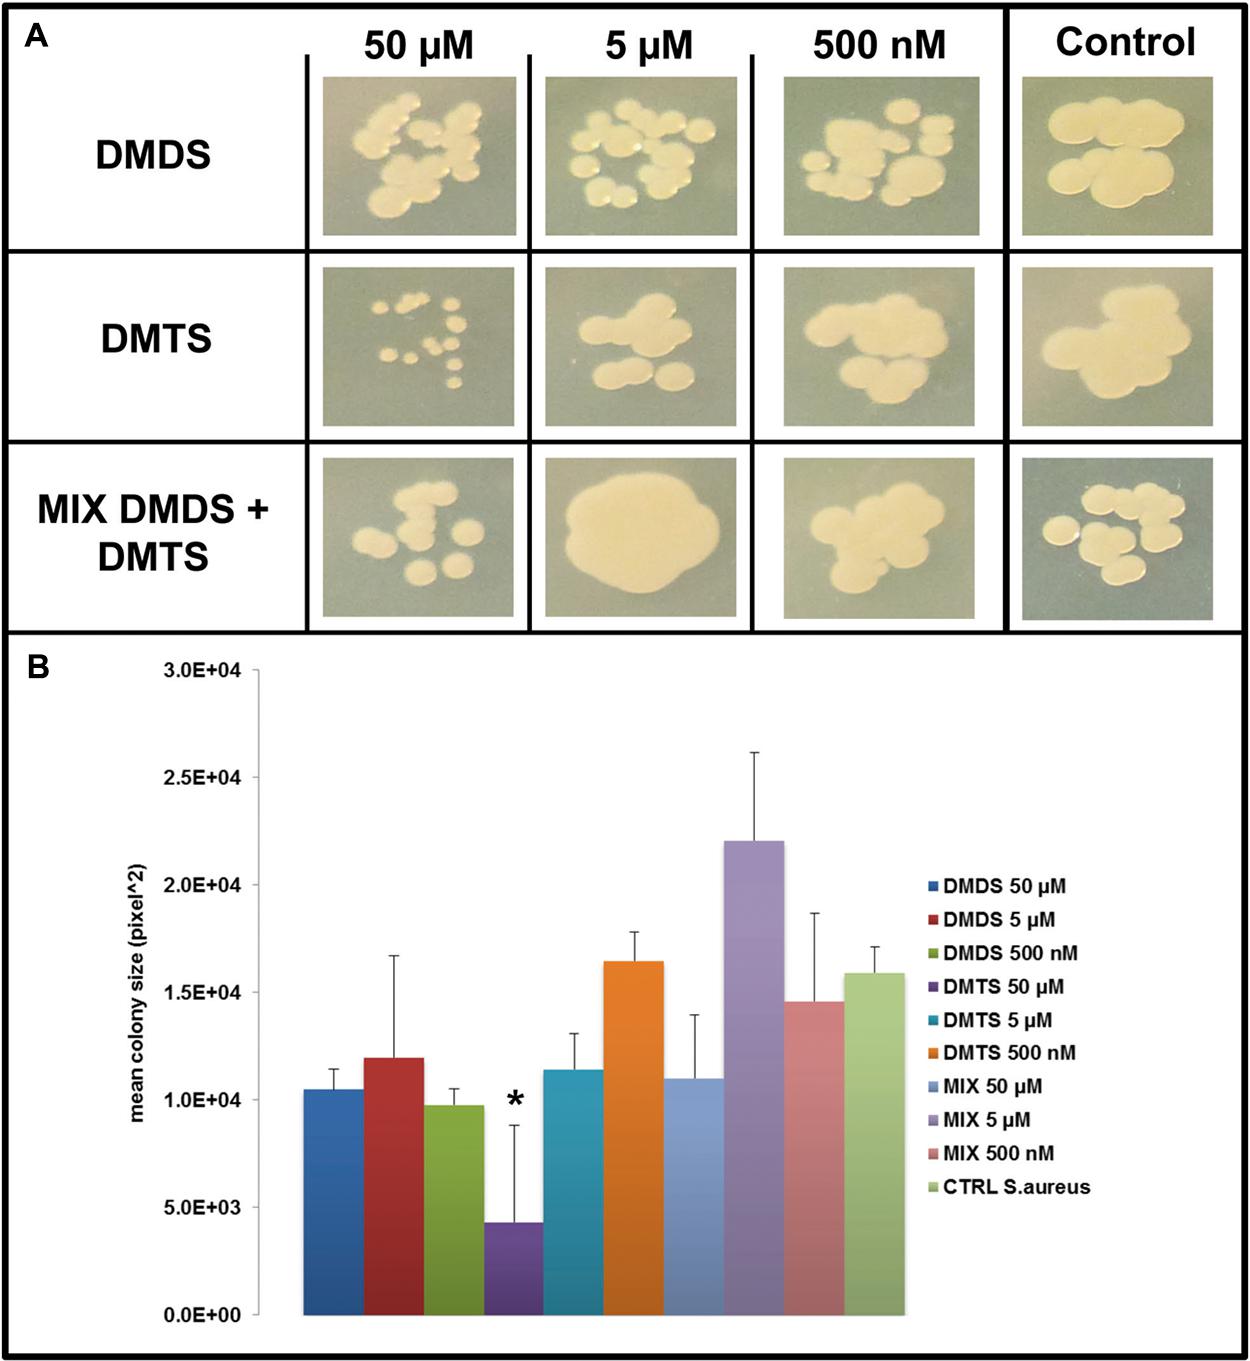
FIGURE 7. Effect of DMDS, DMTS, and the mixture of both volatile compounds (DMDS + DMTS). (A) Colony morphology and growth of S. aureus 533R4 after 4 days of incubation. The pure volatile compounds were applied in a concentration ranging from 500 nM to 50 μM. Control S. aureus 533R4 grown without exposure to the compounds. (B) Mean colony sizes of S. aureus 533R4 exposed to volatile compounds of DMDS, DMTS, and the mixture of both volatile compounds (DMDS + DMTS). Asterisk indicates significant differences between the treatments and the control (one-way ANOVA, post hoc Tukey test p < 0.05). Data represented are the mean of three replicates, error bars represent standard deviation of the mean.
Exposure to DMDS did not reveal any significant growth inhibiting or changes in colony morphology at all concentrations tested (500 nM, 5 and 50 μM). The mixture of DMDS and DMTS resulted in growth inhibition of S. marcescens P87 and E. coli WA321 at 50 μM concentration. However, the pigmentation in S. marcescens P87 was not affected by the mixture of these compounds. The two lowest applied concentrations 5 and 0.5 μM of DMTS and DMDS and the mixture of both compounds did not reveal any effect on colony morphology or growth of the tested bacteria (Figures 5–7).
Bacteria coexist with many different species in a heterogeneous and challenging soil environment (Gans et al., 2005). In this environment inter-specific interactions between microorganisms are ongoing and are a key factor for their spatial distribution (Keller and Surette, 2006). To cope with the competitive conditions, bacteria developed different survival strategies such as the production of secondary metabolites with inhibitory capacity (Hibbing et al., 2010; Cornforth and Foster, 2013). Most of the studies on bacterial secondary metabolites so far were focused on non-volatile compounds (Korpi et al., 1998; Foster and Bell, 2012). However, bacteria do also release complex blends of VOCs. Yet, the effect of inter-specific interactions on volatiles production and composition is still unknown (Garbeva et al., 2014a).
Here, we compared the volatile blends emitted by four phylogenetically different soil-bacteria either grown in monocultures or in pairwise combinations. Our results revealed that the blend of volatiles emitted during pairwise combinations differed from the volatile blends of the respective monocultures. Yet, the volatile blend of the mixtures mostly included volatiles compounds produced by monocultures, although some compounds produced by the monocultures were not detected in mixtures. For example dimethyl sulfoxide produced by Tsukamurella sp. AD106 was not detected in the mixture with Chryseobacterium sp. AD48. Another interesting example is indole which was produced by the monocultures of Chryseobacterium sp. AD48 but was not detected in the presence of Tsukamurella sp. AD106. Indole is a very well-studied compound and has been reported to be produced by about 85 different bacterial species including Chryseobacterium sp. (Yamaguchi and Yokoe, 2000; Lee and Lee, 2010). Indole and its derivatives [quinolones and (S)-3-hydroxytridecan-4-one] are involved in intercellular and multispecies signaling controlling diverse bacterial physiological properties like sporulation, plasmid stability, biofilm formation, drug resistance and virulence (Wang et al., 2001; Di Martino et al., 2003; Diggle et al., 2006; Nikaido et al., 2008; Lee et al., 2009; Lee and Lee, 2010). In addition, indole has been shown to have inhibitory activities on fungal growth (Aspergillus niger) and plant growth stimulating properties (Arabidopsis thaliana; Kamath and Vaidyanathan, 1990; Blom et al., 2011). In general indole is known to be a stable compound in the producing bacteria, however, many non-indole producing bacteria are able to modify and to degrade indole (Shimada et al., 2013; Lee et al., 2015). The fact that indole was not detected during the interaction of Chryseobacterium sp. AD48 with Tsukamurella sp. AD106 suggests that the production of such signaling compounds in nature depends strongly on the inter-specific interactions. Similar result was observed for the compound cyclopentene produced by the monocultures of Dyella sp. AD56 and Janthinobacterium sp. AD80 but not produced during the interaction of these two bacteria. With the volatolomic methods applied in this study we were able to detect 35 compounds from which 19 were tentatively identified. This discrepancy between numbers of detected and identified compounds shows that the identification of bacterial volatiles is yet a challenging and time demanding task, even with the use of sophisticated programs and software for metabolomics data analysis. Hence, the produced volatile blends are very complex and consist of a mixture of many unknown and difficult to identify compounds (Tait et al., 2014). Most of the VOCs that were tentatively identified within this study (∼58%) contained sulfur (e.g., methyl thiocyanate, DMDS, DMTS, dimethyl tetrasulfide, etc.). The high abundance of sulfur containing volatiles in this study can be related to the cultivation of the tested bacteria on 1/10th TSBA growth media. Several studies indicated that the composition of the volatile blend greatly depends on the growth media composition and the growth conditions (Schulz et al., 2004; Schulz and Dickschat, 2007; Blom et al., 2011; Garbeva et al., 2014b). The high amount of dimethyl di- and trisulfide detected in both monocultures and interactions indicate that these compounds are commonly produced. Many studies have shown that bacterial volatiles play a major role in soil fungistasis (Zou et al., 2007; Garbeva et al., 2011a, 2014b; van Agtmaal et al., 2015). Indeed our results revealed that the fungal and oomycete tested organism are sensitive to bacterial volatiles and were inhibited significantly by all monocultures and pairwise combinations. The observed fungal and oomycetal growth inhibition is most probably related to sulfur containing volatiles. Sulfur containing volatiles like dimethyl di- and trisulfide have been shown to effect fungi and are able to inhibit the growth of different plant pathogenic fungi (Kai et al., 2009; Li et al., 2010; Huang et al., 2012; Wang et al., 2013; Garbeva et al., 2014b; Kanchiswamy et al., 2015).
While many study tested the effect of bacterial volatiles on various fungi, little is known so far on the effect of bacterial volatiles on other bacteria. In this study E. coli WA321 was inhibited by the volatiles emitted by Chryseobacterium sp. AD48 and the mixture of Chryseobacterium sp. AD48 with Tsukamurella sp. AD106. The observed growth promotion of S. aureus 533R4 was caused by the volatiles emitted by Dyella sp. AD56. However, this growth promotion was not observed by the volatiles emitted during the interaction of Dyella sp. AD56 with Janthinobacterium sp. AD80 correlating with a shift in volatile blend composition. Interestingly volatiles emitted by the monocultures of Chryseobacterium sp. AD48 and the mixture of Dyella sp. AD56 with Janthinobacterium sp. AD80 induced changes in colony morphology of S. marcescens P87. Our previous high-throughput screening for production of non-volatile antimicrobial compounds revealed that all four bacteria used here, showed induced antibacterial activity during pairwise interactions as compared to monocultures (Tyc et al., 2014). This was not observed in the present study, as we didn’t observed novel produced volatile compounds during the pairwise interactions. Therefore, it’s questionable if volatiles solely play an important role as a competitive strategy between bacteria. However, it is possible that volatiles have synergistic or additive effect to other non-volatile antibacterial compounds (Schmidt et al., 2015). Many bacteria are known to emit inorganic volatiles like CO2, NH3, HCN, which also have biological activities and can have an additive effect (Effmert et al., 2012). However, such compounds were not detected in this study as significant volatile compounds.
Here, we tested two commonly produced bacterial volatile compounds for their effect on the target bacteria. The experiments with pure DMTS revealed strong growth inhibition on all tested bacterial model organisms, when applied in a concentration of 50 μM. Bacterial growth suppression was already reported for DMDS emitted by Pseudomonas strains against the crown-gall diseases causing Agrobacterium sp. (Dandurishvili et al., 2011; Popova et al., 2014). Dimethyl trisulfide effected colony morphology and pigmentation in S. marcescens P87 when applied in a concentration of 50 μM. Volatiles exposed colonies showed reduced growth and white coloration indicating the lack of prodigiosin production. It is plausible that this observation is related to the inhibition of quorum-sensing as previously reported by Morohoshi et al. (2007), Chernin et al. (2011). However, the effective concentration of 50 μM DMTS is most probably very high and far away from the concentrations in which those volatile compounds are produced in nature (Groenhagen et al., 2013) as we did not observed this effect in the experiments where S. marcescens P87 was exposed to the volatile blend produced by bacteria. The biological relevant concentration of volatile compounds remains to be determined in future studies.
This work revealed that inter-specific bacterial interactions affect volatile blend composition. This observed change is most probably related to the combination of volatile compounds produced by each isolate rather than triggering the production of novel volatiles as the volatile blend was composed of the mixture of the respective interacting bacteria. Furthermore, the loss of production of certain compounds during pairwise interaction suggests that the production of volatile signaling compounds (e.g. indole) in nature is influenced by inter-specific interactions. While fungi and oomycetes showed to be very sensitive to bacterial volatiles the effect of volatiles on bacteria varied greatly between no effects, growth inhibition to growth promotion depending on the volatile blend composition.
The authors declare that the research was conducted in the absence of any commercial or financial relationships that could be construed as a potential conflict of interest.
This work is supported by the BE-Basic Foundation (http://www.bebasic.org/). PG is financed by The Netherlands Organization for Scientific Research (NWO) VIDI personal grant 864.11.015. The authors want to thank Saskia Gerards for her great help during experimentation and Dr. Kees Hordijk for his help with GC/MS data analysis. This is publication 5957of the NIOO-KNAW.
The Supplementary Material for this article can be found online at: http://journal.frontiersin.org/article/10.3389/fmicb.2015.01412
Beshkova, D. M., Simova, E. D., Frengova, G. I., Simov, Z. I., and Dimitrov, Z. P. (2003). Production of volatile aroma compounds by kefir starter cultures. Int. Dairy J. 13, 529–535. doi: 10.1016/S0958-6946(03)00058-X
Bjurman, J. (1999). “Release of MVOCs from microorganisms,” in Organic Indoor Air Pollutants: Occurrence – Measurement – Evaluation, ed. T. Salthammer (Weinheim: Wiley-VCH Verlag GmbH), 259–273.
Blom, D., Fabbri, C., Connor, E. C., Schiestl, F. P., Klauser, D. R., Boller, T., et al. (2011). Production of plant growth modulating volatiles is widespread among rhizosphere bacteria and strongly depends on culture conditions. Environ. Microbiol. 13, 3047–3058. doi: 10.1111/j.1462-2920.2011.02582.x
Carter, G. T. (2014). NP/MS since 1970: from the basement to the bench top. Nat. Prod. Rep. 31, 711–717. doi: 10.1039/c3np70085b
Chernin, L., Toklikishvili, N., Ovadis, M., Kim, S., Ben-Ari, J., Khmel, I., et al. (2011). Quorum-sensing quenching by rhizobacterial volatiles. Environ. Microbiol. Rep. 3, 698–704. doi: 10.1111/j.1758-2229.2011.00284.x
Cleason, A. (2006). Volatile Organic Compounds from Microorganisms. Ph.D. thesis, Umeå University, Umeå.
Cornforth, D. M., and Foster, K. R. (2013). Competition sensing: the social side of bacterial stress responses. Nat. Rev. Microbiol. 11, 285–293. doi: 10.1038/Nrmicro2977
Dandurishvili, N., Toklikishvili, N., Ovadis, M., Eliashvili, P., Giorgobiani, N., Keshelava, R., et al. (2011). Broad-range antagonistic rhizobacteria Pseudomonas fluorescens and Serratia plymuthica suppress Agrobacterium crown gall tumours on tomato plants. J. Appl. Microbiol. 110, 341–352. doi: 10.1111/j.1365-2672.2010.04891.x
Deetae, P., Mounier, J., Bonnarme, P., Spinnler, H. E., Irlinger, F., and Helinck, S. (2009). Effects of Proteus vulgaris growth on the establishment of a cheese microbial community and on the production of volatile aroma compounds in a model cheese. J. Appl. Microbiol. 107, 1404–1413. doi: 10.1111/j.1365-2672.2009.04315.x
Di Martino, P., Fursy, R., Bret, L., Sundararaju, B., and Phillips, R. S. (2003). Indole can act as an extracellular signal to regulate biofilm formation of Escherichia coli and other indole-producing bacteria. Can. J. Microbiol. 49, 443–449. doi: 10.1139/w03-056
Diggle, S. P., Cornelis, P., Williams, P., and Cámara, M. (2006). 4-Quinolone signalling in Pseudomonas aeruginosa: old molecules, new perspectives. Int. J. Med. Microbiol. 296, 83–91. doi: 10.1016/j.ijmm.2006.01.038
Effmert, U., Kalderas, J., Warnke, R., and Piechulla, B. (2012). Volatile mediated interactions between bacteria and fungi in the soil. J. Chem. Ecol. 38, 665–703. doi: 10.1007/s10886-012-0135-5
Farag, M. A., Porzel, A., and Wessjohann, L. A. (2012). Comparative metabolite profiling and fingerprinting of medicinal licorice roots using a multiplex approach of GC-MS, LC-MS and 1D NMR techniques. Phytochemistry 76, 60–72. doi: 10.1016/j.phytochem.2011.12.010
Fiddaman, P. J., and Rossall, S. (1993). The production of antifungal volatiles by Bacillus subtilis. J. Appl. Bacteriol. 74, 119–126. doi: 10.1111/j.1365-2672.1993.tb03004.x
Foster, K. R., and Bell, T. (2012). Competition, not cooperation, dominates interactions among culturable microbial species. Curr. Biol. 22, 1845–1850. doi: 10.1016/j.cub.2012.08.005
Gans, J., Wolinsky, M., and Dunbar, J. (2005). Computational improvements reveal great bacterial diversity and high metal toxicity in soil. Science 309, 1387–1390. doi: 10.1126/science.1112665
Garbeva, P., and de Boer, W. (2009). Inter-specific interactions between carbon-limited soil bacteria affect behavior and gene expression. Microb. Ecol. 58, 36–46. doi: 10.1007/s00248-009-9502-3
Garbeva, P., Hol, W. H. G., Termorshuizen, A. J., Kowalchuk, G. A., and De Boer, W. (2011a). Fungistasis and general soil biostasis – a new synthesis. Soil Biol. Biochem. 43, 469–477. doi: 10.1016/j.soilbio.2010.11.020
Garbeva, P., Silby, M. W., Raaijmakers, J. M., Levy, S. B., and Boer, W. (2011b). Transcriptional and antagonistic responses of Pseudomonas fluorescens Pf0-1 to phylogenetically different bacterial competitors. ISME J. 5, 973–985. doi: 10.1038/ismej.2010.196
Garbeva, P., Hordijk, C., Gerards, S., and De Boer, W. (2014a). Volatile-mediated interactions between phylogenetically different soil bacteria. Front. Microbiol. 5:289. doi: 10.3389/fmicb.2014.00289
Garbeva, P., Hordijk, C., Gerards, S., and De Boer, W. (2014b). Volatiles produced by the mycophagous soil bacterium Collimonas. FEMS Microbiol. Ecol. 87, 639–649. doi: 10.1111/1574-6941.12252
Groenhagen, U., Baumgartner, R., Bailly, A., Gardiner, A., Eberl, L., Schulz, S., et al. (2013). Production of bioactive volatiles by different Burkholderia ambifaria strains. J. Chem. Ecol. 39, 892–906. doi: 10.1007/s10886-013-0315-y
Hibbing, M. E., Fuqua, C., Parsek, M. R., and Peterson, S. B. (2010). Bacterial competition: surviving and thriving in the microbial jungle. Nat. Rev. Microbiol. 8, 15–25. doi: 10.1038/nrmicro2259
Huang, C. J., Tsay, J. F., Chang, S. Y., Yang, H. P., Wu, W. S., and Chen, C. Y. (2012). Dimethyl disulfide is an induced systemic resistance elicitor produced by Bacillus cereus C1L. Pest Manag. Sci. 68, 1306–1310. doi: 10.1002/ps.3301
Insam, H., and Seewald, M. A. (2010). Volatile organic compounds (VOCs) in soils. Biol. Fertil. Soils 46, 199–213. doi: 10.1007/s00374-010-0442-3
Kai, M., Haustein, M., Molina, F., Petri, A., Scholz, B., and Piechulla, B. (2009). Bacterial volatiles and their action potential. Appl. Microbiol. Biotechnol. 81, 1001–1012. doi: 10.1007/s00253-008-1760-3
Kamath, A. V., and Vaidyanathan, C. S. (1990). New pathway for the biodegradation of indole in Aspergillus niger. Appl. Environ. Microbiol. 56, 275–280.
Kanchiswamy, C. N., Malnoy, M., and Maffei, M. E. (2015). Chemical diversity of microbial volatiles and their potential for plant growth and productivity. Front. Plant Sci. 6:151. doi: 10.3389/fpls.2015.00151
Katajamaa, M., Miettinen, J., and Oresic, M. (2006). MZmine: toolbox for processing and visualization of mass spectrometry based molecular profile data. Bioinformatics 22, 634–636. doi: 10.1093/bioinformatics/btk039
Keller, L., and Surette, M. G. (2006). Communication in bacteria: an ecological and evolutionary perspective. Nat. Rev. Microbiol. 4, 249–258. doi: 10.1038/nrmicro1383
Kim, K. S., Lee, S., and Ryu, C. M. (2013). Interspecific bacterial sensing through airborne signals modulates locomotion and drug resistance. Nat. Commun. 4, 1809. doi: 10.1038/ncomms2789
Korpi, A., Pasanen, A. L., and Pasanen, P. (1998). Volatile compounds originating from mixed microbial cultures on building materials under various humidity conditions. Appl. Environ. Microbiol. 64, 2914–2919.
Krings, U., and Berger, R. G. (1998). Biotechnological production of flavours and fragrances. Appl. Microbiol. Biotechnol. 49, 1–8. doi: 10.1007/s002530051129
Lee, J., Attila, C., Cirillo, S. L. G., Cirillo, J. D., and Wood, T. K. (2009). Indole and 7-hydroxyindole diminish Pseudomonas aeruginosa virulence. Microb. Biotechnol. 2, 75–90. doi: 10.1111/j.1751-7915.2008.00061.x
Lee, J. H., and Lee, J. (2010). Indole as an intercellular signal in microbial communities. FEMS Microbiol. Rev. 34, 426–444. doi: 10.1111/j.1574-6976.2009.00204.x
Lee, J.-H., Wood, T. K., and Lee, J. (2015). Roles of indole as an interspecies and interkingdom signaling molecule. Trends Microbiol. 23, 707–718. doi: 10.1016/j.tim.2015.08.001
Lemfack, M. C., Nickel, J., Dunkel, M., Preissner, R., and Piechulla, B. (2014). mVOC: a database of microbial volatiles. Nucleic Acids Res. 42, D744–D748. doi: 10.1093/nar/gkt1250
Li, Q., Ning, P., Zheng, L., Huang, J., Li, G., and Hsiang, T. (2010). Fumigant activity of volatiles of Streptomyces globisporus JK-1 against Penicillium italicum on Citrus microcarpa. Postharvest Biol. Technol. 58, 157–165. doi: 10.1016/j.postharvbio.2010.06.003
Meyer, S. A., and Schleifer, K. H. (1978). Deoxyribonucleic acid reassociation in the classification of coagulase-positive staphylococci. Arch. Microbiol. 117, 183–188. doi: 10.1007/BF00402306
Morohoshi, T., Shiono, T., Takidouchi, K., Kato, M., Kato, N., Kato, J., et al. (2007). Inhibition of quorum sensing in Serratia marcescens AS-1 by synthetic analogs of N-acylhomoserine lactone. Appl. Environ. Microbiol. 73, 6339–6344. doi: 10.1128/aem.00593-07
Nikaido, E., Yamaguchi, A., and Nishino, K. (2008). AcrAB multidrug efflux pump regulation in Salmonella enterica serovar typhimurium by RamA in response to environmental signals. J. Biol. Chem. 283, 24245–24253. doi: 10.1074/jbc.M804544200
Penuelas, J., Asensio, D., Tholl, D., Wenke, K., Rosenkranz, M., Piechulla, B., et al. (2014). Biogenic volatile emissions from the soil. Plant Cell Environ. 37, 1866–1891. doi: 10.1111/pce.12340
Pluskal, T., Castillo, S., Villar-Briones, A., and Oresic, M. (2010). MZmine 2: modular framework for processing, visualizing, and analyzing mass spectrometry-based molecular profile data. BMC Bioinformatics 11:395. doi: 10.1186/1471-2105-11-395
Popova, A. A., Koksharova, O. A., Lipasova, V. A., Zaitseva, J. V., Katkova-Zhukotskaya, O. A., Eremina, S. I., et al. (2014). Inhibitory and toxic effects of volatiles emitted by strains of Pseudomonas and Serratia on growth and survival of selected microorganisms, Caenorhabditis elegans, and Drosophila melanogaster. Biomed Res. Int. 2014, 1–11. doi: 10.1155/2014/125704
Romoli, R., Papaleo, M. C., De Pascale, D., Tutino, M. L., Michaud, L., Logiudice, A., et al. (2014). GC–MS volatolomic approach to study the antimicrobial activity of the antarctic bacterium Pseudoalteromonas sp. TB41. Metabolomics 10, 42–51. doi: 10.1007/s11306-013-0549-2
Ryu, C. M., Farag, M. A., Hu, C. H., Reddy, M. S., Kloepper, J. W., and Pare, P. W. (2004). Bacterial volatiles induce systemic resistance in Arabidopsis. Plant Physiol. 134, 1017–1026. doi: 10.1104/pp.103.026583
Ryu, C. M., Farag, M. A., Hu, C. H., Reddy, M. S., Wei, H. X., Pare, P. W., et al. (2003). Bacterial volatiles promote growth in Arabidopsis. Proc. Natl. Acad. Sci. U.S.A. 100, 4927–4932. doi: 10.1073/pnas.0730845100
Sambrook, J., and Russell, D. W. (2001). Molecular Cloning: A Laboratory Manual. New York, NY: Cold Spring Harbor Laboratory Press.
Schmidt, R., Cordovez, V., De Boer, W., Raaijmakers, J., and Garbeva, P. (2015). Volatile affairs in microbial interactions. ISME J. 9, 2329–2335. doi: 10.1038/ismej.2015.42
Schulz, S., and Dickschat, J. S. (2007). Bacterial volatiles: the smell of small organisms. Nat. Prod. Rep. 24, 814–842. doi: 10.1039/b507392h
Schulz, S., Fuhlendorff, J., and Reichenbach, H. (2004). Identification and synthesis of volatiles released by the myxobacterium Chondromyces crocatus. Tetrahedron 60, 3863–3872. doi: 10.1016/j.tet.2004.03.005
Schwab, W., Davidovich-Rikanati, R., and Lewinsohn, E. (2008). Biosynthesis of plant-derived flavor compounds. Plant J. 54, 712–732. doi: 10.1111/j.1365-313X.2008.03446.x
Shimada, Y., Kinoshita, M., Harada, K., Mizutani, M., Masahata, K., Kayama, H., et al. (2013). Commensal bacteria-dependent indole production enhances epithelial barrier function in the colon. PLoS ONE 8:e80604. doi: 10.1371/journal.pone.0080604
Tait, E., Perry, J. D., Stanforth, S. P., and Dean, J. R. (2014). Identification of volatile organic compounds produced by bacteria using HS-SPME-GC-MS. J. Chromatogr. Sci. 52, 363–373. doi: 10.1093/chromsci/bmt042
Traxler, M. F., Watrous, J. D., Alexandrov, T., Dorrestein, P. C., and Kolter, R. (2013). Interspecies interactions stimulate diversification of the Streptomyces coelicolor secreted metabolome. Mbio 4, e459-13. doi: 10.1128/mBio.00459-13
Tyc, O., Van Den Berg, M., Gerards, S., Van Veen, J. A., Raaijmakers, J. M., De Boer, W., et al. (2014). Impact of interspecific interactions on antimicrobial activity among soil bacteria. Front. Microbiol. 5:567. doi: 10.3389/fmicb.2014.00567
van Agtmaal, M., Van Os, G., Hol, G., Hundscheid, M., Runia, W., Hordijk, C., et al. (2015). Legacy effects of anaerobic soil disinfestation on soil bacterial community composition and production of pathogen-suppressing volatiles. Front. Microbiol. 6:701. doi: 10.3389/fmicb.2015.00701
Wang, C., Wang, Z., Qiao, X., Li, Z., Li, F., Chen, M., et al. (2013). Antifungal activity of volatile organic compounds from Streptomyces alboflavus TD-1. FEMS Microbiol. Lett. 341, 45–51. doi: 10.1111/1574-6968.12088
Wang, D. D., Ding, X. D., and Rather, P. N. (2001). Indole can act as an extracellular signal in Escherichia coli. J. Bacteriol. 183, 4210–4216. doi: 10.1128/Jb.183.14.4210-4216.2001
Wheatley, R. E. (2002). The consequences of volatile organic compound mediated bacterial and fungal interactions. Antonie Van Leeuwenhoek 81, 357–364. doi: 10.1023/A:1020592802234
Xia, J., Mandal, R., Sinelnikov, I. V., Broadhurst, D., and Wishart, D. S. (2012). MetaboAnalyst 2.0–a comprehensive server for metabolomic data analysis. Nucleic Acids Res. 40, W127–W133. doi: 10.1093/nar/gks374
Xia, J., Sinelnikov, I. V., Han, B., and Wishart, D. S. (2015). MetaboAnalyst 3.0-making metabolomics more meaningful. Nucleic Acids Res. 43, W251–W257. doi: 10.1093/nar/gkv380
Yamaguchi, S., and Yokoe, M. (2000). A novel protein-deamidating enzyme from Chryseobacterium proteolyticum sp nov., a newly isolated bacterium from soil. Appl. Environ. Microbiol. 66, 3337–3343. doi: 10.1128/Aem.66.8.3337-3343.2000
Keywords: volatolomics, soil bacteria, Chryseobacterium, Dyella, Janthinobacterium, Tsukamurella, inter-specific interactions, volatile activities
Citation: Tyc O, Zweers H, de Boer W and Garbeva P (2015) Volatiles in Inter-Specific Bacterial Interactions. Front. Microbiol. 6:1412. doi: 10.3389/fmicb.2015.01412
Received: 26 August 2015; Accepted: 27 November 2015;
Published: 18 December 2015.
Edited by:
Martin Heil, Centro de Investigación y de Estudios Avanzados del Instituto Politécnico Nacional, MexicoReviewed by:
Aurélien Bailly, University of Zurich, SwitzerlandCopyright © 2015 Tyc, Zweers, de Boer and Garbeva. This is an open-access article distributed under the terms of the Creative Commons Attribution License (CC BY). The use, distribution or reproduction in other forums is permitted, provided the original author(s) or licensor are credited and that the original publication in this journal is cited, in accordance with accepted academic practice. No use, distribution or reproduction is permitted which does not comply with these terms.
*Correspondence: Olaf Tyc, o.tyc@nioo.knaw.nl
Disclaimer: All claims expressed in this article are solely those of the authors and do not necessarily represent those of their affiliated organizations, or those of the publisher, the editors and the reviewers. Any product that may be evaluated in this article or claim that may be made by its manufacturer is not guaranteed or endorsed by the publisher.
Research integrity at Frontiers

Learn more about the work of our research integrity team to safeguard the quality of each article we publish.