- 1 Department of Systems Immunology, Helmholtz Centre for Infection Research, Braunschweig, Germany
- 2 Institute for Evolution and Biodiversity, Westfälische Wilhelms-Universität, Münster, Germany
- 3 Bio Center for Life Sciences, University of Technology Braunschweig, Braunschweig, Germany
Many chronic inflammatory diseases are known to be caused by persistent bacterial or viral infections. A well-studied example is the tick-borne infection by the gram-negative spirochaetes of the genus Borrelia in humans and other mammals, causing severe symptoms of chronic inflammation and subsequent tissue damage (Lyme Disease), particularly in large joints and the central nervous system, but also in the heart and other tissues of untreated patients. Although killed efficiently by human phagocytic cells in vitro, Borrelia exhibits a remarkably high infectivity in mice and men. In experimentally infected mice, the first immune response almost clears the infection. However, approximately 1 week post infection, the bacterial population recovers and reaches an even larger size before entering the chronic phase. We developed a mathematical model describing the bacterial growth and the immune response against Borrelia burgdorferi in the C3H mouse strain that has been established as an experimental model for Lyme disease. The peculiar dynamics of the infection exclude two possible mechanistic explanations for the regrowth of the almost cleared bacteria. Neither the hypothesis of bacterial dissemination to different tissues nor a limitation of phagocytic capacity were compatible with experiment. The mathematical model predicts that Borrelia recovers from the strong initial immune response by the regrowth of an immune-resistant sub-population of the bacteria. The chronic phase appears as an equilibration of bacterial growth and adaptive immunity. This result has major implications for the development of the chronic phase of Borrelia infections as well as on potential protective clinical interventions.
Introduction
Originally described in 1977 (Steere et al., 1977), Lyme disease is today recognized as the most common vector-borne disease in the United States and Europe, with approximately 65,000 cases reported annually in Europe (Rizzoli et al., 2011). Its causative agent, Borrelia burgdorferi and several closely related species commonly referred to as Borrelia burgdorferi sensu lato (sl), is transmitted by hard ticks of the genus Ixodes (Lane et al., 1991). Borrelia burgdorferi sl (BB) is spreading geographically (Hubalek, 2009), and the number of reported cases is increasing, although this is possibly partly due to increased diagnostic sensitivity.
BB belongs to the spirochaetes and shares characteristic traits of this group, including the spiral shape and a remarkable motility system enabling them to move efficiently through dense material like connective tissues (Tilly et al., 2008). Their natural reservoir are mainly small rodents, birds and reptiles that can harbor BB and transmit them to uninfected ticks feeding on these animals. The spirochaete is transmitted to humans mainly by Ixodes ricinus and, to a lesser extent, by I. persulcatus (Lane et al., 1991).
The disease symptoms in humans can be roughly divided into three infection stages. In most patients, the first noticeable symptom consists of a slowly growing, circle-shaped skin rash known as Erythema migrans (EM) around the tick bite appearing shortly after infection. This early, localized infection symptom is often accompanied by mild fever and flu-like symptoms.
Several days to weeks after infection, the bacteria begin to disseminate to different tissues, where they cause strong inflammatory reactions and tissue damage. Tissues commonly affected include the heart, joints and the central and peripheral nervous system as well as skin tissue where the pathogen can cause multiple EM lesions. In the U.S., approximately 60% of untreated patients develop an inflammation of the synovial tissue, particularly in the large joints, referred to as Lyme Arthritis (Steere and Glickstein, 2004). Among other possible routes of infection, e.g., along peripheral nerves, hematogenous dissemination of BB seems to occur frequently at least in patients in the USA (Rupprecht et al., 2008). This stage of the infection lasts up to 6 months.
If left untreated, symptoms can occur more than 6 month up to years after disease onset; in fact, some symptoms have been shown to persist for more than 10 years (Åsbrink and Hovmark, 2009; Stanek et al., 2011), presumably by persistent infection (Steere and Glickstein, 2004). At any of these stages, the disease can be treated by antibiotics with a high degree of success (Nau et al., 2009), although Lyme Arthritis fails to resolve in a minority of patients despite apparently effective antibiotic treatment, possibly due to an autoimmune reaction triggered by the infection (Steere et al., 2006). The different origins and exact nature of the chronic disease are, however, under debate (Feder et al., 2007).
When entering the mammalian host, BB is confronted first with a strong innate immune response. The first lines of defense include the attack of the spirochaetes by the complement system that opsonizes the spirochaetes and attracts, among other leukocytes, macrophages and neutrophils that have been shown to kill BB efficiently in vitro (Montgomery et al., 2002). When confronted with three times larger spirochaete concentrations in an in vitro assay, human polymorphonuclear cells and monocytes were both shown to ingest and kill the bacteria rapidly: after 60 min, 41–51% of the spirochaetes were phagocytized, and more than 50% of the ingested cells were dead within 30 min (Peterson et al., 1984). Additionally, mice and humans can produce antibodies against surface proteins of BB (Sadziene and Barbour, 1996).
The fact that despite the strong and effective early immune reaction, mammalian hosts frequently fail to clear the infection and that BB can often disseminate throughout the body remains striking. Even more surprising is the large population size that the bacteria reach at the infection site after an initial immune response has almost cleared the infection (see Table 1; Åsbrink and Hovmark, 2009). Given that dissemination of the bacteria has been shown as early as 2 days after experimental infection in mice (Barthold et al., 1991), active emigration from the infection site might aid the bacteria in escaping the host’s early immune response. Furthermore, BB has been shown to actively alter the expression of several outer surface proteins in reaction to immune responses of the host (de Silva and Fikrig, 1997; Hodzic et al., 2003).
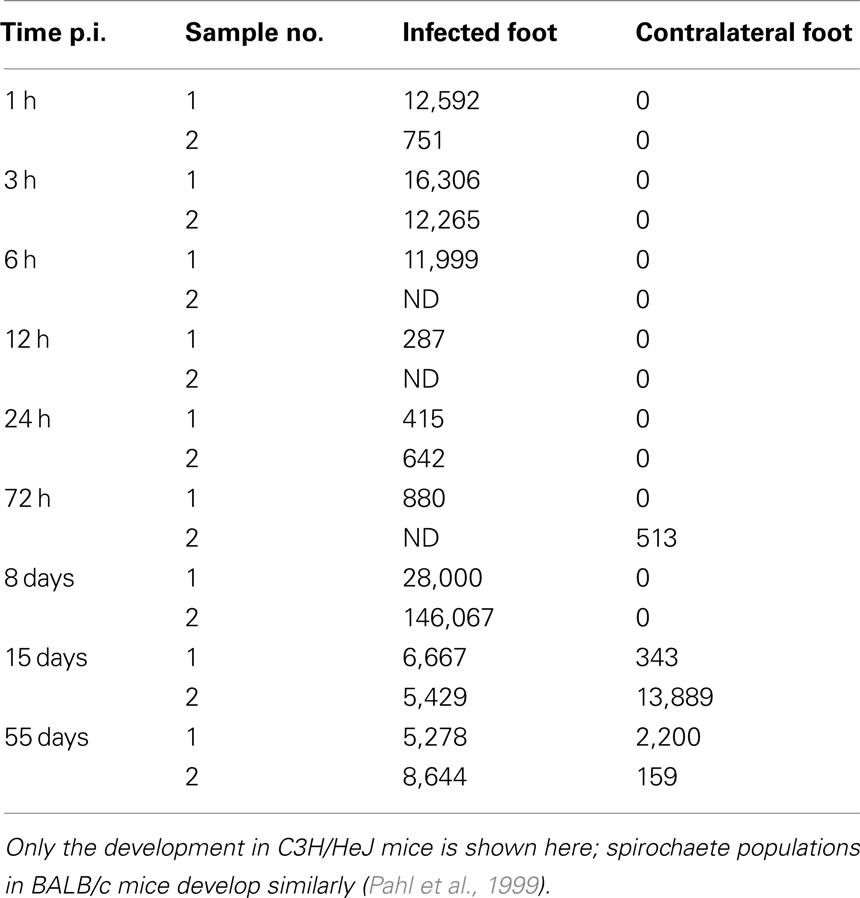
Table 1. Spirochaete counts per 106 mouse tissue cells as determined by qPCR (Pahl et al., 1999).
In this study, a deterministic model is developed to understand the interactions between BB and its mammalian host in the first stages of the infection. The model is used to elucidate how the bacteria evade the immune response, i.e., whether active emigration from the infection site, limited phagocytic capacity, or molecular adaptations of BB are critical for surviving the first line of defense by the innate immune response and to allow for a second growth phase reaching even higher bacterial loads. In this context, the importance of the adaptive immune system for controlling the infection is investigated.
Results
Our model is based on a study with mice infected experimentally with BB by Pahl et al. (1999). The spirochaete burden was measured using a quantitative polymerase chain reaction (qPCR) over the infection course. To analyze the kinetics of dissemination, two different mouse strains, disease-resistant BALB/c mice and susceptible C3H/HeJ mice were infected with BB and the spirochaete load was quantified at different tissues. Although the concentration of spirochaetes reached in these experiments differed between the two strains, the overall pattern was similar between the two strains. This modeling approach focuses on bacterial dynamics in C3H/HeJ mice, as they develop symptoms resembling Lyme disease in humans and are commonly used as a model organism for Lyme disease. Table 1 summarizes spirochaete counts per 106 mouse cells as measured by Pahl et al. Out of the six tissue sites analyzed experimentally, we consider the infection site at the hind foot and the corresponding tissue site at the contralateral hind foot that serves as a measure of disseminated infection.
The bacterial populations in C3H/HeJ mice show remarkable dynamics at the infection site: spirochaetes are present in high numbers at three and six hours post infection (p.i.), but the population diminishes drastically after 12 h and remains at low levels at the following days; however, 8 days p.i., the BB population not only recovers, but reaches very high concentrations far above the level measured shortly after infection. At the contralateral site, the bacterial population reaches its maximum later and without the high intermediate population size observed at the infection site. Although the bacterial populations in BALB/c mice reach only lower levels, the dynamics are qualitatively similar. These data can be interpreted as an immediate immune response that controls the early infection effectively, but for unknown reasons fails to clear the infection and is overwhelmed at later time points. In our mathematical model, we attempt to explain this failure to clear the infection by three different hypotheses: (1) the immune response might be effective at the infection site, but dissemination and later re-migration to the infection site could aid the spirochaetes in escaping from this immune response, (2) the immune response at the infection site could be effective only in the very first hours and bacteria might overcome it due to limitations of innate immune responses, and (3) molecular adaptations of BB might be necessary to evade the host’s immune response.
Hematogenous Migration of Bacteria
Our first model (depicted in Figure 1) attempts to explain the persistence of the bacteria at the infection site by migration of BB to different tissues. Hence, we consider two tissue sites potentially harboring spirochaetes and describe bacterial population dynamics and the immune response at each of these sites. The first tissue site described by this model is the infection site, i.e., the site at the hind foot where the mouse has been infected, the second one is a site at the contralateral hind foot. The bacteria live in the extracellular space where they can actively move through the extracellular matrix. Additionally, we also include bacterial dynamics in the blood as a third compartment connecting the two sites.
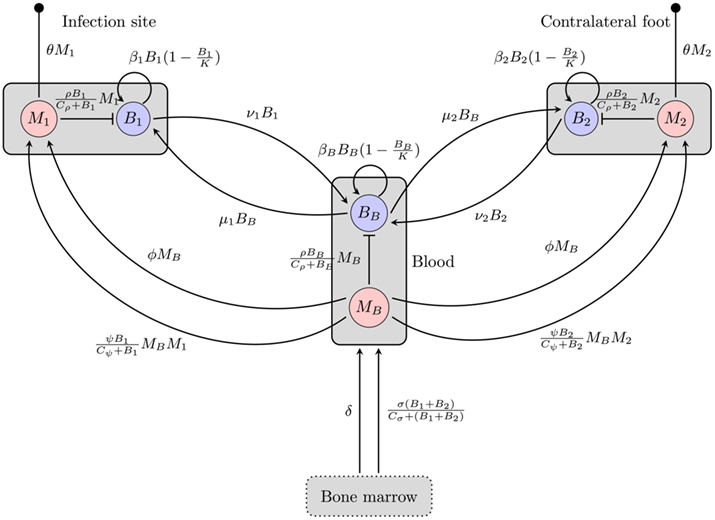
Figure 1. Overview of the BB infection dynamics model based on the hematogenous migration of the bacteria. Boxes represent different compartments of the organism, circles are the considered quantities, and arrows/bars depict a stimulating/inhibiting influence of one quantity on another. The small filled circles represent death of the phagocytes. B, M: bacteria and phagocyte populations in the respective compartments, μ, ν: migration rates between the blood compartment and the two tissue sites, β: bacterial replication rates, K: carrying capacity for bacteria, ρ: phagocytosis rate, Cρ: bacterial concentration with half-maximal phagocytosis rate, δ: physiological phagocyte production rate, σ: phagocyte production in response to infection, Cσ: bacterial concentration with half-maximal phagocyte production, ɸ: physiological phagocyte migration to tissue, ψ: phagocyte recruitment in response to infection, Cψ: bacterial concentration with half-maximal phagocyte recruitment, θ: phagocyte death rate.
In each of these three compartments, the spirochaetes replicate at a maximal growth rate β. They are assumed to grow according to a logistic growth model with a carrying capacity (per 106 mouse cells) K. Hence, the growth of a bacterial population Bi in each of the compartments can be formulated as

The maximal growth rate of BB in in vitro assays can be estimated at 0.06 h−1 (Barbour, 1983). The maximum bacterial concentration has been estimated at 1–4·108 BB cells per milliliter liquid medium in the same study; however, since spirochaete densities are given per 106 mouse cells and it is difficult to relate the in vitro result to the in vivo situation in the tissue, we take the maximal bacterial density measured in the experiments by Pahl et al. (1999), approximately 1–5·105 cells per 106 mouse cells, as the bacterial carrying capacity K.
In human patients, hematogenous migration of the bacteria is associated with disease symptoms and dissemination to tissues (Wormser et al., 2005). Whereas other routes of dissemination like the lymph system or direct migration within connective tissues cannot be excluded, their significance for the disseminated infection remains unclear. Hence, it is assumed that BB primarily disseminates hematogenously to the contralateral site and that bacteria can migrate from each of the tissues to the blood and vice versa. These migration rates, νi and μi are difficult to measure experimentally and thus have to be estimated.
Phagocytic cells are considered as an important early immune response. They are assumed to directly remove the bacteria. However, since the capacity of a single cell to kill bacteria is limited, we approximate phagocytosis of bacteria by a function saturable in Bi:

where ρ is the maximal rate of phagocytosis, Cρ is the bacterial number where phagocytosis reaches 50% of its maximum and Mi is the number of phagocytes in the compartment.
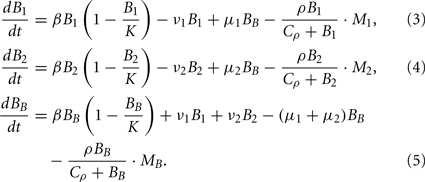
Bacterial dynamics for the populations at the infection site (B1), the contralateral hind foot (B2) and the blood (BB) are described by the ordinary differential equations
The dynamics of the mice’ phagocytic cells must not be neglected in this model. First, the production and death of phagocytic cells have to be considered. Furthermore, since phagocytic cells encountering BB produce strong inflammatory signals (Hirschfeld et al., 1999), they are assumed to recruit more phagocytic cells to the infected tissue site. Production of phagocytes by the bone marrow is assumed to occur at a constant rate δ. In addition to this, an infection-induced leukocyte production that depends on and is saturable with the bacterial load in the tissues, can be denoted as

with σ describing the maximal rate of BB-induced leukocyte production. Both processes are assumed to increase the number of leukocytes in the blood in our model.
Similarly, there is a physiological migration of leukocytes from the blood to the tissues (ɸ) and an additional infection-induced recruitment to the tissues (ψ):

Note that this recruitment also depends on the phagocytic cells already present in the tissue, because they are assumed to be the main producers of chemokines, attracting further leukocytes, and pro-inflammatory signals like TNF-α. The average lifetime of all phagocytes is assumed to be limited by a death rate θ in all three compartments.
The dynamics of phagocytic cell populations at the infection site M1, at the contralateral foot M2, and in the blood MB are described by the differential equations
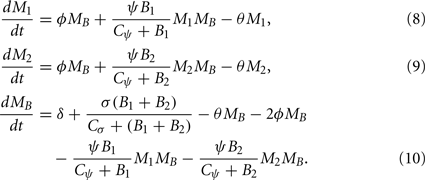
Figure 1 gives an overview of this model including both phagocytosis and bacterial dynamics at all three sites.
Although the host’s immune response to BB is limited by different mechanisms in this model and bacterial migration is included here, it fails to reproduce the bacterial dynamics observed at the infection site under biologically reasonable conditions. With this model, the immune control at the infection site can be overwhelmed due to bacterial migration after a good initial success in diminishing bacteria that leaves less than 20% of the initial bacterial population alive (Figure 2). In this simulation the bacterial load saturates on a high level. However, the intermediate peak of the number of bacteria as found in experiments could not be reproduced. The bacterial population always approaches the saturation level from below. Very high numbers of bacteria in the blood are required to achieve long-term persistence of bacteria at both sites, leading to a very high migration rate from the blood back into the tissue. Although BB can be cultured from the blood of many infected patients, this seems unlikely given that the blood was consistently culture-positive for BB only after day 10 p.i. in experimentally infected mice (Barthold et al., 1991). Within the concept of two sites and the blood compartment, no solution to this contradiction could be identified. The contradictions turned out to be a robust property of the model within physiologically relevant parameter values for bacterial replication and migration rates.
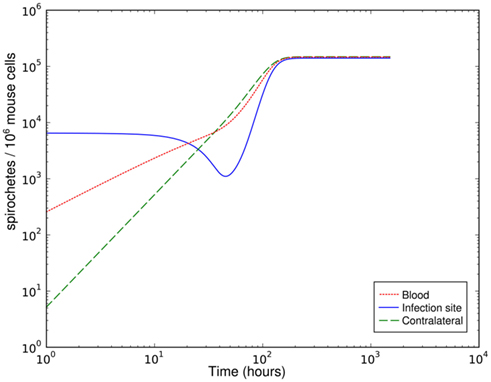
Figure 2. Simulation of spirochetal dynamics at the infection site, the contralateral hind foot and in the blood with a parameter set leading to an effective early immune response that is overwhelmed due to bacterial migration later.
Single-Site Model without Migration and Limited Phagocytic Capacity
Having dismissed bacterial migration as a likely reason for failure of early control at the infection site, an alternative explanation might be a limited killing capacity of the phagocytic cells: uptake of the bacteria might be faster than clearance, leading to fully occupied phagocytic cells that can take up no more bacteria. For this model, only the infection site was considered, because the timing of the infection rules out that the infection of the second infection site influences the immune control of the primary infection site. Early control of the infection at the infection site is crucial for the later outcome. If the site of the tick bite is excised during the first 48 h, dissemination of the bacteria is not observed (Shih et al., 1993). Hence, migration processes are ignored in this model. Figure 3 depicts an overview of this model.
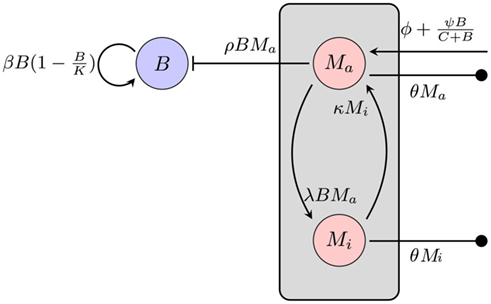
Figure 3. Model of the bacterial dynamics at the infection site with limited phagocytic capacity of the immune cells. The phagocyte population is subdivided into an active Ma and an inactive Mi compartment. B: bacterial population at the infection site, β: bacterial replication rate, K: carrying capacity, ρ: phagocytosis rate, ɸ: physiological phagocyte migration into infection site, ψ: phagocyte recruitment as infection response, C: bacterial concentration yielding half-maximal recruitment of phagocytes, θ: phagocyte death rate, λ: inactivation rate of phagocytes, κ: rate of re-activation of phagocytes.
The average natural death of the phagocytic cells is again described as a rate θ. To describe the limitation of bacterial uptake, the population of phagocytic cells is subdivided into two compartments, one population Ma being active and able to phagocytose bacteria and the other one, Mi, in a saturated, inactive state, unable to take up more bacteria. The transition to the inactive state is modeled proportional to the number of bacteria at the infection site at a rate λ. Inactive phagocytic cells are allowed to return to the active state at a rate κ.
Again, bacterial replication is assumed to follow a logistic growth model with the same parameters used in the previous approach. However, since a limitation of the phagocytic capacity is modeled explicitly here, the phagocytosis rate is modeled as simply being proportional to the number of phagocytes and bacteria in the compartment:

where Ma is the number of active phagocytes that are able to take up more bacteria. Hence, the bacterial dynamics can be described by the differential equation

Recruitment of leukocytes is also modeled similarly to the previous model. A low physiological, bacteria-independent migration ɸ into the infection site is combined with a bacteria-dependent log-sigmoidal recruitment

with M being the sum of all macrophages. The phagocyte dynamics in the model can be described by the differential equations

Adjustment of the ratio of the phagocytosis rate to the transition to the inactive state,  regulates the phagocytic capacity of the immune cells. Figure 3 gives an overview of this second model.
This much simpler model is able to explain the recovery of the bacterial population between day 3 and day 8 p.i. (Figure 4). However, it requires that the phagocytic cells are saturated quickly and return to the active state only very slowly – the phagocytes have to operate at the very limit of their uptake capability for several days. The clearance half-time of ingested BB is approximately 20 min (Montgomery and Malawista, 1996), making limited phagocytic capacity as an explanation for the failure to clear the early infection seem unlikely. In addition, as in the hematogenous migration model, with this model we could not identify any possibility to reproduce the measured second peak together with the second reduction of the bacterial load.
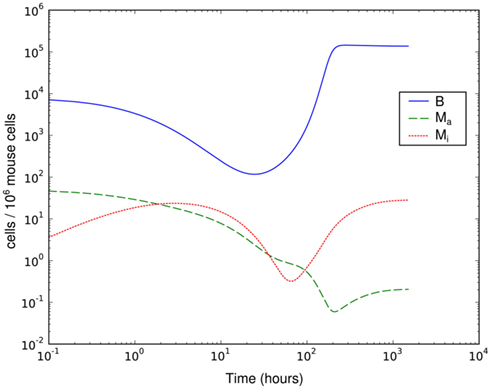
Figure 4. Simulation of spirochetal dynamics in an infection at a single-site. In this model, the phagocytic capacity of the phagocytes limits the immune reaction and prevents control of the infection. B: bacteria population, Ma: active phagocytes, Mi: inactive phagocytes.
Single-Site model with Bacterial Adaptation and Adaptive Immune Response
In a third model, it is hypothesized that molecular adaptation of the spirochaetes is critical for BB to survive the first days to weeks of the infection. It is known that BB alters the expression of several outer surface proteins in response to immune reactions of its host and employs a variety of different immune evasion strategies (Tsao, 2009).
Considering the different mechanisms to hide from the host’s immune mechanism and the critical role of the innate immune response early in BB infection, especially the fact that there are adaptations to the innate immune response, it seems necessary to include this in the mathematical model. However, the impact and exact nature of these molecular adaptations is far less understood. It is difficult to estimate to what extent a molecular adaptation protects the bacteria from an immune response. We approximate this task by assuming that there are two different varieties of BB: one is infecting the mouse and is susceptible to the innate immune response (Bt), the second is resistant and is not directly phagocytosed (Bm; Figure 5).
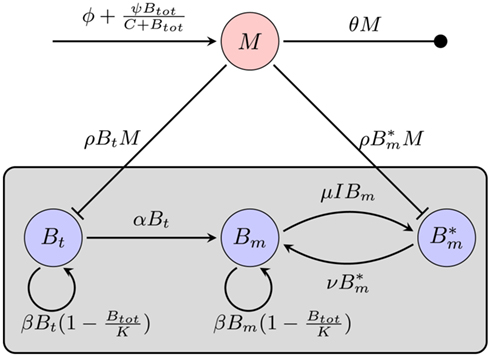
Figure 5. Model of the bacterial dynamics at the infection site with molecular adaptations of the pathogen and a simple representation of the adaptive immunity. Vulnerable BB Bt enter the infection site and adapt at a rate α to a state where they are not recognized by phagocytes anymore. These adapted bacteria (Bm) can be bound by antibody I (not shown), making them susceptible again. Bt: phagocytosis-susceptible bacteria, Bm: adapted bacteria,  : antibody-bound bacteria, beta: bacterial replication rate, K: carrying capacity, ρ: phagocytosis rate, ɸ: physiological phagocyte migration into infection site, ψ: phagocyte recruitment as infection response, C: bacterial concentration yielding half-maximal recruitment of phagocytes, θ: phagocyte death rate, α: bacterial adaptation rate (transition to resistant state), μ: antibody binding rate, ν antibody dissociation rate, I antibody concentration.
In this model, we focus again on a single infection site. Bacterial growth is described by a logistic growth model using the same parameters as in the previous models. However, there are now two different BB compartments. The first, Bt, has not seen the host environment in the mouse and is thus not adapted to the mammalian immune response. This population is susceptible to phagocytosis, but adapts to the host environment at a rate α, not being recognized by the phagocytes after this adaptation. The host environment is constantly present as a stimulus inducing the transition from the susceptible to the resistant state. This is reflected in the model by an irreversible transition to the robust state. The dynamics in the two different BB compartments can be described by the following differential equations:

Choosing α appropriately high, a complete transition from the susceptible to the robust state is achieved. However, with all bacteria now being resistant against the only immune response modeled so far, it is obvious that the infection cannot be controlled in this model. C3H mice develop antibody titers to BB as early as 7 days p.i. (Barthold et al., 1991). Opsonized bacteria can be seen as susceptible to phagocytosis again. We introduce a new quantity I into the model, reflecting the antibody concentration. As including antibody production and degradation is far beyond the scope of this model, we describe the antibody concentration simply as a time-dependent function reflecting the antibody titers measured in experimentally infected mice:

where Δtig represents the time when the antibody production starts, t1/2 denotes the time when the antibody concentration reaches its half-maximal value and Imax is the maximal antibody concentration reached. As this is a phenomenological description, parameters have to be estimated based on experimental data. The antibody production term is based on IgM titers measured by Barthold et al. (1991). Figure 6 shows the fit of the function I(t) to IgM titers against BB normalized to 1. The measured IgM titers, in contrast to our fit, show a decline at the last measurement >400 h. However, since IgG antibodies at that time started to show significant concentrations in the same studies, we do not consider this decline in our model, as these antibodies complement the IgM response. To capture the adaptive immune response at this time more accurately, the model would have to be extended to reflect the difference in diffusibility and efficacy of the different immune strategies as well as the adaptations of the bacteria to the presence of IgG antibody, which is beyond the scope of the present study.
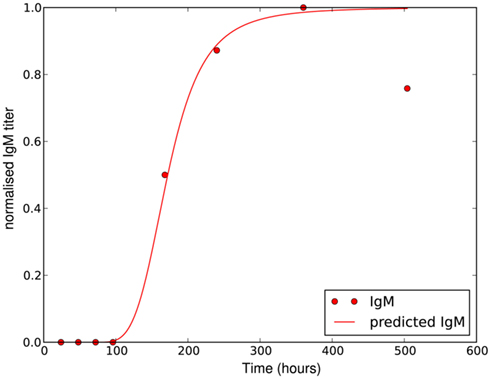
Figure 6. Experimentally measured IgM titers (Barthold et al., 1991), normalized to 1, and the corresponding function given by equation 18 with Imax = 1, Δtig = 72, t1/2 = 100 and n = 4.
The maximal antibody concentration in the tissue is difficult to estimate, as the concentration in the serum is most likely higher than in the tissue. However, since to our knowledge, the antibody concentration in the tissue has not been determined experimentally and also varies between different mice and pathogen strains, we take the IgM serum concentration measured by Wooten et al. (2002) 2 weeks p.i. as approximation of the antibody concentration in the tissue.
The antibody can now bind reversibly to the phagocytosis-resistant spirochaetes Bm, leading to a third, opsonized bacterial population  . Binding and dissociation of the antibody can be described by

where μ denotes the binding rate and ν the corresponding dissociation rate. Note that the antibody consumption by the binding process is ignored in this approach. Combining equations 17 and 19/20 and considering the antibody-bound bacteria  to be susceptible to phagocytosis, we can express the bacterial dynamics at the infection site as

Since we do not consider the limited phagocytic capacity to be critical for the survival of the pathogen, the distinction between active and saturated phagocytes is obsolete. Recruitment and death of phagocytes are modeled as before. The differential equation describing their dynamics is thus straightforward:

Numerical simulation of the system shows that the model is able to reproduce the experimental data (Figure 7A). The parameter set used for this simulation is shown in Table 2. The three individual sub-populations of BB show a quick transition from the initial, vulnerable state to the “phagocytosis-resistant” state (Figure 7B). Already 1 day p.i., most bacteria have adapted to the immune response in our model; 2 days p.i., the initial, vulnerable population is almost extinct. This fast adaptation is achieved by regulating the parameter α and seems reasonable given the fact that in vivo, already 2 days p.i. BB has completely downregulated the tick-stage specific ospA gene (Hodzic et al., 2002). Although the leukocyte recruitment is limited in the model, this limitation alone could not rescue the bacterial population, as relatively low phagocyte numbers in the beginning are sufficient to drastically reduce the bacterial population size (Figure 8).
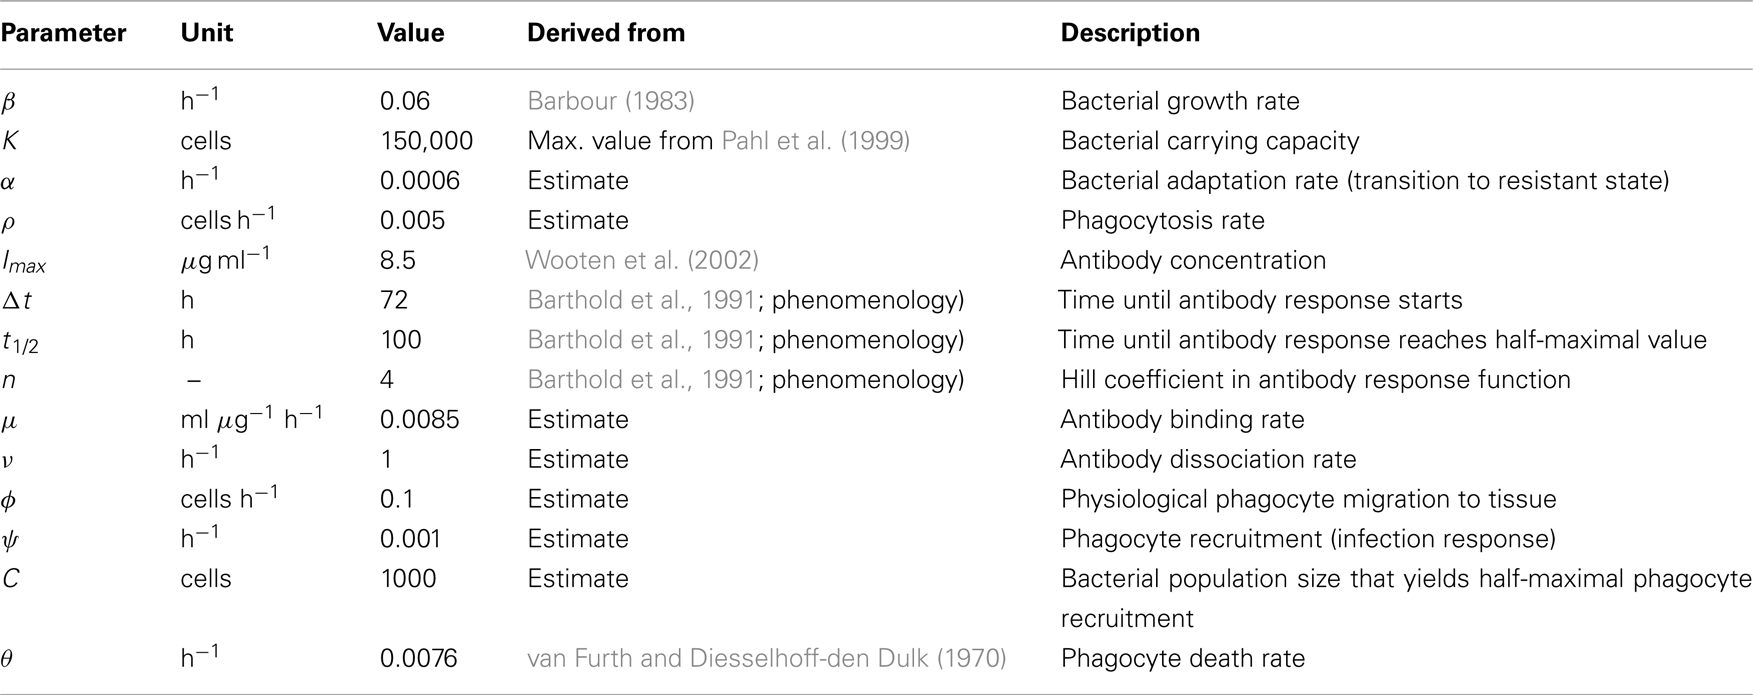
Table 2. Parameters used for the numerical simulations in Figure 7A.
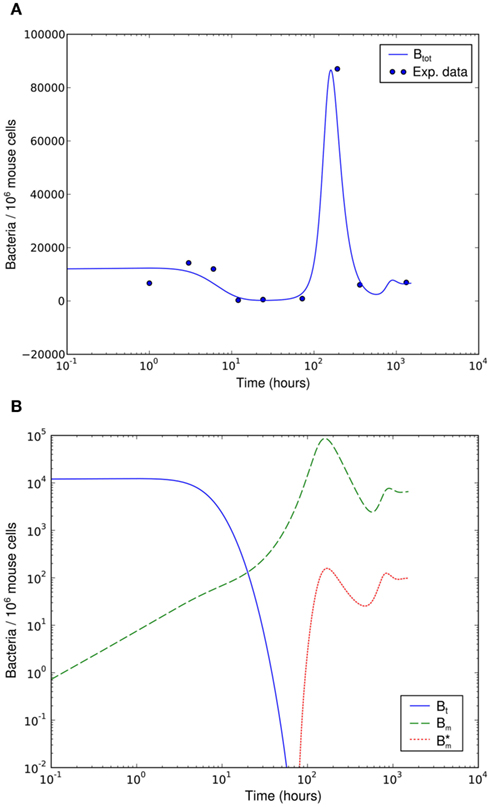
Figure 7. Numerical simulation of the BB infection model with adaptation of the spirochaetes and humoral immune response. (A) Total number of spirochaetes per 106 mouse cells in experiment (Pahl et al., 1999) and simulation. The parameters used are described in Table 2. The simulation result is shown as the sum of all three BB sub-populations. (B) Borrelia sub-populations. Bt is the initial, vulnerable BB population, Bm the adapted, resistant one, and  antibody-bound spirochaetes.
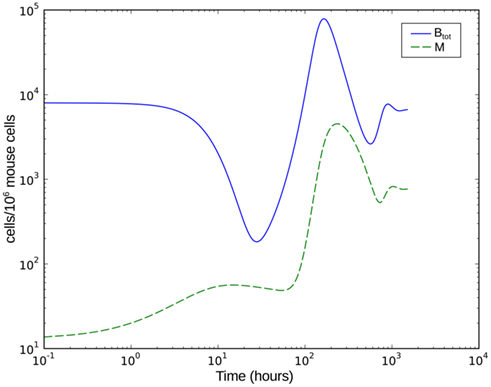
Figure 8. Numerical simulation of the BB infection model with adaptation of the spirochaetes and humoral immune response. Btot is the total bacterial population size, M the number of phagocytic cells.
Discussion
Our three modeling approaches presented here try to give three different explanations for the survival of BB in the first days of the immune response. All three models can explain this, but in the first two approaches, this is only possible in a narrow range of parameters that is biologically unlikely, e.g., with extremely high bacterial replication and migration rates or with a fast saturation of the phagocytes (i.e., low phagocytic capacity) and a slow digestion rate within the phagocytic cells. The high population size that the spirochaetes reach at the infection site after the infection was almost cleared is striking and can only be explained by the third model presented here, which includes bacterial adaptations to the immune response of the host.
The first model tries to explain the failure to clear the infection by spirochetal escape to other tissues in the body. The bacteria might escape to other tissues, replicate there and then migrate back to the blood and from there into the infection site. However, this process would have to be very fast to explain the dynamics measured at the infection site: to overcome the immune response, a high bacterial concentration in the blood is required. A large amount of bacteria has to migrate to the infection site to lead to a high concentration of bacteria that is in excess of the number of bacteria that can be digested by the phagocytes. Considering previous studies on experimentally infected mice of the same strain (Barthold et al., 1991), this seems unlikely. Blood samples of these mice were not consistently tested positive on BB before day 10 p.i., indicating that the average spirochaete load in the blood was probably not very high in the first days. This is confirmed by later results where culture-positive on BB were only found 2 weeks p.i. (Hodzic et al., 2003) and even at this time only in one out of five tested mice. One factor that contributes to this fact is that there is a strong dilution effect for the bacteria in the blood: the spatially limited tissue area can yield a high concentration of bacteria. A fraction of these bacteria now migrates through the endothelial barriers into the blood stream, where it is dispersed in a much larger volume. Furthermore, although bacteria can move in the extracellular space, migration through endothelial barriers is an active process involving bacterial movement through dense tissues and binding of host factors, likely resulting in a slow process. In contrast, at the infection site, the bacterial population recovers at earlier times from the innate immune response. It seems thus unlikely, that the recovery of the spirochetal populations from the initial immune response at the infection site results from the re-immigration of bacteria from the blood.
The second model neglects migration processes of the bacteria and tries to explain the failure of the immune response by a limited phagocytic capacity. Phagocytes might take up bacteria, but fail to digest them fast enough. The phagocytic cells would engulf many bacteria, but stop to phagocytose more due to physical restrictions, becoming inactive until the bacteria are digested. In our model, this is expressed by introducing a population of inactive phagocytic cells. However, we could not reproduce the dynamics measured at the infection site using this model. It is possible to achieve a recovery of the bacterial population in the model, but this requires a large fraction of the phagocytic cells to be in an inactive state. The short clearance time of BB in macrophages (Peterson et al., 1984) and the generally high capacity of phagocytic cells to engulf particles (Cannon and Swanson, 1992) makes this assumption unlikely from a biological point of view. In addition, the final reduction of the bacterial population at day 7 p.i. could not be reproduced by this model.
The third model does not rely on phagocytes reaching the limit of bacteria uptake. Instead, a very simple phagocytosis model is employed; phagocytosis is limited only by the amount of available phagocytic cells in this model which is determined by the recruitment of cells. There is solid evidence for a number of different adaptations of BB (Zhang and Norris, 1998; Hodzic et al., 2003; Grimm et al., 2004; Palmer et al., 2009; Tsao, 2009) to different factors of the host environment, including immune responses. A classical example of these adaptations is the reciprocal regulation of the surface proteins OspA and OspC. The former is a tick specific protein that is exclusively expressed when the spirochaete is in the tick’s midgut, but downregulated in the mammalian host environment. OspC is only expressed inside the mammalian host, and is crucial for dissemination and survival of the spirochaetes in the early stages. The downregulation of OspA has been shown to be suppressed in reaction to the host’s immune response, which is also true for other surface proteins (Hodzic et al., 2003). These adaptations are included in the third modeling approach.
It was assumed in this third model that BB becomes completely resistant against phagocytosis by immune cells. This is a strong assumption and the situation is probably different in vivo, as the bacteria are recognized and attacked via different pathways (Schröder et al., 2008). However, this simplification allows to estimate the influence of a molecular adaptation to a host response without making further assumptions about different innate immune processes that are not completely resolved. The transition of the whole population to the resistant state happens fast. But, surprisingly, the influence of the rate α on the speed of this transition is low. The transition is facilitated by removing bacteria susceptible to phagocytosis and by this allowing the resistant population to replicate faster within the limits imposed by the carrying capacity K for bacteria in the logistic growth function.
After the peak on day 8 p.i., the bacterial population decreases again. This coincides with an early IgM antibody response that may start to control the infection at this time. The antibody modeled in this approach binds to the spirochaetes and is assumed to make them susceptible to phagocytosis again. The affinity of these antibodies has not been investigated to our knowledge. Also, antibody responses to BB have different targets, making it difficult to determine the antibody affinity that is represented by the ratio of the dissociation and binding rates of the antibody  in our model.
As the dissociation constant widely determines the asymptotic bacterial load (Figure 9), these rates were estimated to fit the bacterial levels measured experimentally at 55 days p.i. The ratio  used in our simulations, corresponding to a dissociation constant KD = 1.3·10−7 M, can be considered to be in a realistic range of IgM affinities. For example, human IgM antibodies have been shown to bind to different human antigens with dissociation constants between 10−6 and 10−8 M (Diaw et al., 1997). The presented results are robust within this experimental range of dissociation constants. However, the resulting asymptotic bacterial load is quantitatively lifted up and down in dependence on its exact value (see Figure 9).
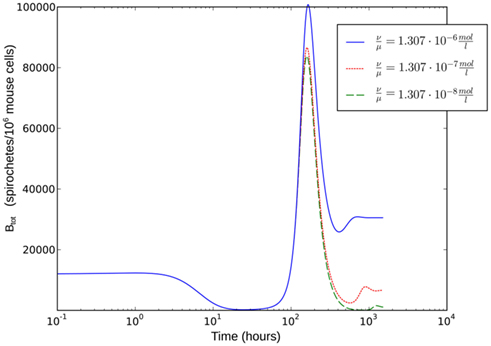
Figure 9. Single-site model with bacterial adaptation and adaptive immune reaction. Simulations were done with different values for  as shown in the figure.
To evaluate the robustness of this last model, single parameters like the phagocytosis rate ρ or reasonable combinations of parameters like  were varied. The fact that there is a population of bacteria in our model that is not attacked by the phagocytes at all before the IgM response is visible makes the overall behavior of the system robust to strong variations in different parameters; the parameters ρ and ψ can, however, change the behavior qualitatively, since setting them arbitrarily low leads to uncontrolled replication of the bacteria in the early stages of the infection. For the later development, the antibodies’ dissociation constant
  determines the bacterial population size in the late infection. This population size, however, cannot be interpreted as a real equilibrium, since the biological situation is more complicated due to different adaptive immune strategies, adaptations of the bacteria to these immune strategies and the presence of bacteria in immunoprivileged niches like the synoviae.
Our model is only intended to capture the first few weeks of the infection, specifically why the spirochaetes are not removed from the infection site. More sophisticated models of the specific immune response would be required to describe later stages and investigate the persistence of BB. For example, the IgG response that reaches its maximum significantly later would have to be included. Furthermore, for long-term persistence of the spirochaetes, the migration to different tissues might still be important even though the present analysis showed that its role is not important in the early stage of the infection. BB aligns with collagenic fibers in many tissues by binding to different host factors which might provide a protected niche for spirochetal survival (Steere and Glickstein, 2004; Rupprecht et al., 2008).
The model could also be extended to better describe the in vivo situation. Currently, the model is based on experimental data from experimentally infected mice, where both the effect of the tick environment before infection and the influence of the tick bite itself are missing, as the mice are infected intradermally with a syringe. In particular, immunosuppressive components of tick saliva can be expected to have an influence on the infection dynamics and control of the disease. Such effects are currently embedded into the phagocytosis rates without being explicit.
Our approach has shown that the representation of different mechanisms of bacteria-host-interaction in mathematical models allows to disentangle their relevance in different phases of a bacterial infection. In the case of BB, the measured dynamics of the bacterial load provides sufficient constraints to exclude specific mechanisms and to favor others. However, the relevance derived from the modeling is valid only in the early stage of the infection. Thus, this model for the BB infection dynamics can be used to simulate and optimize therapeutical approaches in the first days after infection.
Materials and Methods
Numerical simulations of the model were done using the LSODA solver for Ordinary Differential Equations implemented in the library deSolve for the R statistics language and in our own implementation of a fifth order Dormand-Prince method in C++.
Parameter values were derived from literature data where available and otherwise estimated in an iterative approach. First, the phagocytosis rate ρ, the phagocyte recruitment ψ and its half-maximal bacterial concentration, and the physiological phagocyte migration ɸ were approximated by fitting the decline of the total bacterial population size to the sharp initial decline measured experimentally for the first days. Second, the parameter α was adjusted to allow for recovery of the bacterial population according to measured data by a transition from the vulnerable to a resistant state of the bacteria. Setting α in this way also shows an adaptation of most of the bacterial population after the first 3 days p.i., reflecting the time frame in which reciprocal regulation of ospA and ospC as an example for molecular adaptations to a changed host environment can be found in vivo (Hodzic et al., 2003) and that is hence considered as a realistic time required for the majority of a bacterial population to adapt to a host’s immune response. For this second step, the experimental data up to the second peak in the bacterial population size were taken into account. In the last step, the binding affinity of the antibody,  was estimated to match the size that the bacterial population approaches at the end of the experimental measurements. The sum of squared errors was used as measure of discrepancy between data and predictions. When estimating parameters without prior knowledge about the exact values, parameters were set to physiologically reasonable values and the parameter space was scanned within a maximum of biologically plausible range; e.g., for the antibody dissociation constant,
  published values lie within 10−8 to 10−6 M, so
  was varied from 10−9 to 10−5 M and the fit optimized within this range. The parameters used for our final model are given in Table 2 and explained in the text.
Conflict of Interest Statement
The authors declare that the research was conducted in the absence of any commercial or financial relationships that could be construed as a potential conflict of interest.
Acknowledgments
Michael Meyer-Hermann was supported by HFSP and BMBF within the GerontoSys initiative (projects GerontoMitoSys and GerontoShield). Sebastian Binder was supported by the Helmholtz International Graduate School for Infection Research. This research was supported by a fellowship of the Volkswagen Foundation awarded to Arndt Telschow.
References
Åsbrink, E., and Hovmark, A. (2009). Successful cultivation of spirochetes from skin lesions of patients with erythema chronicum migrans Afzelius and acrodermatitis chronica atrophicans. Acta Pathol. Microbiol. Immunol. Scand. B 93B, 161–163.
Barbour, A. G. (1983). Isolation and cultivation of Lyme disease spirochetes. Yale J. Biol. Med. 57, 521–525.
Barthold, S. W., Persing, D. H., Armstrong, A. L., and Peeples, R. A. (1991). Kinetics of Borrelia burgdorferi dissemination and evolution of disease after intradermal inoculation of mice. Am. J. Pathol. 139, 263–273.
Cannon, G. J., and Swanson, J. A. (1992). The macrophage capacity for phagocytosis. J. Cell. Sci. 101 (Pt 4), 907–913.
de Silva, A. M., and Fikrig, E. (1997). Arthropod- and host-specific gene expression by Borrelia burgdorferi. J. Clin. Invest. 99, 377–379.
Diaw, L., Magnac, C., Pritsch, O., Buckle, M., Alzari, P. M., and Dighiero, G. (1997). Structural and affinity studies of IgM polyreactive natural autoantibodies. J. Immunol. 158, 968.
Feder, H. M., Johnson, B. J. B., O’Connell, S., Shapiro, E. D., Steere, A. C., and Wormser, G. P. (2007). A critical appraisal of “chronic Lyme disease.” N. Engl. J. Med. 357, 1422–30.
Grimm, D., Tilly, K., Byram, R., Stewart, P. E., Krum, J. G., Bueschel, D. M., Schwan, T. G., Policastro, P. F., Elias, A. F., and Rosa, P. A. (2004). Outer-surface protein C of the Lyme disease spirochete: a protein induced in ticks for infection of mammals. Proc. Natl. Acad. Sci. U.S.A. 101, 3142–3147.
Hirschfeld, M., Kirschning, C. J., Schwandner, R., Wesche, H., Weis, J. H., Wooten, R. M., and Weis, J. J. (1999). Cutting edge: inflammatory signaling by Borrelia burgdorferi lipoproteins is mediated by toll-like receptor 2. J. Immunol. 163, 2382–2386.
Hodzic, E., Feng, S., Freet, K., Borjesson, D., and Barthold, S. (2002). Borrelia burgdorferi population kinetics and selected gene expression at the host-vector interface. Infect. Immun. 70, 3382.
Hodzic, E., Feng, S., Freet, K. J., and Barthold, S. W. (2003). Borrelia burgdorferi population dynamics and prototype gene expression during infection of immunocompetent and immunodeficient mice. Infect. Immun. 71, 5042–5055.
Lane, R., Piesman, J., and Burgdorfer, W. (1991). Lyme borreliosis: relation of its causative agent to its vectors and hosts in North America and Europe. Annu. Rev. Entomol. 36, 587–609.
Montgomery, R. R., Lusitani, D., de Boisfleury Chevance, A., and Malawista, S. E. (2002). Human phagocytic cells in the early innate immune response to Borrelia burgdorferi. J. Infect. Dis. 185, 1773–1779.
Montgomery, R. R., and Malawista, S. E. (1996). Entry of Borrelia burgdorferi into macrophages is end-on and leads to degradation in lysosomes. Infect. Immun. 64, 2867–2872.
Nau, R., Christen, H.-J., and Eiffert, H. (2009). Lyme disease – current state of knowledge. Dtsch. Arztebl. Int. 106, 72–81; quiz 82, I.
Pahl, A., Kuehlbrandt, U., Brune, K., Roellinghoff, M., and Gessner, A. (1999). Quantitative detection of Borrelia burgdorferi by real-time PCR. J. Clin. Microbiol. 37, 1958–1963.
Palmer, G. H., Bankhead, T., and Lukehart, S. A. (2009). “Nothing is permanent but change” – antigenic variation in persistent bacterial pathogens. Cell. Microbiol. 11, 1697–1705.
Peterson, P. K., Clawson, C. C., Lee, D. A., Garlich, D. J., Quie, P. G., and Johnson, R. C. (1984). Human phagocyte interactions with the Lyme disease spirochete. Infect. Immun. 46, 608–611.
Rizzoli, A., Hauffe, H., Carpi, G., Vourc’h, G., Neteler, M., and Rosa, R. (2011). Lyme borreliosis in Europe. Euro Surveill. 16, 1–8.
Rupprecht, T. A., Koedel, U., Fingerle, V., and Pfister, H.-W. (2008). The pathogenesis of Lyme neuroborreliosis: from infection to inflammation. Mol. Med. 14, 205–212.
Sadziene, A., and Barbour, A. (1996). Experimental immunization against Lyme borreliosis with recombinant Osp proteins: an overview. Infection 24, 195–202.
Schröder, N. W. J., Eckert, J., Stübs, G., and Schumann, R. R. (2008). Immune responses induced by spirochetal outer membrane lipoproteins and glycolipids. Immunobiology 213, 329–340.
Shih, C.-M., Telford, S. R., Pollack, R. J., and Spielman, A. (1993). Rapid dissemination by the agent of Lyme disease in hosts that permit fulminating infection. Infect. Immun. 61, 2396–2399.
Stanek, G., Fingerle, V., Hunfeld, K.-P., Jaulhac, B., Kaiser, R., Krause, A., Kristoferitsch, W., O’Connell, S., Ornstein, K., Strle, F., and Gray, J. (2011). Lyme borreliosis: clinical case definitions for diagnosis and management in Europe. Clin. Microbiol. Infect. 17, 69–79.
Steere, A. C., and Glickstein, L. (2004). Elucidation of Lyme arthritis. Nat. Rev. Immunol. 4, 143–152.
Steere, A. C., Klitz, W., Drouin, E. E., Falk, B. A., Kwok, W. W., Nepom, G. T., and Baxter-Lowe, L. A. (2006). Antibiotic-refractory Lyme arthritis is associated with HLA-DR molecules that bind a Borrelia burgdorferi peptide. J. Exp. Med. 203, 961–971.
Steere, A. C., Malawista, S. E., Snydman, D. R., Shope, R. E., Andiman, W. A., Ross, M. R., and Steele, F. M. (1977). An epidemic of oligoarticular arthritis in children and adults in three Connecticut communities. Arthritis Rheum. 20, 7–17.
Tilly, K., Rosa, P. A., and Stewart, P. E. (2008). Biology of infection with Borrelia burgdorferi. Infect. Dis. Clin. North Am. 22, 217–234.
Tsao, J. I. (2009). Reviewing molecular adaptations of Lyme borreliosis spirochetes in the context of reproductive fitness in natural transmission cycles. Vet. Res. 40, 36.
van Furth, R., and Diesselhoff-den Dulk, M. (1970). The kinetics of promonocytes and monocytes in the bone marrow. J. Exp. Med. 132, 813.
Wooten, R. M., Ma, Y., Yoder, R. A., Brown, J. P., Weis, J. H., Zachary, J. F., Kirschning, C. J., and Weis, J. J. (2002). Toll-like receptor 2 is required for innate, but not acquired, host defense to Borrelia burgdorferi. J. Immunol. 168, 348–355.
Wormser, G., McKenna, D., Carlin, J., Nadelman, R., Cavaliere, L., Holmgren, D., Byrne, D., and Nowakowski, J. (2005). Brief communication: hematogenous dissemination in early Lyme disease. Ann. Intern. Med. 142, 751–755.
Keywords: Borrelia burgdorferi, Lyme disease, mathematical model, immunology, macrophages, mouse model
Citation: Binder SC, Telschow A and Meyer-Hermann M (2012) Population dynamics of Borrelia burgdorferi in Lyme disease. Front. Microbio. 3:104. doi: 10.3389/fmicb.2012.00104
Received: 14 December 2011; Accepted: 01 March 2012;
Published online: 22 March 2012.
Edited by:
Marc Thilo Figge, Leibniz-Institute for Natural Product Research and Infection Biology – Hans-Knoell-Institute, GermanyReviewed by:
Franziska Mech, Leibniz-Institute for Natural Product Research and Infection Biology – Hans-Knoell-Institute, GermanyUte Neugebauer, Institute of Photonic Technology, Germany
Copyright: © 2012 Binder, Telschow and Meyer-Hermann. This is an open-access article distributed under the terms of the Creative Commons Attribution Non Commercial License, which permits non-commercial use, distribution, and reproduction in other forums, provided the original authors and source are credited.
*Correspondence: Michael Meyer-Hermann, Department of Systems Immunology, Helmholtz Centre for Infection Research, Inhoffenstr. 7, 38124 Braunschweig, Germany. e-mail:bWljaGFlbC5tZXllci1oZXJtYW5uQGhlbG1ob2x0ei1oemkuZGU=

