 Azat Samigullin
 Per M. Humpert
 Elin Östman
- 1starScience GmbH, Heidelberg, Germany
- 2Stoffwechselzentrum Rhein Pfalz, Mannheim, Germany
- 3Department of Internal Medicine, Endocrinology and Diabetes, Heidelberg University Hospital, Heidelberg, Germany
- 4Aventure AB, Lund, Sweden
This pilot study aimed to evaluate a continuous glucose monitoring (CGM) based approach to study the effects of a functional drink containing specific amino acids and chromium picolinate (FD) and a combination of FD with a juice (FDJ) on postprandial glucose in a close to real life setting. The predefined primary endpoint for this study was the 120-min incremental area under the glucose curve (iAUC0−120min) after meals. It was estimated that using CGM and repeated meals in 6 participants could be sufficient to match the power of the previous study in regards to the quantity of meals. Participants followed a pre-specified meal schedule over 9 days and consumed the drinks three times daily with main meals. Differences between drinks were analyzed by analysis of covariances (ANCOVA) with subject number and activity as random factors and nutrient composition as covariates. In 156 meals available for analysis, a significant 34% reduction of glucose iAUC0−120min was shown for FDJ (p < 0.001). FD did not show a significant effect on its own, but a significant reduction of 17.6% (p = 0.007) was shown in pooled data for FD and FDJ. While the differences between the two functional drinks used were not the primary focus of this study, it was sufficiently powered to detect previously described effects in 60 participants in a cross-over design under laboratory settings. The design presented defines a novel and cost-effective approach using CGM devices and app-based lifestyle tracking for studying nutritional effects on glucose at home in a close to real-life setting.
Introduction
High glucose levels measured in a standardized oral glucose tolerance test are established, independent risk factors for type 2 diabetes (T2D), cardiovascular events and increased mortality, even below the diabetic and prediabetic thresholds (1–8). Pharmacological interventions targeting postprandial glycemia have been shown to be efficacious in preventing T2D, cardiovascular events and reducing mortality (9–11). Furthermore, health benefits of a general reduction of postprandial glucose and low glycemic index (GI) diets have been shown in association studies (12–17) and are backed up by experimental data looking at possible underlying mechanisms (18–21). Incremental area under the curve (iAUC0−120min) is an established measure for assessing the glycemic response in meal studies and for evaluating the GI of foods (22, 23).
In a previous double-blinded study it was shown that FD, flavored water containing the free amino acids leucine, isoleucine, valine, lysine and threonine, as well as chromium picolinate, was able to reduce the postprandial response (iAUC) to a carbohydrate-rich meal by 24% (24). These results were obtained in healthy, overweight individuals in a meal experiment under controlled laboratory settings (24). Being the gold standard for the assessment of postprandial glycemic response to different foods, meal studies require trained staff, are costly and have to be performed under standardized laboratory conditions (23). Results obtained in these tests may differ substantially from real-life conditions, as pre- and post-study glucose excursions and participant behavior are usually not documented.
Contemporary CGM devices are easily applied and worn by individuals over multiple days. The sensor is placed under the skin and measures subcutaneous glucose in contrast to venous or capillary glucose measured by patient devices, bedside devices or in the laboratory (25). The CGM devices have become widely available in recent years and the subcutaneous measurements have been shown to correlate well with both blood glucose in patients with diabetes (type 1 and 2) (26, 27), as well as in healthy individuals (7). They are easy to use and measure glucose in much shorter intervals than would be feasible to do with other devices. The precision of these devices differs from model to model (25), but is in general similar to that of point-of-care glucometers (28).
The main aim of this pilot study was to evaluate and confirm the effect of FD on glucose homeostasis in a novel real-life study design and with repeated intakes. An additional aim was to test the feasibility of our study design to be applied in future real-life trials defining the effect of different food products on glucose homeostasis in defined populations.
Method
Study design
The pilot study was performed at Aventure AB, Lund, Sweden. Participants attended the study facilities for one screening visit and one visit to sign informed consent, pick up food and the CGM device (Dexcom G6, San Diego, CA, United States), and receive all further instructions. The rest of the study was performed in the participants' homes.
Ethics
This trial was approved by the Swedish Ethical Review Authority (Drn 2021–01438) on March 31, 2021 and registered at clinicaltrials.gov as NCT04848233. The authors confirm that all ongoing and related trials for this intervention are registered. It was conducted in accordance with the ethical principles that have their origins in the Declaration of Helsinki and its subsequent amendments. Written informed consent was obtained from all participants. The investigational products were produced in Sweden.
Participants
Participants were recruited through advertising to staff at Aventure AB and other companies in the same office building. In addition, advertisement was posted once in social media. The participant profile has been defined according to findings in data from previous studies (29). Participants were required to be 40–65 years of age, have a BMI of 25.0–29.9 kg/m2, HOMA-IR <2.5, and fasting blood glucose <6.1 mmol/L. In addition, the participants should have been weight stable for the last 3 months and have access to an iPhone with Bluetooth 4.0 and iOS13 or newer.
Test products and placebo
Three drinks were included in the study. The first investigational product, FD, was a commercially produced drink in form of a lightly carbonated water with a proprietary blend “molar ratios presented in (30)” of 2.6 g free amino acids (L-Leucine, L-Threonine, L-Lysine Monohydrochloride, L-Isoleucine and L-Valine, 5AA) as well as 250 mcg chromium picolinate (CrPic) (Good Idea®, Double Good AB, Lund, Sweden). Besides water and the active ingredients, the test product also contained natural lingonberry flavor. The placebo product was identical to the test product with respect to all ingredients, but 5AA and CrPic. A second investigational product, FDJ, was also included and besides its identical content of 5AA and CrPic, it also contained fruit juice concentrates from black currant, cranberry and apple. Both investigational products and placebo were filled in identically appearing PET-bottles and two of them (FD and placebo) matched regarding taste, texture and by being colorless. The FDJ drinks were packaged in identical bottles but had a dark red color and fruity flavor.
Screening process
Eligibility of interested participants with respect to age, BMI and medications was reviewed at the initial contact over phone or e-mail. Those matching the criteria were invited to a screening visit. After an overnight fast of 12 h, the participants reported to the study facility in the morning of the screening visit. A nurse went through the inclusion criteria and collected information about medication, allergies, potential weight changes and family history of diabetes. Next, the height, waist circumference, weight and body composition (Tanita BC-418MA) were measured, and a capillary blood sample was taken to check fasting blood glucose (HemoCue Glucose 201 system, HemoCue, Ängelholm, Sweden). If all inclusion criteria were met, a venous blood sample was drawn from the antecubital vein for analysis (ECLIA) of serum insulin (Laboratoriekemi, Malmö University hospital, Malmö, Sweden). HOMA-IR of each participant was calculated and those still meeting the inclusion criteria were included in the study.
Intervention
The duration of the intervention was 10 days, corresponding with the lifespan of the CGM sensor. The participants applied the sensor themselves in the morning of day 0 and had no special instructions for the rest of that day, other than making sure their glucose data was registered in the app (Nutrisense.io, IL, United States). The meal and drink schedule for all study days is shown in Table 1. The participants were asked to not eat or drink anything within 120 min of each main meal and to remain fasting from 9 pm every evening. Participants were instructed to record exact mealtimes as well as any additional snacks and drinks. Furthermore, they were instructed to keep their level of exercise and amount of sleep constant. No alcohol intake was allowed during the study. Nutrient content of meals and drinks are presented in Table 2.
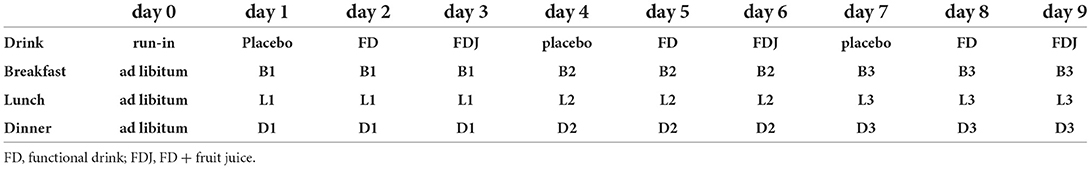
Table 1. Meal and drink schedule.
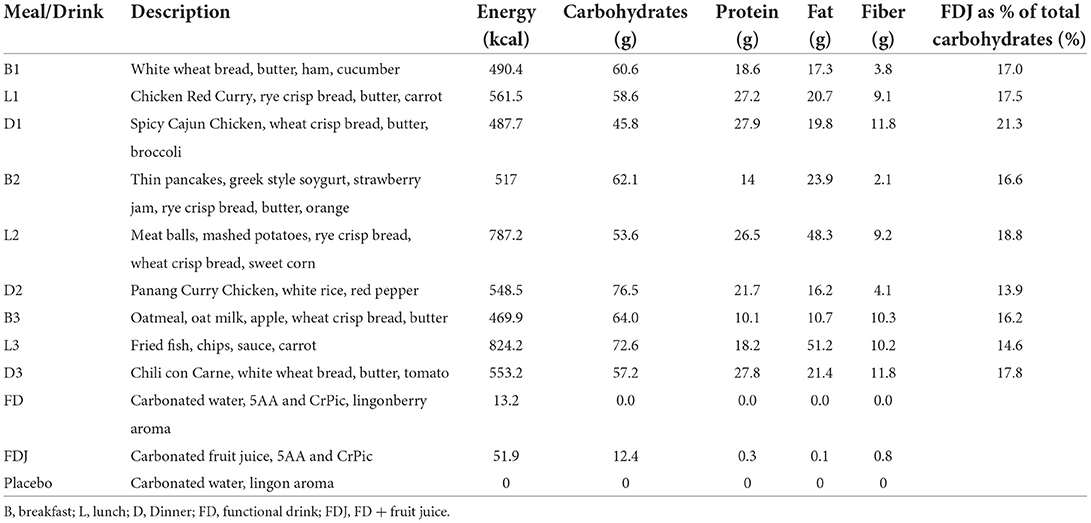
Table 2. Meal composition.
Outcome measures
The pre-defined primary outcome variable, the 120-min postprandial glucose response, is best characterized by the iAUC0−120min for subcutaneous glucose. The iAUC is calculated as the area under the curve, above the baseline level at the beginning of the meal (31). In addition, the maximum glucose value and the time to maximum glucose value within 120 min (C-max, T-max) were analyzed.
Sample size calculation
In the previously performed meal study (24), significant effects were found in the per protocol population which consisted of 48 participants for FD and placebo, respectively, thus 96 meals in total. We estimated that to achieve a similar or higher number of meals per test drink with one run-in day and 9 study days, studying three meals a day, would require 6 participants. This setup had the potential of delivering CGM data from a total of 162 meals (54 with each drink).
Randomization
A full-factorial design was used where all participants received all combinations of drink and meal (see Table 1). The treatments were not randomized and the meals as well as the test drinks were served in the same order for all participants.
Statistical analysis
The trapezoid rule, a numerical integration method used to approximate the area under a curve, was used for calculating iAUC values, which is widely used to calculate the area under pharmacokinetic curves (32, 33). In cases where expected measurements were missing, simple imputation (mean of adjacent measurements) was used to substitute for these values. The differences between the drinks were obtained from the linear contrast statements of an analysis of covariance (ANCOVA), whereby only logically plausible covariates and random factors, with a significant influence (p < 0.05) and homogenous regression slopes (for covariates) were included in the model (34). Factors evaluated as covariates or random factors for potential inclusion in the ANCOVA were: subject and self-reported physical activity within 120 min before or after the beginning of a meal, recorded activities during the day (total daily steps, total daily running in km, total daily stair climb, total estimated daily calories burned during additional activities) as well as meal and drink characteristics (total calories, total carbohydrates, total protein, total fats, total fiber).
Results
The participants were recruited in April 2021 and the study was completed by June 2021. With the aim to recruit 6 men and women in equivalent numbers and according to pre-defined inclusion and exclusion criteria, a total of 7 candidates were screened. One of them did not meet the cut-off for HOMA-IR and was excluded. Baseline characteristics (± SD) of the eligible participants (3 men and 3 women) were: age 49.0 (4.05) years, weight 85.7 (8.21) kg, BMI 27.1 (1.17) kg/m2, fasting glucose 4.82 (0.33) mmol/L, and HOMA-IR 1.77 (0.17). Half of the participants had a family history of diabetes with either one or more first or second-degree relative having diabetes type 1 or 2 (see Table 3).
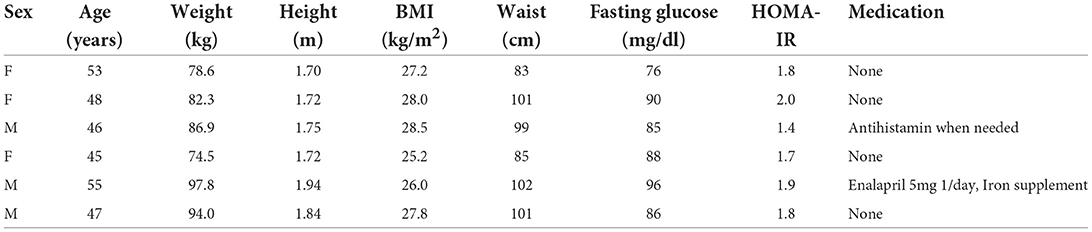
Table 3. Participant description.
A total of 14.894 measurements was obtained from the CGM devices and 156 meals were available for analysis. The ANCOVA analysis showed a significant 34% reduction of iAUC0−120min for FDJ (p < 0.001), with iAUC0−120min for placebo being 3.612 mg/dl · min (95% CI: 3.022 mg/dl · min−4.203 mg/dl · min) and 2.378 mg/dl · min (95% CI: 1.820 mg/dl · min−2.935 mg/dl · min) for FDJ. FD on its own did not show a significant reduction of iAUC0−120min (3.351 mg/dl · min; 95% CI: 2.742 mg/dl · min−3.919 mg/dl · min) (see Figure 1). Covariates included in the model and used to derive the results above were carbohydrates at 65.3 g, protein at 21.3 g and fats at 25.5 g; random factors included in the model were subject number as well as self-reported physical activity within 120 min before or after the beginning of a meal. When pooling the data of FD and FDJ in the same model, a significant reduction of 17.6% was documented for FD/FDJ (p = 0.007).
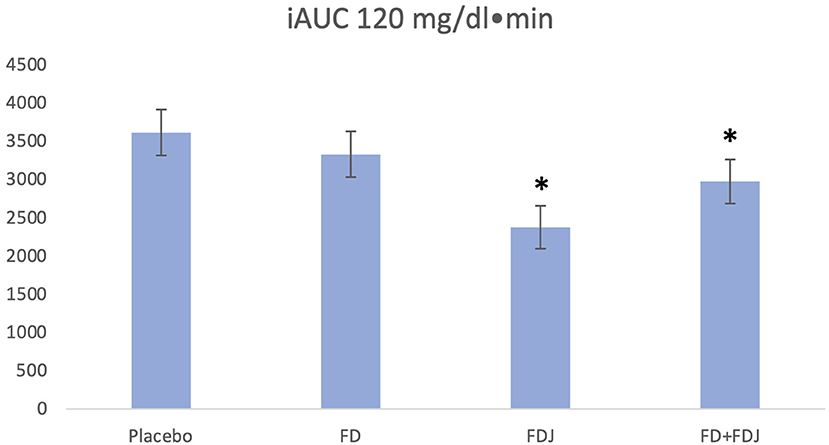
Figure 1. iAUC0−120 values adjusting for subject and physical activity in the 120 min before or after the beginning of a meal. Covariates appearing in the model are evaluated at the following values: total carbohydrates = 65.3 g, total protein = 21.3 g, total fats = 25.5 g. *p < 0.001.
C-max of postprandial glucose within 120 min was 153.8 mg/dl (95% CI: 147.6 mg/dl−160.0 mg/dl) for placebo, 145.4 mg/dl (95% CI: 138.9 mg/dl−151.7 mg/dl) for FD and 132.8 mg/dl (95% CI: 125.7 mg/dl−139.8 mg/dl) for FDJ. The 14% difference in C-max between placebo and FDJ was significant (p = 0.001), whereas the 6% difference between placebo and FD was borderline significant (p = 0.053). The ANCOVA model for assessing C-max differed slightly to the model for iAUC0−120min, it did not include total protein and physical activity before and after the meal as covariates, since these were not significant. The included covariates were assessed at following levels: total carbohydrates at 65.3 g and total fats at 25.5 g. When pooling FD and FDJ data and comparing them to placebo, the ANCOVA model remained unchanged with regards to included variables and the C-max difference between drinks was 9% and significant (FD/FDJ: 139.6 mg/dl vs. placebo 152.8 mg/dl, p = 0.001). No significant differences were found for T-Max. No significant differences were found for the change from baseline to peak subcutaneous glucose. Participants were within the physiological target range as defined by the American Diabetes Association for subcutaneous glucose measurements (35, 36) in 98% of the time.
Discussion
With FD and FDJ both containing the same active ingredients and mainly differing in the carbohydrate content, the results of this study confirm the postprandial glucose lowering efficacy of the amino acids and chromium combination, using CGM devices. While no significant reduction in postprandial glycemia was found when comparing the FD to placebo on its own, FD with added carbohydrate-containing juice (FDJ) as well as the combination of FD and FDJ, demonstrated a pronounced and significant effect on iAUC0−120 (adjusted for the meal composition). Higher efficacy of FDJ compared to FD suggests an enhanced postprandial glucose lowering with an increasing carbohydrate load, a situation in which the improved early insulin response previously shown for FD (without changing total iAUC for insulin) (24, 29) could be even more beneficial for postprandial glucose disposal. The positive effects of early insulin have convincingly been shown both in healthy individuals and diabetes patients (37, 38). In addition, effects of FD on GLP-1 and GIP could influence the effects observed in this study (24, 39). The current results also show that the effect of FD/FDJ on postprandial glucose is sustained and can be achieved in repeated meals over the course of the day.
The study design proved successful and efficient. The participants themselves were to a large extent responsible for the data collection and the adherence to the protocol was good. The time from ethical approval to finalized data collection was substantially shorter (appr. 2 months) than the normal time needed for a meal study (4–6 months). With only 6 individuals, a large dataset for the equivalent of 156 standard laboratory-based meal test was collected. For the iAUCs to be comparable, adjustments for the meal composition as well as other factors were necessary and ANCOVA appeared to be the appropriate model. The factors affecting iAUC values were all expected and physiologically plausible. The variable for physical activity within 120 min of the beginning of a meal was relatively rough, i.e., “did a physical activity take place or not”, yet still played an important role and was thus included in the model as a random factor. Activity within 120 min before the meal reduced the pre-meal glucose value and thus increased the increment, whereas activity within 120 min after beginning of the meal reduced the increment. Overall, daily activity levels did not show significant differences in iAUCs of the individual meals, at least in this small group of subjects. It therefore seems necessary for future studies to improve the monitoring of physical activity, for example by adding data on heart rate from wearables and include it as an additional covariate. A major limitation of this study is the use of two FD with a different nutrient content while using only one comparator matched for FD (and not FDJ). It was not the primary aim of this study to define effects of FDJ on postprandial glucose but rather to evaluate the novel methodological approach. The albeit significant effects shown for FDJ in analyses adjusted for carbohydrate content of the juice need to be studied in follow-ups including an adequate comparator utilizing the novel CGM-based approach presented.
Since even this small pilot trial in 6 participants and repeated meals with a varying macronutrient content delivered significant results for postprandial glucose acquired by CGM, it may be possible to perform such studies in even closer to real-life settings. Subjects could eat meals of their choice, as long as the nutrient content is known or can be estimated with a high precision. The differences between FD and comparator missed statistical significance, which was shown in a previous controlled trial (24). This implies that less standardized meals will likely require larger datasets for postprandial glucose than studied herein, which can easily be achieved in the presented study design. Increasing the number of individuals studied, the use of CGM as well as mobile applications for food and tracking physiological variables would also enable comparisons of inter-individual differences in glucose responses and generate more robust data that is highly desirable for the study of true effects of foods on glucose metabolism.
Conclusions
Taken together, the data presented in this pilot study indicate that continuous subcutaneous glucose measurement delivers a quantity of quality data, which is sufficient to detect effects of a functional drink previously shown to lower postprandial glucose in apparently healthy, overweight subjects. The results imply, that it could be possible to perform studies even closer to real-life by further relaxing meal standardization alongside an improvement in the quality of data on physical activity, as long as precise data on meal composition is collected.
Data availability statement
The raw data supporting the conclusions of this article will be made available by the authors, without undue reservation.
Ethics statement
The studies involving human participants were reviewed and approved by Swedish Ethical Review Authority. The patients/participants provided their written informed consent to participate in this study.
Author contributions
AS, PH, and EÖ all took part in the conceptualization and design of the study. The practical work and data collection was performed by EÖ and the statistical analysis was done by AS. All authors contributed to the interpretation of data and writing of the manuscript.
Funding
The study was funded by Double Good AB.
Acknowledgments
The authors would like to thank Fiona Ernesta for her excellent work with formulating and producing the FDJ.
Conflict of interest
This study received funding from Double Good AB. The funder had the following involvement with the study: EÖ is co-inventor of the patent family describing the functional drink studied, and works for Aventure AB/Double Good AB, that has a license to use the patent. starScience GmbH AS and PH have received funding for other studies by Aventure AB/Double Good AB. PH holds shares of Double Good AB. AS is employed by starScience GmbH.
Publisher's note
All claims expressed in this article are solely those of the authors and do not necessarily represent those of their affiliated organizations, or those of the publisher, the editors and the reviewers. Any product that may be evaluated in this article, or claim that may be made by its manufacturer, is not guaranteed or endorsed by the publisher.
References
1. Bergman M, Chetrit A, Roth J, Jagannathan R, Sevick M, Dankner R. One-hour post-load plasma glucose level during the ogtt predicts dysglycemia: observations from the 24year follow-up of the israel study of glucose intolerance, obesity and hypertension. Diabetes Res Clin Pract. (2016) 120:221–8. doi: 10.1016/j.diabres.2016.08.013
2. Coutinho M, Gerstein HC, Wang Y, Yusuf S. The relationship between glucose and incident cardiovascular events. a metaregression analysis of published data from 20 studies of 95,783 individuals followed for 124 years. Diabetes Care. (1999) 22:233–40. doi: 10.2337/diacare.22.2.233
3. Einarson TR, Machado M, Henk Hemels ME. Blood glucose and subsequent cardiovascular disease: update of a meta-analysis. Curr Med Res Opin. (2011) 27:2155–63. doi: 10.1185/03007995.2011.626760
4. International Diabetes Federation. IDF Diabetes Atlas. Brussels: International Diabetes Federation (2017).
5. Kodama S, Saito K, Tanaka S, Horikawa C, Fujiwara K, Hirasawa R, et al. Fasting and post-challenge glucose as quantitative cardiovascular risk factors: a meta-analysis. J Atheroscler Thromb. (2012) 19:385–96. doi: 10.5551/jat.10975
6. Ning F, Zhang L, Dekker JM, Onat A, Stehouwer CD, Yudkin JS, et al. Development of coronary heart disease and ischemic stroke in relation to fasting and 2-hour plasma glucose levels in the normal range. Cardiovasc Diabetol. (2012) 11:76. doi: 10.1186/1475-2840-11-76
7. Rohling M, Martin T, Wonnemann M, Kragl M, Klein HH, Heinemann L, et al. Determination of postprandial glycemic responses by continuous glucose monitoring in a real-world setting. Nutrients. (2019) 11:2305. doi: 10.3390/nu11102305
8. Shahim B, De Bacquer D, De Backer G, Gyberg V, Kotseva K, Mellbin L, et al. The prognostic value of fasting plasma glucose, two-hour postload glucose, and Hba. Diabetes Care. (2017) 40:1233–40. doi: 10.2337/dc17-0245
9. Chiasson JL, Josse RG, Gomis R, Hanefeld M, Karasik A, Laakso M. Acarbose for prevention of Type 2 diabetes mellitus: the stop-niddm randomised trial. Lancet (London, England). (2002) 359:2072–7. doi: 10.1016/S0140-6736(02)08905-5
10. Chiasson JL, Josse RG, Gomis R, Hanefeld M, Karasik A, Laakso M. Acarbose treatment and the risk of cardiovascular disease and hypertension in patients with impaired glucose tolerance: the stop-niddm trial. J Am Med Assoc. (2003) 290:486–94. doi: 10.1001/jama.290.4.486
11. Holman RR, Coleman RL, Chan JCN, Chiasson JL, Feng H, Ge J, et al. Effects of acarbose on cardiovascular and diabetes outcomes in patients with coronary heart disease and impaired glucose tolerance (Ace): a randomised, double-blind, placebo-controlled trial. Lancet Diabetes Endocrinol. (2017) 5:877–86. doi: 10.1016/S2213–8587(17)30309–1
12. Augustin LS, Kendall CW, Jenkins DJ, Willett WC, Astrup A, Barclay AW, et al. Glycemic index, glycemic load and glycemic response: an international scientific consensus summit from the international carbohydrate quality consortium (Icqc). Nutr Metab Cardiovasc Dis. (2015) 25:795–815. doi: 10.1016/j.numecd.2015.05.005
13. Barclay AW, Petocz P, McMillan-Price J, Flood VM, Prvan T, Mitchell P, et al. Glycemic index, glycemic load, and chronic disease risk - a meta-analysis of observational studies. Am J Clin Nutr. (2008) 87:627–37. doi: 10.1093/ajcn/87.3.627
14. Bechthold A, Boeing H, Schwedhelm C, Hoffmann G, Knuppel S, Iqbal K, et al. Food groups and risk of coronary heart disease, stroke and heart failure: a systematic review and dose-response meta-analysis of prospective studies. Crit Rev Food Sci Nutr. (2019) 59:1071–90. doi: 10.1080/10408398.217.1392288
15. Salmeron J, Ascherio A, Rimm EB, Colditz GA, Spiegelman D, Jenkins DJ, et al. Dietary fiber, glycemic load, and risk of niddm in men. Diabetes Care. (1997) 20:545–50. doi: 10.2337/diacare.20.4.545
16. Salmeron J, Manson JE, Stampfer MJ, Colditz GA, Wing AL, Willett WC. Dietary fiber, glycemic load, and risk of non-insulin-dependent diabetes mellitus in women. J Am Med Assoc. (1997) 277:472–7. doi: 10.1001/jama.277.6.472
17. Schulze MB, Martinez-Gonzalez MA, Fung TT, Lichtenstein AH, Forouhi NG. Food based dietary patterns and chronic disease prevention. BMJ. (2018) 361:k2396. doi: 10.1136/bmj.k2396
18. Ceriello A, Taboga C, Tonutti L, Quagliaro L, Piconi L, Bais B, et al. Evidence for an independent and cumulative effect of postprandial hypertriglyceridemia and hyperglycemia on endothelial dysfunction and oxidative stress generation: effects of short- and long-term simvastatin treatment. Circulation. (2002) 106:1211–8. doi: 10.1161/01.CIR.0000027569.76671.A8
19. Humpert PM. Oxidative stress and glucose metabolism–is there a need to revisit effects of insulin treatment? Diabetologia. (2010) 53:403–5. doi: 10.1007/s00125-009-1652-9
20. Node K, Inoue T. Postprandial hyperglycemia as an etiological factor in vascular failure. Cardiovasc Diabetol. (2009) 8:23. doi: 10.1186/1475-2840-8-23
21. Hanefeld M, Koehler C, Schaper F, Fuecker K, Henkel E, Temelkova-Kurktschiev T. Postprandial plasma glucose is an independent risk factor for increased carotid intima-media thickness in non-diabetic individuals. Atherosclerosis. (1999) 144:229–35.
22. Le Floch JP, Escuyer P, Baudin E, Baudon D, Perlemuter L. Blood glucose area under the curve. Methodological aspects Diabetes Care. (1990) 13:172–5. doi: 10.2337/diacare.13.2.172
23. Brouns F, Björck I, Frayn KN, Gibbs AL, Lang V, Slama G, et al. Glycaemic index methodology. Nutr Res Rev. (2005) 18:145–71. doi: 10.1079/NRR2005100
24. Ostman E, Samigullin A, Heyman-Linden L, Andersson K, Bjorck I, Oste R, et al. A novel nutritional supplement containing amino acids and chromium decreases postprandial glucose response in a randomized, double-blind, placebo-controlled study. PLoS One. (2020) 15:e0234237. doi: 10.1371/journal.pone.0234237
25. Cappon G, Vettoretti M, Sparacino G, Facchinetti A. Continuous glucose monitoring sensors for diabetes management: a review of technologies and applications. Diabetes Metab J. (2019) 43:383–97. doi: 10.4093/dmj.2019.0121
26. Zisser HC, Bailey TS, Schwartz S, Ratner RE, Wise J. Accuracy of the seven continuous glucose monitoring system: comparison with frequently sampled venous glucose measurements. J Diabetes Sci Technol. (2009) 3:1146–54. doi: 10.1177/193229680900300519
27. Davis GM, Spanakis EK, Migdal AL, Singh LG, Albury B, Urrutia MA, et al. Accuracy of dexcom G6 continuous glucose monitoring in non–critically ill hospitalized patients with diabetes. Diabetes Care. (2021) 44:1641–6. doi: 10.2337/dc20-2856
28. Gómez AM, Umpierrez GE, Muñoz OM, Herrera F, Rubio C, Aschner P, et al. Continuous glucose monitoring versus capillary point-of-care testing for inpatient glycemic control in type 2 diabetes patients hospitalized in the general ward and treated with a basal bolus insulin regimen. J Diabetes Sci Technol. (2015) 10:325–9. doi: 10.1177/1932296815602905
29. Samigullin A, Anderson K, Heyman-Lindén L, Öste R, Östman E, Humpert P. A drink containing 5 amino acids and chromium picolinate decreases postprandial glucose: a meta-analysis of controlled trials. Diabetologie und Stoffwechsel. (2018) 13:47. doi: 10.1055/s-0038-1641895
30. Ostman E, Forslund A, Oste R, Bjorck I. A drink containing amino acids and chromium picolinate improves postprandial glycemia at breakfast in healthy, overweight subjects. Func Foods Health Dis. (2017) 7:88–97. doi: 10.31989/ffhd.v7i2.304
31. Cheng KC Li Y, Cheng JT. Merit of incremental area under the curve (iauc) in nutrition is varied in pharmacological assay - a review. Clin J Diabetes Care Control. (2018) 1:180008. Available online at: https://academicstrive.com/CJDCC/CJDCC180008.pdf
32. Hill Jones N. Finding the area under a curve using Jmp and a trapezoidal rule. JMPer Cable. (1997):9–11.
33. Yeh S-T. Using Trapezoidal Rule for the Area under a Curve Calculation. Buffalo, NY: NESUG (2022). p. 1–5.
35. Committee ADAPP. 6. Glycemic targets: standards of medical care in diabetes-−2022. Diabetes Care. (2021) 45(Supplement. 1):S83–96. doi: 10.2337/dc22-S006
36. Battelino T, Danne T, Bergenstal RM, Amiel SA, Beck R, Biester T, et al. Clinical targets for continuous glucose monitoring data interpretation: recommendations from the international consensus on time in range. Diabetes Care. (2019) 42:1593–603.
37. Del Prato S. Loss of early insulin secretion leads to postprandial hyperglycaemia. Diabetologia. (2003) 46:M2–8. doi: 10.1007/s00125-002-0930-6
38. Meyer C, Pimenta W, Woerle HJ, Van Haeften T, Szoke E, Mitrakou A, et al. Different mechanisms for impaired fasting glucose and impaired postprandial glucose tolerance in humans. Diabetes Care. (2006) 29:1909–14. doi: 10.2337/dc06-0438
Keywords: continuous glucose monitoring (CGM), postprandial glycemia, amino acids (AAs), meal study, glycemic index and glycemic load, dietary intervention glycemic control, dietary intervention randomized controlled trial, functional food (FF)
Citation: Samigullin A, Humpert PM and Östman E (2022) Continuous glucose monitoring as a close to real life alternative to meal studies – a pilot study with a functional drink containing amino acids and chromium. Front. Med. Technol. 4:931837. doi: 10.3389/fmedt.2022.931837
Received: 29 April 2022; Accepted: 02 August 2022;
Published: 18 August 2022.
Edited by:
Gregg Suaning, The University of Sydney, AustraliaReviewed by:
Om V. Singh, Johns Hopkins University, United StatesRobert Vigersky, Medtronic (United States), United States
Copyright © 2022 Samigullin, Humpert and Östman. This is an open-access article distributed under the terms of the Creative Commons Attribution License (CC BY). The use, distribution or reproduction in other forums is permitted, provided the original author(s) and the copyright owner(s) are credited and that the original publication in this journal is cited, in accordance with accepted academic practice. No use, distribution or reproduction is permitted which does not comply with these terms.
*Correspondence: Azat Samigullin, YXphdC5zYW1pZ3VsbGluJiN4MDAwNDA7c3RhcnNjaWVuY2UuZGU=