 Miguel A. Santos-Silva
 Nuno Sousa
 João Carlos Sousa
- 1Life and Health Sciences Research Institute (ICVS), School of Medicine, University of Minho, Braga, Portugal
- 2ICVS/3B’s–PT Government Associate Laboratory, Braga, Portugal
- 3Clinical Academic Center-Braga (2CA), Braga, Portugal
- 4Association P5 Digital Medical Center (ACMP5), Braga, Portugal
Routine blood tests drive diagnosis, prognosis, and monitoring in traditional clinical decision support systems. As a routine diagnostic tool with standardized laboratory workflows, clinical blood analysis offers superior accessibility to a comprehensive assessment of physiological parameters. These parameters can be integrated and automated at scale, allowing for in-depth clinical inference and cost-effectiveness compared to other modalities such as imaging, genetic testing, or histopathology. Herein, we extensively review the analytical value of routine blood tests leveraged by artificial intelligence (AI), using the ICD-10 classification as a reference. A significant gap exists between standard disease-associated features and those selected by machine learning models. This suggests an amount of non-perceived information in traditional decision support systems that AI could leverage with improved performance metrics. Nonetheless, AI-derived support for clinical decisions must still be harmonized regarding external validation studies, regulatory approvals, and clinical deployment strategies. Still, as we discuss, the path is drawn for the future application of scalable artificial intelligence (AI) to enhance, extract, and classify patterns potentially correlated with pathological states with restricted limitations in terms of bias and representativeness.
Introduction
Artificial intelligence (AI) stems from the data generated mainly since the beginning of the fourth industrial revolution, which has progressively changed how people live, interact, and work (Sarker, 2021). Automated systems, meant to emulate human cognitive capabilities, deploy supervised applications to perform repetitive tasks more accurately and efficiently, saving time and effort for high-volume workloads. In medicine, AI has become a valuable tool for improving patient outcomes, particularly in diagnostics, where image and text-based systems supported by machine learning (ML) and deep learning (DL) technologies are reaching remarkable clinical results (Reardon, 2019). The COVID-19 pandemic is the paramount example of how AI applications enable new screening tools and achieve early diagnosis by measuring disease severity (Luo et al., 2021), progression (Demichev et al., 2021), and mortality prediction (Lin et al., 2021) through the interpretation of routine blood tests. For instance, a recent meta-analysis from Li et al. demonstrated that computational methods based on multi-center clinical datasets could generate more accurate COVID-19 diagnosis, stratify patients into clusters of severity and discriminate them from Influenza with 97.9% specificity (Li et al., 2020). Applications such as the previous example become even more relevant when applied to low-income underdeveloped countries where access to diagnostic workflow is limited and the need for real-time point-of-care systems for disease screening is imperative.
John McCarthy first outlined the concept of AI in 1956 during the Dartmouth conference, on which several scientists discussed the concept of “thinking machines” in different areas such as abstraction, creativity, computational theory, natural language processing, and neural networks (Kline, 2011). Since then, progress slowed and remained stationary until 2012, when an ImageNet-DL-Algorithm triggered significant attention for the technology, with high-accuracy performance classification metrics that disrupted the current state-of-the-art (Krizhevsky et al., 2012). AI is defined as a computer science subdivision that aims to automatically understand and create intelligent systems based on high amounts of data (Shukla Shubhendu and Vijay, 2013). In medicine, the inequities and deficiencies that arose from the global COVID-19 pandemic catalyzed a boost in AI applications. Therefore, it aims to deliver effective, high-quality care, leveraging increasing clinical world data to democratize and decentralize health into patient care. The transformation of a patient’s blood analysis into a probability state to epitomize a likely diagnosis is already a reality (Gunčar et al., 2018).
The purpose of improving population health and patient care with parallel reduction of healthcare costs supports the implementation of AI strategies in the medium and long-term periods. Bajwa et al., 2021 Concepts such as precision medicine, ranging from diagnostics to prognostics and therapeutics with connected care, are under development (The Medical Futurist, 2022). In parallel, AI strategies disrupt the classical paradigm of scientific knowledge construction. Instead of collecting small datasets that try to answer sequential questions (classical approach), the new paradigm settles on collecting high amounts of data where scientists try to find multiple answers directly (Ahmad et al., 2021). However, significant challenges arise during this new paradigm: the black-box nature of AI algorithms endorses the need to generate explanatory, comprehensive systems able to dialogue with the physician to justify each clinical prediction or outcome (Bruckert et al., 2020). Also, legal and regulatory matters are under development, which will be crucial to regulate how AI algorithms are built and how continuous learning is evaluated.
Here, we focus on routine blood analysis as a proxy for determining pathological states supported by AI algorithms. We offer a comprehensive description of the ML pipeline with contextualization on the learning strategies (machine, reinforcement, deep, and federated learning), model development (application, preprocessing, modelling, and validation), and clinic deployment. We summarize the pathologies based on general health parameters (summarized according to their function and associated causes of variation), their inherent classification performance, and principal findings associated with model development and selected blood parameters. Finally, we discuss challenges related to clinic deployment and suggest future research directions for the development of models.
Overall, this review provides guidance for future research by summarizing reports combining AI and routine blood tests to diagnose disease or prognosis. Finally, it describes the methodologies used and contributes to the continued use of this technique in providing deeper insights into the potential of non-appraised blood metabolites in traditional clinical decision support systems.
How AI learns
Currently, AI drives innovation processes involving analytical (data-driven decision-making), functional (operating according to analytical AI), interactive (communication), textual (nature language processing), and visual (augmented reality) technologies. AI enables the development of models to solve real-world problems based on different learning strategies, such as machine learning, deep learning, data mining, rule-based modelling, fuzzy logic, knowledge representation, case-based reasoning, text mining, visual analytics, and optimization, among others (Sarker, 2022). Next, we will briefly explain these learning strategies.
ML is a pattern recognition method that automatically detects regularities in large amounts of data. Based on statistical methods, this process evaluates interactions between variables and finds the most effective way of using them to reach a predetermined goal without requiring human intervention to define a strict set of rules or programming hypotheses (Kerr et al., 2012). ML has become the preferred framework for deploying AI applications, supported and leveraged by the continuous increase of data availability (big data). Although these concepts are similar and closely related, they are distinct: pattern recognition is one possible approach to artificial intelligence, and machine learning is a way to pattern recognition (Alsuliman et al., 2020). Data is considered mandatory for the model’s development, and it is commonly available in different forms such as structured (highly organized on relational databases), unstructured (without pre-defined format), semi-structured (organized but not on relational databases), and metadata (data properties about data) (Sarker, 2021).
ML algorithms such as gaussian naïve Bayes (GNB), k-nearest neighbors (KNN), support vector machines (SVM), decision trees (DT), linear regression (LR), or (Box 1) are the most common techniques generally applied for supervised learning strategies (Table 1 provides a comprehensive list). These algorithms use sample inputs for model development and subsequent data for model prediction. Apart from predicting specific diseases, other methods such as K-means, principal component analysis (PCA), or Pearson correlation (ρ) allow data exploration for clustering and dimensionality reduction through maximizing variance between samples. Thus, they enable an in-depth exploration of biomedical data with significant importance in medical diagnosis.
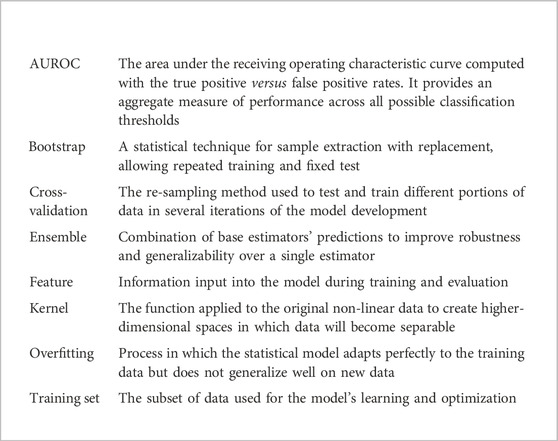
Box 1. Glossary of key terms.
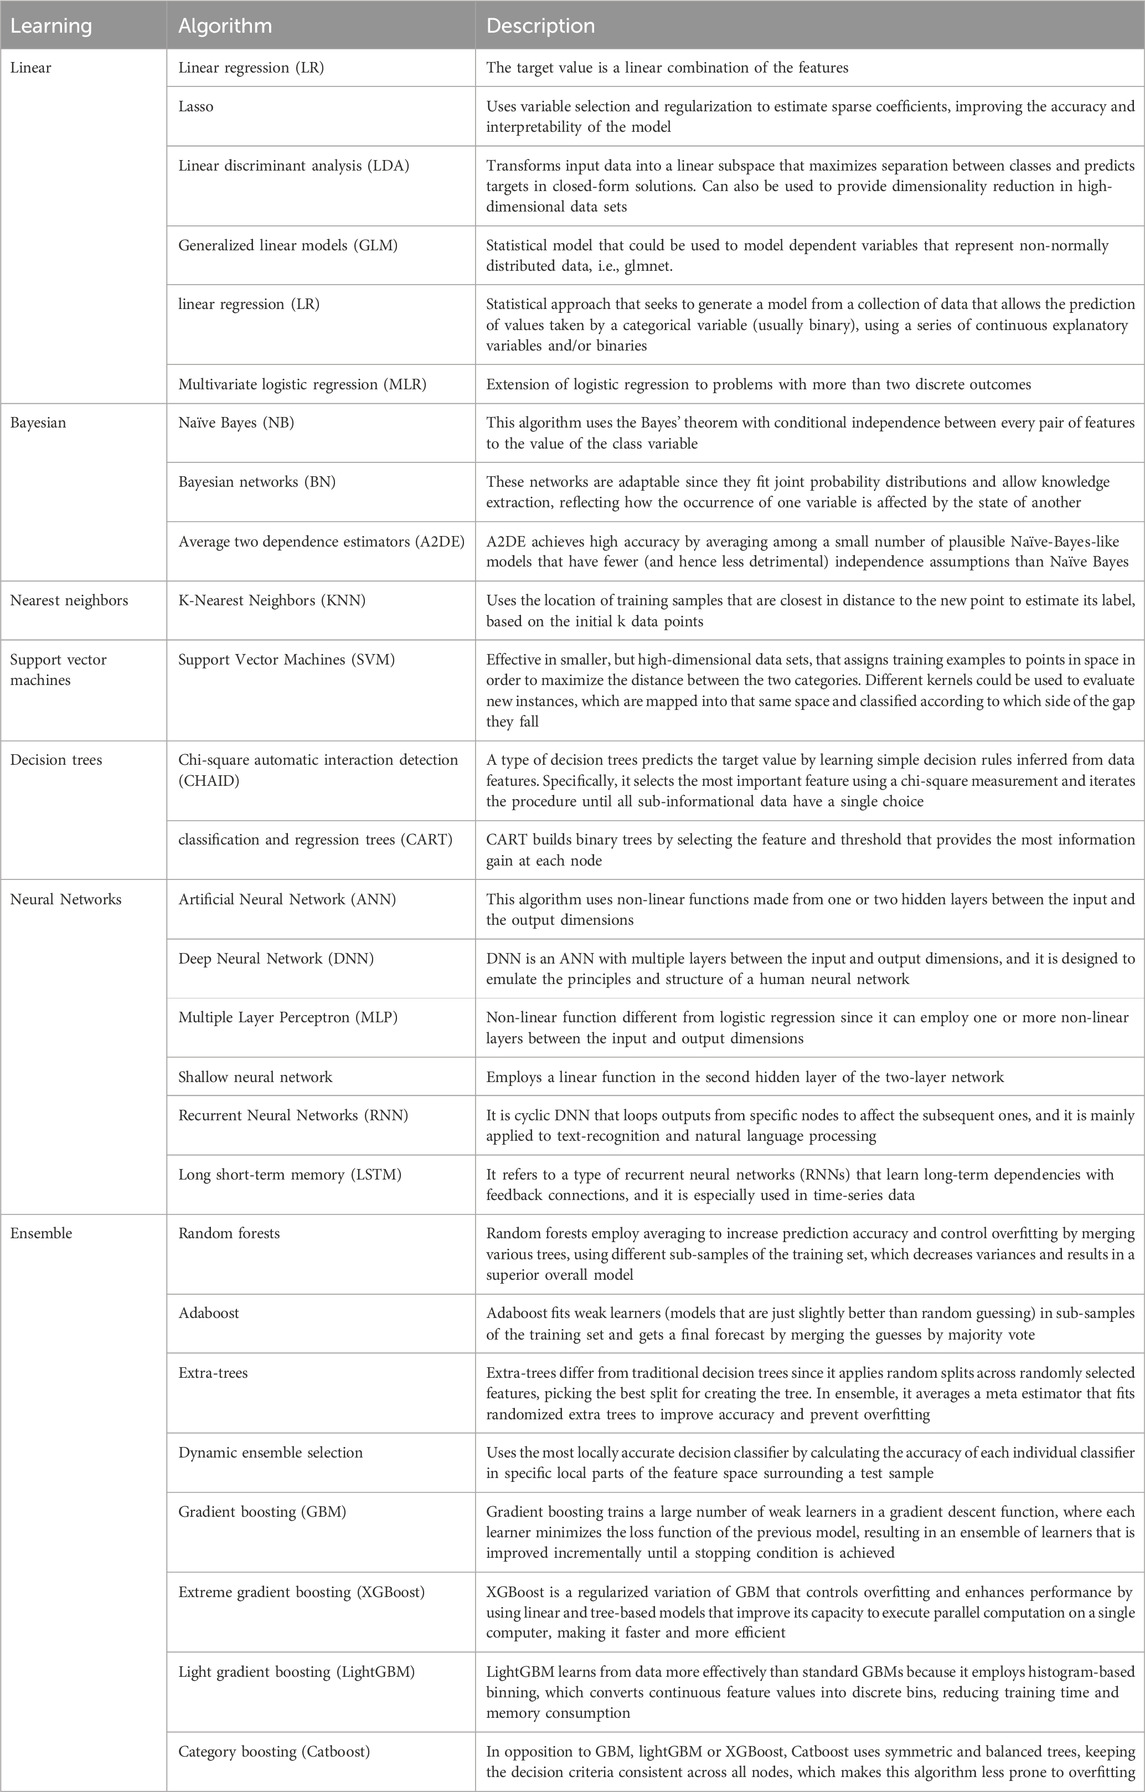
Table 1. A comprehensive list of supervised ML algorithms for classification according to the desired learning strategy (Pedregosa et al., 2011).
Supervised ML algorithms differ from unsupervised ones because they comprise training data wherein the real state of the data is known, for instance, which subjects have anemia and which are healthy. Based on training data, the algorithm generates a model that is applied to predict the state of a set of subjects for which the true state is unknown. These predictions settle in the form of a classification problem that identifies discrete states, such as different stages of anemia. Alternatively, they are established as a regression problem that evaluates continuous variables and predicts, for example, the numeric value of hemoglobin (Svensson et al., 2015). However, suppose the true state of the data is unknown. In that case, learning might be conducted unsupervised, where algorithms infer underlying patterns in unlabeled data to find sub-clusters of the original data, identify outliers, or produce low-dimensional representations. This way, it could be possible to recognize new associations that were not perceptible. In the example above, the algorithm could separate clusters of patients between anemic and non-anemic, even without knowing the true value of hemoglobin.
Reinforcement learning (RL) is a feedback-based approach where algorithms learn through trial and error by balancing the management of input knowledge with exploring unknown data. The model executes the task by understanding some basic rules and learns by weighting certain variables to find the correct solution. The supervisor should only indicate whether the algorithm’s answer is correct; it is like supervised learning but delegates decision-making (weighting) to the algorithm’s trial-error. An up-to-date application is the continuous management of oxygen flow rate for critically ill COVID-19 patients (Zheng et al., 2021), where the algorithm learned the appropriate flow rate for each patient, reducing the mortality rate and increasing the savings of oxygen-scarce resources in the pandemic. However, these algorithms are known as ‘data-hungry’ since they need large amounts of data to train different paths to achieve sustainable performance, which is a limitation when applied to non-structured clinical information.
Deep learning (DL) is another class of machine learning, conceptually similar to the human brain since it mimics the inner mechanisms of brain neurons to transport and process data, create patterns, and enlighten decision-making. These algorithms extract high-level interactions between hidden layers of features from the input and learn complex interactions to develop accurate models from raw data. In medical diagnosis, this method has an application in image analysis, namely, on X-ray risk fracture diagnosis, breast density mammography analysis, or cardiovascular and pulmonary image reconstruction, all with 510(k) premarket notification clearance from the FDA (Benjamens et al., 2020). Deep learning requires minimal human intervention (except for sample labelling) but large amounts of curated data sets. Additionally, computational power is also relevant to conducting these tasks. Some researchers estimated that a life cycle to train several large AI models could emit nearly five times the CO2 of an average American car (Hao, 2023). These challenges conducted the study and development of a new learning approach based on sparse modeling technology. The key differences compared to DL are the ability to provide comparable or even better accuracy results, working with small datasets, and performing feature extraction with much less computational power (1% of the energy required for DL). It also provides an explainable ‘white box’ the user can perceive (Fujiwara, 2021). Although this technology opens new routes in medical AI, the applications are still at a proof-of-principle and feasibility stage for cerebral infarction diagnosis assistance, liver cancer classification with a diagnosis support system, or anomaly detection in ECG signals. Therefore, it is still far from being approved for clinical deployment.
Federated learning (FL) is a new learning paradigm aiming to correct limitations in the current state-of-the-art model development for data governance, privacy, update, and sharing. FL moves the model to the data instead of input data for modeling. This approach enables training common AI models from multiple independent data sources (with proprietary data governance, privacy, and access policies) to deploy unbiased, generalizable, and appropriate-fitting models. The most established workflow of FL was proposed by Brendan McMahan et al. (2017). This workflow includes the distribution of the global model on independent ‘clients’ that train the model in its data and send the adjusted local model to the global server to perform the trained models’ aggregation; this cycle repeats until the global model converges. Dayan et al. (2021) implemented an FL approach for the COVID-19 prognosis of oxygen supplies on symptomatic patients using the inputs of vital signs, laboratory data, and chest X-rays from 20 institutes. The federated model impacted prediction metrics across all participating sites (trained locally) by an average increase of 16% and 38% in AUC and generalizability, respectively.
While learning remains a matter of study with newer approaches being developed (Kairouz et al., 2021), the pipeline of AI-based prediction models is still under standardization. The increasing number of reports in this field compels the establishment of guidelines not to gauge the quality of the prediction models but to provide indications for transparent and unified reporting of this matter.
Since this review focuses on AI application to blood parameters to extract clinical value, we next provide a brief overview of the most common routine blood tests before going deep into how AI has been used to extract clinical value from them.
Blood and routine blood tests
Blood is the only fluid tissue present in the human body. Typically, an average adult has 6–7 L of blood in total. Cell elements compose approximately 45% of the blood; the remaining 55% is the fluid portion, designated plasma or serum. Many diseases cause changes in blood composition; therefore, blood analysis is important in clinical diagnosis (Badrick, 2013). Routine blood tests (RBT) typically merge the hematology and biochemistry analysis to explore changes in the cellular and molecular parts of the blood (Table 2). Depending on the type of blood analysis, laboratory workflows require at least two independent blood-collecting tubes for the separate study of hematology and biochemistry, which often forces the patient to provide 4–10 mL of venous blood.
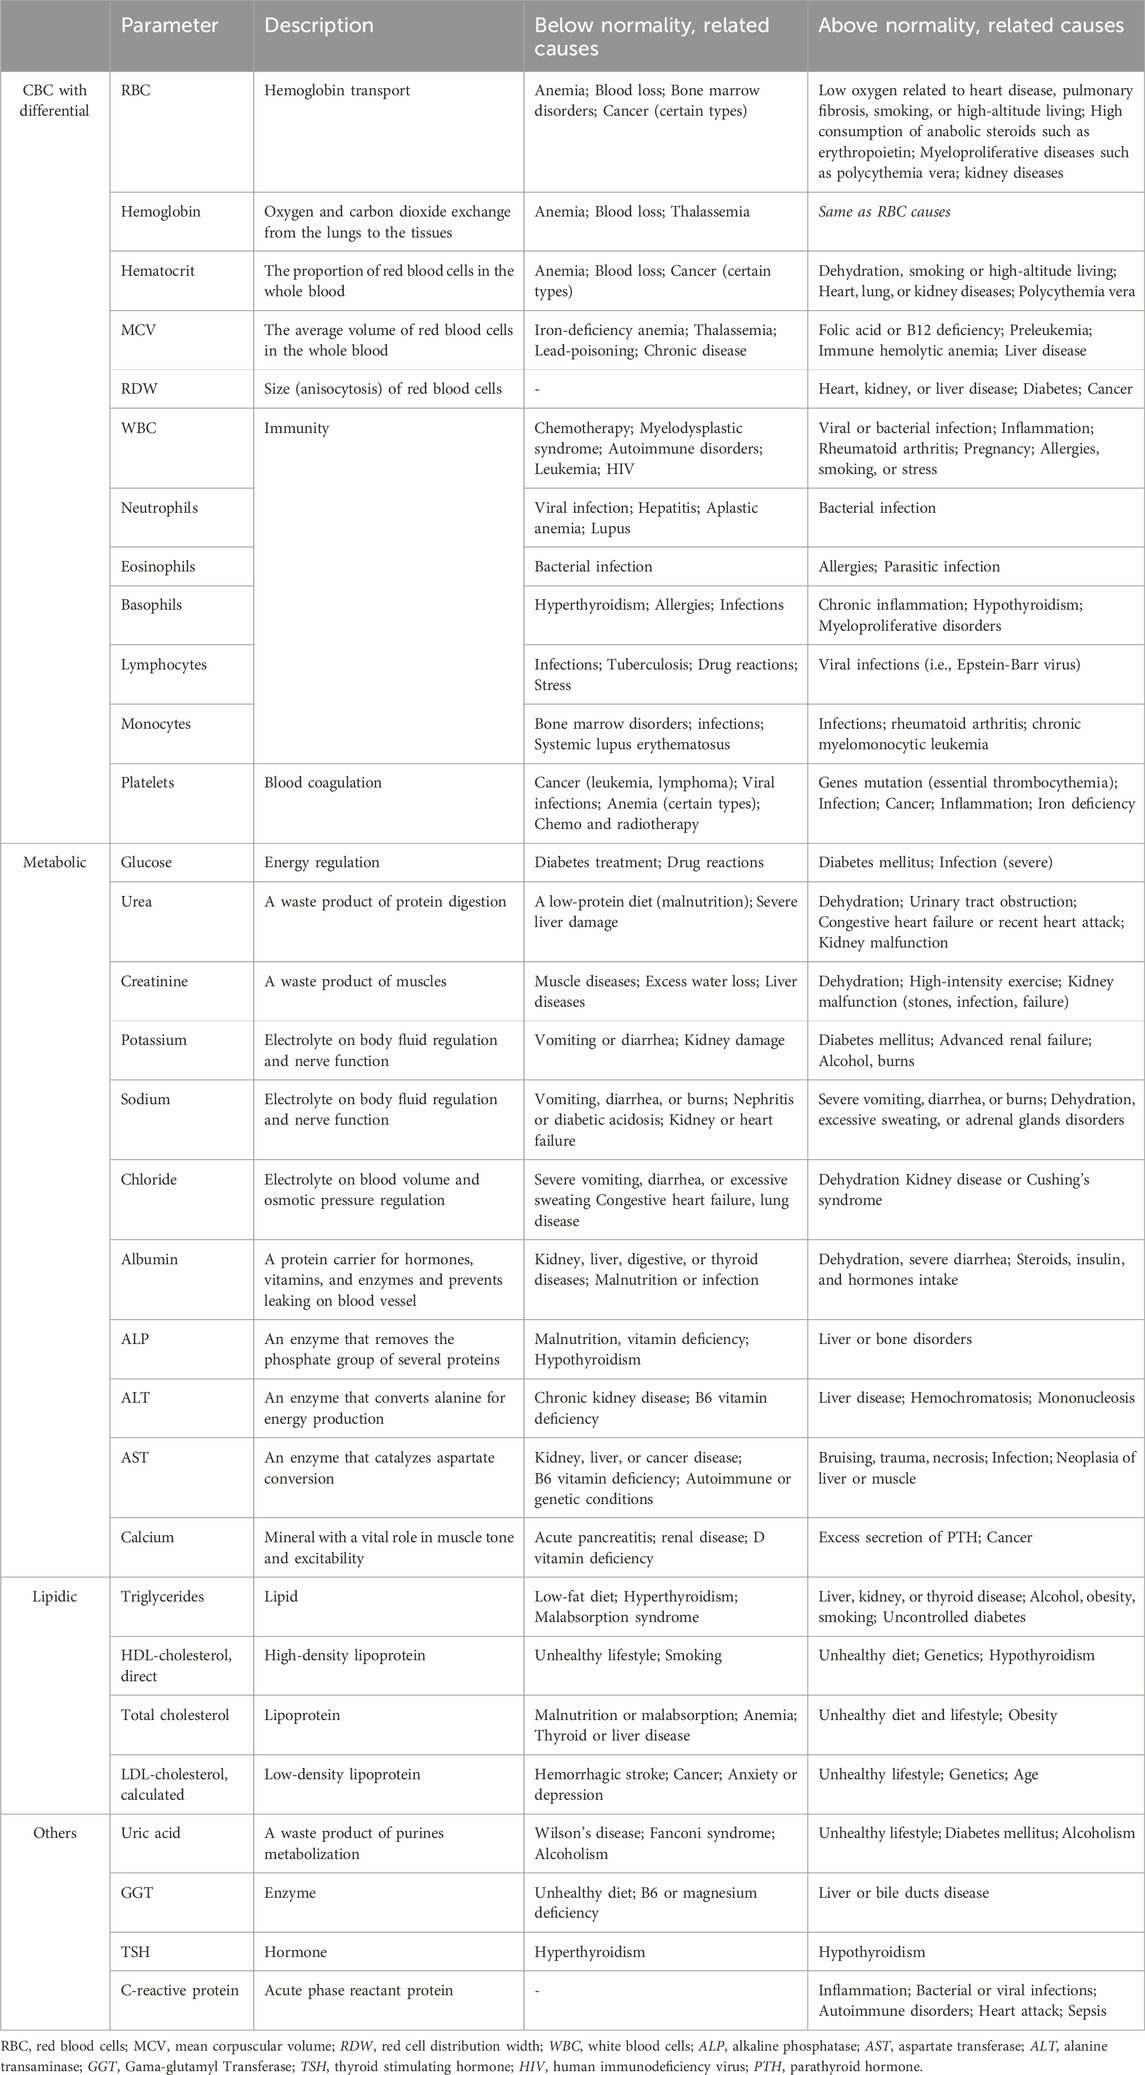
Table 2. General health panel required in routine blood examinations (Matthew and Pincus, 2011).
In hematology, cell blood count (CBC) is the most performed exam. It includes not only the analysis of the three most important types of cells, erythrocytes (red blood cell, RBC), leukocytes (white blood cell, WBC), and thrombocytes (platelet) but also comprises differential information on WBCs subgroups (lymphocytes, segments, monocytes, eosinophils, basophils). Hematology also enlightens on hemoglobin concentration (Hb), hematocrit percentage (HTC), mean corpuscular volume (MCV), mean cell hemoglobin concentration (MCHC), and the red cell distribution width (RDW) (Celkan, 2020).
Biochemistry panels examine other chemical substances, such as electrolytes, hormones, and proteins. The portion of the blood that remains after all blood cells removal is composed mainly of water (90%), proteins (9%) that regulate plasma osmotic pressure and are important in the transport of fatty acids, thyroid and steroid hormones, and other chemical substances (1%) such as gases, nutrients, and vitamins (Marieb and Hoehn, 2012). The serum refers to plasma without clotting factors, i.e., fibrinogen, and is commonly used for chemistry testing and coagulation studies (Chatburn and Hematology, 2010). A general health blood parameters panel typically includes CBC with differential, comprehensive metabolic and lipid panels, uric acid, GGT, and TSH (Richard et al., 2011).
Methods
We conducted a literature review of studies published between 2012 and 2022 that used artificial intelligence methodologies, namely, machine learning algorithms, to extrapolate clinical outcomes from routine blood tests. Using the query ‘artificial intelligence OR machine learning AND routine blood tests’ in the PubMed® electronic database, we found 164 articles that proceeded to the screening stage. Rayyan Management Software was used to import discovered reports, conduct study selection, and apply eligibility criteria.
Original English-language studies that reported diagnosis or prognosis of ICD-10 diseases based only on predefined blood parameters, namely, RBC, Hemoglobin, Hematocrit, MCV, RDW, WBC, Neutrophils, Eosinophils, Basophils, Lymphocytes, Platelets, Glucose, Urea, Creatinine, Potassium, Sodium, Chloride, Albumin, ALP, ALT, AST, Calcium, Triglycerides, HDL-cholesterol, Total cholesterol, LDL-cholesterol, Uric acid, GGT, TSH and C-reactive protein, were eligible for inclusion. The analysis did not include studies that included other biofluids parameters or reviews, systematic reviews, meta-analyses, protocols, commentaries, or book chapters.
The International Statistical Classification of Diseases and Related Health Problems 10th revision (ICD-10) was used to categorize the 54 studies, which were divided into 10 disease classes: infections (or parasitic diseases) (9), neoplasms (6), blood (3), endocrine (nutritional or metabolic) (5), mental (behavioral or neurodevelopmental) (2), circulatory (3), respiratory (2), digestive (5), genitourinary (1), and particular diseases (COVID-19) (18).
An overview of machine-learning studies based on routine blood tests for diagnosis or prognosis of ICD-10 pathologies
Most of the studies covered in this review fall into the diagnosis category; we identify the exceptions in the outcome column of each study (see tables below). We next describe how machine learning has been applied to extract clinical value from routine blood tests for specific diseases (using the ICD-10 classification as reference); Table 3 to 13 summarize information (outcome, sample, selected features, methods, and most relevant findings) for each study.

Table 3. Machine-learning-based routine blood tests for the diagnosis (or prognosis) of certain infections or parasitic diseases.
Infectious or parasitic diseases (ICD-10 class I)
The infections or parasitic diseases studied include the human T-lymphotropic virus, bacteremia, bloodstream infection, general bacterial infection (in the surgical room and at hospital admission), malaria, and dengue. The studies used the traditional blood-based indicators of infection stated in Table 3, namely, white blood cells, platelets, glucose, creatinine, albumin, AST, and CRP. However, ‘exceptions’ associated with feature selection were verified in surgical-site infection (ALP and sodium), malaria (RBC, MPV, MCV), bacteremia (MPV), and bloodstream infection (RDW). The studies on surgical-site infection were concerned with the relationship between time of blood analysis and the prediction of a diagnosis. Significant progression was accomplished by Kocbek et al., with the prediction of the full lasso model (AUC=0.95) at different timeframes (60, 30, and 15 days), benefiting from the findings of Soguero-Ruiz et al. (AUC=0.87) stating the importance to adjust the temporal structure of blood analysis to increase classification performance (Soguero-Ruiz et al., 2015; Kocbek et al., 2019). While ALP was selected for post-operative surgical infection, sodium was featured for surgical site infection. Malaria was studied for supervised classification with discrimination between uncomplicated malaria (UM), severe malaria (SM), and non-malaria infections (nMI). Distinctions were modeled by an artificial neural network with three different layers using distinctive features for each discrimination. Interestingly, SM separated from nMI based on the unique combination between MPV and MCV as classifiers of SM (AUC=0.98). UM and nMI were also distinguished based on PLT, RBC, and LY (AUC=0.86). The approach to Dengue differed from the approach to malaria. Ho et al. evaluated the probability of the condition in a predefined timespan of 35 weeks (Ho et al., 2020). Clinical data was fed into a deep neural network in competition with other learners, reaching an internal validation that surpassed sensitivities of 90% in a 3% prevalence cohort. Surprisingly, the weak learners performed similarly, indicating the clinical data value based only on age, temperature, and WBC. The approach from Sarbaz et al. outlined an infection by the human t-lymphotropic virus type I, a retrovirus known to be asymptomatic in most cases and evolve to malignancy and neural diseases in a few patients (Sarbaz et al., 2013). Even so, the dataset used has a relative balance between three outcomes: normal (n=101), leukemia (n=94), and HTLV-I (n=107). The supervised classification model is based on a decision-trees algorithm–CHAID, which is the chi-squared automatic interaction detection, evaluating the association between input features exploring the levels of the three to maximize the classification performance. The internal validation achieved excellent performance (AUC>0.90) with a sensitivity of 95.8% in recognition of patients based on leukocytes, platelets, and percentage of eosinophils information. Bacteremia was initially studied in 2014 by Ratzinger et al. in a cross-sectional study with the largest cohort associated with infectious diseases (n=15,985) with 1,286 presenting a positive blood culture result: E. coli (n=406), S. aureus (n=297), K. pneumonie (n=83) and others (n=500) (Ratzinger et al., 2014). The dataset split kept the 8% prevalence of bacteremia in training and validation sets, and the statistical analysis identified NE/WBC as the most important individual predictor (AUC=0.694). The A2DE algorithm (naïve-Bayes-based) produced two models with similar performance: model 1 (20 variables, NPV=0.966) and model 2 (10 variables, NPV=0.966). Results of internal validation kept the classification performance constant and selected age, creatinine, CRP, eosinophil, bilirubin, lymphocytes, monocytes, monocytes (%), neutrophils (%), and sodium as important predictors of bacteremia. Mooney et al. focused on a pregnant or post-partum cohort, where the bacteremia prevalence was lower (nearly 3% in 255 patients) (Mooney et al., 2021). The random forests classifier achieved an NPV of 97.4%, supported by the NLR, MPV, and BA indexes. Finally, Zoabi et al. evaluated bloodstream infection with a gradient-boosting decision tree and compared the results of the full (AUC=0.83) and compact (AUC=0.81) models with the standard conventional scores (AUC=0.62) (Zoabi et al., 2021). The evaluation of the model was made available, differentiating this study from the previous and enabling a prospective assessment of the method.
Neoplasms (ICD-10 class II)
The application of AI and blood parameters for neoplasia herein reviewed include colorectal, leukemia (pediatric acute lymphoblastic, leukemias differentiation and lymphocytic prognosis), and non-specified cancer diagnosis in a primary care center. Erythrocytes, hemoglobin, hematocrit, RDW, leukocytes, platelets, aspartate aminotransferase (AST), calcium, and LDL-cholesterol were the Cancer-related blood parameters identified (Table 2). Studies related to colorectal cancer were Table 4 highly consistent since they built on a high dimensional sample size (>10k patients), employed a supervised decision tree classification algorithm with similar internal validation (AUC=0.82 and AUC=0.81), and externally validated with equal or higher performance (AUC=0.81, AUC=0.87, and AUC=0.85). This consistency endorses the relevance of its findings. Noteworthily, different outcomes were verified: while Kinar et al. demonstrated sensitivity stability between 480 and 240 days before diagnosis (AUC≈0.76) with a posterior increase in the last 240 days (AUC>0.80) (Kinar et al., 2016), Hornbrook et al. identified sub-regions of colorectal cancer that were better diagnosed, namely, the cecum and the ascending colon (Hornbrook et al., 2017).
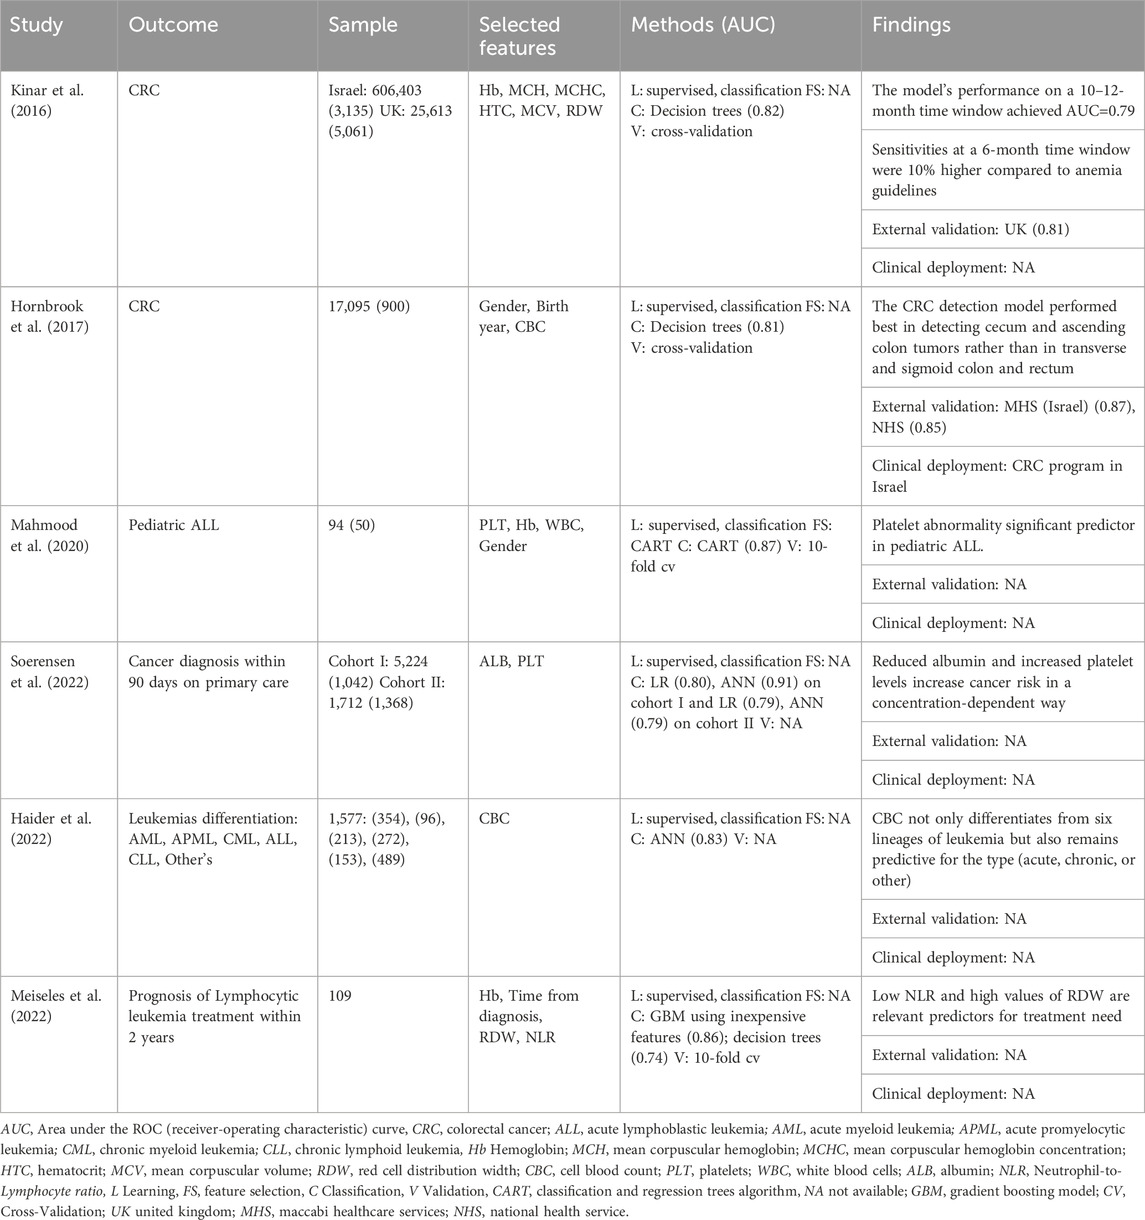
Table 4. Machine-learning-based routine blood tests for the diagnosis (or prognosis) of neoplasms.
Regarding leukemia, Mahmood et al. began to evaluate the ability to diagnose pediatric acute lymphoblastic leukemia (ALL) in a small cohort (n=94), where fifty patients had the disease (Mahmood et al., 2020). The study findings were achieved through the comparison of four classifiers wherein the classification and regression trees (CART) performed better (accuracy=0.87) with a decision tree that included low platelet (43%) and hemoglobin (24%) levels and high levels of white blood cells (4%). The disease was furtherly distinguished by Haider et al. on a set of other pathologic conditions: acute myeloid leukemia (AML, n=354), acute promyelocytic leukemia (APML, n=96), chronic myeloid leukemia (CML, n=213), and chronic lymphoid leukemia (CLL, n=153) (Haider et al., 2022). The authors based the approach on a conventional cell blood count analysis and developed an artificial neural network to classify the six lineages of the disease: AML (AUC=0.905), APML (AUC=0.805), CML (AUC=0.937), CLL (AUC=0.870) and ALL (AUC=0.829). Internal validation sets increased overall accuracy from 83.1% to 84.7%, which denotes a non-overfitted model. Meiseles et al. evaluated the prognosis of treatment needed in 2 years for patients with lymphocytic leukemia with a dataset of 109 patients (Meiseles et al., 2022). The outcome was predicted with a gradient boosting model (GBM, AUC=0.768) and compared with a general linear model (GLM, AUC=0.753), both with higher performances when related to the current scoring system for prognostic evaluation of patients with CLL (CLL-IPI, AUC=0.52). Despite predicting the general progress of the disease, the CLL-IPI does not evaluate the necessity of the treatment, and even a simple decision tree based on inexpensive features–Hb, time since diagnosis, NLR, and RDW–achieved higher performance (AUC=0.74).
Finally, a non-specified cancer diagnosis was approached by Soerensen et al., through the modeling (training and internal validation) on cohort I (n=6,266 from 2011 to 2018) and the evaluation on cohort II (n=3,080 from 2019 to 2020). The primary outcome was “cancer within 90 days,” and the proposed methodology included an artificial neural networks versus logistic regression approaches (Soerensen et al., 2022). The results were slightly different since ANN predicted better in the modeling cohort (AUC=0.91) but decreased its performance in the evaluation cohort (AUC=0.79); in opposition, LR demonstrated higher stability in both cohorts (n1, AUC=0.80, and n2, AUC=0.79). The concentration decrease in albumin with a dependent increase in platelet levels was related to an increased risk of cancer, even for patients whose metabolite relationship was verified in ‘normal’ ranges.
Diseases of the blood or blood-forming organs (ICD-10 class III)
The approach to blood diseases fundamentally combined standard CBC parameters with artificial neural networks. The outcomes included the diagnosis of iron deficiency anemia in women, thalassemia minor (TM) in the general adult population, and the distinction between iron-deficiency anemia and β-thalassemia in three scenarios (males, females, and both). The approach from Yilmaz et al. involved studying several ANN strategies to verify which one had the best accuracy without performing feature selection in the dataset (Yılmaz and Bozkurt, 2012). The accuracy results obtained were highly similar between the studied strategies (accuracies≥0.98), and comparison with previous studies (Azarkhish et al., 2012) showed a slight increase in sensitivity from 0.968 to 0.976, conferring an excellent opportunity to perform an external validation of the model with consequent valid clinical deployment. In thalassemia minor, Magen et al., studied a cohort of 185 verified alpha and beta TM patients with a control group that included IDA, myelodysplastic (MDS), and healthy subjects (Barnhart-Magen et al., 2013). Despite feeding the ANN with six CBC metabolites, only RBC, RDW, and MCV values achieved higher metrics (Table 5). However, the specificity of 1.00 (TM vs. healthy and MDS) decreased to 0.90 (TM vs. healthy, MDS, and IDA). Çil et al. reported improvement with the distinction of β-thalassemia and IDA studied in gender groups with different algorithms (weak learners and neural networks) (Çil et al., 2020). The principal findings include a common gender RELM algorithm (specificity=0.966), an ELM, RELM for females (specificity=0.952), and an SVM model for males (specificity=0.938). While these scores surpassed the previous studies, the sample size was small, limiting the study findings.
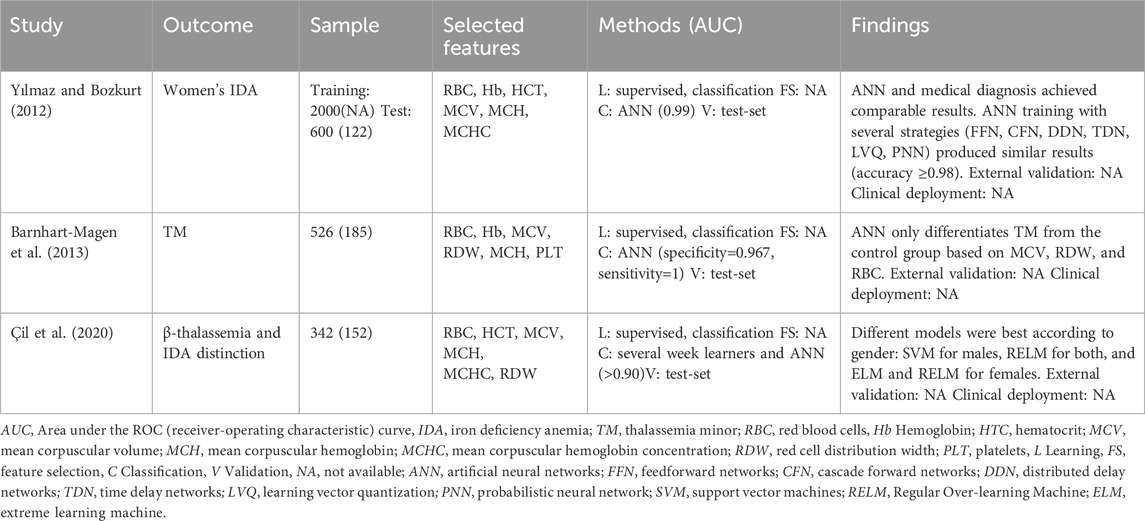
Table 5. Machine-learning-based routine blood tests for the diagnosis (or prognosis) of diseases of the blood or blood-forming organs.
Endocrine, nutritional, or metabolic diseases (ICD-10 class IV)
This review reports endocrine, nutritional, or metabolic diseases mainly applied to the diagnosis of type 2 diabetes mellitus (T2DM) and the prediction of blood glucose on type 1 diabetes mellitus (T1DM) and ensuing disease complications (insulin resistance, polyneuropathy, and iatrogenic hypoglycemia). (Table 6) Regarding diagnosis, Kopitar et al. approached early T2DM on a cohort of 3,723 individuals employing different ML algorithms without significant improvements related to diagnosis accuracy or newly relevant features (Kopitar et al., 2020). Indeed, the authors concluded that the model’s stability in linear regression was preferred against other learning algorithms, and the increased data available in electronic health records was useful to update prediction models and stabilize important features: hyperglycemia, age HDL-cholesterol, and triglycerides.
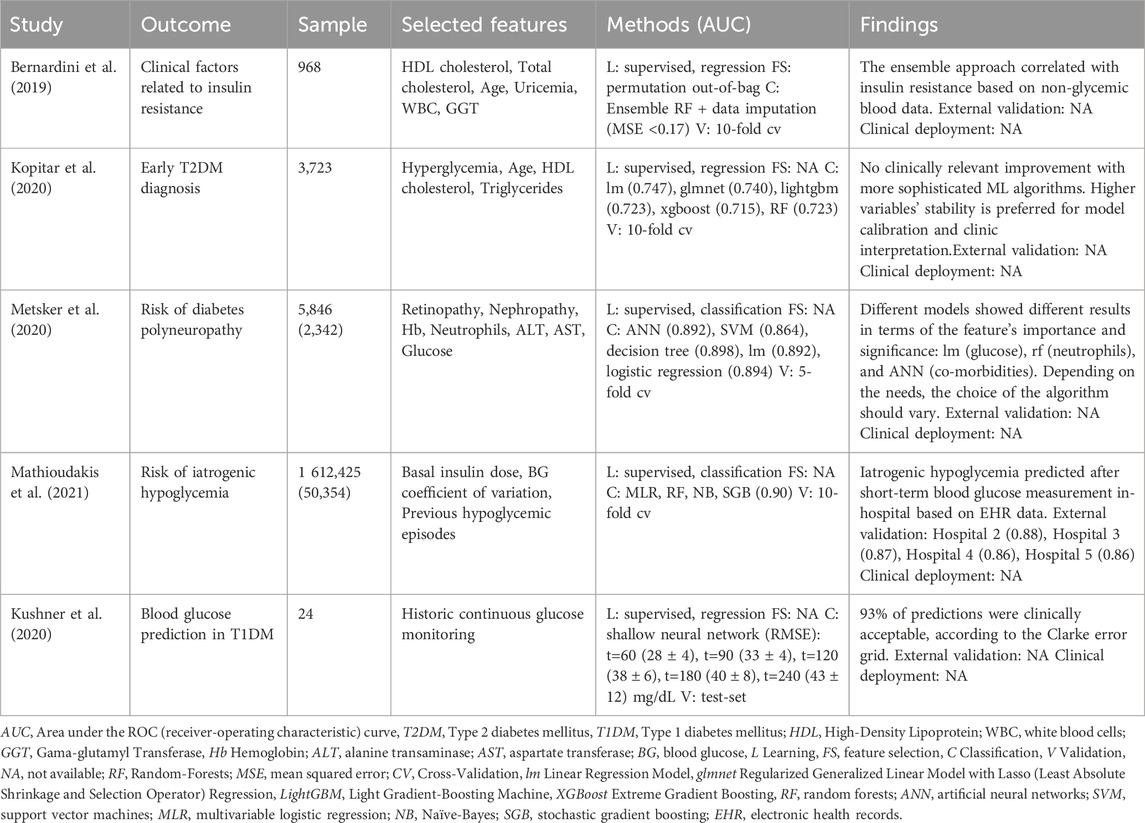
Table 6. Machine-learning-based routine blood tests for the diagnosis (or prognosis) of endocrine, nutritional, or metabolic diseases.
Kushner et al. studied T1DM blood glucose prediction using a shallow neural network based on historical continuous blood glucose monitoring (Kushner et al., 2020). The results improved the current condition through a more extended prediction (t=240min vs. 120min) with lower error (RMSE, 60min=28 mg/dL vs. 43 mg/dL). Bernardini et al. initially featured disease complications with evaluating clinical factors associated with insulin resistance (Bernardini et al., 2019). The ensemble regression forest allowed the identification of non-glycemic blood parameters (HDL and total cholesterol, age, uricemia, WBC, and GGT) as clinical factors that could provide early detection of glucose deterioration. These findings agree with previous literature that individually associated uricemia and WBC to insulin-resistant conditions and GGT in high-risk T2DM individuals. Higher sample studies employed supervised classification algorithms for risk prediction of polyneuropathy (n=5,846) and iatrogenic hypoglycemia. Regarding polyneuropathy, the authors found that different ML models produced different features selection and consequent classification metrics, relating co-morbidities (nephropathy or retinopathy) to a rise in ANN (AUC=0.892), increased neutrophil levels in random forests boosting (AUC=0.898) or blood glucose levels in linear regression (AUC=0.892). Of notice, the principal finding suggests that the choice of the ML algorithm should consider not only the performance metrics but also the kind of clinical information to assess: the identification of early (i.e., ANN) or late biomarkers (i.e., linear regression) of polyneuropathy, or the identification of pathophysiological mechanisms (i.e., decision trees). The risk of developing iatrogenic hypoglycemia (glucose≤70 mg/dL) was approached by Mathioudakis et al. using a stochastic gradient boosting ML model in an extensive data study (n=1 612,425) (Mathioudakis et al., 2021). Performance metrics of the developed model (43 predictors) were slightly lower (c-statistic=0.86:0.90) than previous reports (c-statistic=0.80:0.99) but was the first to be externally validated in 4 different hospitals with stability in model predictions, working 24 h after each blood glucose measurement.
Mental, behavioral, or neurodevelopmental disorders (ICD-10 class V)
Using AI, depression was the only condition studied in the context of mental, behavioral, or neurodevelopmental diseases (Table 3). Despite the association between depression and routine blood biomarkers still being under clarification, low HDL-cholesterol values were previously associated with the condition. The studies reviewed approached depression under the NHANES database differently: while Dipnall et al. used data mining, machine learning, and traditional statistics to identify related biomarkers (Dipnall et al., 2016), Hochman et al. aimed to build a low-cost diagnostic tool to perform diagnosis based on blood data (Hochman et al., 2021). The methodology described in the first study explains the feature selection process in three sequential hybrid processes: multiple imputations, ML regression, and traditional statistical regression. From 67 laboratory parameters, the workflow selected 21 after ML regression and only six after univariate analysis. The final multiple logistic regression model suggested two related effects (hemoglobin from bilirubin and cotinine from cadmium), which resulted in the exclusion of Hb and cotinine. The posterior cadmium elimination occurred since only RDW, glucose, and total bilirubin remained significant to several confounder covariates, namely, age (p<0.05). The authors explained related literature associations between the selected biomarkers and depression, yet all with indirect relationships. The subsequent study from Hochman et al. configured a supervised approach for predicting depression using a random forests classifier in four subgroups (Hochman et al., 2021). Feature selection was made using the stepwise backward method, which starts modeling with all features and successively eliminates the least important feature in iterative steps until all features are removed from the model. Results were similar across the four groups with full dataset [ratio of income to poverty (RIP), GGT, glucose, triglyceride and RDW, AUC=0.83], overweight and obesity (GGT, RIP, creatinine, RDW and glucose, AUC=0.80), diabetes (GGT, eosinophils, RIP, basophils and eosinophils, AUC=0.82) and patients with metabolic syndrome (RIP, GGT, eosinophils, bilirubin and basophils, AUC=0.82). Table 7 Despite the developed models accounting for the features selected in the first study, namely, glucose and RDW (full dataset and overweight and obesity), and bilirubin (patients with metabolic syndrome), the results of internal validation did maintain the performance in the external validation dataset (AUC, average=0.66); this fact compromises the predictive ability of the developed models.
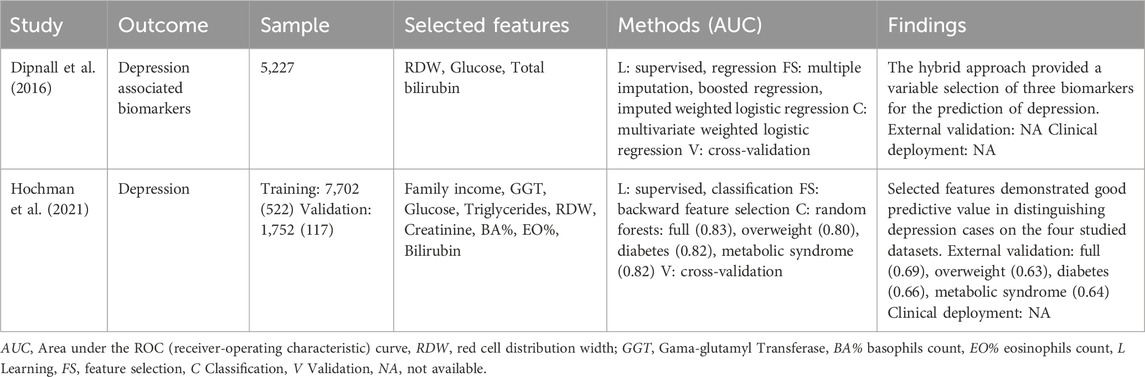
Table 7. Machine-learning-based routine blood tests for the diagnosis (or prognosis) of mental, behavioral, or neurodevelopmental disorders.
Diseases of the circulatory system (ICD-10 class IX)
Outcomes related to the reviewed circulatory system diseases include the prognosis of postoperative blood coagulation in children with congenital heart disease and the diagnosis of cardiac workload and ischemic stroke. Numerous studies refer to associations between blood analysis and diseases of the circulatory system. However, known routine blood tests associated with heart disease are the low levels of sodium and chloride and the elevated levels of erythrocytes, hematocrit, RDW, urea, and c-reactive protein. The prognosis of postoperative blood coagulation in children was assessed by comparing three different classifiers (decision trees, naïve-Bayes, and support vector machines). Applying recursive feature elimination resulted in seven features, age being the most relevant (Table 8). Traditional statistical tests also evaluated relevant features, which confirmed the significance among the compared groups (abnormal vs. normal blood coagulation). This statistical verification also supports the model’s reliability, which achieved accuracy values of 75% in internal validation based on a typical CBC. The cardiac workload is generally measured by the rate pressure product (RRP), which is the product between systolic blood pressure and heart rate. The study from Shou et al. evaluated how blood parameters predicted the biochemical profile related to the resting RRP through the analysis of 55,730 individuals (Shou et al., 2021). The supervised regression task was accomplished by comparing a linear regression model (r=0.352) and a tree-based model, XGBoost (r=0.377). The authors found that glucose alone predicted rRRP with a Pearson correlation of 0.247 in the linear model and 0.245 in the non-linear model; total protein and neutrophils count were responsible for the additional variance, exhibiting the recognition ability of ML-based approaches to find new biomarkers. Indeed, Zheng et al. followed a similar strategy for ischemic stroke (Zheng et al., 2022). Ischemic stroke is still a major burden due to the high number of miss-diagnosed (or late) cases due to challenges related to the triaging process. Four feature selection techniques (univariate logistic regression, least absolute shrinkage and selection operator regression, recursive feature elimination, and the spearman correlation) were applied to the training set, reducing 41 to 15 features. Model development was assessed by comparing six algorithms (XGBoost, RF, NN, LR, gaussian NB, KNN); XGBoost showed the best performance with an accuracy of 0.84, 0.83, and 0.86 in training, internal validation, and external validation, respectively. The model was further analyzed by explaining techniques (permutation feature importance, local-interpretable model-agnostic, and Shapley additive explanations) endorsing the importance of neutrophils count, total protein, HDL-cholesterol, and hemoglobin. Aiming for a future clinical deployment, the model was also made available online for prospective validation.
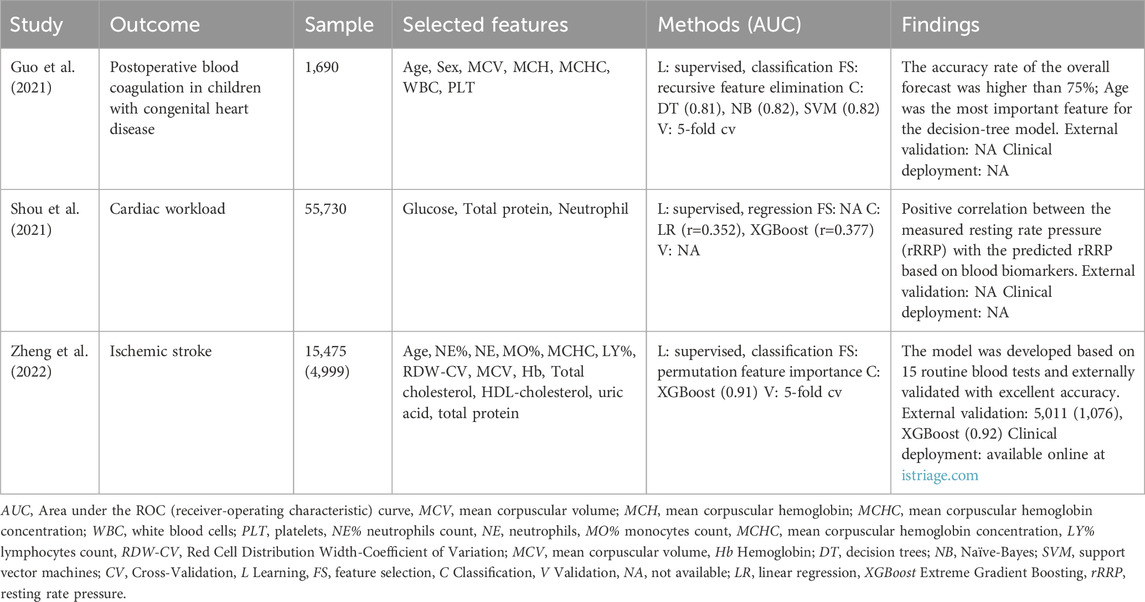
Table 8. Machine-learning-based routine blood tests for the diagnosis (or prognosis) of circulatory system diseases.
Diseases of the respiratory system (ICD-10 class X)
Regarding respiratory system diseases, we present here one study related to asthma. Given the impact of smoking on respiratory function, we included a study with AI and smoking-related disorders in the review. Routine blood metabolites associated with smoking were the high levels of erythrocytes, hematocrit, leukocytes, triglycerides, and the low levels of HDL-cholesterol, none related to asthma. Indeed, the study of Mamoshina et al. found that HDL-cholesterol was the principal feature for the classification of the smoking status, along with hemoglobin, RDW, and mean cell volume (Mamoshina et al., 2019). These findings were accomplished after an iterative analysis that started with the prediction (regression) of biological age based on routine blood tests. The feature importance shows HbA1C, urea, glucose, and ferritin as the most important (training). The 24 features selected were used to predict age in smokers (r2=0.55) and non-smokers (r2=0.57), showing a potential impact of smoking in the prediction. The addition of the feature ‘smoking status’ improved the three tested regression models from 0.56 to 0.57 (23–24 features), 0.54 to 0.58 (20–21 features), and 0.55 to 0.60 (18–19 features) in the prediction of biological age. Authors also found, based on the same models of 23, 20, and 18 features, the ability to predict the ‘smoking status’ with an accuracy of 0.82 (equivalent for the three models), with HDL-cholesterol, hemoglobin, RDW, and MCV the most relevant features for the prediction. The study from Zhan et al. employed a Mahalanobis-Taguchi system (MTS) to classify asthma patients (Zhan et al., 2020). The algorithm was approached by constructing the Mahalanobis space (collection and distance calculation of the standardized normal and abnormal data), with further identification of useful variables (orthogonal arrays and signal-to-noise ratios for threshold definition and roc curve analysis). Results achieved with the proposed algorithm were compared with an SVM model, where the same features (selected by Pearson correlation) predicted asthma patients with similar accuracy (Table 9). The authors claim a more straightforward interpretability of the model by calculating the Mahalanobis distance (MD) with the values of PDW, MPV, WBC, eosinophils count, lymphocytes count, and MCHC data.
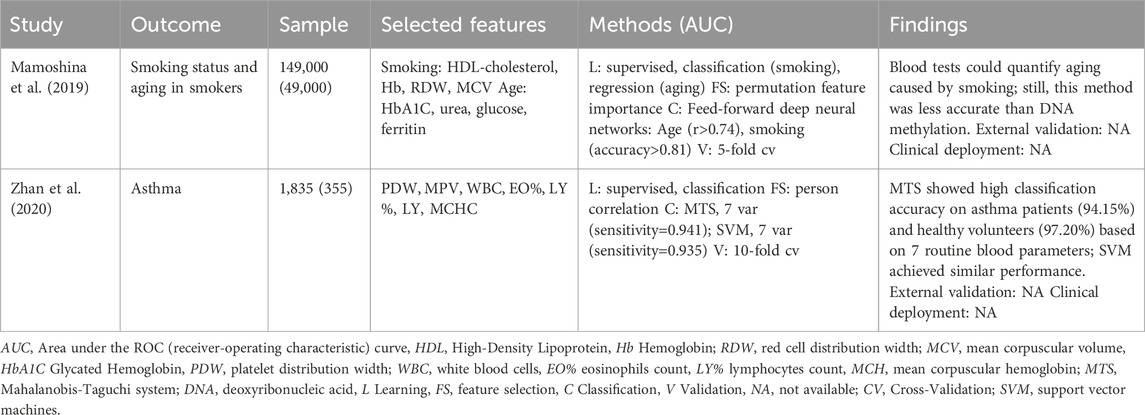
Table 9. Machine-learning-based routine blood tests for respiratory system disease diagnosis (or prognosis).
Diseases of the digestive system (ICD-10 class XI)
For digestive system diseases, we focused on studies applying supervised classification methods to diagnose conditions related to liver disease. In general, pathologies related to the liver split into four stages: the inflammation stage [induced by hepatitis B virus (HBV), hepatitis C virus (HCV), alcoholic liver disease (ALD), and nonalcoholic fatty liver disease (NAFL)], the fibrosis stage, the cirrhosis stage and the worst stage related to liver cancer or failure (Tian et al., 2022). Regarding inflammation, Fialoke et al. studied the discrimination between non-alcoholic steatohepatitis (NASH) and simple steatosis in NAFL (Fialoke et al., 2018). Since NASH is underdiagnosed due to the lack of patient symptoms and relevant biomarkers (high values of AST and ALT), the authors trained 4 ML algorithms with the available data: demographics, the maximum, minimum, and mean values of AST, ALT, AST/ALT, PLT, and the binary diabetes condition. 5-fold cross-validation displayed the model’s AUC higher than 0.83, being XGBoost the top classifier (AUC=0.876) with the potential to perform external discrimination with promising results. Ma et al. also approached the inflammation stage by diagnosing NAFDL in a cross-sectional study of 10,030 individuals with a prevalence of 24% (Ma et al., 2018). Four techniques were used for feature selection, and 11 ML algorithms were trained. Selected five biomarkers (Table 10) resulted in different performance metrics across the tested traditional (KNN, SVM, LR, NB, BN, DT), ensemble (AdaBoost, bagging, RF), and extension algorithms (hidden naïve-Bayes, aggregating one-dependence). Since F-measure (harmonic mean between precision and recall) was considered the most important metric, the Bayesian network achieved the best model (F-measure=0.655). Comparisons with current diagnostic scores such as the FLI [calculated with triglycerides, BMI, GGT, waist circumference (F-measure=0.318)], and HIS [estimated with the values of AST, ALT, BMI, diabetic condition, and gender (F-measure=0.524)] demonstrated a superior diagnostic ability of the developed Bayesian network. Cao et al. evaluated HBV-induced liver cirrhosis (inflammation and cirrhosis stages) by studying seven routine blood tests enhanced by a multilayered perceptron and a naïve-Bayes algorithm (Cao et al., 2013). Both classifiers exhibited higher AUC in the internal validation (MLP, AUC=0.942, and NB, AUC=0.899) rather than the training, with better performance for the MLP (MLP, AUC=0.900, and NB, AUC=0.831). This study also compared the ML metrics with the currently used scores APRI (AUC=0.726), gauged with the AST to PLT index, and the FIB-4 (AUC=0.817), calculated with the age, PLT, AST, and ALT levels, with the MLP classifier shown superior performance, enabling a potential reduction in the number of biopsies to perform diagnosis. The worst stage of liver disease–liver failure - was studied by Peng et al. to create a forecast model to predict patient deterioration after hospitalization. This type of prediction is routinely assessed through the model for end-stage liver disease (MELD) calculated using the values of creatin, total bilirubin, standardized prothrombin ratio (INR), and the etiology of the disease. In opposition, the authors used a database of 15 clinical metabolites kept for modeling determined by hepatologists; only variables with high missing values were discarded. Except for the GLM model, all other models (AUC>0.794) outstand the classification performance of the MELD (AUC=0.699). However, the limitation of the sample size (n=348) reinforces the need to perform validation in a high number of subjects. Finally, Yao et al. approached non-specific liver disease by deep learning on the largest dataset (n=76,914), which comprised 12,688 patients with different stages of liver disease (Yao et al., 2020). The application of a dense deep neural network (DNN) was compared with standard logistic regression and random forests. The network was explored based on the network width (number of neurons per hidden layer) and dropout rate. Widths of 512 (AUC=0.8919) and 1,024 (AUC=8,922) were compared along with dropouts of 0.3 (AUC=0.8812), 0.4 (AUC=0.8891), 0.5 (0.8919), 0.6 (0.8904), and 0.7 (0.8856). Feature importance was assessed with random forests (for reference) since DNN and DenseDNN are black-box algorithms with poor explainability. Global results achieved excellent internal validation (AUC>0.87) except for logistic regression (AUC=0.79). Indeed, a significant improvement was not verifiable between an explainable random forest and the deep learning approaches for diagnosing non-specific liver disease. The fibrosis stage and liver cancer have not been approached yet.
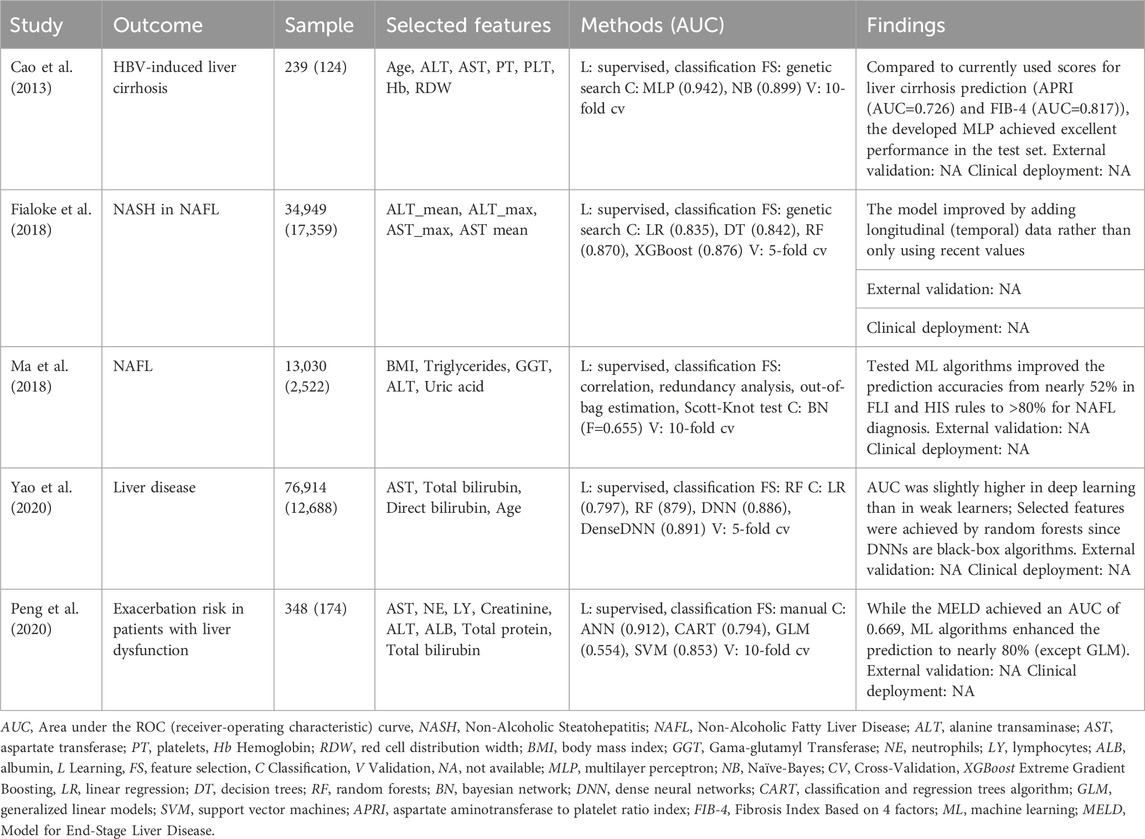
Table 10. Machine-learning-based routine blood tests for the diagnosis (or prognosis) of digestive system diseases.
Diseases of the genitourinary system (ICD-10 class XIV)
Concerning disorders of the genitourinary system, we focus on chronic kidney disease (CKD). CKD lacks early diagnosis since obvious symptoms only appear in an advanced stage of the disease wherein the patient’s renal function declines with a glomerular filtration rate (GFR) of 60 mL/min/1.73 m2 (Tarwater, 2011). The need to create screening procedures that perform early diagnosis motivated several studies for routine blood and urine analysis. Indeed, the study of Mahfuz et al. evaluated 250 CKD patients in a cohort of 400 individuals with information regarding urine (specific gravity, albumin, sugar, red blood cells, pus cell, pus cell clumps, bacteria) and blood (glucose, urea, creatinine, sodium, potassium, hemoglobin, packed cell volume, white blood cell count and red blood cell count) metabolites. The authors performed training on five algorithms and performed feature importance based on the SHAP technique, reducing the number of features from 24 to 13 in concordance between tested gradient boosting, random forest, and extreme gradient boosting. With the 13 selected features, the authors manually split the dataset into six different subsets: all features, blood and others, urine and others, only blood, only urine, and only others. A new train-test cycle applied to these subsets resulted in a classification accuracy ranging from 76% to 99%. Interestingly, results were very similar between all features (RF, AUC=0.99) and only blood (RF, AUC=0.97), with slight variations between the tested classifiers. (Table 11) While this study provides an interesting interpretation approach to CKD screening based on different bundles of metabolites (SHAP explained), it lacks sample size, which limits the findings.

Table 11. Machine-learning-based routine blood tests for the diagnosis (or prognosis) of diseases of the genitourinary system.
Codes for special purposes (ICD-10 class XXII)
Lastly, we included an analysis for special purposes ICD-10 codes, in which, for instance, the coronavirus 2019 (COVID-19) disease is included. COVID-19 is caused by the severe acute respiratory syndrome coronavirus 2 (SARS-CoV-2); noticeably, it received particular interest in AI-based diagnostics. First reported in November 2019, this virus emerged as a pandemic in March 2020, accounting for 563M infections (Our World in data, 2023) and 6.37M deaths (Data, 2023). The evolution of the virus was irregular, and its spread was facilitated by the struggle to achieve a real-time diagnosis able to distinguish between real positive COVID-19 infections from other viral and bacterial respiratory infections. Indeed, the symptomatology of COVID-19 remains challenging to differentiate from other infections: 40% of patients display mild disease (fever, cough), 40% show moderate disease (pneumonia), 15% are severe (shortness of breath), and 5% refers to critical illness (ICU admission) (Wu and McGoogan, 2020). Additionally, 9–12 days is the average time for ICU admission, with a median length of stay of 9 days. The median length of mechanical ventilation is 8.4 days, and COVID-19 mortality in the ICU is nearly 30% (Auld et al., 2021). Regarding diagnosis, reverse transcription polymerase chain reaction (RT-PCR) and computerized tomography (CT) images are still recognized technologies for determining viral infection. However, both methods comprise disadvantages: CT yields radiation (inherently endorses the risk of cancer development), it is bulk, expensive and hinders the possibility of performing screening. RT-PCR tests are less costly, available in higher volume, and offer a specificity close to 100% and, depending of the primers and strain, a remarkably high sensitivity (Böger et al., 2021). RT-PCR tests require laboratory specialists and infrastructure and produce a 15% false-positive rate on 48–72 h of turnaround time. Rapid diagnostic tests (RDTs) emerged as a point-of-care solution to facilitate access to diagnosis and reduce dependence on laboratory infrastructures. There are more than 400 RDTs commercially available, based on two technologies: antigen-based (immunoassays) to detect domains of the surface proteins of the virus and molecular nucleic acid amplification tests (NAATs) that reveal the presence of viral gene targets (Diagnostics for All, 2023). The criteria for approval and commercialization of RDTs are based on a sensitivity superior to 80% and specificity above 98% (World Health Organization, 2021), tested on a prospective cohort study involving less than 30 persons infected with SARS-CoV-2 and 30 persons without the infection (Food and Drug Administration. Emergency use authorizations for medical devices, 2021). Accepted by the Food and Drug Administration (FDA), these standards do not require independent verification of clinical validation provided by each test manufacturer. Indeed, several studies reported varying degrees of sensitivity (36%–82%) and specificity (98%–100%) when these RDTs are tested in asymptomatics (Prince-Guerra et al., 2021). Notably, most validation studies conducted for RDTs were performed before the appearance of new variants, namely, delta and omicron. The WHO, CDC, and European Center for Disease Prevention and Control guidelines advise using these point-of-care solutions for diagnosing symptomatic persons and screening asymptomatic individuals. Despite the growing need for these solutions, especially in underdeveloped countries, supply-chain limitations hinder the availability and consequent clinical relevance of these tests.
COVID-19 researchers and clinicians explored AI state-of-the-art learning techniques to find alternatives for COVID-19 forecasting, management, surveillance, and recognizing scalable and cost-effective ways to deal with the pandemic. Regarding diagnosis, several studies emerged in mid-April 2020 through the study of routine blood tests using proprietary datasets (single center), characterized by low sample size (n<1,000) and mostly without external validation. Joshi et al. provided an interesting methodology, modeling diagnosis using an L2-regularized logistic regression trained only with levels of hematocrit, neutrophils, and lymphocytes, achieving an internal validation (AUC=0.78) that was consistent with the evaluation performed in four different sites (average AUC=0.77) (Joshi et al., 2020). Brinati et al. also used logistic regression but compared the classification performance with a random forest classifier, using 14 features (Table 12) (Brinati et al., 2020). Results were very similar among the internal test set, but the decision tree provided larger comprehension with AST (<25.4) and lymphocytes (<1.3) as major predictors of COVID-19 negativity. Alves et al. also employed a random forest classifier compared with five algorithms in which the ensemble achieved the best internal classification (AUC=0.87) (Alves et al., 2021). A decision tree explained the model, and criteria graphs allowed a visual interpretation of the association between selected blood parameters. An artificial neural network was designed by Banarjee et al. in comparison with a random forest and a lasso-elastic-net regularized generalized linear model (fitting a logistic regression) (Banerjee et al., 2020). The network was tested in community individuals (n=619) and patients in the hospital regular ward (n=69). While ANN and RF presented the best metrics for hospitalized and non-hospitalized patients, the glmnet identified a decreasing pattern in monocytes, leukocytes, eosinophils, and platelets that was applied to a logistic regression achieving an AUC of 0.85. The ensemble designed by Abayomi-Alli et al. was built under a small dataset (n=279), taking the input of 16 features. Comparisons were made between 15 classifiers wherein the ExtraTrees (AUC=0.99) and the AdaBoost (AUC=0.98) outperformed the remaining models. Wu et al. also achieved similar internal classification values using a slightly larger cohort (n=603) and a novel dynamic ensemble selection method, first approached with data imbalance techniques and modeled with a hybrid clustering with a posterior bagging classifier (Wu et al., 2021). The authors achieved better results with the hybrid approach rather than by using the bagging approach, tested in divisions 70:30 and 60:40 and with 5-fold cross-validation. Contrary to previous supervised studies, Souza et al. reported an unsupervised clustering approach based on self-organizing maps that detected positive COVID-19 patients with a discrimination power of 83% (LDA model) (Souza et al., 2021). This clustering approach was performed on 599 registers, of which only 81 were COVID-19 positive. It identified WBC, BA, EO, and RDW as features with a strong influence on clustering performance but was ambiguous regarding the feature range in outcome prediction. While reviewed studies improved the accuracies supported with more complex ML algorithms, the studies with higher sample sizes (n>1,000) showed a similar increase in classification metrics in concordance with the addition of blood features. In a cohort of 1,537 participants, Tschoellitsch et al. achieved a moderate AUC of 0.74 and a negative predictive value of 98%, which agreed with previous results using random forest (Tschoellitsch et al., 2021). Cabitza et al. described a novel methodology comprising cardinality and similarity as metrics of model’s reliability in external validation settings (Cabitza et al., 2021). Considering data regarding demographics and complete blood cell count, the SVM with RBF kernel was applied to eight different external datasets with AUC ranging from 0.66, 0.75, 0.80, 0.83, 0.87, 0.89, 0.97 and 0.98 and similarity values (according to the degree of correspondence) of 0.315, 0.341, 0.348, 0.444, 0.323, 0.447, 0.439, and 0.445, respectively. Babaei et al. compared the performance of 12 ML algorithms in three different datasets. In the third dataset, all algorithms’ comparison performance exhibited DNN with the higher classification metrics (Table 12) (Babaei et al., 2022). Interestingly, the previous studies of Brinati et al. (Brinati et al., 2020), and Cabitza et al. (Cabitza et al., 2021), were also compared with DNN surpassing in the first dataset (AUC=0.92 vs. AUC=0.84, from Brinati et al. (Brinati et al., 2020)) and the second dataset (AUC=0.93 vs. AUC=0.84, from Cabitza et al. (Cabitza et al., 2021)), highlight deep neural networks as a promising approach for COVID-19 diagnosis. Plante et al. used a large cohort of 66 hospitals to perform an internal and external validation of an extreme gradient boosting tree based on 15 features. The external validation performed in 23 different hospitals led to the validation of the methodology (AUC=0.91) and allowed a deeper comprehension of the best cutoff score, independently of the disease prevalence (studied for 1%, 10%, and 20%). Campagner et al. validated six algorithms in two different sites (Bergamo, n=245 and Desio, n=337) with 42% and 48% of COVID-19 positive cases (Campagner et al., 2021). The models achieved an AUC always higher than 93%, with SVM achieving the best results on both external sets. Violin plots of specific key CBC parameters showed high similarity between the training and validation cohorts, namely, in white blood cells, neutrophils, lymphocytes, red blood cells, platelets count, and patient’s age, which justifies the stability in the model’s performance. Chadaga et al. used similar approaches in two public datasets: the Albert Einstein hospital in Brazil [n=5,644, RF (AUC) = 0.80] and the Dr. TMA Pai hospital in India [n=1,169, RF (AUC) = 0.99]. While both studies used smote to resolve imbalanced data, the second study used explainable methods to describe how parameters influenced the final decision. Significant improvements in performance metrics were observed (especially through the comparison of the same RF algorithm). Nonetheless, neither study has received external validation.
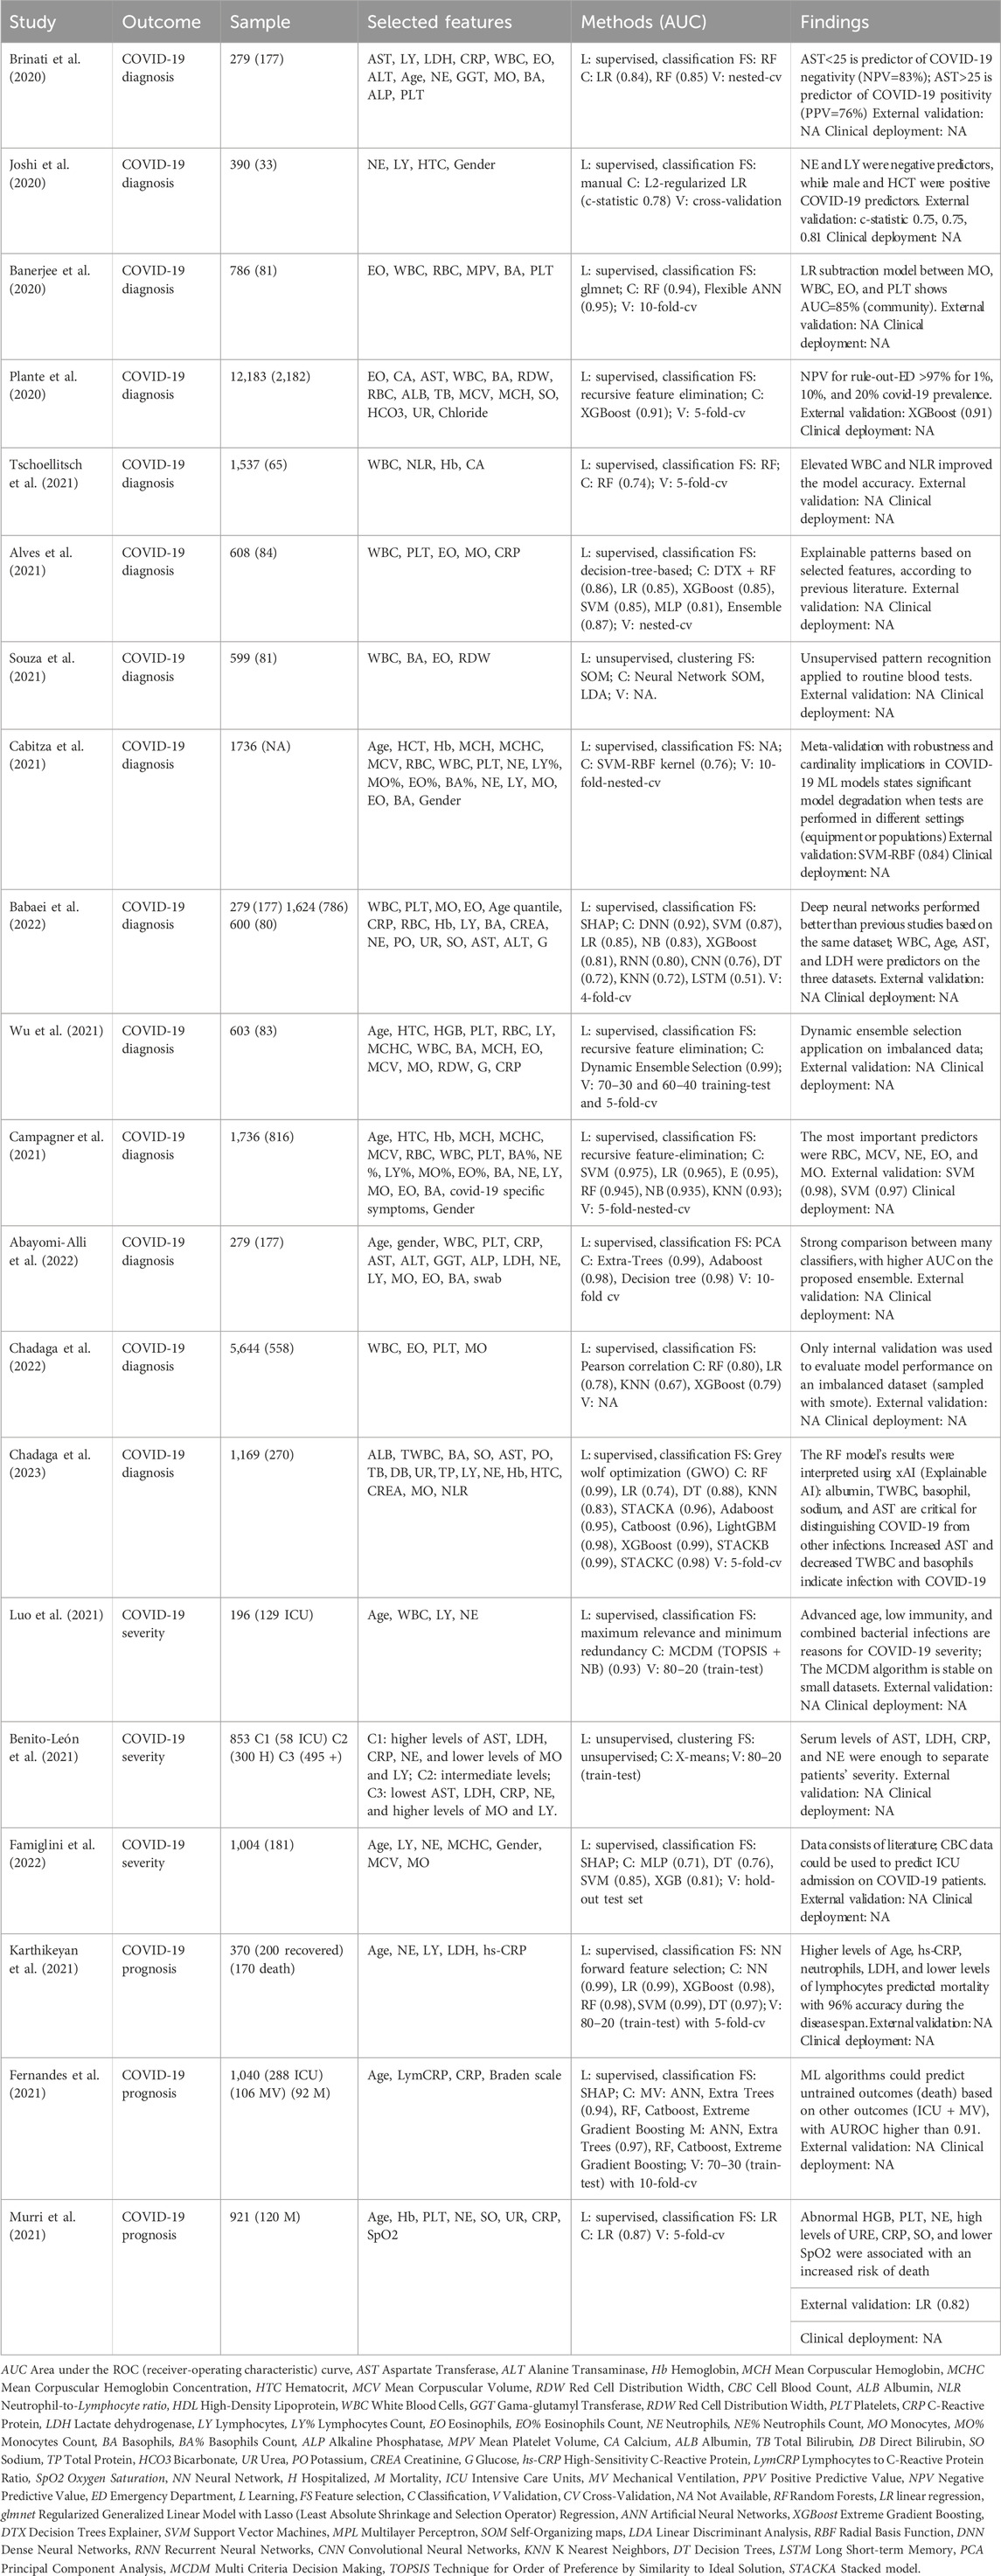
Table 12. Machine-learning-based routine blood tests for the diagnosis (or prognosis) of COVID-19.
Regarding the diagnosis of COVID-19 severity, Benito-León et al. used a non-supervised clustering model (X-means) to differentiate intensive-care, hospitalized, and non-hospitalized positive patients (Benito-León et al., 2021). According to the David Bouldin index (lowest value refers to best cluster distribution with higher intercluster distance and lower intracluster distance), the algorithm defined three clusters (Manhattan distance = 0.701). Relevant features are in Table 12 for the differentiation among clusters, assessed by the p-values and effect size. Famiglini et al. used a supervised classification approach for predicting ICU admission in a cohort of 1004 COVID-19 patients, with only 18.3% admitted to the ICU (imbalanced data) (Famiglini et al., 2022). Data curation (imputation and bias evaluation) and model selection resulted in better AUC score (classification=0.85), lower Brier score (calibration=0.144), and standardized net benefit (clinical utility=0.69), predicting ICU admission with significant importance of the NLR levels (consistent with the literature). Luo et al. also studied this outcome (mild, n=67 and severe, n=129) with the application of a hybrid system built on multi-criteria decision-making (MCDM) through the combination of a technique for order of preference by similarity to ideal solution (TOPSIS) algorithm and a naïve-Bayes classifier. TOPSIS runs preprocessing and feature ranking while NB performs feature selection. Despite this method achieving a higher AUC (0.93), the sample size was small and did not include external.
Murri et al. developed models for the prognosis of COVID-19 by developing an interpretable logistic regression model constructed with data from 921 hospitalized patients, of which 120 died (prevalence of 13%) (Murri et al., 2021). Despite the discriminatory ability assessed through the levels of hemoglobin, platelets, neutrophils, urea, c-reactive protein, and sodium was higher (AUC=0.87), the subsequent external validation on a population with a prevalence of 22.6%, decreased (AUC=0.81). Fernandes et al. extended the discriminative ability for fatality, invasive mechanical ventilation, and ICU (multipurpose algorithms) (Fernandes et al., 2021). Considering fewer features (age, lymphocyte-to-c-reactive-protein ratio, c-reactive protein, and results from the Braden scale), the authors concluded that each of the studied outcomes (ICU, IMV or fatality) could be predicted using data from the others (outcomes), always with an AUC>91%. In the study of Karthikeyan et al., higher predictive performance was accomplished by applying an XGBoost for feature importance and a neural network for feature selection on a dataset comprised of deceased (n=170) and recovered (n=200) patients. Selected features predicted the number of days until the outcome, and accuracy results were consistently higher than 90% for models trained until 12 days before the outcome (with data not only from the closest days–case 2). Notably, the authors also showed blood patterns related to mortality prediction, such as high values of hs-CRP, LDH, and neutrophils and low values of eosinophils, consistent with previous literature.
Challenges
Despite the rising developments in AI reinforced by big data, computational power, and neural networks enhanced the quality of studies relating routine blood analysis with principal diagnosis and prognosis outcomes, the clinical deployment stage remains a foremost challenge. The studies and the pathologies we reviewed confirm the delay in implementing AI-based technology in the clinical setting. The research highlighted in this review was motivated by the available statistical information expressing significant associations between blood metabolites and numerous pathologies and by the opportunity provided by the high number of general health panels typically performed in a medical health center. As referred, these analytical panels include complete cell blood count, metabolic and lipidic that are currently consistently evaluated with gold-standard, highly stabilized techniques, not prone to systematic errors or bias. A vast amount of non-appraised clinical information cannot be 100% perceived by a single clinician acting in a consultation or emergency setting (especially in longitudinal profiles) that can be processed, patterned, statistically evaluated, and flagged, if necessary. Since current clinical decisions are accomplished in a framework of rule-based systems, i.e., thresholds passively updated according to newer guidelines, the primary reasons that explain the resistance to ML-based solutions are the necessity to use external applications (which require manual data input and consumed extra time), and the non-interpretability of ML algorithms, especially the ones concerned to deep learning (‘black-box’). Indeed, a recent study by Henry et al. evaluated the adoption of a AI-based sepsis targeted real-time early warning system (TREWS); these authors found a lack of interpretability of the computation model, but this was not considered a significant barrier, especially after experiencing the system through different patients and following interactions with peers and research team members (Henry et al., 2022). On the other hand, the theoretical ‘competing diagnosis’ may be perceived as threat to autonomy by some physicians, making them hesitant in adopting these solutions because it may alter their decision-making process with the risk of acting solely on model recommendations, which may not be completely accurate.
Regarding routine blood analysis, data sources (i.e., equipment, disease incidence, patient demographics) with different reference values should also be evaluated and discussed. The study should distinctly report information regarding the data source type (cohort, randomized control trial, or other), data source quality (representativeness, bias, features, and outcome with the exact time of measurement and associated medication or treatment), and data source quantity. People’s biochemical fingerprint variates in basal conditions for several reasons; most have little to do with their clinical condition. Re-test studies could ultimately elucidate if the AI model’s predictions connect to features that correlate with the problem of interest or if they only capture external variabilities, such as sensor noise, ambient temperatures, user manipulation, etc. (Stegmann et al., 2020)
Considering the evaluation of the reviewed medical applications, only a few were performed in external centers, and most were conducted with retrospective data. Therefore, working with data matching the same conditions met in traditional clinical settings is essential, principally user interface (i.e., healthcare professionals or patients) and technology integration into the clinical workflow (physical conditions such as illumination, temperature, humidity, and others). Curiously, a recent evaluation in a prospective assessment regarding the performance of a deep-learning system for the detection of diabetic retinopathy demonstrated a ‘larger-than-expected proportional of the retinal images as ungradable owing to blurring or darkening’, caused by poor ambient lighting during the measurement procedure (Co-operation, 2021). Regarding COVID-19 prediction models, one study found that the underlying data distribution, known as domain shifts, significantly impacts anticipated performance and dependability, resulting in model failure in clinical applications. Domain shifts, which can be induced by changes in disease prevalence, adjustments to RT-PCR testing protocols, or viral mutations, suggest that machine learning models may lose reliability and performance over time, underlining the importance of constant monitoring and updating (Roland et al., 2022). These examples emphasize how training should incorporate the original conditions to generate truthful coefficients for the desired problem-solving.
These challenges should be revised and improved by consistently implementing the described ML pipeline to develop federated learning (training in multiple institutions) and the deployment in ETL (i.e., extract, transform and load), keeping data ‘healthy’.
Future perspectives
The deployment of a cost-free real-time blood augmentation diagnostic tool, based on longitudinal data and source-stable (gold-standard), should address probabilistic metrics of diagnosis and provide the clinician with a landscape view for each individual. AI can play a key role in delivering explainable decision support systems to assure that patterns are correctly identified, and biomarkers are accurately measured, directly influencing the outcome. Measures of clinical effectiveness, such as user feedback, clinical reliance, and interpretability, must improve and be better described, particularly in the upcoming guidelines for model development and reporting (TRIPOD-ML). Although this protocol is still under development, The Transparent Reporting of a multivariate prediction model for Individual Prognosis or Diagnosis (TRIPOD, 2015) standard (Collins et al., 2015) should be considered since It provides guidance and recommendations for reporting a multivariate prediction model for diagnosis or prognosis. Representativeness, in particular, should always be addressed because it is an essential concept in data quality, covering the necessary heterogeneity of the studied population in a balanced proportion, which is especially important when models aim to predict categorical or binary events in the context of medical problems.
In the future, deploying ML models will still face data shifts across time, hindering representativeness and compromising the model’s performance. A paramount example refers to the performance of the covid-19 models trained during the initial alpha strain with the current disease condition, led by several other variants of the virus, and the influence of the addition of vaccines that altered disease outcomes for the vast majority of infected individuals. Therefore, deployment should start with isolated pilot studies to receive feedback from healthcare experts on user experience, interface, efficiency, and real-time evaluation performance.
Outlook
This review summarizes the application of artificial intelligence algorithms in the diagnosis and prognosis of ICD-10 disorders using routine blood tests only. Reports herein analyzed differ in data source type, quality, and quantity and describe a multitude of ML algorithms for outcome prediction. Principal findings indicate virtuous performance metrics in validation studies and a clear gap between standard disease-associated metabolites and those chosen machine learning models, resulting in higher performance metrics than traditional clinical practice scores.
Although there is still a sizable gap between reviewed studies and their clinical application, AI is changing the practice of medicine, and digital tools are key for helping physicians evaluate patients more personalized, rapid, and efficiently. The use of routine blood parameters as exclusive input features for model development could allow the translation of high-level diagnosis from primary or secondary care to point-of-care, making these analyses more valuable in lowering time to diagnosis and overall healthcare costs.
Author contributions
MS-S: Data curation, Investigation, Methodology, Writing–original draft. NS: Conceptualization, Formal Analysis, Funding acquisition, Supervision, Writing–review and editing. JS: Conceptualization, Data curation, Formal Analysis, Methodology, Supervision, Validation, Writing–review and editing.
Funding
The author(s) declare financial support was received for the research, authorship, and/or publication of this article. MS-S received a PhD fellowship from the Foundation for Science and Technology (FCT, Portugal)/FEDER.
Conflict of interest
The authors declare that the research was conducted in the absence of any commercial or financial relationships that could be construed as a potential conflict of interest.
The author(s) declared that they were an editorial board member of Frontiers, at the time of submission. This had no impact on the peer review process and the final decision.
Publisher’s note
All claims expressed in this article are solely those of the authors and do not necessarily represent those of their affiliated organizations, or those of the publisher, the editors and the reviewers. Any product that may be evaluated in this article, or claim that may be made by its manufacturer, is not guaranteed or endorsed by the publisher.
References
Abayomi-Alli, O. O., Damaševičius, R., Maskeliūnas, R., and Misra, S. (2022). An ensemble learning model for COVID-19 detection from blood test samples. Sensors 22, 2224. doi:10.3390/s22062224
Ahmad, Z., Rahim, S., Zubair, M., and Abdul-Ghafar, J. (2021). Artificial intelligence (AI) in medicine, current applications and future role with special emphasis on its potential and promise in pathology: present and future impact, obstacles including costs and acceptance among pathologists, practical and philosoph. Diagn. Pathol. 16, 1–16. doi:10.1186/s13000-021-01085-4
Alsuliman, T., Humaidan, D., and Sliman, L. (2020). Machine learning and artificial intelligence in the service of medicine: necessity or potentiality? Curr. Res. Transl. Med. 68, 245–251. doi:10.1016/j.retram.2020.01.002
Alves, M. A., Castro, G. Z., Oliveira, B. A. S., Ferreira, L. A., Ramírez, J. A., Silva, R., et al. (2021). Explaining machine learning based diagnosis of COVID-19 from routine blood tests with decision trees and criteria graphs. Comput. Biol. Med. 132, 104335. doi:10.1016/j.compbiomed.2021.104335
Auld, S. C., Harrington, K. R. V., Adelman, M. W., Robichaux, C. J., Overton, E. C., Caridi-Scheible, M., et al. (2021). Trends in ICU mortality from coronavirus disease 2019: a tale of three surges. Crit. Care Med. 50, 245–255. doi:10.1097/ccm.0000000000005185
Azarkhish, I., Raoufy, M. R., and Gharibzadeh, S. (2012). Artificial intelligence models for predicting iron deficiency anemia and iron serum level based on accessible laboratory data. J. Med. Syst. 36, 2057–2061. doi:10.1007/s10916-011-9668-3
Babaei, S., Sorayaie, A., Ghafari, A., and Bagherzadeh, J. (2022). COVID-19 diagnosis from routine blood tests using artificial intelligence techniques. Biomed. Signal Process Control. doi:10.1016/j.bspc.2021.103263
Bajwa, J., Munir, U., Nori, A., and Williams, B. (2021). Artificial intelligence in healthcare: transforming the practice of medicine. Future Healthc. J. 8, e188–e194. doi:10.7861/fhj.2021-0095
Banerjee, A., Ray, S., Vorselaars, B., Kitson, J., Mamalakis, M., Weeks, S., et al. (2020). Use of machine learning and artificial intelligence to predict SARS-CoV-2 infection from full blood counts in a population. Int. Immunopharmacol. 86, 106705. doi:10.1016/j.intimp.2020.106705
Barnhart-Magen, G., Gotlib, V., Marilus, R., and Einav, Y. (2013). Differential diagnostics of thalassemia minor by artificial neural networks model. J. Clin. Lab. Anal. 27, 481–486. doi:10.1002/jcla.21631
Benito-León, J., del Castillo, M. D., Estirado, A., Ghosh, R., Dubey, S., and Serrano, J. I. (2021). Using unsupervised machine learning to identify age- and sex-independent severity subgroups among patients with COVID-19: observational longitudinal study. J. Med. Internet Res. 23, 259888–e26014. doi:10.2196/25988
Benjamens, S., Dhunnoo, P., and Meskó, B. (2020). The state of artificial intelligence-based FDA-approved medical devices and algorithms: an online database. npj Digit. Med. 3, 118. doi:10.1038/s41746-020-00324-0
Bernardini, M., Morettini, M., Romeo, L., Frontoni, E., and Burattini, L. (2019). TyG-er: an ensemble Regression Forest approach for identification of clinical factors related to insulin resistance condition using Electronic Health Records. Comput. Biol. Med. 112, 103358. doi:10.1016/j.compbiomed.2019.103358
Böger, B., Fachi, M. M., Vilhena, R. O., Cobre, A. F., Tonin, F. S., and Pontarolo, R. (2021). Systematic review with meta-analysis of the accuracy of diagnostic tests for COVID-19. Am. J. Infect. Control 49, 21–29. doi:10.1016/j.ajic.2020.07.011
Brendan McMahan, H., Moore, E., Ramage, D., and Hampson, S., Communication-Efficient learning of deep networks from decentralized data. 54, 10 (2017).
Brinati, D., Campagner, A., Ferrari, D., Locatelli, M., Banfi, G., and Cabitza, F. (2020). Detection of COVID-19 infection from routine blood exams with machine learning: a feasibility study. J. Med. Syst. 44, 135. doi:10.1007/s10916-020-01597-4
Bruckert, S., Finzel, B., and Schmid, U. (2020). The next generation of medical decision support: a roadmap toward transparent expert companions. Front. Artif. Intell. 3, 507973–508013. doi:10.3389/frai.2020.507973
Cabitza, F., Campagner, A., Soares, F., García de Guadiana-Romualdo, L., Challa, F., Sulejmani, A., et al. (2021). The importance of being external. methodological insights for the external validation of machine learning models in medicine. Comput. Methods Programs Biomed. 208, 106288. doi:10.1016/j.cmpb.2021.106288
Campagner, A., Carobene, A., and Cabitza, F. (2021). External validation of machine learning models for COVID-19 detection based on complete blood count. Health Inf. Sci. Syst. 9, 37–15. doi:10.1007/s13755-021-00167-3
Cao, Y., Hu, Z.De, Liu, X. F., Deng, A. M., and Hu, C. J. (2013). An MLP classifier for prediction of HBV-induced liver cirrhosis using routinely available clinical parameters. Dis. Markers 35, 653–660. doi:10.1155/2013/127962
Celkan, T. T. (2020). What does a hemogram say to us? Turk pediatri arsivi 55, 103–116. doi:10.14744/TurkPediatriArs.2019.76301
Chadaga, K., Prabhu, S., Bhat, V., Sampathila, N., Umakanth, S., and Chadaga, R. (2023). A decision support system for diagnosis of COVID-19 from non-COVID-19 influenza-like illness using explainable artificial intelligence. Bioengineering 10, 439. doi:10.3390/bioengineering10040439
Chadaga, K., Prabhu, S., Vivekananda Bhat, K., Umakanth, S., and Sampathila, N. (2022). Medical diagnosis of COVID-19 using blood tests and machine learning. J. Phys. Conf. Ser. 2161, 012017. doi:10.1088/1742-6596/2161/1/012017
Çil, B., Ayyıldız, H., and Tuncer, T. (2020). Discrimination of β-thalassemia and iron deficiency anemia through extreme learning machine and regularized extreme learning machine based decision support system. Med. Hypotheses 138, 109611. doi:10.1016/j.mehy.2020.109611
Collins, G. S., Reitsma, J. B., Altman, D. G., and Moons, K. G. M. (2015). Transparent reporting of a multivariable prediction model for individual prognosis or diagnosis (TRIPOD): the TRIPOD statement. Eur. Urol. 67, 1142–1151. doi:10.1016/j.eururo.2014.11.025
Co-operation, E. (2021). Machine learning in translation. Nat. Biomed. Eng. 5, 485–486. doi:10.1038/s41551-021-00758-1
Dayan, I., Roth, H. R., Zhong, A., Harouni, A., Gentili, A., Abidin, A. Z., et al. (2021). Federated learning for predicting clinical outcomes in patients with COVID-19. Nat. Med. 27, 1735–1743. doi:10.1038/s41591-021-01506-3
Demichev, V., Tober-Lau, P., Lemke, O., Nazarenko, T., Thibeault, C., Whitwell, H., et al. (2021). A time-resolved proteomic and prognostic map of COVID-19. Cell Syst. 12, 780–794.e7. doi:10.1016/j.cels.2021.05.005
Dipnall, J. F., Pasco, J. A., Berk, M., Williams, L. J., Dodd, S., Jacka, F. N., et al. (2016). Fusing data mining, machine learning and traditional statistics to detect biomarkers associated with depression. PLoS One 11, 01481955–e148223. doi:10.1371/journal.pone.0148195
Famiglini, L., Campagner, A., Carobene, A., and Cabitza, F. (2022). A robust and parsimonious machine learning method to predict ICU admission of COVID-19 patients. Med. Biol. Eng. Comput., 1–13. doi:10.1007/s11517-022-02543-x
Fernandes, F. T., de Oliveira, T. A., Teixeira, C. E., Batista, A. F. M., Dalla Costa, G., and Chiavegatto Filho, A. D. P. (2021). A multipurpose machine learning approach to predict COVID-19 negative prognosis in São Paulo, Brazil. Sci. Rep. 11, 3343–3347. doi:10.1038/s41598-021-82885-y
Fialoke, S., Malarstig, A., Miller, M. R., and Dumitriu, A. (2018). Application of machine learning methods to predict non-alcoholic steatohepatitis (NASH) in non-alcoholic fatty liver (NAFL) patients. AMIAAnnu. Symp. Proc. AMIA Symp. 2018, 430–439.
Food and Drug Administration. Emergency use authorizations for medical devices (2021). Template for developers of molecular and antigen diagnostic COVID-19 tests for home use.
Fujiwara, K. (2021). Sparse Modeling delivers fast, energy efficient and explainable AI solutions for cutting-edge medical applications. Nature, 50–51.
Gunčar, G., Kukar, M., Notar, M., Brvar, M., Černelč, P., Notar, M., et al. (2018). An application of machine learning to haematological diagnosis. Sci. Rep. 8, 411. doi:10.1038/s41598-017-18564-8
Guo, K., Fu, X., Zhang, H., Wang, M., Hong, S., and Ma, S. (2021). Predicting the postoperative blood coagulation state of children with congenital heart disease by machine learning based on real-world data. Transl. Pediatr. 10, 33–43. doi:10.21037/tp-20-238
Haider, R. Z., Ujjan, I. U., Khan, N. A., Urrechaga, E., and Shamsi, T. S. (2022). Beyond the in-practice CBC: the research CBC parameters-driven machine learning predictive modeling for early differentiation among leukemias. Diagnostics 12, 138. doi:10.3390/diagnostics12010138
Hao, K. (2023). Training a single AI model can emit as much carbon as five cars in their lifetimes. United States: MIT Technology Review.
Henry, K. E., Kornfield, R., Sridharan, A., Linton, R. C., Groh, C., Wang, T., et al. (2022). Human – machine teaming is key to AI adoption: clinicians ’ experiences with a deployed machine learning system. NPJ Digit. Med. 5, 97–106. doi:10.1038/s41746-022-00597-7
Ho, T. S., Weng, T. C., Wang, J. D., Han, H. C., Cheng, H. C., Yang, C. C., et al. (2020). Comparing machine learning with case-control models to identify confirmed dengue cases. PLoS Negl. Trop. Dis. 14, 00088433–e8921. doi:10.1371/journal.pntd.0008843
Hochman, E., Feldman, B., Weizman, A., Krivoy, A., Gur, S., Barzilay, E., et al. (2021). Development and validation of a machine learning-based postpartum depression prediction model: a nationwide cohort study. Depress. Anxiety 38, 400–411. doi:10.1002/da.23123
Hornbrook, M. C., Goshen, R., Choman, E., O’Keeffe-Rosetti, M., Kinar, Y., Liles, E. G., et al. (2017). Early colorectal cancer detected by machine learning model using gender, age, and complete blood count data. Dig. Dis. Sci. 62, 2719–2727. doi:10.1007/s10620-017-4722-8
Joshi, R. P., Pejaver, V., Hammarlund, N. E., Sung, H., Lee, S. K., Furmanchuk, A., et al. (2020). A predictive tool for identification of SARS-CoV-2 PCR-negative emergency department patients using routine test results. J. Clin. Virol. 129, 104502. doi:10.1016/j.jcv.2020.104502
Kairouz, P., McMahan, H. B., Avent, B., Bellet, A., Bennis, M., Nitin Bhagoji, A., et al. (2021). Advances and open problems in federated learning. Found. Trends® Mach. Learn. 14, 1–210. doi:10.1561/2200000083
Karthikeyan, A., Garg, A., Vinod, P. K., and Priyakumar, U. D. (2021). Machine learning based clinical decision support system for early COVID-19 mortality prediction. Front. Public Health 9, 626697–626713. doi:10.3389/fpubh.2021.626697
Kerr, W. T., Lau, E. P., Owens, G. E., and Trefler, A. (2012). The future of medical diagnostics: large digitized databases. Yale J. Biol. Med. 85, 363–377.
Kinar, Y., Kalkstein, N., Akiva, P., Levin, B., Half, E. E., Goldshtein, I., et al. (2016). Development and validation of a predictive model for detection of colorectal cancer in primary care by analysis of complete blood counts: a binational retrospective study. J. Am. Med. Inf. Assoc. 23, 879–890. doi:10.1093/jamia/ocv195
Kline, R. R. (2011). Cybernetics, automata studies, and the dartmouth conference on artificial intelligence. IEEE Ann. Hist. Comput. 33, 5–16. doi:10.1109/mahc.2010.44
Kocbek, P., Fijacko, N., Soguero-Ruiz, C., Mikalsen, K. Ø., Maver, U., Povalej Brzan, P., et al. (2019). Maximizing interpretability and cost-effectiveness of surgical site infection (SSI) predictive models using feature-specific regularized logistic regression on preoperative temporal data. Comput. Math. Methods Med. 2019, 1–13. doi:10.1155/2019/2059851
Kopitar, L., Kocbek, P., Cilar, L., Sheikh, A., and Stiglic, G. (2020). Early detection of type 2 diabetes mellitus using machine learning-based prediction models. Sci. Rep. 10, 11981–12012. doi:10.1038/s41598-020-68771-z
Krizhevsky, A., Sutskever, I., and Hinton, G. (2012). ImageNet classification with deep convolutional neural networks. Adv. Neural Inf. Process. Syst. 25, 1097–1105. doi:10.1145/3383972.3383975
Kushner, T., Breton, M. D., and Sankaranarayanan, S. (2020). Multi-hour blood glucose prediction in type 1 diabetes: a patient-specific approach using shallow neural network models. Diabetes Technol. Ther. 22, 883–891. doi:10.1089/dia.2020.0061
Li, W. T., Ma, J., Shende, N., Castaneda, G., Chakladar, J., Tsai, J. C., et al. (2020). Using machine learning of clinical data to diagnose COVID-19: a systematic review and meta-analysis. BMC Med. Inf. Decis. Mak. 20, 247–313. doi:10.1186/s12911-020-01266-z
Lin, J. K., Chien, T. W., Wang, L. Y., and Chou, W. (2021). An artificial neural network model to predict the mortality of COVID-19 patients using routine blood samples at the time of hospital admission: development and validation study. Med. Baltim. 100, e26532. doi:10.1097/md.0000000000026532
Luo, J., Zhou, L., Feng, Y., Li, B., and Guo, S. (2021). The selection of indicators from initial blood routine test results to improve the accuracy of early prediction of COVID-19 severity. PLoS One 16, 02533299–e253418. doi:10.1371/journal.pone.0253329
Ma, H., Xu, C. F., Shen, Z., Yu, C. H., and Li, Y. M. (2018). Application of machine learning techniques for clinical predictive modeling: a cross-sectional study on nonalcoholic fatty liver disease in China. BioMed Res. Int. 2018, 1–9. doi:10.1155/2018/4304376
Mahmood, N., Shahid, S., Bakhshi, T., Riaz, S., Ghufran, H., and Yaqoob, M. (2020). Identification of significant risks in pediatric acute lymphoblastic leukemia (ALL) through machine learning (ML) approach. Med. Biol. Eng. Comput. 58, 2631–2640. doi:10.1007/s11517-020-02245-2
Mamoshina, P., Kochetov, K., Cortese, F., Kovalchuk, A., Aliper, A., Putin, E., et al. (2019). Blood biochemistry analysis to detect smoking status and quantify accelerated aging in smokers. Sci. Rep. 9, 142–210. doi:10.1038/s41598-018-35704-w
Mathioudakis, N. N., Abusamaan, M. S., Shakarchi, A. F., Sokolinsky, S., Fayzullin, S., McGready, J., et al. (2021). Development and validation of a machine learning model to predict near-term risk of iatrogenic hypoglycemia in hospitalized patients. JAMA Netw. Open 4, e2030913–e2030915. doi:10.1001/jamanetworkopen.2020.30913
Matthew, R., and Pincus, N. Z. A. J. (2011). Henry’s clinical diagnosis and management. 22th Edition. Amsterdam, Netherlands: Elsevier.
Meiseles, A., Paley, D., Ziv, M., Hadid, Y., Rokach, L., and Tadmor, T. (2022). Explainable machine learning for chronic lymphocytic leukemia treatment prediction using only inexpensive tests. Comput. Biol. Med. 145, 105490. doi:10.1016/j.compbiomed.2022.105490
Metsker, O., Magoev, K., Yakovlev, A., Yanishevskiy, S., Kopanitsa, G., Kovalchuk, S., et al. (2020). Identification of risk factors for patients with diabetes: diabetic polyneuropathy case study. BMC Med. Inf. Decis. Mak. 20, 201–215. doi:10.1186/s12911-020-01215-w
Mooney, C., Eogan, M., Ní Áinle, F., Cleary, B., Gallagher, J. J., O'Loughlin, J., et al. (2021). Predicting bacteraemia in maternity patients using full blood count parameters: a supervised machine learning algorithm approach. Int. J. Laboratory Hematol. 43, 609–615. doi:10.1111/ijlh.13434
Moranga, C. M., Amenga–Etego, L., Bah, S. Y., Appiah, V., Amuzu, D. S. Y., Amoako, N., et al. (2020). Machine learning approaches classify clinical malaria outcomes based on haematological parameters. BMC Med. 18, 375–416. doi:10.1186/s12916-020-01823-3
Murri, R., Lenkowicz, J., Masciocchi, C., Iacomini, C., Fantoni, M., Damiani, A., et al. (2021). A machine-learning parsimonious multivariable predictive model of mortality risk in patients with Covid-19. Sci. Rep. 11, 21136–21210. doi:10.1038/s41598-021-99905-6
Our World in data (2023). Covid-19 cases. Available at: https://ourworldindata.org/grapher/covid-cases-income.
Pedregosa, F., Varoquaux, G., Gramfort, A., Michel, V., Thirion, B., Grisel, O., et al. (2011). Scikit-learn: machine learning in Python. J. Mach. Learn. Res. 12, 2825.
Peng, J., Zhou, M., Chen, C., Xie, X., and Luo, C. H. (2020). Identification of exacerbation risk in patients with liver dysfunction using machine learning algorithms. PLoS One 15, 02392666–e239310. doi:10.1371/journal.pone.0239266
Plante, T. B., Blau, A. M., Berg, A. N., Weinberg, A. S., Jun, I. C., Tapson, V. F., et al. (2020). Development and external validation of a machine learning tool to rule out COVID-19 among adults in the emergency department using routine blood tests: a large, multicenter, real-world study. J. Med. Internet Res. 22, 240488–e24112. doi:10.2196/24048
Prince-Guerra, J. L., Almendares, O., Nolen, L. D., Gunn, J. K. L., Dale, A. P., Buono, S. A., et al. (2021). Evaluation of abbott BinaxNOW rapid antigen test for SARS-CoV-2 infection at two community-based testing sites — pima county, Arizona, november 3–17, 2020. MMWR. Morb. Mortal. Wkly. Rep. 70, 100–105. doi:10.15585/mmwr.mm7003e3
Rashed-Al-Mahfuz, M., Haque, A., Azad, A., Alyami, S. A., Quinn, J. M. W., and Moni, M. A. (2021). Clinically applicable machine learning approaches to identify attributes of chronic kidney disease (CKD) for use in low-cost diagnostic screening. IEEE J. Transl. Eng. Health Med. 9, 1–11. doi:10.1109/jtehm.2021.3073629
Ratzinger, F., Dedeyan, M., Rammerstorfer, M., Perkmann, T., Burgmann, H., Makristathis, A., et al. (2014). A risk prediction model for screening bacteremic patients: a cross sectional study. PLoS One 9, e106765. doi:10.1371/journal.pone.0106765
Rawson, T. M., Hernandez, B., Moore, L. S. P., Blandy, O., Herrero, P., Gilchrist, M., et al. (2019). Supervised machine learning for the prediction of infection on admission to hospital: a prospective observational cohort study. J. Antimicrob. Chemother. 74, 1108–1115. doi:10.1093/jac/dky514
Richard, A., McPherson, M., and Pincus, M. R. (2011). Clinical diagnosis and management by laboratory methods. doi:10.1136/jcp.34.2.228-a
Roland, T., Böck, C., Tschoellitsch, T., Maletzky, A., Hochreiter, S., Meier, J., et al. (2022). Domain shifts in machine learning based covid-19 diagnosis from blood tests. J. Med. Syst. 46, 23. doi:10.1007/s10916-022-01807-1
Sarbaz, M., Pournik, O., Ghalichi, L., Kimiafar, K., and Razavi, A. R. (2013). Designing a Human T-Lymphotropic Virus Type 1 (HTLV-I) diagnostic model using the complete blood count. Iran. J. Basic Med. Sci. 16, 247–251.
Sarker, I. H. (2021). Machine learning: algorithms, real-world applications and research directions. SN Comput. Sci. 2, 160. doi:10.1007/s42979-021-00592-x
Sarker, I. H. (2022). AI-based modeling: techniques, applications and research issues towards automation, intelligent and smart systems. SN Comput. Sci. 3, 158–220. doi:10.1007/s42979-022-01043-x
Shou, L., Huang, W. W., Barszczyk, A., Wu, S. J., Han, H., Waese-Perlman, A., et al. (2021). Blood biomarkers predict cardiac workload using machine learning. BioMed Res. Int. 2021, 1–5. doi:10.1155/2021/6172815
Shukla Shubhendu, S., and Vijay, (2013). J. Applicability of artificial intelligence in different fields of life. Int. J. Sci. Eng. Res. 1, 28–35.
Soerensen, P. D., Christensen, H., Gray Worsoe Laursen, S., Hardahl, C., Brandslund, I., and Madsen, J. S. (2022). Using artificial intelligence in a primary care setting to identify patients at risk for cancer: a risk prediction model based on routine laboratory tests. Clin. Chem. Laboratory Med. (CCLM) 60, 2005–2016. doi:10.1515/cclm-2021-1015
Soguero-Ruiz, C., Fei, W. M. E., Jenssen, R., Augestad, K. M., Álvarez, J. L. R., Jiménez, I. M., et al. (2015). Data-driven temporal prediction of surgical site infection. AMIA Annu. Symp. Proc. AMIA Symp. 2015, 1164–1173.
Souza, A. A., Almeida, D. C, Barcelos, T. S., Bortoletto, R. C., Munoz, R., Waldman, H., et al. (2021). Simple hemogram to support the decision-making of COVID-19 diagnosis using clusters analysis with self-organizing maps neural network. Soft Comput. 27, 3295–3306. doi:10.1007/s00500-021-05810-5
Stegmann, G. M., Hahn, S., Liss, J., Shefner, J., Rutkove, S., Kawabata, K., et al. (2020). Repeatability of commonly used speech and language features for clinical applications. Digit. Biomarkers 4, 109–122. doi:10.1159/000511671
Svensson, C. M., Hübler, R., and Figge, M. T. (2015). Automated classification of circulating tumor cells and the impact of interobsever variability on classifier training and performance. J. Immunol. Res. 2015, 1–9. doi:10.1155/2015/573165
The Medical Futurist (2022). FDA approved AI-based algorithms. Available at: https://medicalfuturist.com/fda-approved-ai-based-algorithms/.
Tian, J., Yu, S., Wang, L., Kong, D., Zhao, W., Tian, Z., et al. (2022). Molecular pathogenesis: connections between viral hepatitis-induced and non-alcoholic steatohepatitis-induced hepatocellular carcinoma. Nat. Prod. Res. 13, 1–9. doi:10.1080/14786419.2022.2134864
Tschoellitsch, T., Dünser, M., Böck, C., Schwarzbauer, K., and Meier, J. (2021). Machine learning prediction of SARS-CoV-2 polymerase chain reaction results with routine blood tests. Lab. Med. 52, 146–149. doi:10.1093/labmed/lmaa111
World Health Organization (2021). Antigen-detection in the diagnosis of SARS-CoV-2 infection. Interim guid.
Wu, J., Shen, J., Xu, M., and Shao, M. (2021). A novel combined dynamic ensemble selection model for imbalanced data to detect COVID-19 from complete blood count. Comput. Methods Programs Biomed. 211, 106444. doi:10.1016/j.cmpb.2021.106444
Wu, Z., and McGoogan, J. M. (2020). Characteristics of and important lessons from the coronavirus disease 2019 (COVID-19) outbreak in China: summary of a report of 72314 cases from the Chinese center for disease control and prevention. JAMA - J. Am. Med. Assoc. 323, 1239–1242. doi:10.1001/jama.2020.2648
Yao, Z., Li, J., Guan, Z., Ye, Y., and Chen, Y. (2020). Liver disease screening based on densely connected deep neural networks. Neural Netw. 123, 299–304. doi:10.1016/j.neunet.2019.11.005
Yılmaz, Z., and Bozkurt, M. R. (2012). Determination of women iron deficiency anemia using neural networks. J. Med. Syst. 36, 2941–2945. doi:10.1007/s10916-011-9772-4
Zhan, J., Chen, W., Cheng, L., Wang, Q., Han, F., and Cui, Y. (2020). Diagnosis of asthma based on routine blood biomarkers using machine learning. Comput. Intell. Neurosci. 2020, 1–8. doi:10.1155/2020/8841002
Zheng, H., Zhu, J., Xie, W., and Zhong, (2021). J. Reinforcement learning assisted oxygen therapy for COVID-19 patients under intensive care. BMC Med. Inf. Decis. Mak. 21, 1–8. doi:10.1186/s12911-021-01712-6
Zheng, Y., Guo, Z., Zhang, Y., Shang, J., Yu, L., Fu, P., et al. (2022). Rapid triage for ischemic stroke: a machine learning-driven approach in the context of predictive, preventive and personalised medicine. EPMA J. 13, 285–298. doi:10.1007/s13167-022-00283-4
Keywords: blood analyses, blood, artificial intelligence (AI), machine learning (ML), diagnosis
Citation: Santos-Silva MA, Sousa N and Sousa JC (2024) Artificial intelligence in routine blood tests. Front. Med. Eng. 2:1369265. doi: 10.3389/fmede.2024.1369265
Received: 11 January 2024; Accepted: 05 March 2024;
Published: 25 March 2024.
Edited by:
Lia Morra, Polytechnic University of Turin, ItalyReviewed by:
Satya Ranjan Dash, KIIT University, IndiaMassimo La Rosa, National Research Council (CNR), Italy
Copyright © 2024 Santos-Silva, Sousa and Sousa. This is an open-access article distributed under the terms of the Creative Commons Attribution License (CC BY). The use, distribution or reproduction in other forums is permitted, provided the original author(s) and the copyright owner(s) are credited and that the original publication in this journal is cited, in accordance with accepted academic practice. No use, distribution or reproduction is permitted which does not comply with these terms.
*Correspondence: João Carlos Sousa, jcsousa@med.uminho.pt