 Vi Vu
Vi Vu Karen May-Newman
94% of researchers rate our articles as excellent or good
Learn more about the work of our research integrity team to safeguard the quality of each article we publish.
Find out more
ORIGINAL RESEARCH article
Front. Med. Eng., 09 February 2024
Sec. Advanced Technologies for Medicine
Volume 2 - 2024 | https://doi.org/10.3389/fmede.2024.1326800
Introduction: Aortic insufficiency (AI) occurs when the aortic valve fails to close completely, allowing backward blood flow into the left ventricle (LV). The progression of AI can lead to ventricular dysfunction and congestive heart failure, setting off a self-perpetuating cycle that worsens these conditions. This study employed models of repeatable and reversible AI within a simulated circulatory loop to analyze vortex dynamics, AI parameters, and gain insights into the efficiency of ventricular washout.
Method: A transparent silicone model of an LV with an ejection fraction of 17% served as the baseline, simulating a condition without AI. Mild, moderate, and severe AI were induced using 3D-printed stents, obstructing the complete closure of the aortic valve while allowing unimpeded forward blood flow. Midplane velocity fields were analyzed to compute AI and vortex properties, energy dissipation rate, blood residence time, and shear activation potential.
Results and discussion: With increasing AI severity, the regurgitant jet expanded, impeding the development and trajectory of mitral inflow. The inefficiency in fluid transport became apparent through a declining ratio of total kinetic energy rate to energy dissipation rate and an increasing residence time. Impaired ventricular washout resulted in the accumulation of fluid with elevated shear activation potential in the LV. These findings suggested that AI progressively induces abnormal intraventricular flow, heightening the thromboembolic risk in heart failure patients. The study also advocates for the potential application of mock circulatory system to explore the effects of various AI configurations, especially when combined with other cardiac implants like artificial heart valve or left ventricular assist device.
Aortic insufficiency (AI) characterizes the inability of the aortic valve to maintain forward blood flow through the heart, impacting approximately 0.5% of the general population and rising to 5.2% among individuals aged over 40. It is accountable for around 4% of annual deaths related to aortic valve diseases in the United States (Singh et al., 1999; Coffey et al., 2014). The progression of AI often included an extended asymptomatic phases, posing challenges in determining the optimal timing for management (Dujardin et al., 1999; Chaliki et al., 2002). Mild AI in patients with dilated cardiomyopathy can precipitate heart failure (Maurer, 2006). Significant chronic AI can result in dilated or eccentric hypertrophy, with its severity sometimes overlooked or misdiagnosed as the ventricle undergoes gradual remodeling before signs of left ventricle (LV) dysfunction become apparent (Scognamiglio et al., 2005). Individuals with significant AI, reduced left ventricular function (Chaliki et al., 2002), adverse left ventricular remodeling (Barbieri et al., 2019) face heightened mortality risks (Dujardin et al., 1999; Maurer, 2006).
The impact of AI progression on cardiovascular flow plays a critical role in heart failure patients (Stugaard et al., 2015; Morisawa et al., 2018). For patients awaiting heart transplants, even mild AI progression significantly the risk of mortality (Detaint et al., 2008). In cases where left ventricular assist device implantation is necessary, mild AI tends to worsen over time, as the pump continuously draws fluid toward the LV apex (Cowger et al., 2010). The presence of AI adds to the complexity of heart failure managements, emphasizing the significance of comprehending its progression in this patient group.
Previous studies have highlighted the disruption caused by the regurgitant jet (RJ) on vorticity dynamics and the deterioration of fluid transport (Stugaard et al., 2015; Okafor et al., 2017; Di Labbio and Kadem, 2018; Di Labbio et al., 2018; Morisawa et al., 2018). Nonetheless, significant knowledge gap remains. Specifically, the impact of AI on local blood residence time (TR), shear rate, and the potential risk of thromboembolic events remains inadequately explored. Distinctive flow characteristic, such as abnormal vortex development and regions of stagnation, can lead to extended TR, which are known to be associated with an elevated thrombus risk (Bermejo et al., 2015; Rossini et al., 2016). The backflow of blood from the aortic root disrupts the diastolic filling jet and simultaneously interferes with the usual vortex development, potentially resulting in extended TR and exposing the blood to additional shear forces (Vu et al., 2019; Rossini et al., 2021).
Moreover, the potential negative impacts of various RJ angles are still a subject of ongoing debate. In an animal study inducing mild AI through transcatheter piercing of valvular leaflets, findings revealed that the trajectory of RJ along the septum increased TR by impairing the temporal development of the mitral vortex and causing blood to be retained in the apex. Conversely, an RJ aimed more toward the free wall predominantly integrated into the mitral vortex, guiding fluid toward the LV outflow tract and improving TR (Cesarovic et al., 2021). An alternate observation emerged in a patient study, where AIs resulted from the malcoaptation of bicuspid aortic valves. RJs directed against the anterior mitral leaflets increased local wall stress, elevated end-diastolic and systolic left ventricular volumes, and subsequently were associated with subclinical diastolic dysfunctions (Galea et al., 2022). Despite differences in etiologies and models, both studies suggested that the angle and trajectory of the RJ influenced how it interacted with intraventricular fluid, potentially contributing to the risk of LV dysfunction even in the case of mild AI.
In instances where valvular leakage is caused by native aortic root enlargement or leaflet degeneration (Boudoulas and Stefanadis, 2009), various standard imaging methods are available to assess the impact of AI on cardiac hemodynamics and function, such as transthoracic echocardiography (Zoghbi et al., 2017), cardiovascular magnetic resonance feature tracking (Chamsi-Pasha et al., 2020), or 4D magnetic resonance imaging (MRI) (Schäfer et al., 2018). However, in cases where AI is induced by transcatheter aortic valve replacement or occur in the presence of a prosthetic mitral valve or left ventricular assist device (LVAD), the use of MRI may be limited or even impossible. For instance, Cesarovic et al. opted for transcatheter piercing to induce AI because the implanted scaffolding would introduce imaging artifacts, resulting in a restricted visual field at the implant site and along the LV outflow tract when using 4D MRI (Cesarovic et al., 2021). Moreover, in cases where de novo AI develops during LVAD implantation, the echo imaging plan of the apical view is often altered dues to ultrasound artifacts from the inflow cannula at the LV apex (Rossini et al., 2021).
Many researchers have chosen to utilize in-vitro mock loops for investigating the impacts of RJ on intraventricular fluid dynamics (Okafor et al., 2017; Di Labbio et al., 2018; Morisawa et al., 2018). Despite the limitations inherent in mock circulatory systems, including oversimplified ventricular structures and motions, we recently demonstrated that a mock loop can be tailored to capture hemodynamics and flow dynamics conditions, particularly in the context of heart failure patients (Vu et al., 2023). In this study, our system is designed to replicate a model of a dilated heart during progressive AI development. The primary objectives include characterizing vortex dynamics, AI parameters, and offering additional insights into ventricular washout through the calculation of TR and shear activation potential (SAP). By demonstrating that our system can generate AI models with results comparable to previous publications, we bring attention to the impact of AI on fluid transport efficiency and the associated thromboembolic risk. This underscores the potential of in-vitro mock loops as tools for testing multiple assumptions and justifications related to translation to the clinical setting.
The mock circulatory loop, constructed based on a 3-element Windkessel model, simulated a range of hemodynamics conditions (Figure 1A) (Wong et al., 2014). Porcine bioprosthetic valves (26-mm Mosaic and 25-mm Cinch (Medtronic)) were positioned in the aortic and mitral valves within a transparent LV model (Supplementary Figure S1). The aortic valve was horizontally positioned, while the mitral valve was inclined at a 45° angle. The LV, made from platinum-cured silicone rubber, reflected an idealized and symmetrical geometry of a dilate ventricle, with a volume of 180 mL. A programmable, linear displacement piston pump, affixed to the tank, administered volume displacement to cyclically pressurize the LV, effectively replicating the processes of diastole and systole. The circulating fluid in the system was comprised of a mixture of 40% glycerol and deionized water, with a viscosity of 3.72 cP at 20°C, to closely match the density and viscosity of blood. Pressure and flow transducers recorded LV pressure, aortic root pressure, and total systemic flow rate (Qsys) at 200 Hz (LabChart, AD Instruments). The average of Qsys in 1 minute was equivalent to cardiac output, and transvalvular pressure was the difference between LV and aortic root pressures.
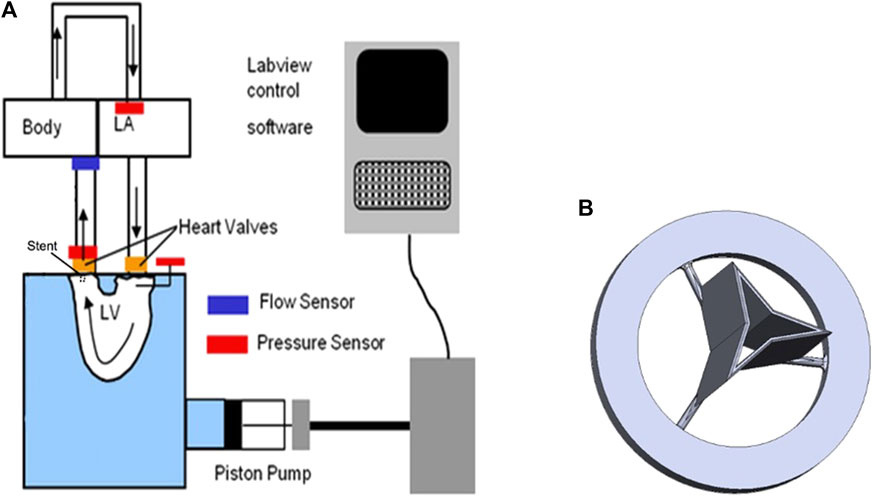
FIGURE 1. Experimental setup (A) The mock circulatory loop (B) AI stent.
The baseline (normal valve) condition mirrored the hemodynamics of a patient with advanced hear failure, aligning with class IV New York Heart Association classification (Maurer et al., 2009). For the creation of AI, stents were designed in-house using SolidWorks and 3-D printed (Figure 1B), replicated the design described in the report from (Okafor et al., 2017). These stents featured thin walls and three different orifice areas (0.03, 0.10, and 0.15 cm2), which respectively represented 2%, 6.8%, and 10.1% of the fully open geometric valve area of 1.48 cm2 (Tolpen et al., 2015). Each stent was positioned within the aortic valve to prevent complete valve closure while still allowing forward flow, effectively generating AI (Okafor et al., 2017). The severity of AI was classified according to the resulting regurgitant fractions as follows: 19% was categorized as mild, 29% as mild-moderate, and 41% as moderate-severe (Nishimura et al., 2014; Zoghbi et al., 2017). These categories were denoted as Mild, Moderate, and Severe AI in the study.
Particle Image Velocimetry (Davis software, LaVision) captured the velocity fields from a thin laser light sheet illuminated by neutrally buoyant fluorescent particles (20-
In all conditions, the cycle variabilities pressures and Qsys were less than 3%. The aortic valve opening (AVO) occurred during systole, approximately when transvalvular pressure is
The flow pulsatility index equaled:
When mitral inflow entered the LV, a vortex ring formed and was visible in the 2D midplane as two counter-rotating vortices: clockwise (CW) and counter-clockwise (CCW) (Bermejo et al., 2014). The vortical temporal waveforms (Bermejo et al., 2014), energy dissipation rate (EDR) (Okafor et al., 2017), ratio of total kinetic energy rate to EDR (TKE/EDR) over diastole (Di Labbio et al., 2020), and KE fluctuation index (Agati et al., 2014) were calculated as previously described. Small user-defined (5 mm height and 10 mm width, covering the incoming and leaving jets at the mitral inlet and aortic outlet) regions of interest adjacent to the mitral valve (ROIMV) and aortic valve (ROIAV) were evaluated for mean velocity for one cardiac cycle (May-Newman et al., 2017) (Figure 2A).
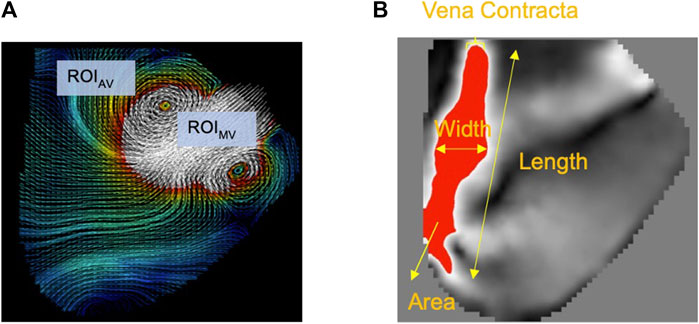
FIGURE 2. (A) Two regions of interest were defined underneath the mitral (ROIMV) and aortic (ROIAV) valves. The average velocity for each ROI was calculated over the cardiac cycle. (B) Regurgitant jet properties.
The characterization of the RJ was conducted under the assumption that the laser sheet covered the mid-plane of the RJ in the acquired 2D midplane velocity fields. In this context, the vena contracta closely resembled the distal tip of the RJ. An in-house MATLAB program was employed to separate the RJ from the surrounding fluid, using a velocity threshold of 0.15 m/s (Figure 2B). The RJ typically exhibited higher velocities compared to the surrounding LV fluid. The threshold was chosen to encompass the entire RJ region and ensure that it aligned with the average vena contracta matching the criteria set by clinical AI classification as described in (Zoghbi et al. 2017; Nishimura et al. 2014) for all experimental conditions. Multiple features of the RJ were determined, which included its area, length, width, average velocity, and maximum velocity.
After integrating the modified advection equation for ten cardiac cycles (Vu et al., 2019) with homogeneous Dirichlet initial conditions and boundary conditions at the mitral inlet section, the instantaneous TR and SAP maps for the LV midplane displayed convoluted regions of residual flow (TR > 2 s) and elevated SAP (>200 s-1). Refer to Appendix A for the estimation of RT and SAP. It was assumed that the RJ re-entering the LV would have the same TR as the fluid that exited the aortic valve at the end of systole in the previous cycle.
The hemodynamics (pressures, Qsys) and RJ values were tested for normality using the Shapiro-Wilk test. Qsys and RJ achieved statistical significances (p
The baseline condition reflected dilated cardiomyopathy hemodynamics, featuring a mean aortic root pressure of 65 mmHg, a Qsys of 1.9 L/min, a heart rate of 63 beats/minute, and an ejection fraction of 17%. While the pressures remained relatively consistent across all conditions, AI worsening led to a substantial decrease in Qsys and increase in regurgitant fraction (Eq. 1) and flow pulsatility index (Eq. 2). This decrease was attributed to an increase in regurgitant volume by 283%–423% and a reduction in AVO time by 13%–22% (Table 1). During systole, forward flow remained relatively unchanged, but during diastole, there was a significant increase in backward flow as the severity of AI progressed (Table 2). Additionally, more severe AI was associated with larger vena contracta and RJ properties, including area, length, width, and velocity (Table 3; Figure 3).
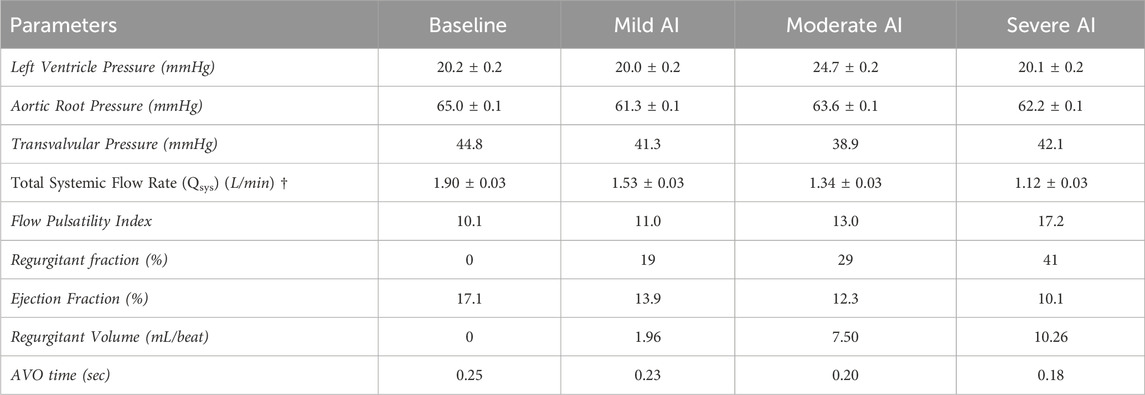
TABLE 1. Hemodynamic result (mean ± standard error) of Baseline (normal valve), Mild, Moderate, and Severe AI conditions. (AVO (aortic valve opening) time († Statistical significance (p<0.01) for tested conditions).
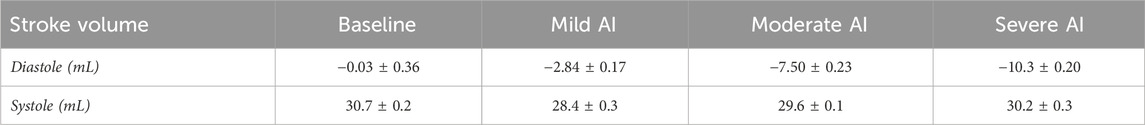
TABLE 2. Systemic stroke volume (mean ± standard error) of Baseline (normal valve), Mild, Moderate, and Severe AI conditions.
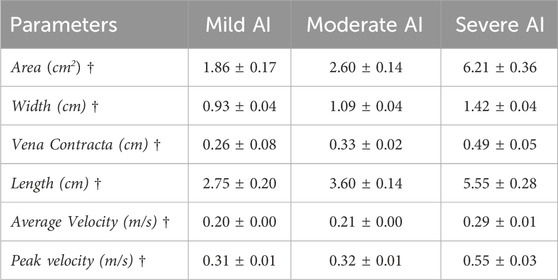
TABLE 3. Regurgitant jet properties (mean ± standard error) of Baseline (normal valve), Mild, Moderate, and Severe AI conditions. († Statistical significance (p<0.01) for tested conditions).
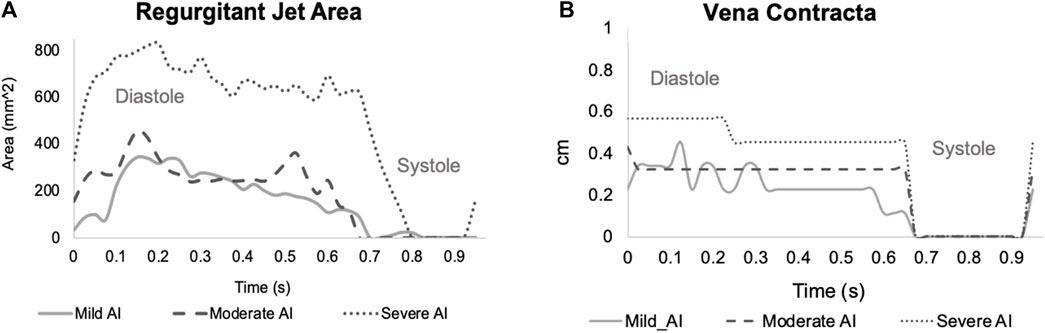
FIGURE 3. Time-varying of regurgitant jet properties (A) Area and (B) Vena Contracta (E-wave starts at t = 0, the A-wave starts t = 0.525 s and the systole starts at t = 0.65–0.7 s).
The baseline velocity maps showed the incoming E-wave mitral jet forming a vortex ring with a larger CW and a smaller CCW part. The CW vortex circulated fluids around the ventricle and then redirected them towards the outflow tract (LVOT) during late diastole. In contrast, the CCW vortex dissipated relatively quickly, primarily due to the confinement imposed by the LV free wall (Figure 4). The ROIAV profile demonstrated forward velocity during systole (peak velocity of approximately 0.15 m/s) and no retrograde pattern during diastole (Figure 5). These findings offered evidence of a positive SV during systole and zero SV during diastole, as consistent with the data in Table 2.
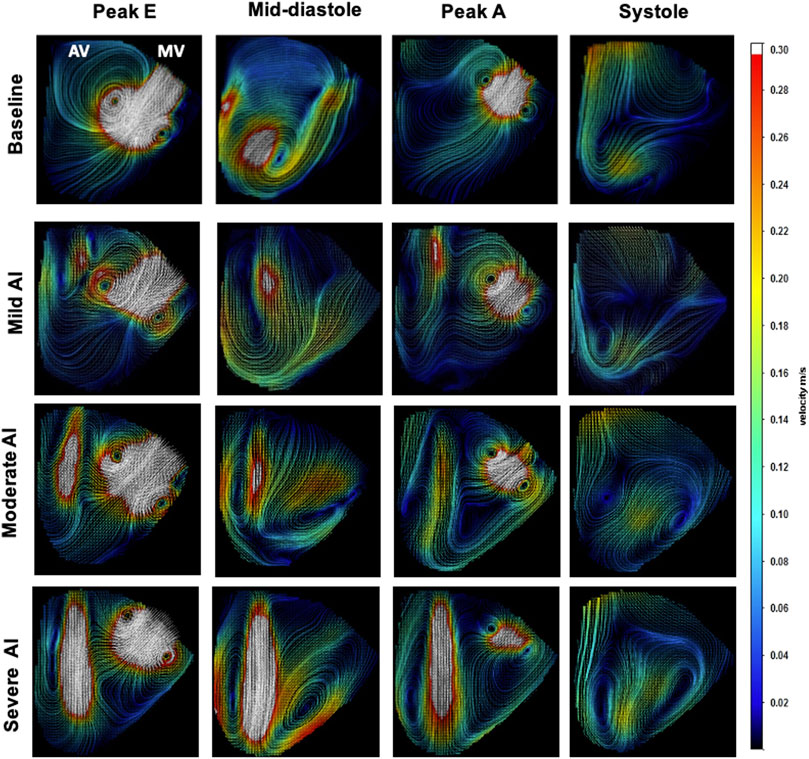
FIGURE 4. Velocity Field Images of Baseline and Mild, Moderate, and Severe AI conditions (Aortic valve (AV), mitral valve (MV)).
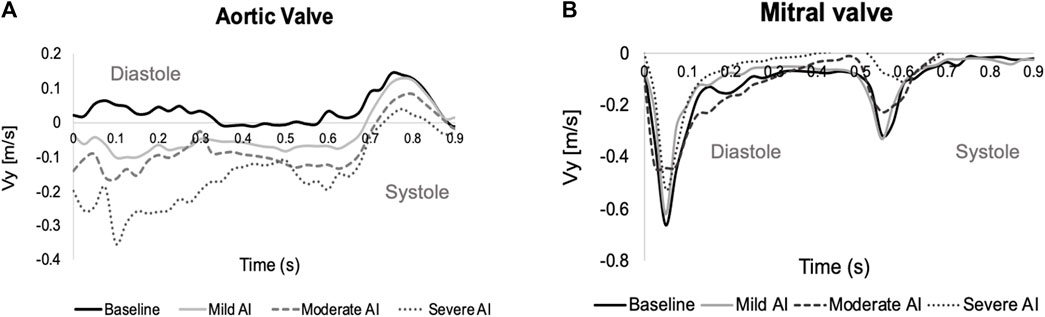
FIGURE 5. Time-varying during one cardiac cycle of ROI average velocity across (A) the aortic valve (positive: fluid moves toward the aorta, negative: fluid re-enters the left ventricle (LV)), and (B) the mitral valve (negative: incoming jet enters the LV). (E-wave starts at t = 0, the A-wave starts t = 0.525 s and the systole starts at t = 0.65–0.7 s).
In cases of AI, the RJs began forming during isovolumic relaxation and persisted throughout diastole, disappearing at the onset of systole. With AI progression, these jets expanded, eventually extending to cover the LVOT and intruding further into the ventricular chamber. This obstruction interfered with the development of the incoming E-wave and A-wave mitral jets (Supplementary Figure S2). The ROIAV patterns exhibited backward velocity during diastole and positive velocity during systole. These patterns exhibited changes in amplitudes, with more severe AI conditions showing a greater increase in backward velocity during diastole and a more significant decrease in positive velocity during systole. The flow within the system was determined by the product of the orifice area and velocity, and volume, in turn, was calculated as the product of flow and time. Therefore, larger backward velocity and a larger stent orifice area would result in a more substantial regurgitant volume during diastole. Consequently, despite having similar cardiac function parameters, AI cases demonstrated lower cardiac outputs and ejection fractions. Lastly, ROIMV patterns exhibited two peaks corresponding to the E-wave and A-wave incoming jets; both had lower peak velocities when AI presented.
A vortex ring formed with CW and CCW components as the mitral jet entered the ventricle. In the baseline condition, the CW vortex followed a straight trajectory toward the LV apex, rolled toward the base to merge with the A-wave mitral jet, and then redirected toward the LVOT as systole began. In contrast, the CCW vortex dissipated quickly due to its interaction with the free wall (Figure 6A). The CW vortex, which had a larger average circulation, KE, and radius compared to its counterpart, facilitated a smoother trajectory to minimize EDR, especially during diastasis. During systole, the aortic vavle opened to allow forward flow, resulting in a reduction in EDR (Figure 7A).
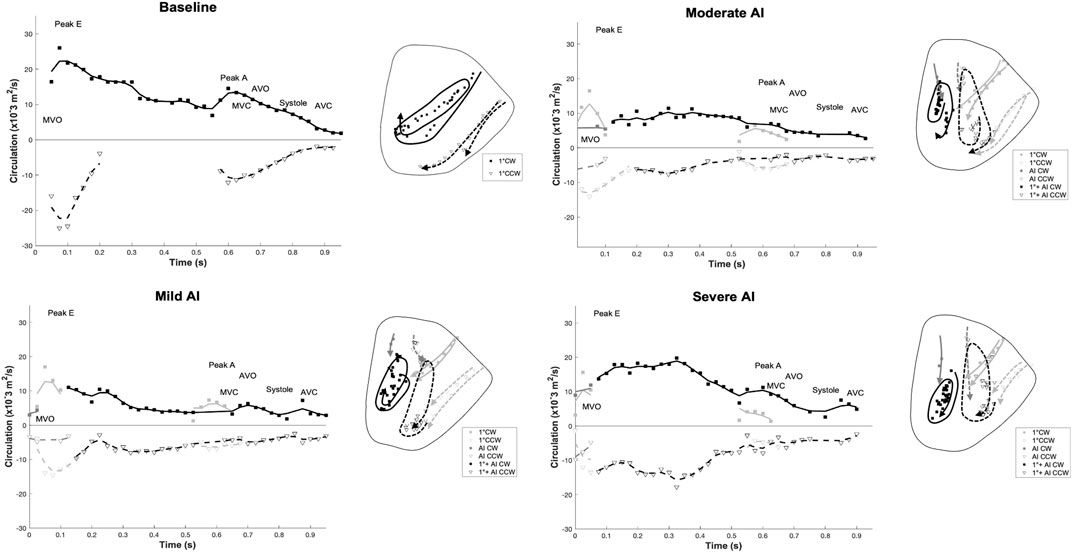
FIGURE 6. Time-varying (positive) clockwise (CW) and (negative) counter-clockwise (CCW) vortex circulation and Vortex core trajectories as the result of the E-wave and A-wave inflow contributions: the trajectories’ symbols and lines correspond to the circulation plot. (Diastole starts at t = 0, the second filling phase occurs at t = 0.525 s, and the systole starts at t = 0.65 for baseline condition). (Solid lines: CW trajectories; dotted lines: CCW trajectories. For AI cases, light gray: mitral inflow contribution, gray: AI contribution, and black: merging of mitral and AI jets). (MVO = mitral valve opens, MVC = mitral valve closes, AVO = aortic valve opens, AVC = aortic valve closes).
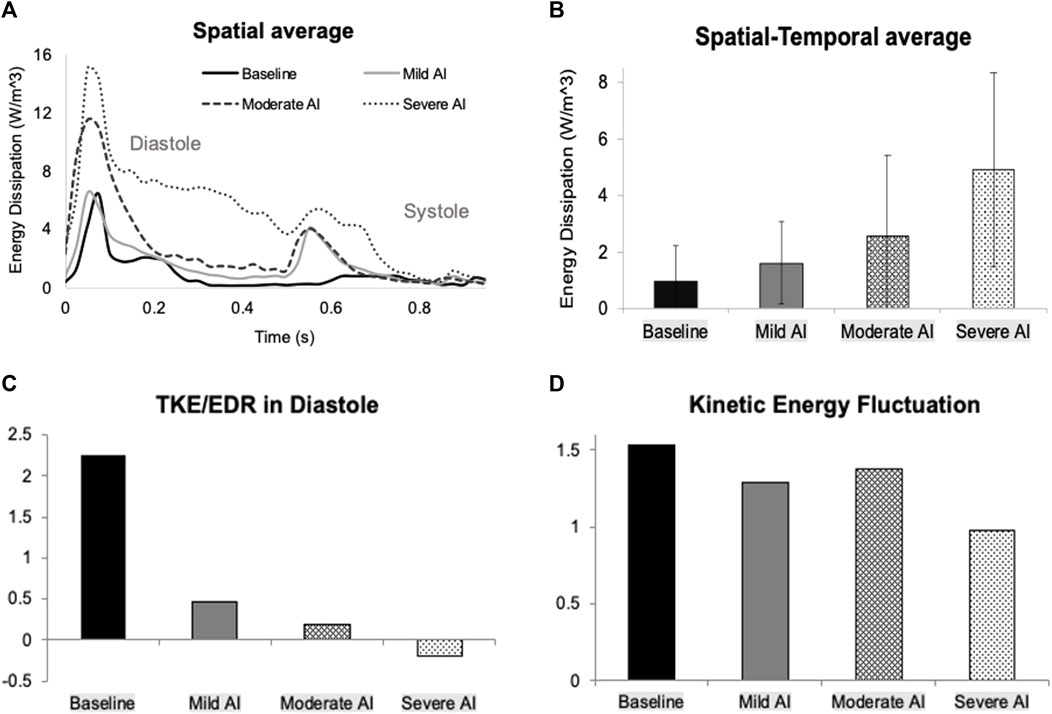
FIGURE 7. (A) Time-varying of spatially averaged energy dissipation rate (E-wave starts at t = 0, the A-wave starts at t = 0.525 s, and the systole starts at t = 0.65–0.7 s) (B) Temporal-spatial average of energy dissipation rate over one cardiac cycle (C) Ratio of total kinetic energy rate (TKE) to energy dissipation rate (EDR) over diastole (D) Kinetic energy fluctuation over one cardiac cycle for all conditions.
During early diastole, the AI jet entered the LV and interacted with the E-filling jet, leading to the formation of new vortices (Supplementary Figure S2). The AI vortex, originating from the aortic side, disrupted the development of the primary mitral (1°) vortex, affecting its circulation strength and duration (Figure 6, left; Table 4). The new combined vortex (1°+AI) with CW rotation traveled along the septal wall, while its counterpart predominantly occupied the free-wall half of the ventricle. Both of these vortices persisted throughout the entire cardiac cycle. With worsening AI, the 1°+AI CCW vortex became more dominant, resulting in increased circulation strength and KE, and consequently raising the EDR during the filling phase (Figure 7A). This fluid pattern prevented the flow from moving toward the LVOT, thus impairing ventricular washout by trapping fluids in the lower chamber.
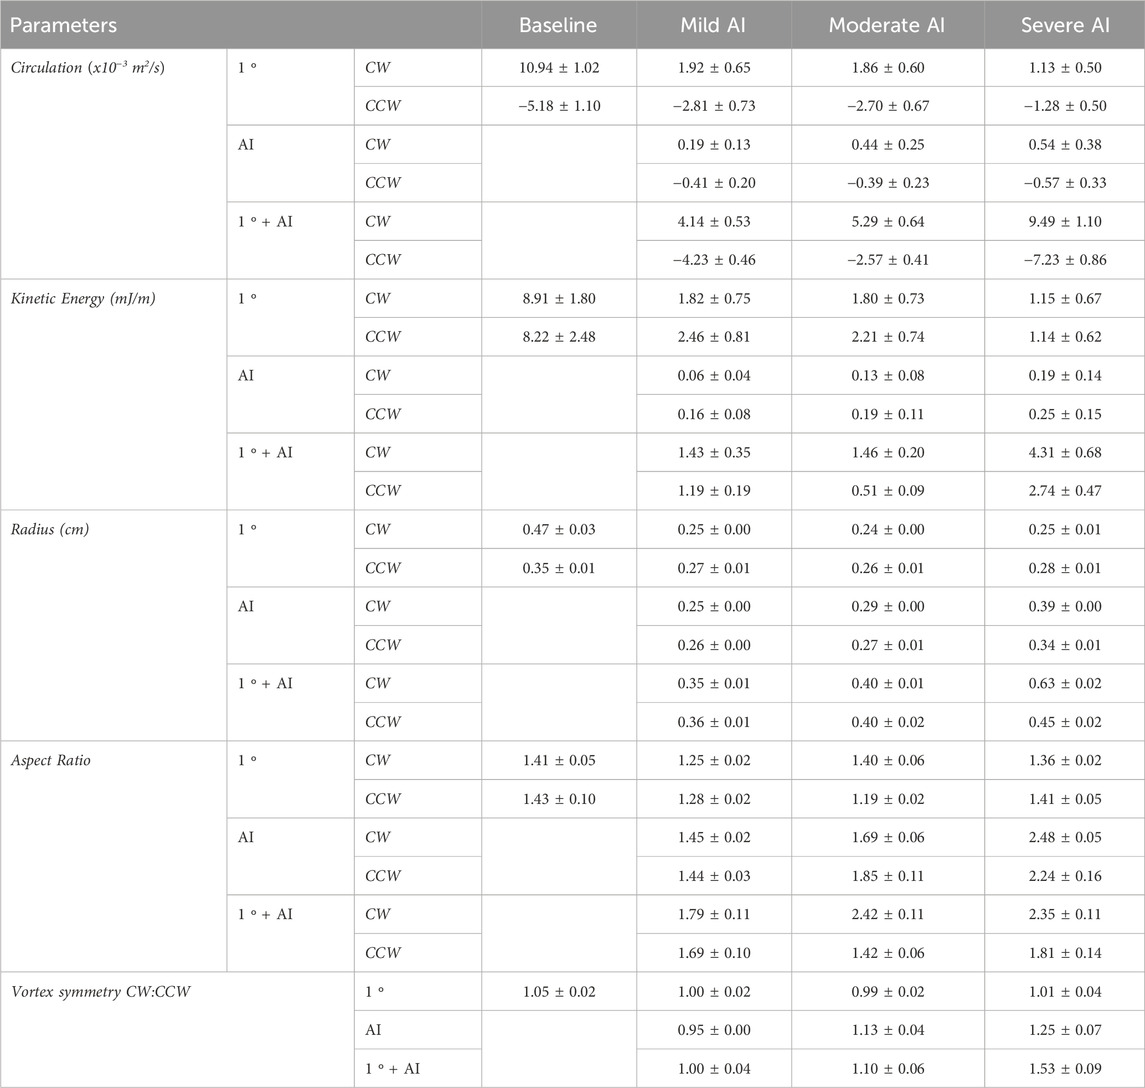
TABLE 4. Intraventricular vortex properties (mean ± standard error) of Baseline (normal valve), Mild, Moderate, and Severe AI conditions. (Clockwise (CW), and counter-clockwise (CCW)).
The interference with mitral vortex development had a severe impact on fluid transport efficiency and resulted in increased energy loss. The cyclic average of EDR was at its lowest for the normal valve condition but rose significantly, from 36% to 317%, as the severity of AI worsened (Figure 7B). The TKE/EDR ratio assessed the rate of KE production relative to EDR. A higher ratio indicated that the KE generated from fluid transport compensated for energy loss in baseline condition (Figure 7C). Conversely, a lower or less than one ratio indicated a disproportionate increase in energy loss and less effective fluid transport, which was evident in the presence of AI. In the severe AI case, the KE production rate turned negative due to the significant RJ, which severely disrupted mitral filling waves. Additionally, the KE fluctuation, a measure of the deviation in KE from its time average, decreased by 10% in mild and moderate AI and by 36% in severe AI from the normal valve condition (Figure 7D).
The spatial maps of TR and SAP following ten integration cycles illustrated the progressive decline in fluid transport efficiency and the heightened exposure to shear stress as AI became more severe (Figure 8). In the baseline condition with a low ejection fraction and a large LV volume, fluid transport was impaired, resulting in areas of residual flow (TR > 2 s) and the accumulation of shear-exposed fluid (SAP >200 s-1) at the LV base and beneath the aortic valve. AI exacerbated the impairment of fluid transport, resulting in areas with significantly increased TR (>5 s) and SAP (>103 s-1). These areas included fluids trapped at the LV base and along the free wall due to the presence of the 1°+AI CCW vortex, leading to prolonged TR and continuous re-exposure to shear. Additionally, the RJ carried fluids with high TR back into the LV at the start of each new cycle, subjecting them to shear stress and forming SAP regions exceeding 1.5x10³ s-1.
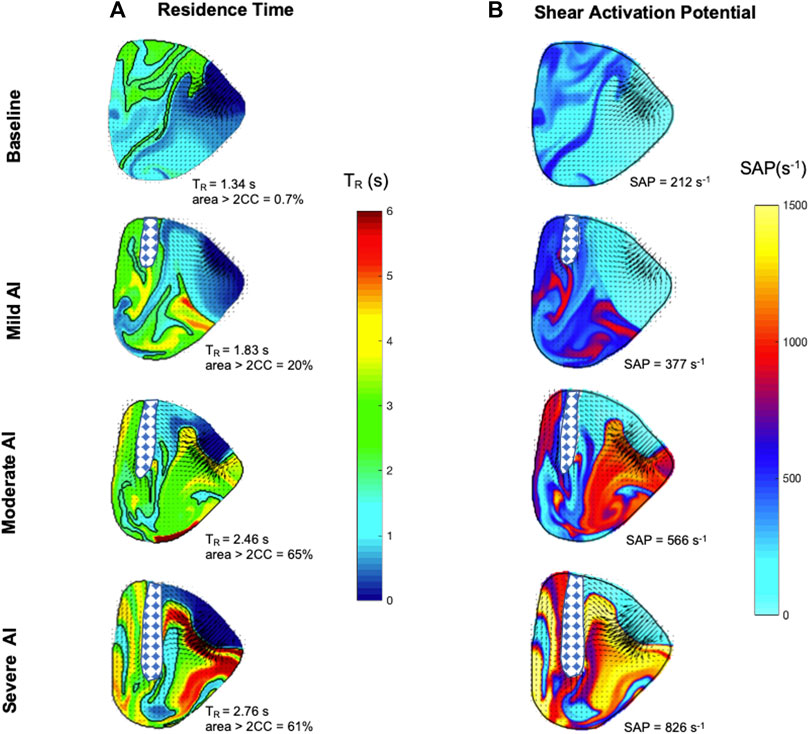
FIGURE 8. Left ventricle maps of (A) Residence time (TR) (second) and (B) Shear activation potential (SAP) (second-1) were calculated for the midplane area at the start of diastole after ten cycles of integration. The checkered regions highlight regurgitant flow entering the left ventricle, and areas with TR larger than two cycles are traced.
In a prior publication, our system demonstrated its capability to replicate the hemodynamics and fluid dynamics of heart failure patients (Vu et al., 2023), aligning with previous research that reported mid-plane 2D imaging captured the asymmetric mitral vortex pattern (Garcia et al., 2010) and the primary features of intraventricular blood transport (Postigo et al., 2022). In the case of dilated cardiomyopathy, the velocity fields exhibited a classic vortex ring structure. It consisted of a quickly dissipating CCW vortex and a dominant CW vortex circulating within the LV chamber, effectively transporting fluids towards the outflow tract (Kilner et al., 2000; Pedrizzetti and Domenichini, 2005; Bermejo et al., 2014). The smooth, swirling motion of the CW vortex provided an ideal pathway for conserving KE by maintaining fluid momentum (Kilner et al., 2000), preventing flow collisions and minimizing the EDR (Pedrizzetti and Domenichini, 2005). The vortex transported fluids from the base to the apex and then directed them towards the LVOT, facilitating ventricular washout and minimizing flow stasis (Bermejo et al., 2015; Rossini et al., 2016). The vortex circulation and KE closely mirrored those typically seen in heart failure patients, with values exceeding those in healthy cases. This difference could be attributed to the increased energy demand required for the heart to maintain adequate cardiac output (Bermejo et al., 2014; Morisawa et al., 2018). Furthermore, the diminished cardiac function played a role in hindering effective LV washout, resulting in the development of regions of residual flow and elevated SAP (Eriksson et al., 2010).
A pilot stereoscopic PIV study was conducted using two cameras to assess the impact of imaging AI in LV mid-plane, resulting in the recording of three-dimensional velocity fields (Vx and Vy represented in-plane components, while Vz represented the out-of-plane velocity component) (Supplementary Figure S3A). The average in-plane velocity V), calculated as the root mean squared of Vx and Vy, was plotted against the average Vz for one cardiac cycle (Supplementary Figure S3B). During the peak E− and A-waves, Vz accounted for 12%–30% of V, while during diastasis and systole, Vz accounted for 50%–60% of V. In comparison to the case without AI, Vz accounted for only 12%–30% of V throughout the entire cardiac cycle (Vu et al., 2023). The interaction between the RJ and the mitral jet introduced disturbance, necessitating further investigation with 3D PIV to capture the full complexity of the flow architectures. Nevertheless, despite the inherent limitations of characterizing the intricate 3D features of intraventricular flow using a planar approximation, the primary features of mitral jet trajectory and development were captured in the current setup, thus providing valuable insights into the influences of AI.
The mock loop system was utilized to simulate three distinct levels of AI severity while maintaining uniform hemodynamics condition representative of heart failure patient with dilated volume and preserved ejection fraction. This approach allowed for the assessment of the impacts of AI on intraventricular flow and the evaluation of changes in fluid transport efficiency, all while minimizing potential sources of variability. Notably, the model reflected the hemodynamics of impaired systolic function, resulting in regurgitant volumes approximately 75% lower than reported values, particularly in cases of moderate and severe AI (Zoghbi et al., 2017). AI classification was determined by aligning with clinical grading, matching values of vena contracta and regurgitant fraction (Zoghbi et al., 2017; Nishimura et al., 2014). Additionally, measurements of SV confirmed that the stents had a minimal effect on forward flow during systole but were sufficient to induce backward flow during diastole. Within the inherent limitation of the system, central AI was induced by 3D printed stents, causing the RJ to direct along the septum. In this preliminary study, the angle of AI was fixed, but the system will be modified to allow adjustment and produce different variation of the angulation in future study.
Past research extensively examined the physical mechanisms of central or indiscriminate AI, including its effects on diastolic filling, local vorticity dynamics, and transport efficiency. Those studies revealed that even a mild RJ could cause sufficient disturbance in intraventricular flow (Stugaard et al., 2015; Okafor et al., 2017; Di Labbio and Kadem, 2018; Di Labbio et al., 2018; Morisawa et al., 2018; Cesarovic et al., 2021; Rossini et al., 2021; Galea et al., 2022). Regardless of RJ angulation, similar findings were observed concerning the impacts of AI on KE, EDR, and vortex circulation. AI interfered with the infiltration capacity of the mitral jet, causing a collision that led to the formation of new vortices with higher total vortex circulation and KE (Di Labbio and Kadem, 2018; Morisawa et al., 2018). The interference compromised fluid transport and increased the EDR (Stugaard et al., 2015; Okafor et al., 2017; Di Labbio and Kadem, 2018). Moderate to severe AI further impeded ventricular filling, as previously observed (Di Labbio et al., 2018), which was evident in the reduced peak velocities of the E− and A-wave mitral filling jets in this investigation. A notable reduction in the TKE/EDR ratio indicated compromised fluid transport, where KE production was insufficient to offset viscous energy loss (Di Labbio et al., 2020), especially in the severe AI case. High KE fluctuation has been associated with a lower risk of major adverse cardiovascular events in patients with systolic dysfunction and chronic heart failure (Kim et al., 2018), implying that AI could elevate the risk of adverse outcomes as KE fluctuation declines.
In the clinical setting, a larger and centrally directed RJ is often associated with more significant regurgitation, leading to greater hemodynamic consequences (Zoghbi et al., 2017). However, unknown aspects remain regarding the effects of different AI angulations and which angulation may have a more negative impact on intraventricular fluid dynamics. This has become an interesting research topic, with two recent studies exploring different configurations of AI angulation, as mentioned in the introduction, each having its own preference (Cesarovic et al., 2021; Galea et al., 2022).
In terms of fluid transport, an animal study reported that the RJ aiming toward the septum resulted in worse TR with residual blood localized at the apex, while the RJ aiming toward the free wall resulted in better ventricular washout (Cesarovic et al., 2021). However, there is insufficient evidence in the literature to fully support this observation, as other studies did not discriminate AI angulation or include comparisons between different angles. For example, in an in-vitro study with centralized AI, the authors reported a residual region (where particles of fluid stayed in the ventricle for more than two cycles) accumulating in the apex and along the septum (Di Labbio et al., 2018). Another example is a clinical case in which no AI angle was specified (upon visual inspection, the RJ seemed to aim more toward the free wall), and high TR and SAP values were found at the apex and along the LVOT (Rossini et al., 2021).
In our investigation, the merging of vortical features in cases of AI resulted in the entrapment of fluids in the LV lower half, resulting in increased TR and SAP. Moreover, the RJ reintroduced fluids from the aortic root, contributing to the accumulation of TR and shear stress. Following each cardiac cycle, high SAP fluids remained along the LVOT and free wall, leading to the exposure of new fluid particles to shear. This led to the formation of regions with residual flow and elevated SAP in the lower half of the ventricle and along the LVOT. The findings suggested an elevated risk of thromboembolic events in the presence of AI, aligning with reported cases where AI resulted in increased retention of flow and prolonged particle residence time within the ventricle (Di Labbio et al., 2018; Cesarovic et al., 2021; Rossini et al., 2021).
Patients suffering from severe heart failure often experience concurrent comorbidities, including AI, which significantly exacerbate their hemodynamics challenges (van Diepen et al., 2017). As the heart undergoes dilation, alterations in LV geometry and function may subsequently intensify the severity of AI (Eriksson et al., 2010) by subjecting the aortic valve to elevated cyclic pressure and stress. The process leads to extracellular matrix deposition and elastin fragmentation inflicting structural damage on the valve (Ku et al., 2006; Merryman et al., 2007) or expediting its degeneration (Balachandran et al., 2009). In the absence of intervention, trace-mild AI would progressively worsen, contributing to further ventricular dysfunction and elevating the risks of morbidity and mortality (Dujardin et al., 1999; Maurer, 2006).
The study modeled various stages of AI while maintaining the same ejection fraction to replicate clinical scenarios where patients had preserved cardiac function but were experiencing progressing AI. In such cases, it can be challenging to fully evaluate the comprehensive impact of AI on overall hemodynamics, potentially leading to an underestimation of its effects. The study revealed that even with a consistent ejection fraction, AI had a detrimental effect on fluid transport and introduced areas of thromboembolic risk within the ventricle. Although mild AI was often viewed as a relatively benign condition, especially in cases where cardiac function seems intact, this study emphasize the critical need for diligent monitoring of individuals with mild AI within the heart failure context. Additionally, for patients eligible for left ventricular assist device (LVAD) implantation, the coexistence of AI would introduce added risks during the pre-implantation waiting period.
In clinical practice, the severity of AI is meticulously classified, taking into account a wide range of clinical indicators, its impact on LV function and size, as well as the extent of regurgitation (Otto et al., 2021). However, a knowledge gap persisted regarding how different aspects of AI, including valve morphology, the pattern, and angle of the RJ, played a role in inducing diastolic dysfunction and the associated thromboembolism risk. The mock loop possesses the capability to simulate AI in various degrees of severity and angle configurations. It facilitates the implementation of studies with standardized parameters, including regurgitant fraction, orifice area, heart rate, and pressure. Thus, it allows for a focused examination of the impact of RJ, free from constraints posed by factors such as comorbidities. For example, utilizing a reproducible and cost-effective AI model enables the investigation of the RJ angle’s effect on fluid transport and ventricular washout. This interest was sparked by a recent study highlighting that the direction of the RJ could influence the diastolic filling process and contribute to ventricular remodeling, even in cases where the regurgitant flow did not reach a severity causing volume overload (Galea et al., 2022). Furthermore, the mock loop serves as a versatile platform for testing different assumptions and justifications, enhancing insights for the clinical management of patients with AI and concurrent issues like artificial valves or LVAD.
The cardiac simulator was constructed based on the Windkessel model, albeit lacking the natural Frank-Starling response (Travis et al., 2007). The mock loop functioned as a comparative testbed, allowing for the replication and manipulation of different AI severity levels, thus enabling the exploration of their impact on intraventricular hemodynamics and fluid dynamics. Both E− and A-filling waves were generated through the LV expansion using a piston pump, without separately regulating the ventricle and atrium. Consequently, AI features were notably prolonged during diastole (Di Labbio and Kadem, 2018). Due to the unavailability of a physiological in-vitro mitral valve model, the mitral annulus was designed with a circular shape to accommodate the valve housing, deviating from the native eccentric anatomical D-shape or saddle shape. Nonetheless, the design effectively replicated similar vortex patterns observed in the native ventricle (Vu et al., 2019).
In this study, the angulation of AI remained constant, with AI presented at the center of the center of the atrioventricular interface in a horizontal orientation, and RJ directed along the septum. 2D mid-plane imaging was employed to approximate the midplane of the RJ and offered a reasonable estimate of its dimensions. However, velocity fields lacked out-of-plane information, which sometimes resulted in the loss of track of particles that left the imaging plane. Thus, we assumed that blood particles entering this plane at a certain point in space had the same TR as the particles currently located at that point. Since the out-of-plane velocity component were more significant in the presence of AI, the imaging plane might have yielded an underestimation of TR and cumulative shear exposure. Future studies with volumetric 3D particle image velocimetry and a modified system to adjust AI angulation will address these limitations.
The study utilized a simulated circulatory loop to assess the influence of three distinct levels of AI severity on fluid transport within dilated cardiomyopathy models. The system effectively replicated intraventricular fluid dynamics in the presence of AI, yielding results consistent with previous publications. The progression of AI resulted in diminished cardiac output and modified vortical flow properties, impacting the development of the mitral jet and increasing energy loss. This disruption in fluid transport manifested in regions where shear-exposed fluid accumulated, creating intricate areas characterized by elevated TR and SAP. The findings underscored the heightened thromboembolic risk associated with even mild AI, emphasizing the necessity for proactive management and continuous monitoring of AI in heart failure patients.
The original contributions presented in the study are included in the article/Supplementary Material, further inquiries can be directed to the corresponding author.
VV: Conceptualization, Data curation, Formal Analysis, Investigation, Methodology, Writing–original draft. KM-N: Conceptualization, Funding acquisition, Investigation, Project administration, Resources, Supervision, Writing–review and editing.
The author(s) declare that no financial support was received for the research, authorship, and/or publication of this article.
We express our sincere gratitude to Juan C. del Alamo of the Center for Cardiovascular Biology and Mechanical Engineering Department at the University of Washington and Lorenzo Rossini of the Mechanical and Aerospace Engineering Department at the University of California, San Diego. Their MATLAB implementation was instrumental in the calculation of residence time and shear activation potential in this study.
The authors declare that the research was conducted in the absence of any commercial or financial relationships that could be construed as a potential conflict of interest.
All claims expressed in this article are solely those of the authors and do not necessarily represent those of their affiliated organizations, or those of the publisher, the editors and the reviewers. Any product that may be evaluated in this article, or claim that may be made by its manufacturer, is not guaranteed or endorsed by the publisher.
The Supplementary Material for this article can be found online at: https://www.frontiersin.org/articles/10.3389/fmede.2024.1326800/full#supplementary-material
Supplementary Figure S1 | Silicone left ventricle bag with end-systolic volume of 180 ml.
Supplementary Figure S2 | Out-of-plane iso-vorticity contour maps of Baseline (normal valve), Mild, Moderate, and Severe AI conditions.
Supplementary Figure S3 | (A) Velocity vector fields captured using two-cameras PIV setup in the LV midplane. Out-of-plane (Vz) components were shown in yz and zx planes for mild AI condition. (B) Time-varying average velocity.
Agati, L., Cimino, S., Tonti, G., Cicogna, F., Petronilli, V., De Luca, L., et al. (2014). Quantitative analysis of intraventricular blood flow dynamics by echocardiographic particle image velocimetry in patients with acute myocardial infarction at different stages of left ventricular dysfunction. Eur. Heart J. - Cardiovasc. Imaging 15 (11), 1203–1212. doi:10.1093/ehjci/jeu106
Balachandran, K., Sucosky, P., Jo, H., and Yoganathan, A. P. (2009). Elevated cyclic stretch alters matrix remodeling in aortic valve cusps: implications for degenerative aortic valve disease. Am. J. Physiology-Heart Circulatory Physiology 296 (3), H756–H764. doi:10.1152/ajpheart.00900.2008
Barbieri, A., Giubertoni, E., Bartolacelli, Y., Bursi, F., Manicardi, M., and Boriani, G. (2019). New classification of geometric patterns considering left ventricular volume in patients with chronic aortic valve regurgitation: prevalence and association with adverse cardiovascular outcomes. Echocardiography 36 (1), 38–46. doi:10.1111/echo.14190
Bermejo, J., Benito, Y., Alhama, M., Yotti, R., Martínez-Legazpi, P., del Villar, C. P., et al. (2014). Intraventricular vortex properties in nonischemic dilated cardiomyopathy. Am. J. Physiology-Heart Circulatory Physiology 306 (5), H718–H729. doi:10.1152/ajpheart.00697.2013
Bermejo, J., Martínez-Legazpi, P., and del Álamo, J. C. (2015). The clinical assessment of intraventricular flows. Annu. Rev. Fluid Mech. 47 (1), 315–342. doi:10.1146/annurev-fluid-010814-014728
Bolger, A., Heiberg, E., Karlsson, M., Wigström, L., Engvall, J., Sigfridsson, A., et al. (2007). Transit of blood flow through the human left ventricle mapped by cardiovascular magnetic resonance. J. Cardiovasc. Magnetic Reson. 9 (5), 741–747. doi:10.1080/10976640701544530
Boudoulas, B., and Stefanadis, C. (2009). The aorta: structure, function, dysfunction and diseases. 1st ed. New York, NY: Informa Healthcare USA, Inc.
Cesarovic, N., Weisskopf, M., Kron, M., Glaus, L., Peper, E. S., Buoso, S., et al. (2021). Septaly oriented mild aortic regurgitant jets negatively influence left ventricular blood flow—insights from 4D flow MRI animal study. Front. Cardiovasc. Med. 8, 711099. doi:10.3389/fcvm.2021.711099
Chaliki, H. P., Mohty, D., Avierinos, J. F., Scott, C. G., Schaff, H. V., Tajik, A. J., et al. (2002). Outcomes after aortic valve replacement in patients with severe aortic regurgitation and markedly reduced left ventricular function. Circulation 106 (21), 2687–2693. doi:10.1161/01.CIR.0000038498.59829.38
Chamsi-Pasha, M. A., Zhan, Y., Debs, D., and Shah, D. J. (2020). CMR in the evaluation of diastolic dysfunction and phenotyping of HFpEF. JACC Cardiovasc. Imaging 13 (1), 283–296. doi:10.1016/j.jcmg.2019.02.031
Coffey, S., Cox, B., and Williams, M. J. A. (2014). Lack of progress in valvular heart disease in the pre–transcatheter aortic valve replacement era: increasing deaths and minimal change in mortality rate over the past three decades. Am. Heart J. 167 (4), 562–567.e2. e2, Apr. doi:10.1016/j.ahj.2013.12.030
Coleman, H. W., and Steele, W. G. (2018). Experimentation, validation, and uncertainty analysis for engineers. Fourth edition. Hoboken, NJ, USA: Wiley.
Cowger, J., Pagani, F. D., Haft, J. W., Romano, M. A., Aaronson, K. D., and Kolias, T. J. (2010). The development of aortic insufficiency in left ventricular assist device-supported patients. Circ. Heart Fail. 3 (6), 668–674. doi:10.1161/CIRCHEARTFAILURE.109.917765
Detaint, D., Maalouf, J., Tribouilloy, C., Mahoney, D. W., Schaff, H. V., Tajik, A. J., et al. (2008). Congestive heart failure complicating aortic regurgitation with medical and surgical management: a prospective study of traditional and quantitative echocardiographic markers. J. Thorac. Cardiovasc. Surg. 136 (6), 1549–1557. doi:10.1016/j.jtcvs.2008.07.036
Di Labbio, G., Ben Assa, E., and Kadem, L. (2020). Experimental investigation of the effect of heart rate on flow in the left ventricle in health and disease—aortic valve regurgitation. J. Biomechanical Eng. 142 (5), 051005. doi:10.1115/1.4045400
Di Labbio, G., and Kadem, L. (2018). Jet collisions and vortex reversal in the human left ventricle. J. Biomechanics 78, 155–160. doi:10.1016/j.jbiomech.2018.07.023
Di Labbio, G., Vétel, J., and Kadem, L. (2018). Material transport in the left ventricle with aortic valve regurgitation. Phys. Rev. Fluids 3 (11), 113101. doi:10.1103/PhysRevFluids.3.113101
Dujardin, K. S., Enriquez-Sarano, M., Schaff, H. V., Bailey, K. R., Seward, J. B., and Tajik, A. J. (1999). Mortality and morbidity of aortic regurgitation in clinical practice. Circulation 99, 1851–1857. doi:10.1161/01.cir.99.14.1851
Eriksson, J., Carlhäll, C. J., Dyverfeldt, P., Engvall, J., Bolger, A. F., and Ebbers, T. (2010). Semi-automatic quantification of 4D left ventricular blood flow. J. Cardiovasc. Magn. Reson. 12 (1), 9. doi:10.1186/1532-429X-12-9
Galea, N., Pambianchi, G., Cundari, G., Sturla, F., Marchitelli, L., Putotto, C., et al. (2022). Impaction of regurgitation jet on anterior mitral leaflet is associated with diastolic dysfunction in patients with bicuspid aortic valve and mild insufficiency: a cardiovascular magnetic resonance study. Int. J. Cardiovasc. Imaging 38 (1), 211–221. doi:10.1007/s10554-021-02384-z
Garcia, D., del Álamo, J. C., Tanné, D., Yotti, R., Cortina, C., Bertrand, É., et al. (2010). Two-dimensional intraventricular flow mapping by digital processing conventional color-Doppler echocardiography images. IEEE Trans. Med. Imaging 29 (10), 1701–1713. doi:10.1109/tmi.2010.2049656
García-Villalba, M., Rossini, L., Gonzalo, A., Vigneault, D., Martinez-Legazpi, P., Durán, E., et al. (2021). Demonstration of patient-specific simulations to assess left atrial appendage thrombogenesis risk. Front. Physiol. 12, 596596. doi:10.3389/fphys.2021.596596
Hendabadi, S., Bermejo, J., Benito, Y., Yotti, R., Fernández-Avilés, F., del Álamo, J. C., et al. (2013). Topology of blood transport in the human left ventricle by novel processing of Doppler echocardiography. Ann. Biomed. Eng. 41 (12), 2603–2616. doi:10.1007/s10439-013-0853-z
Kilner, P. J., Yang, G.-Z., Wilkes, A. J., Mohiaddin, R. H., Firmin, D. N., and Yacoub, M. H. (2000). Asymmetric redirection of flow through the heart, Nature 404, 3. doi:10.1038/35008075
Kim, I.-C., Hong, G.-R., Pedrizzetti, G., Shim, C. Y., Kang, S.-M., and Chung, N. (2018). Usefulness of left ventricular vortex flow analysis for predicting clinical outcomes in patients with chronic heart failure: a quantitative vorticity imaging study using contrast echocardiography. Ultrasound Med. Biol. 44 (9), 1951–1959. doi:10.1016/j.ultrasmedbio.2018.05.015
Ku, C., Johnson, P., Batten, P., Sarathchandra, P., Chambers, R., Taylor, P., et al. (2006). Collagen synthesis by mesenchymal stem cells and aortic valve interstitial cells in response to mechanical stretch. Cardiovasc. Res. 71 (3), 548–556. doi:10.1016/j.cardiores.2006.03.022
Maurer, M. M., Burkhoff, D., Maybaum, S., Franco, V., Vittorio, T. J., Williams, P., et al. (2009). A multicenter study of noninvasive cardiac output by bioreactance during symptom-limited exercise. J. Cardiac Fail. 15 (8), 689–699. doi:10.1016/j.cardfail.2009.04.005
May-Newman, K., Moon, J., Ramesh, V., Montes, R., Campos, J., Herold, B., et al. (2017). The effect of inflow cannula length on the intraventricular flow field: an in vitro flow visualization study using the evaheart left ventricular assist device. ASAIO J. 63 (5), 592–603. doi:10.1097/MAT.0000000000000559
Merryman, W. D., Lukoff, H. D., Long, R. A., Engelmayr, G. C., Hopkins, R. A., and Sacks, M. S. (2007). Synergistic effects of cyclic tension and transforming growth factor-β1 on the aortic valve myofibroblast. Cardiovasc. Pathol. 16 (5), 268–276. doi:10.1016/j.carpath.2007.03.006
Morisawa, D., Falahatpisheh, A., Avenatti, E., Little, S. H., and Kheradvar, A. (2018). Intraventricular vortex interaction between transmitral flow and paravalvular leak. Sci. Rep. 8 (1), 15657. doi:10.1038/s41598-018-33648-9
Nishimura, R. A., Otto, C. M., Bonow, R. O., Carabello, B. A., Erwin, J. P., Guyton, R. A., et al. (2014). 2014 AHA/ACC guideline for the management of patients with valvular heart disease. J. Am. Coll. Cardiol. 63 (22), e57–e185. e57–e185. doi:10.1016/j.jacc.2014.02.536
Okafor, I., Raghav, V., Condado, J. F., Midha, P. A., Kumar, G., and Yoganathan, A. P. (2017). Aortic regurgitation generates a kinematic obstruction which hinders left ventricular filling. Ann. Biomed. Eng. 45 (5), 1305–1314. doi:10.1007/s10439-017-1790-z
Otto, C. M., Nishimura, R. A., Bonow, R. O., Carabello, B. A., Erwin, J. P., Gentile, F., et al. (2021). 2020 ACC/AHA guideline for the management of patients with valvular heart disease: executive summary: a report of the American college of cardiology/American heart association joint committee on clinical practice guidelines. Circulation 143 (5), e35–e71. doi:10.1161/CIR.0000000000000932
Pedrizzetti, G., and Domenichini, F. (2005). Nature optimizes the swirling flow in the human left ventricle. Phys. Rev. Lett. 95 (10), 108101. doi:10.1103/PhysRevLett.95.108101
Postigo, A., Viola, F., Chazo, C., Martínez-Legazpi, P., González-Mansilla, A., Rodríguez-González, E., et al. (2022). Assessment of blood flow transport in the left ventricle using ultrasound. Validation against 4-D flow cardiac magnetic resonance. Ultrasound Med. Biol. 48 (9), 1822–1832. doi:10.1016/j.ultrasmedbio.2022.05.007
Rossini, L., Braun, O. Ö., Brambatti, M., Benito, Y., Mizeracki, A., Miramontes, M., et al. (2021). Intraventricular flow patterns in patients treated with left ventricular assist devices. ASAIO J. 67 (1), 74–83. doi:10.1097/mat.0000000000001158
Rossini, L., Martinez-Legazpi, P., Vu, V., Fernández-Friera, L., Pérez del Villar, C., Rodríguez-López, S., et al. (2016). A clinical method for mapping and quantifying blood stasis in the left ventricle. J. Biomechanics 49 (11), 2152–2161. doi:10.1016/j.jbiomech.2015.11.049
Schäfer, M., Humphries, S., Stenmark, K. R., Kheyfets, V. O., Buckner, J. K., Hunter, K. S., et al. (2018). 4D-flow cardiac magnetic resonance-derived vorticity is sensitive marker of left ventricular diastolic dysfunction in patients with mild-to-moderate chronic obstructive pulmonary disease. Eur. Heart J. - Cardiovasc. Imaging 19 (4), 415–424. doi:10.1093/ehjci/jex069
Scognamiglio, R., Negut, C., Palisi, M., Fasoli, G., and Dalla-Volta, S. (2005). Long-term survival and functional results after aortic valve replacement in asymptomatic patients with chronic severe aortic regurgitation and left ventricular dysfunction. J. Am. Coll. Cardiol. 45 (7), 1025–1030. doi:10.1016/j.jacc.2004.06.081
Singh, J. P., Evans, J. C., Levy, D., Larson, M. G., Freed, L. A., Fuller, D. L., et al. (1999). Prevalence and clinical determinants of mitral, tricuspid, and aortic regurgitation (the Framingham Heart Study). Am. J. Cardiol. 83 (6), 897–902. doi:10.1016/S0002-9149(98)01064-9
Stugaard, M., Koriyama, H., Katsuki, K., Masuda, K., Asanuma, T., Takeda, Y., et al. (2015). Energy loss in the left ventricle obtained by vector flow mapping as a new quantitative measure of severity of aortic regurgitation: a combined experimental and clinical study. Eur. Heart J. - Cardiovasc. Imaging 16 (7), 723–730. doi:10.1093/ehjci/jev035
Tolpen, S., Janmaat, J., Reider, C., Kallel, F., Farrar, D., and May-Newman, K. (2015). Programmed speed reduction enables aortic valve opening and increased pulsatility in the LVAD-assisted heart. ASAIO J. 61 (5), 540–547. doi:10.1097/MAT.0000000000000241
Travis, A. R., Giridharan, G. A., Pantalos, G. M., Dowling, R. D., Prabhu, S. D., Slaughter, M. S., et al. (2007). Vascular pulsatility in patients with a pulsatile- or continuous-flow ventricular assist device. J. Thorac. Cardiovasc. Surg. 133 (2), 517–524. doi:10.1016/j.jtcvs.2006.09.057
van Diepen, S., Katz, J. N., Albert, N. M., Henry, T. D., Jacobs, A. K., Kapur, N. K., et al. American Heart Association Council on Clinical Cardiology; Council on Cardiovascular and Stroke Nursing; Council on Quality of Care and Outcomes Research; and Mission: Lifeline (2017). Contemporary management of cardiogenic shock: a scientific statement from the American heart association. Circulation 136 (16), e232–e268. doi:10.1161/CIR.0000000000000525
Vu, V., Rossini, L., Del Alamo, J. C., Dembitsky, W., Gray, R. A., and May-Newman, K. (2023). Benchtop models of patient-specific intraventricular flow during heart failure and LVAD support. J. Biomechanical Eng. 145 (11), 111010. doi:10.1115/1.4063147
Vu, V., Rossini, L., Montes, R., Campos, J., Moon, J., Martinez-Legazpi, P., et al. (2019). Mitral valve prosthesis design affects hemodynamic stasis and shear in the dilated left ventricle. Ann. Biomed. Eng. 47 (5), 1265–1280. doi:10.1007/s10439-019-02218-z
Wong, K., Samaroo, G., Ling, I., Dembitsky, W., Adamson, R., del Álamo, J., et al. (2014). Intraventricular flow patterns and stasis in the LVAD-assisted heart. J. Biomechanics 47 (6), 1485–1494. doi:10.1016/j.jbiomech.2013.12.031
Zoghbi, W. A., Adams, D., Bonow, R. O., Enriquez-Sarano, M., Foster, E., Grayburn, P. A., et al. (2017). Recommendations for noninvasive evaluation of native valvular regurgitation. J. Am. Soc. Echocardiogr. 30 (4), 303–371. doi:10.1016/j.echo.2017.01.007
Blood residence time (RT) was calculated using the modified advection equation:
where
The potential of shear-induced platelet activation (
forced by the shear rate
Both equations were completed by homogeneous Dirichlet initial and boundary conditions at the mitral inlet region. The equations were solved numerically using a third-order WENO scheme to discretize spatial fluxes and a third-order Runge-Kutta scheme to integrate in time, as described in our previous publication (García-Villalba et al., 2021). The power exponent
Keywords: aortic insufficiency, vortex properties, fluid transport, residence time, shear activation potential, mock circulatory loop
Citation: Vu V and May-Newman K (2024) Fluid mechanics of aortic valve incompetence in the dilated left ventricle. Front. Med. Eng. 2:1326800. doi: 10.3389/fmede.2024.1326800
Received: 23 October 2023; Accepted: 08 January 2024;
Published: 09 February 2024.
Edited by:
Mara Terzini, Polytechnic University of Turin, ItalyReviewed by:
Francesco Sturla, IRCCS San Donato Polyclinic, ItalyCopyright © 2024 Vu and May-Newman. This is an open-access article distributed under the terms of the Creative Commons Attribution License (CC BY). The use, distribution or reproduction in other forums is permitted, provided the original author(s) and the copyright owner(s) are credited and that the original publication in this journal is cited, in accordance with accepted academic practice. No use, distribution or reproduction is permitted which does not comply with these terms.
*Correspondence: Vi Vu, dnZ1QHNkc3UuZWR1
Disclaimer: All claims expressed in this article are solely those of the authors and do not necessarily represent those of their affiliated organizations, or those of the publisher, the editors and the reviewers. Any product that may be evaluated in this article or claim that may be made by its manufacturer is not guaranteed or endorsed by the publisher.
Research integrity at Frontiers
Learn more about the work of our research integrity team to safeguard the quality of each article we publish.