
94% of researchers rate our articles as excellent or good
Learn more about the work of our research integrity team to safeguard the quality of each article we publish.
Find out more
ORIGINAL RESEARCH article
Front. Med. , 13 March 2025
Sec. Pulmonary Medicine
Volume 12 - 2025 | https://doi.org/10.3389/fmed.2025.1529993
This article is part of the Research Topic Bridging Tradition and Future: Cutting-edge Exploration and Application of Artificial Intelligence in Comprehensive Diagnosis and Treatment of Lung Diseases View all 4 articles
 Jisheng Zhang1
 Yang Chen1Aijun Zhang2Yi Yang3Liqian Ma1Hangqi Meng1Jintao Wu1
 Kean Zhu1
 Jiangsong Zhang1Ke Lin4
 Xianming Lin1*
Introduction: Long COVID significantly affects patients' quality of life, yet no standardized treatment has been established. Traditional Chinese Medicine (TCM) presents a promising potential approach with targeted therapeutic strategies. This study aims to develop an explainable machine learning (ML) model and nomogram to identify Long COVID patients who may benefit from TCM, enhancing clinical decision-making.
Methods: We analyzed data from 1,331 Long COVID patients treated with TCM between December 2022 and February 2024 at three hospitals in Zhejiang, China. Effectiveness was defined as improvement in two or more symptoms or a minimum 2-point increase in the Traditional Chinese Medicine Syndrome Score (TCMSS). Data included 11 patient and disease characteristics, 18 clinical symptoms and syndrome scores, and 12 auxiliary examination indicators. The least absolute shrinkage and selection operator (LASSO) method identified features linked to TCM efficacy. Data from 1,204 patients served as the training set, while 127 patients formed the testing set.
Results: We employed five ML algorithms: Support Vector Machine (SVM), Random Forest (RF), K-Nearest Neighbors (KNN), Extreme Gradient Boosting (XGBoost), and Neural Network (NN). The XGBoost model achieved an Area Under the Curve (AUC) of 0.9957 and an F1 score of 0.9852 in the training set, demonstrating superior performance in the testing set with an AUC of 0.9059 and F1 score of 0.9027. Key features identified through SHapley Additive exPlanations (SHAP) included chest tightness, aversion to cold, age, TCMSS, Short Form (36) Health Survey (SF-36), C-reactive protein (CRP), and lymphocyte ratio. The logistic regression-based nomogram demonstrated an AUC of 0.9479 and F1 score of 0.9384 in the testing set.
Conclusion: This study utilized multicenter data and multiple ML algorithms to create a ML model for predicting TCM efficacy in Long COVID treatment. Furthermore, a logistic regression-based nomogram was developed to assist the model and improve decision-making efficiency in TCM applications for Long COVID management.
Long COVID, also known as post-COVID syndrome, refers to a condition in which some individuals, after recovering from the acute phase of a COVID-19 infection, continue to experience persistent or recurrent symptoms that last longer than the typical recovery period. The World Health Organization (WHO) defines Long COVID as symptoms that persist for at least three months or longer following the acute phase of COVID-19 (1). The incidence of Long COVID is estimated to range from 10 to 30% in non-hospitalized cases and 50–70% in hospitalized cases. It is primarily characterized by symptoms such as fatigue, shortness of breath, dizziness, heart palpitations, insomnia, loss of smell, and poor appetite, affecting multiple systems including the respiratory, digestive, nervous, circulatory, and immune systems. These symptoms may be accompanied by various adverse outcomes and can persist for years or even a lifetime (2). According to a 2023 report by Centers for Disease Control and Prevention (CDC), 11% of American adults who previously contracted COVID-19 continue to experience Long COVID. The resulting limitations in daily activities affect quality of life and work capacity, potentially preventing working-age adults from maintaining employment (3). This places a substantial burden on individuals, healthcare systems, and the national economy.
The pathogenesis of Long COVID is not yet fully understood, but the predominant hypotheses include viral persistence and remnants in tissues, immune dysregulation, microbiome imbalances, and tissue damage resulting from chronic inflammation (4). There is currently no standardized treatment for Long COVID, with treatment primarily focusing on symptom relief and rehabilitation. These include antiviral drugs to clear the virus, anti-inflammatory drugs and immunosuppressants to alleviate systemic inflammation and suppress excessive immune responses, as well as rehabilitation therapies targeting specific symptoms, such as respiratory training, psychological support, cognitive and speech therapy, and physical rehabilitation. However, the effectiveness of current treatments remains uncertain, with a lack of mechanism-driven therapies targeting specific symptoms and standardized rehabilitation protocols. As a result, further research into diverse clinical approaches and models is needed to optimize treatment strategies, rehabilitation methods, and health services for Long COVID (5).
Traditional Chinese Medicine (TCM) has a history spanning thousands of years in the prevention and treatment of viral infectious pneumonia, with extensive clinical experience and effective methods (6). TCM follows a systemic and holistic approach, acting through multiple pathways on various targets (7), which aligns with the multisymptomatic and multisystemic characteristics of Long COVID. In the “Diagnosis and Treatment Program for Coronavirus Disease 2019 (COVID-19)” issued by the National Health Commission of the People's Republic of China (NHC), TCM is recommended for treatment during the recovery phase of COVID-19 (8). Research has shown that TCM can alleviate symptoms of Long COVID and significantly aid in the recovery of physiological functions (9). TCM provides a range of benefits, including neuroprotection, regulation of gastrointestinal and cardiopulmonary functions, and enhancement of immune function (10). However, in clinical practice, the applicability of TCM for treating Long COVID remains unclear, with no clear quantitative indicators. This lack of clarity makes it challenging for both physicians and patients to fully assess the effectiveness of TCM. Therefore, it is essential to collect large-scale, high-quality clinical data and apply precise analytical methods to identify the key characteristics of Long COVID patients who are suitable for TCM treatment. This will assist in clinical decision-making and support the broader application of TCM in treating Long COVID.
Machine Learning (ML) has shown significant advantages in predicting clinical outcomes, including diagnosis, treatment efficacy, and prognosis. Compared to traditional statistical methods, ML can manage complex variable interactions and non-linear relationships, leading to its growing use in clinical research, especially when the outcomes of interest are influenced by intricate associations among multiple factors (11). However, ML models are often viewed as “black boxes” due to their lack of transparency. Explainable Artificial Intelligence technologies enable clinicians and researchers to better understand the decision-making processes and outputs of ML algorithms, thereby supporting the wider adoption of ML in clinical practice (12). Therefore, leveraging ML methods to establish precise quantitative standards and determine the appropriate scope of TCM use can improve the accuracy of clinical decision-making, optimize patient treatment strategies, and facilitate the broader implementation of TCM practices (13, 14).
To our knowledge, previous studies developing clinical prediction models for TCM have often overlooked the inclusion of auxiliary examination indicators as potential factors in evaluating TCM efficacy (15, 16). While the clinical presentation and efficacy assessment of Long COVID predominantly rely on symptoms, certain auxiliary examination indicators may prove vital in predicting the effectiveness of TCM in treating Long COVID (17). This study leveraged case data from a clinical database, collecting baseline patient characteristics, clinical symptoms, scores, and auxiliary examination results. Five ML models were developed, including Support Vector Machine (SVM), Random Forest (RF), K-Nearest Neighbors (KNN), Extreme Gradient Boosting (XGBoost), and Neural Networks (NN). Through these models, we aim to identify the optimal predictive algorithm and utilize SHapley Additive exPlanations (SHAP) to interpret the models. The objective is to develop an explainable ML model, pinpoint key features associated with effective treatment, and assess the feasibility and clinical utility of the model in accurately predicting the efficacy of TCM for Long COVID.
Additionally, while ML models surpass traditional nomograms in predictive efficiency, the simplicity and interpretability of nomograms remain highly valuable for clinical decision-making and patient education (18). Thus, our secondary objective is to develop a high-performance nomogram using logistic regression, ensuring robust predictive accuracy. This nomogram would serve as a complement to the ML model, facilitating its broader adoption in clinical practice.
The dataset for this study was sourced from the Long COVID databases of the Third Affiliated Hospital of Zhejiang Chinese Medical University (TAHZCMU), Jiaxing First People's Hospital (JFPH), and Haining People's Hospital (HPH). This study aims to extract data from the database on Long COVID cases treated with TCM for retrospective analysis, with the goal of developing and validating a predictive model for the efficacy of TCM. The study protocol was approved by the Ethics Committee of TAHZCMU (ZSLL-KY-2023-002-01). We followed the reporting guidelines in TRIPOD (transparent reporting of a multivariate prediction model for individual prognosis or diagnosis). The Flowchart of this study is outlined in Figure 1.
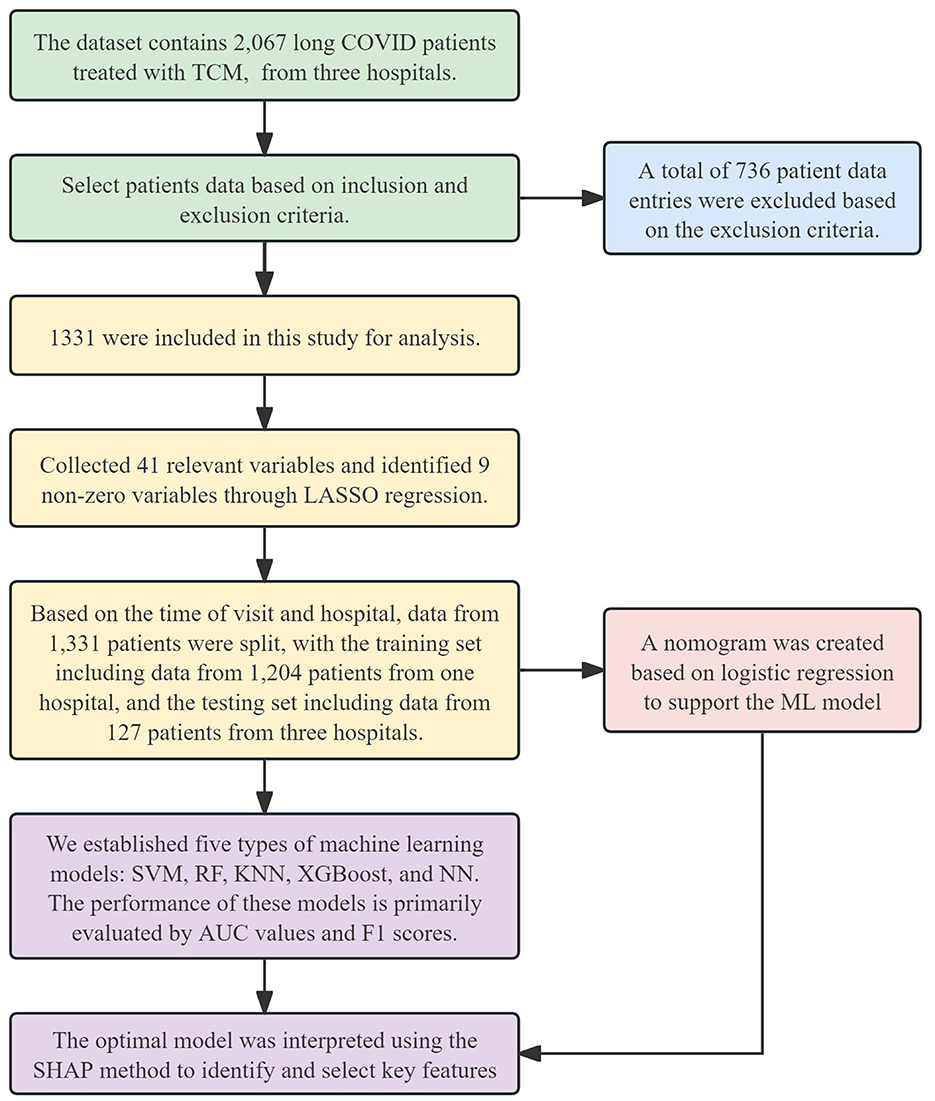
Figure 1. Flowchart of this study. TCM, Traditional Chinese Medicine; LASSO, Least Absolute Shrinkage and Selection Operator; SVM, Support Vector Machine; RF, Random Forest; KNN, K-Nearest Neighbors; XGBoost, Extreme Gradient Boosting; NN, Neural Network; AUC, Area Under the Curve; SHAP, SHapley Additive exPlanations; ML, machine learning.
Data from 2,067 Long COVID patients treated with TCM were extracted from the database. These patients received treatment between December 2022 and February 2024 at TAHZCMU, JFPH, and HPH. All patients were from Zhejiang Province, China, and were treated using a sequential TCM therapy over a 14-day period. The detailed treatment protocol is shown in Table 1.
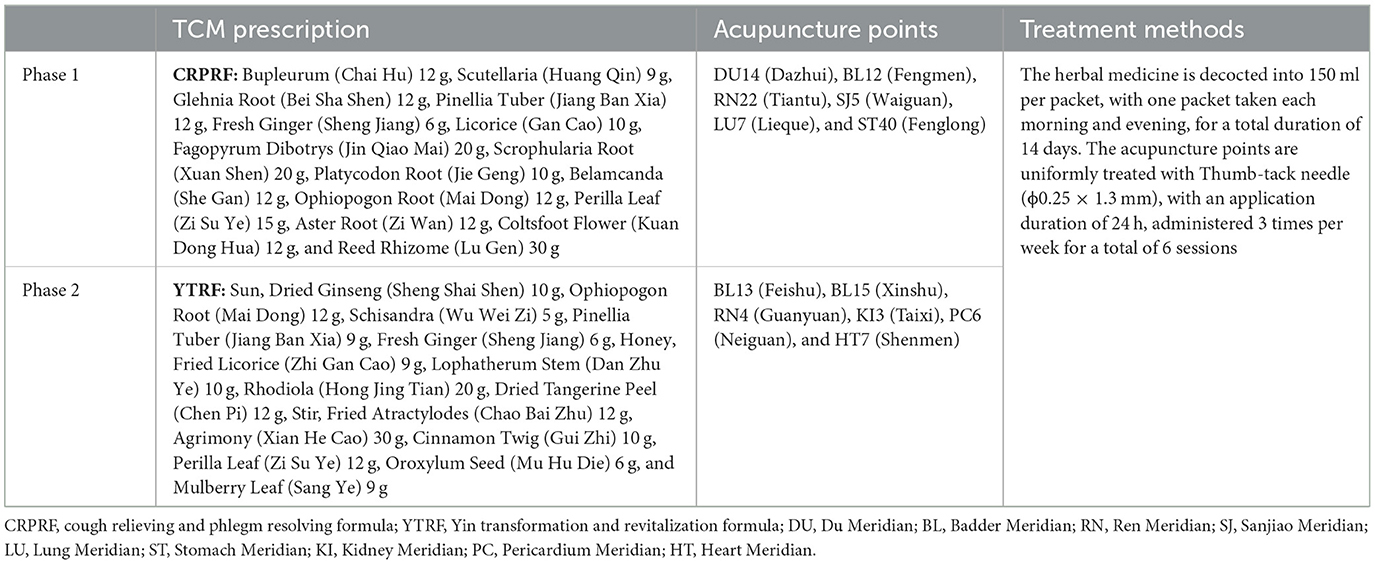
Table 1. Detailed Traditional Chinese Medicine treatment plan.
We included case data from patients who met the medical diagnostic criteria for Long COVID and received TCM treatment. The following patients were excluded: (1) those without follow-up records; (2) those with more than 20% missing clinical data in their follow-up records; (3) those with a treatment duration of < 14 days; (4) pregnant or breastfeeding women; (5) those participating in other clinical drug trials; and (6) those unable to complete the treatment or trial for any other reason.
Based on published research, clinical expertise, and practical considerations from factor evaluations in clinical practice, we identified potential factors from the case data related to the efficacy of TCM in treating Long COVID (19–21). For factors that were highly correlated, we either retained the most relevant one or combined them (22). The following factors were collected: First, 11 baseline characteristics, including age, gender, body mass index (BMI), hypertension, diabetes, hyperlipidemia, cerebrovascular disease, cardiovascular disease, smoking history, vaccination status, and secondary infection. Second, 18 clinical features and syndrome scores: cough, expectoration, nasal congestion, chest tightness, insomnia, sore throat, fatigue, aversion to cold, headache, myalgia, palpitation, anorexia, spontaneous/night sweats, fever, smell/taste problem, TCM syndrome score (TCMSS), Short Form (36) Health Survey (SF-36), and Pittsburgh Sleep Quality Index (PSQI). Third, 12 auxiliary examination indicators, comprising 3 pulmonary imaging markers: pulmonary nodule, pulmonary infection, and stable pulmonary lesion, as well as 9 blood and biochemical markers: C-reactive protein(CRP), white blood cells, platelets, neutrophils, lymphocyte ratio, red blood cell, hemoglobin, the ratio of Aspartate Aminotransferase to Alanine Aminotransferase (AST/ALT), and creatinine. Fourth, follow-up or feedback data after 14 days of TCM treatment.
As there are no standardized quantitative indicators for assessing the improvement of Long COVID, symptom relief remains the primary measure of treatment efficacy (23). In this study, treatment outcomes were evaluated by an experienced team of clinicians, following the World Health Organization (WHO) guidelines for Long COVID (24). Patients with improvement in two or more clinical symptoms, or with a TCMSS improvement of at least 2 points, were classified as having an effective treatment.
A total of 41 variables were collected, and data processing was as follows: gender was coded as 1 for male and 0 for female; binary variables (clinical symptoms, medical history, pulmonary imaging features, and reinfection status) were coded as 1 for “yes” and 0 for “no.” The remaining variables were normalized using the min-max scaling method: E(x) = (x – min)/(max – min).
Variable selection was conducted using the least absolute shrinkage and selection operator (LASSO) method. The objective function of LASSO regression introduces a penalty term to the least squares method, shrinking some regression coefficients to zero, thereby enabling efficient feature selection. Potential risk factors were identified through LASSO regression, and the non-zero features were subsequently included in both the model and the nomogram. LASSO regression was implemented using the glmnet package in R (version 4.4.1; Foundation for Statistical Computing, Vienna, Austria).
The dataset was divided into training and testing sets based on the time of patient visits and the hospital of treatment. Five ML models were then developed for analysis: SVM model was implemented using the e1071 package in R, RF model with the randomForest package in R, KNN model with the kknn package in R, XGBoost model with the xgboost package in R, and NN model with the nnet package in R.
The evaluation of model performance included an analysis of Area Under the Curve (AUC), sensitivity, specificity, accuracy, and F1 score. Among these, AUC and F1 score were the primary metrics used for comparing model performance (25, 26). The most suitable ML model was then selected as the predictive model for this study.
We applied the SHAP method to interpret the ML models and evaluate the influence of different features on the prediction outcomes, identifying key features in the process. SHAP provides effective explanations of model performance at both the cohort and individual patient levels. By calculating and averaging the SHAP values for each feature across all patients, we were able to assess each feature's contribution to the model (27). The SHAP feature importance plot displays the global importance of these features, with higher mean absolute SHAP values indicating a greater contribution to model predictions. Additionally, the SHAP summary plot offers a clear visualization of each feature's specific impact on the predictions, with each point representing a feature value for an individual patient. We also generated SHAP dependence plots to further explain the influence of specific features on the prediction outcomes. The SHAP method was implemented using the shapviz package in R.
Perform logistic regression analysis on the training set to construct a corresponding nomogram, followed by validation and performance evaluation on the testing set. The logistic regression and nomogram are implemented using the rms package in R.
Continuous data were expressed as mean ± standard deviation or median with interquartile range (IQR), while categorical data were presented as frequency and percentage. For comparisons between groups, categorical variables were analyzed using the chi-square test, and continuous data were assessed using an independent samples t-test. All statistical analyses were conducted using IBM SPSS (Version 25.0; IBM, Armonk, NY, USA), with P < 0.05 (two-sided) considered statistically significant.
This study included data from 1,331 Long COVID patients, with 1,155 classified as effective and 176 as ineffective. Although cases with more than 20% missing clinical data were excluded, some missing values still existed in the included patient records. The missing variables primarily involved Alanine Aminotransferase/Aspartate Aminotransferase (ALT/AST) and creatinine, each accounting for 3.5% of the total dataset. To address this, we used Random Forest regression to estimate the missing data. The mice package in R is used to impute missing values using the Random Forest regression algorithm, generating multiple imputed datasets. The first complete dataset is then selected from the imputed results and saved.
The completed dataset was divided based on the time and location of patient visits. Data from 1,204 patients treated at TAHZCMU between December 2022 and June 2023 were used as the training set, while data from 127 patients treated at TAHZCMU, JFPH, and HPH between June 2023 and February 2024 were used as the testing set. There were no significant differences in baseline characteristics between the training and test sets. A summary of patient characteristics in each group is provided in Table 2.
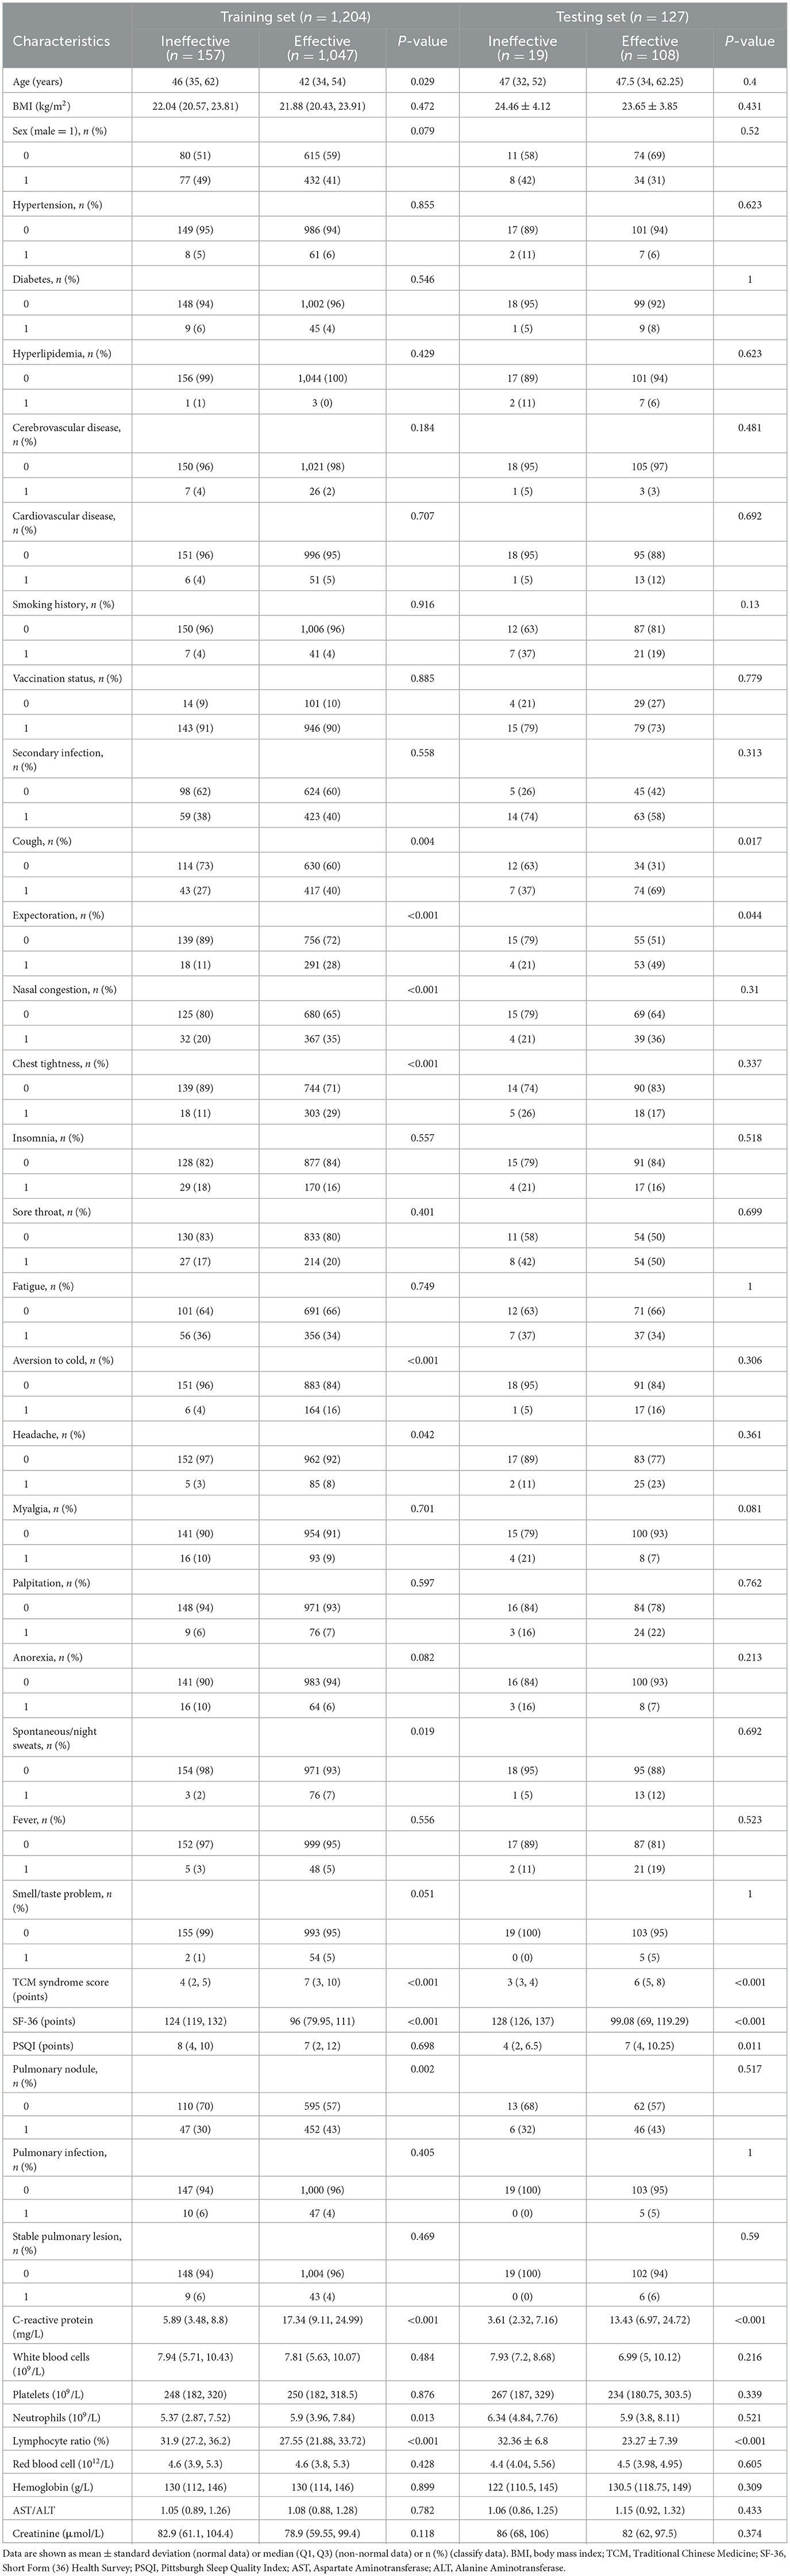
Table 2. Patient characteristics in the training and testing sets.
Prior to conducting Lasso regression, we first performed Receiver Operating Characteristic (ROC) curve analysis for individual features (Figure 2A) and generated a bar chart representing the AUC values (Figure 2B). The results indicated that several features had relatively high AUC values: SF-36 (AUC = 0.862), CRP (AUC = 0.797), TCMSS (AUC = 0.736), lymphocyte ratio (AUC = 0.662), expectoration (AUC = 0.586), chest tightness (AUC = 0.574), nasal congestion (AUC = 0.573), cough (AUC = 0.571), pulmonary nodule (AUC = 0.571), aversion to cold (AUC = 0.558), neutrophils (AUC = 0.550), age (AUC = 0.543), and creatinine (AUC = 0.542). These features are likely candidates for inclusion in the model. To further refine the model, we conducted a correlation analysis of all features (Figure 2C) to eliminate highly correlated factors that might negatively impact model performance.
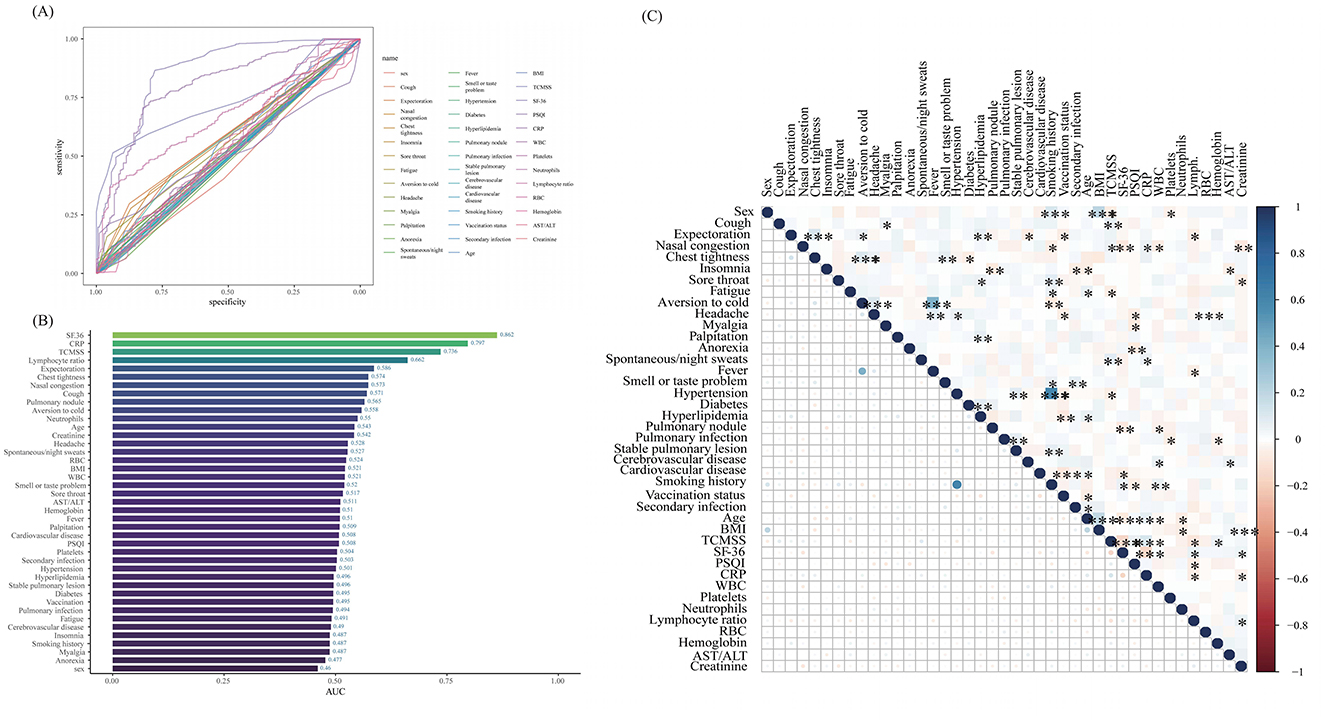
Figure 2. The results of the ROC curve, AUC value, and correlation analysis. (A) Receiver Operating Characteristic (ROC) curve plot; (B) Area Under the Curve (AUC) bar chart; (C) Correlation matrix heatmap. BMI, body mass index; TCMSS, Traditional Chinese Medicine syndrome score; SF-36, Short Form (36) Health Survey; PSQI, Pittsburgh Sleep Quality Index; CRP, C-reactive protein; WBC, White blood cells; RBC, Red blood cells; AST/ALT, the ratio of Aspartate Aminotransferase to Alanine Aminotransferase. *p < 0.05, **p < 0.01, ***p < 0.001.
The optimal parameter (lambda) for LASSO regression was determined using 10-fold cross-validation, with the best value indicated by the minimum criteria and the 1-SE (standard error) of the minimum criteria, represented by dashed lines (Figures 3A, B). Our LASSO regression results identified nine significant variables: SF-36, CRP, TCMSS, lymphocyte ratio, expectoration, chest tightness, Pulmonary nodule, aversion to cold, and age. Due to the low correlation among these variables, they were all included in the final model.
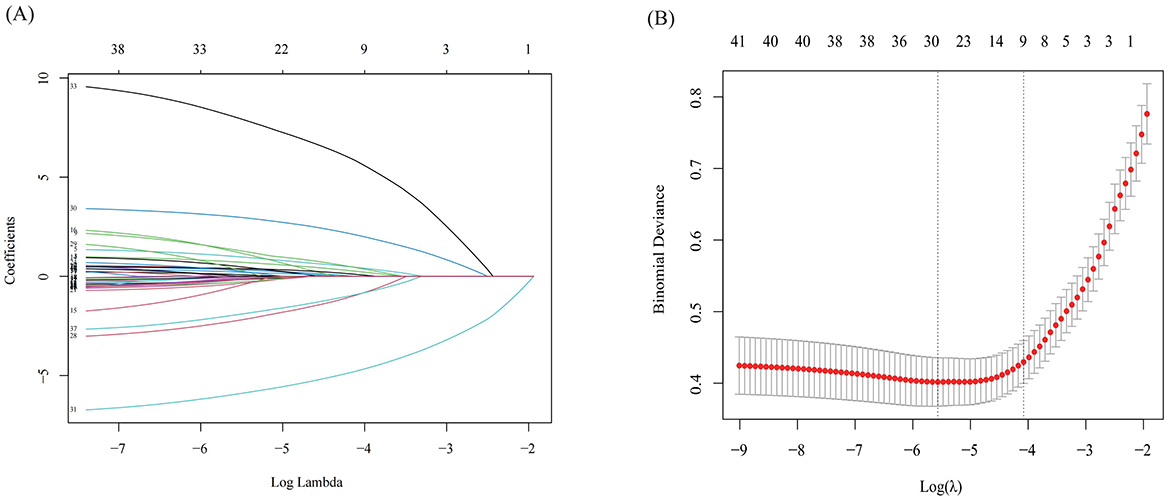
Figure 3. The results of Lasso regression. (A) LASSO Coefficient Path Plot; (B) Cross-Validation Error Plot for LASSO.
When evaluating the performance of the ML models on the training set, XGBoost and RF showed the highest AUC values (XGBoost: 0.9957, 95% CI: 0.9934–0.9981; RF: 0.9871, 95% CI: 0.9819–0.9924) (Figure 4A and Table 3). The F1 score was used to further compare model performance, as it is well-suited for imbalanced datasets, reflecting a balance between precision (positive predictive value) and recall (sensitivity) (25, 26). The XGBoost model achieved the highest F1 score (0.9852, 95% CI: 0.9777–0.9921). In the testing set, XGBoost continued to perform well, with an AUC of 0.9059 (95% CI: 0.8437–0.9682) and the highest F1 score of 0.9027 (95% CI: 0.8258–0.9485). In contrast, the RF model underperformed, with a lower F1 score (0.8197, 95% CI: 0.7315–0.8749), suggesting weaker generalization ability and potential overfitting (Figure 4B and Table 4) (28). As a result, the XGBoost model was selected for downstream analysis.
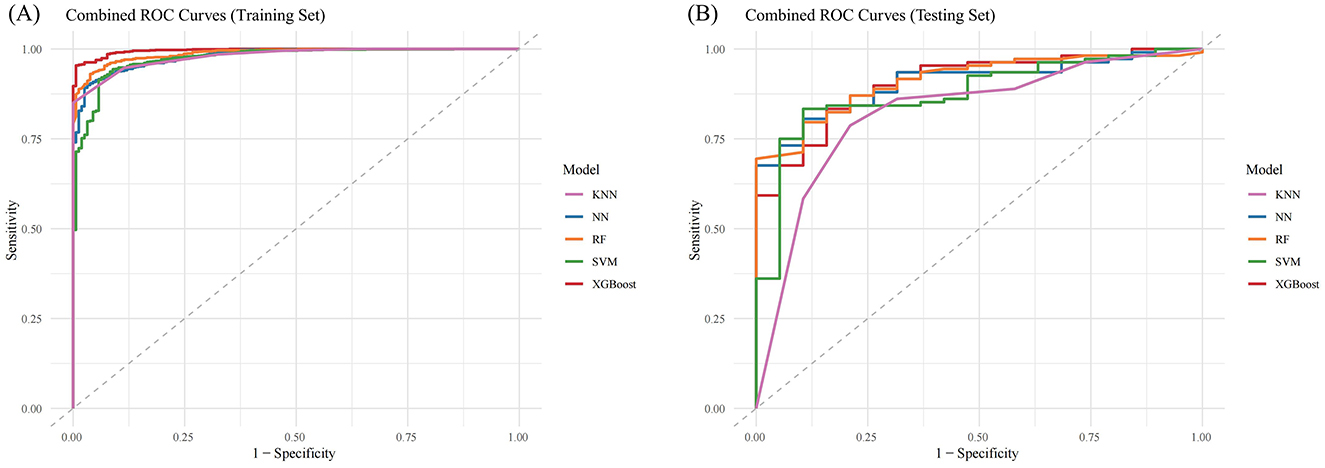
Figure 4. Combined ROC Curves for Multiple Machine Learning Models. (A) ROC curves for training sets; (B) ROC curves for testing sets. KNN, K-Nearest Neighbors; NN, Neural Network; RF, Random Forest; SVM, Support Vector Machine; XGBost, Extreme Gradient Boosting.
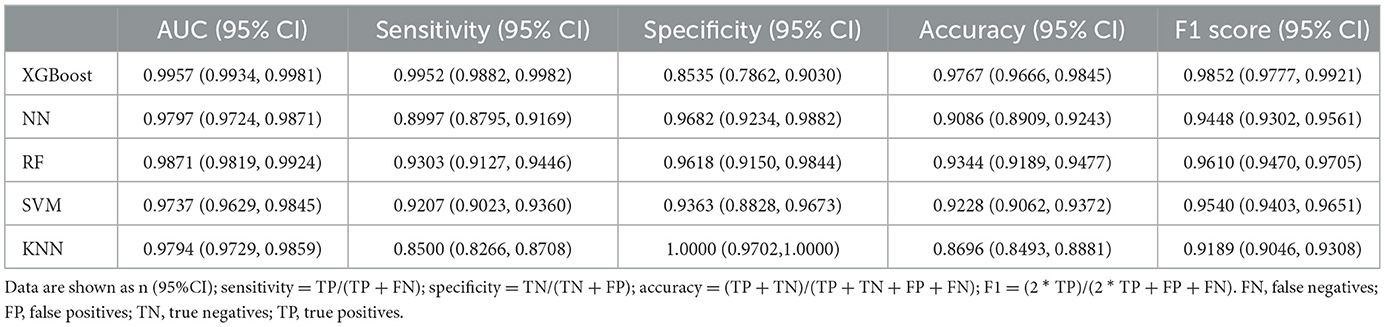
Table 3. Evaluation of model performance in the training set.
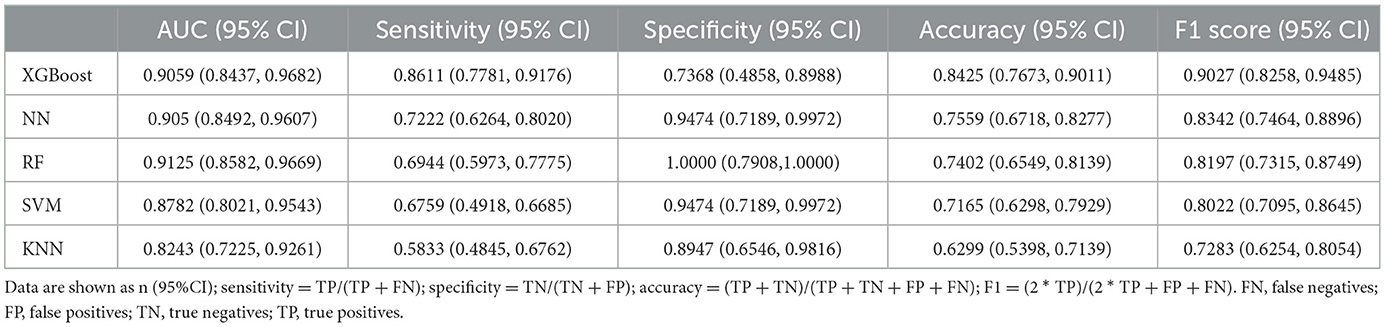
Table 4. Evaluation of the model performances in the testing set.
The SHAP feature importance for the XGBoost model is shown in Figure 5A, with features ranked by mean absolute SHAP values from highest to lowest. The key features identified were SF-36, TCMSS, CRP, aversion to cold, chest tightness, age, and lymphocyte ratio. The SHAP summary plot (Figure 5B) illustrates the influence of each feature on the model's predictions. A higher SHAP value indicates a greater likelihood of TCM being effective in treating Long COVID. For instance, patients with a lower lymphocyte ratio responded better to TCM treatment compared to those with a higher ratio. Similarly, patients with symptoms like chest tightness and aversion to cold showed a better response to TCM treatment than those without these symptoms.
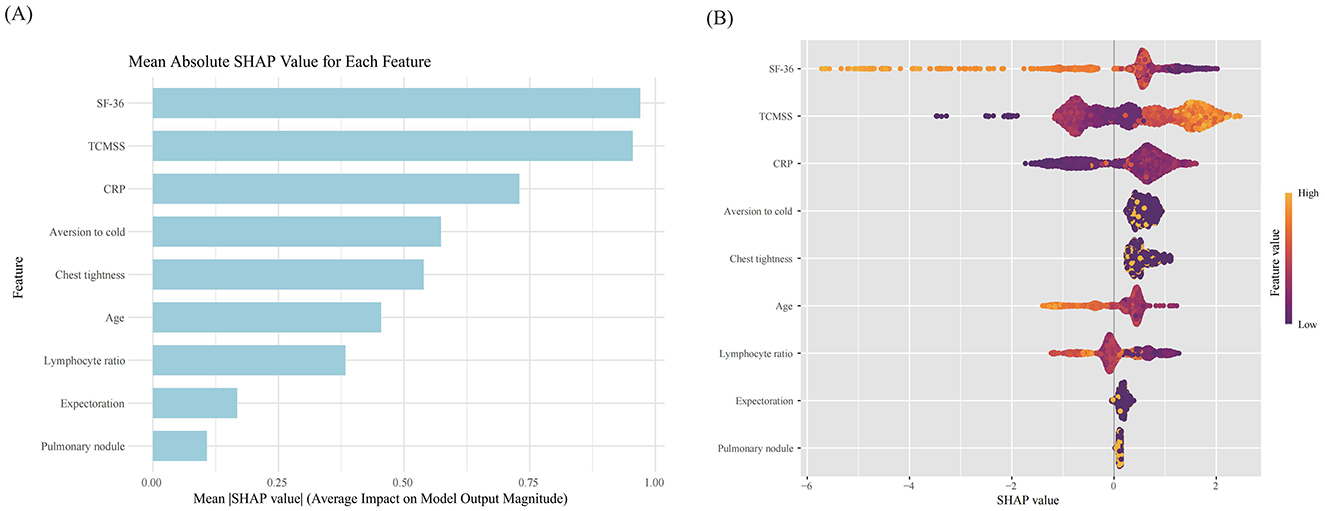
Figure 5. SHAP value of each feature in the model. (A) SHAP feature importance shown according to the mean absolute SHAP value of each feature; (B) SHAP summary plot showing the distribution of the SHAP values of each feature. SF-36, Short Form (36) Health Survey; TCMSS, Traditional Chinese Medicine syndrome score; CRP, C-reactive protein.
Additionally, the SHAP dependence plot (Figure 6) demonstrates the impact of individual continuous variables on the prediction of TCM treatment efficacy. Lower values for age, SF-36, and lymphocyte ratio (decreasing x-axis values) are associated with higher SHAP values, while increases in TCM syndrome score and CRP (increasing x-axis values) are also linked to higher SHAP values, indicating a greater likelihood of improvement following TCM treatment (increasing y-axis values).
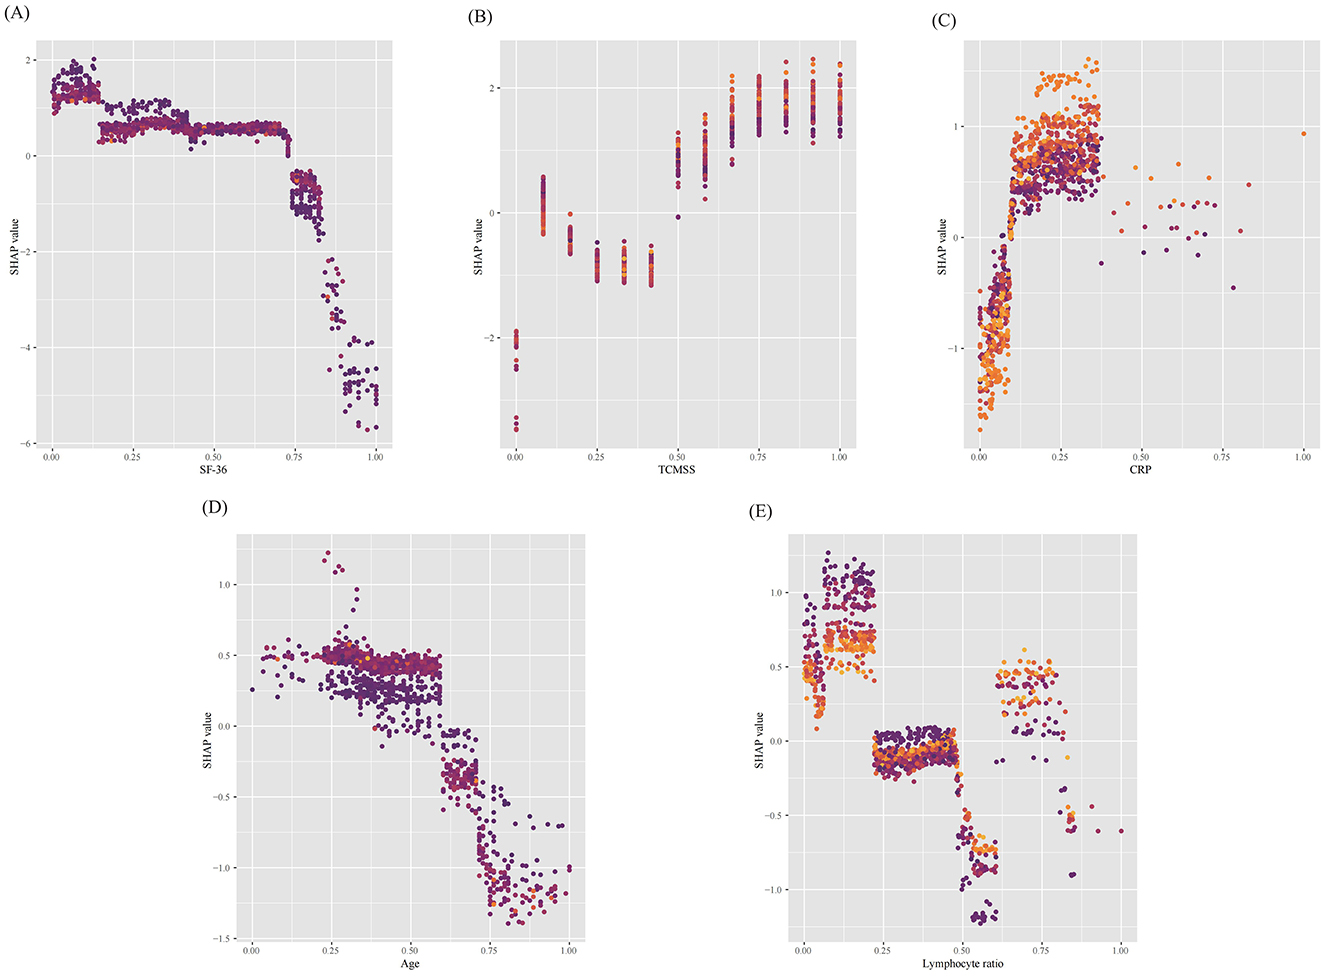
Figure 6. SHAP dependence plots of continuous features in the model. (A) Short Form (36) Health Survey (SF-36), (B) Traditional Chinese Medicine (TCM) syndrome score, (C) C-reactive protein (CRP), (D) age and (E) Lymphocyte ratio. The y-axis represents the SHAP values of features, and the values of certain features are shown in the x-axis, continuous variables were standardized using the min–max scaling method, resulting in values between 0 and 1. Each dot represents a SHAP value for a feature per patient, and color from light to dark represents the feature's value from high to low. SHAP values for specific features exceeding zero represent an increased probability of Traditional Chinese Medicine being effective in treating long COVID. SF-36, Short Form (36) Health Survey; TCMSS, Traditional Chinese Medicine syndrome score; CRP, C-reactive protein.
When evaluating the contribution of each feature to individual patients using the XGBoost model, we applied the SHAP method to randomly interpret the prediction results for two individual patients. The color represents each feature's contribution, with red indicating a positive contribution and blue indicating a negative contribution. The length of the color bar reflects the strength of the contribution. E[f (x)] is the baseline prediction value in the SHAP method, representing the average prediction of the model, typically the mean of the predictions across all samples. It serves as the reference or baseline against which the contribution of each feature to the model's output is measured. The formula is given by E[f (x)], where N is the number of samples in the dataset, and fxi is the prediction value for the i-th sample (12). If the final predicted value f (x) exceeds the baseline prediction value E[f (x)], the case is classified as belonging to the effective group; if f (x) is lower than E[f (x)], the case is classified as belonging to the ineffective group.
As shown in Figure 7A, the predicted value for the current case, f (x) = 5.82, is much higher than the baseline prediction E[f (x)] = 2.42. In this case, factors such as CRP = 0.067 (indicating inflammation), aversion to cold = 1 (yes), chest tightness = 1 (yes), SF-36 = 0.045 (indicating poor quality of life), and TCM syndrome score = 0.667 (indicating poor health) all positively contributed to the prediction of TCM treatment effectiveness.
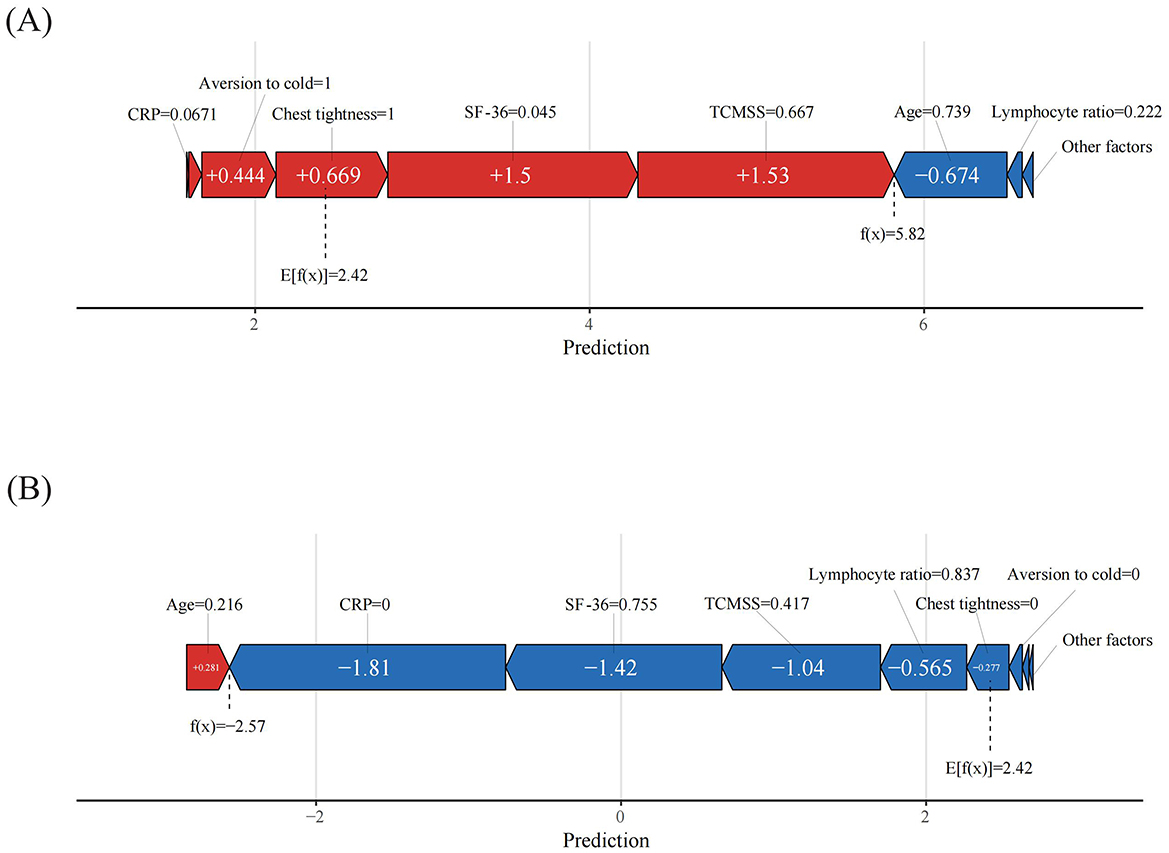
Figure 7. Patient-level SHAP force plots. (A) True positive patient, (B) True negative patient. The color represents the contributions of each feature, with red being positive and blue being negative. The length of the color bar represents the contribution strength.
Similarly, in Figure 7B, the case was classified as ineffective, with a predicted value f (x) = −2.57, far lower than the baseline prediction value. In this case, CRP = 0 (no inflammation), SF-36 = 0.755 (indicating higher quality of life), TCM syndrome score = 0.417 (indicating better health), lymphocyte ratio = 0.837 (slightly above normal), chest tightness = 0 (no), and aversion to cold = 0 (no), all contributed to the prediction of treatment ineffectiveness.
In the training set, the nomogram developed from the logistic regression analysis (Figure 8) achieved an AUC of 0.9436 (95% CI, 0.9242–0.9629), an accuracy of 0.9228 (95% CI, 0.9058–0.9369), and an F1 score of 0.9562 (95% CI, 0.9470–0.9649). The nomogram was then evaluated on the testing set, where it achieved an AUC of 0.9479 (95% CI: 0.9092–0.9865), an accuracy of 0.8976 (95% CI: 0.8281–0.9422), and an F1 score of 0.9384 (95% CI: 0.9005–0.9694), demonstrating strong predictive performance.
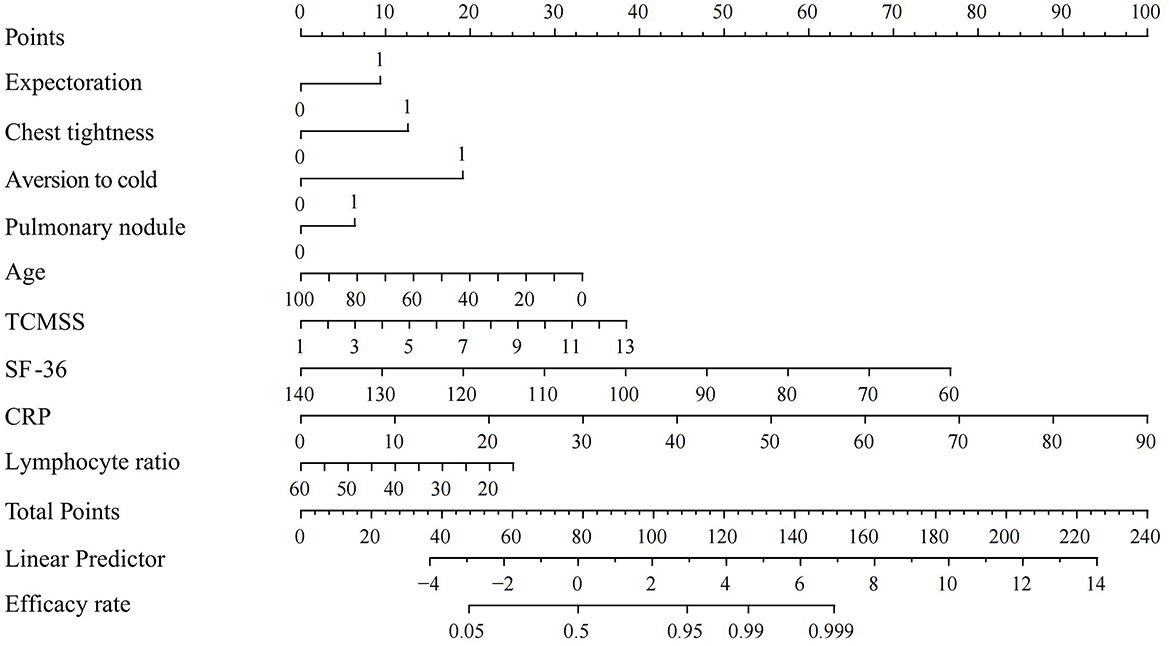
Figure 8. Nomogram for logistic regression. SF-36, Short Form (36) Health Survey; TCMSS, Traditional Chinese Medicine syndrome score; CRP, C-reactive protein.
Long COVID predominantly manifests through a series of debilitating symptoms, encompassing multi-system dysfunction (23). Several studies have demonstrated that TCM can alleviate symptoms such as dyspnea, reduced respiratory rate, fatigue, and myalgia associated with Long COVID, while enhancing overall quality of life. Moreover, TCM has been shown to improve infection markers, reduce lung fibrosis, enhance coagulation function and myocardial recovery, strengthen immune function, and inhibit viral replication (9, 29). In the early recovery stage of Long COVID-19, TCM focuses on alleviating fatigue, improving neurological symptoms, and regulating the spleen and stomach function. In the chronic persistent stage, TCM emphasizes comprehensive intervention for multi-system symptoms, with long-term treatment aimed at restoring the body's functional balance (6, 10). The TCM treatment plan for Long COVID used in this study was developed based on the most commonly prescribed formulas in the Zhejiang Provincial Medical Information System (HALO System: Copyright 1999–2024 Lianzhong Zhihui) and tailored to the pathogenesis of Long COVID patients in Zhejiang, characterized by “Yang Qi deficiency with Qi and Yin depletion.” This plan was formed through consensus among TCM experts from multiple hospitals. A sequential treatment approach was adopted to enhance efficacy and reduce side effects (30). Preliminary cohort studies and multicenter randomized controlled trials have demonstrated that, compared to conventional therapies (e.g., corticosteroids or metoprolol), this treatment plan offers superior improvement in clinical symptoms, with comparable effects on inflammatory markers and pulmonary imaging outcomes [unpublished observation].
To better promote the application of TCM in Long COVID treatment, we applied various ML models for data analysis and found that the XGBoost model performed best. This led to the development of the first ML model to predict the efficacy of TCM in treating Long COVID. XGBoost is a highly efficient ML algorithm built on a gradient boosting framework, specifically designed to handle sparse data. The core advantages of XGBoost are as follows: First, it integrates the gradient boosting framework with deep optimization of computational systems, overcoming the computational efficiency bottleneck while maintaining the interpretability of tree-based models. Second, through second-order derivative optimization and multiple regularization designs, it achieves a better balance in the bias-variance trade-off. Additionally, it incorporates dedicated mechanisms to handle specific data characteristics (sparsity, missing values, and high dimensionality). These innovations enable XGBoost to demonstrate more robust predictive performance compared to other models, especially in business scenarios where feature interactions are complex but data volumes are limited (31). Among various ML models evaluated, XGBoost consistently outperformed others in both the training and test sets, exhibiting superior generalization ability. This indicates that XGBoost effectively captures the intricate features of Long COVID patients, enabling accurate predictions of TCM treatment outcomes. In the feature selection of this model, although the AUC values for the pulmonary nodule and aversion to cold features are relatively low, they remain above 0.5, indicating that these features have some predictive power. In the LASSO regression, features with significant impact are selected through the application of L1 regularization, and these features are chosen as non-zero variables, which are still considered valuable for model optimization.
Although logistic regression underperformed compared to the XGBoost model, the complexity of ML algorithms may impede understanding between healthcare providers and patients (32). This led us to develop a nomogram using logistic regression as a complementary tool to the ML model, making it more practical for clinicians and helping patients better understand the necessity of treatment. Although nomograms have certain limitations in handling complex non-linear relationships and large datasets compared to ML models like XGBoost (18), the nomogram demonstrated a high AUC and F1 score in the test set, indicating strong accuracy in predicting positive outcomes for Long COVID patients treated with TCM. Overall, the nomogram evaluation suggests that patients with total points exceeding 152, or a linear predictor value above 7, are more likely to experience improvement with TCM treatment.
In this study, we used LASSO regression to select nine risk factors for inclusion in the model. By further calculating the SHAP values for each feature in the model, we evaluated the contribution of different features to the model's predictions and identified seven key factors that play a critical role in predicting the efficacy of TCM for Long COVID treatment. These features include SF-36, TCMSS, CRP, aversion to cold, chest tightness, age, and lymphocyte ratio, all of which are easily assessable in clinical practice.
The SF-36 is a widely used standardized questionnaire that assesses eight dimensions, including physical functioning, social functioning, and mental health. It effectively evaluates the quality of life and health status in COVID and Long COVID patients (33). The TCMSS is a quantitative tool used to assess TCM syndromes, helping to objectify and standardize subjective diagnostic indicators. It serves as a key measure for evaluating the efficacy of TCM and summarizes the patient's physical condition at a particular stage of illness (34). Together, SF-36 and the TCM syndrome score provide valuable insights into the effectiveness of TCM in improving overall health and quality of life.
The symptom of aversion to cold is often linked to neurological dysfunction or vascular abnormalities (35), while chest tightness is commonly associated with cardiopulmonary dysfunction, particularly issues related to cardiac or vascular abnormalities and lung fibrosis (36, 37). This suggests that TCM may play a significant role in improving the neurological, circulatory, and respiratory functions affected by Long COVID. Furthermore, the correlation between increased age and reduced treatment efficacy may be attributed to immunosenescence, characterized by diminished anti-inflammatory mechanisms and persistent chronic inflammation, leading to slower recovery post-infection (38).
Additionally, this study identified two auxiliary diagnostic indicators that contribute to efficacy prediction, which have been largely overlooked in previously published TCM-related prediction models. CRP is a key marker of inflammation, sensitively reflecting the inflammatory state of Long COVID patients. Elevated CRP levels are typically associated with acute and chronic inflammatory processes (39). The lymphocyte ratio, reflecting immune function, represents a critical immune cell population involved in fighting infections and clearing pathogens. It plays an essential role during both the pathological process and recovery stages of viral diseases. A lower lymphocyte ratio often indicates impaired immune function (40, 41). While the mechanisms underlying these improvements require further rigorous biological research, their predictive value in treatment efficacy is already evident.
Therefore, this study demonstrates that despite the complexity of Long COVID's pathogenesis and the uncertainty surrounding treatment strategies, key features identified through ML models can reflect these underlying pathological processes. This provides a theoretical basis and predictive value for the application of TCM in treating Long COVID patients. Furthermore, the identification of these features may guide future efforts to explore and optimize TCM treatment regimens, addressing the diverse pathological changes associated with Long COVID.
The ML model developed in this study provides predictive information based on patients' clinical data, aimed at assisting healthcare providers in identifying Long COVID patients suitable for TCM treatment. When the model's predicted value exceeds the baseline prediction and the Nomogram's efficacy accuracy is >0.999, it suggests a higher likelihood of the patient benefiting from TCM treatment for Long COVID. However, the final validation of treatment effectiveness still requires further clinical research. Additionally, a dynamic calibration mechanism should be established in clinical practice to continuously monitor the model's predictive performance, ensuring its consistency with actual treatment outcomes. At the same time, healthcare providers should have a certain understanding of the principles behind machine learning models, as this not only helps doctors make more scientifically informed diagnostic decisions but also enables patients to better understand the necessity of the treatment plan.
However, this study has various limitations. First, although our ML model was trained on a large-scale database from a tertiary medical center and tested using multiple external databases, all case data were derived from Zhejiang Province, China, necessitating caution when applying these results to other regions; Second, as the study was based on database-derived cases, the data may contain subjective biases, though we sought to minimize this by incorporating objective index into our analysis; Third, the number of cases defined as treatment failures was relatively small, possibly due to incomplete follow-up data for these patients. Fourth, there were challenges in categorizing some subjective indicators, such as differentiating between systemic and localized aversion to cold, which may involve distinct neural pathways, thus lacking finer evaluation. Fifth, the scope of inflammatory, immunological, and imaging-related parameters included in this study was limited, hindering the model from reaching its full predictive potential.
In future studies, we plan to collect additional external validation datasets from other regions to further refine and enhance the model's performance. We also encourage other researchers to validate their own datasets using our model parameters. To address the issue of data bias, we will expand the diversity of the sample, integrate additional biomarker data, strengthen the integration of clinical information, enhance the collection of longitudinal data, utilize multimodal data, optimize data quality control, and promote interdisciplinary collaboration. Moreover, to gain a deeper understanding of the underlying reasons for treatment failure, future research will focus on detailed analysis and data mining of these cases, aiming to further optimize treatment strategies.
TCM is an important treatment modality for Long COVID. The XGBoost model, built on clinical data, effectively identifies Long COVID patients who are most likely to benefit from TCM treatment. Using the SHAP method, we interpreted the model and identified key features with the highest contributions, thereby developing a clinically interpretable ML model. Additionally, we constructed a nomogram to further support the application of the ML model in both prediction and interpretation, providing a more intuitive tool for clinical decision-making.
The raw data supporting the conclusions of this article will be made available by the authors, without undue reservation.
The studies involving humans were approved by Ethics Committee of Third Affiliated Hospital of Zhejiang Chinese Medical University. The studies were conducted in accordance with the local legislation and institutional requirements. The participants provided their written informed consent to participate in this study.
JisZ: Conceptualization, Data curation, Methodology, Writing – original draft, Writing – review & editing. YC: Conceptualization, Data curation, Methodology, Writing – original draft, Writing – review & editing. AZ: Data curation, Project administration, Writing – original draft, Writing – review & editing. YY: Data curation, Project administration, Writing – review & editing. LM: Conceptualization, Methodology, Writing – original draft, Writing – review & editing. HM: Visualization, Writing – original draft. JW: Visualization, Writing – review & editing. KZ: Writing – review & editing. JiaZ: Writing – review & editing. KL: Writing – review & editing. XL: Funding acquisition, Project administration, Supervision, Writing – review & editing.
The author(s) declare that financial support was received for the research and/or publication of this article. This study was supported by the national and provincial joint project (GZY-ZJ-KJ-24023).
We extend our gratitude to the participants involved in this study.
The authors declare that the research was conducted in the absence of any commercial or financial relationships that could be construed as a potential conflict of interest.
The author(s) declare that no Gen AI was used in the creation of this manuscript.
All claims expressed in this article are solely those of the authors and do not necessarily represent those of their affiliated organizations, or those of the publisher, the editors and the reviewers. Any product that may be evaluated in this article, or claim that may be made by its manufacturer, is not guaranteed or endorsed by the publisher.
ML, Machine learning; TCM, Traditional Chinese Medicine; TAHZCMU, Third Affiliated Hospital of Zhejiang Chinese Medical University; JFPH, Jiaxing First People's Hospital; HPH, Haining People's Hospital; LASSO, Least absolute shrinkage and selection operator; SVM, Support Vector Machine; RF, Random Forest; KNN, K-Nearest Neighbors; XGBoost, Extreme Gradient Boosting; NN, Neural Network; SHAP, SHapley Additive exPlanations; AUC, Area Under the Curve; ROC, Receiver Operating Characteristic; TCMSS, Traditional Chinese Medicine syndrome score; SF-36, Short Form (36) Health Survey; CRP, C-reactive protein; BMI, body mass index; PSQI, Pittsburgh Sleep Quality Index; AST, Aspartate Aminotransferase; ALT, Alanine Aminotransferase; WBC, White blood cells; RBC, Red blood cells.
1. Soriano JB, Murthy S, Marshall JC, Relan P, Diaz JV. WHO Clinical Case Definition Working Group on Post-COVID-19 Condition. A clinical case definition of post-COVID-19 condition by a Delphi consensus. Lancet Infect Dis. (2022) 22:e102–7. doi: 10.1016/S1473-3099(21)00703-9
2. Davis HE, McCorkell L, Vogel JM, Topol EJ. Long COVID: major findings, mechanisms and recommendations. Nat Rev Microbiol. (2023) 21:133–46. doi: 10.1038/s41579-022-00846-2
3. Ford ND. Long COVID and significant activity limitation among adults, by age—United States, June 1–13, 2022, to June 7–19, 2023. MMWR Morb Mortal Wkly Rep. (2023) 72:866–70. doi: 10.15585/mmwr.mm7232a3
4. Klein J, Wood J, Jaycox JR, Dhodapkar RM, Lu P, Gehlhausen JR, et al. Distinguishing features of long COVID identified through immune profiling. Nature. (2023) 623:139–48. doi: 10.1038/s41586-023-06651-y
5. Greenhalgh T, Sivan M, Perlowski A, Nikolich JŽ. Long COVID: a clinical update. Lancet. (2024) 404:707–24. doi: 10.1016/S0140-6736(24)01136-X
6. Luo H, Tang Q-l, Shang Y-x, Liang S-b, Yang M, Robinson N, et al. Can Chinese medicine be used for prevention of corona virus disease 2019 (COVID-19)? A review of historical classics, research evidence and current prevention programs. Chin J Integr Med. (2020) 26:243–50. doi: 10.1007/s11655-020-3192-6
7. Ren X, Shao XX, Li XX, Jia XH, Song T, Zhou WY, et al. Identifying potential treatments of COVID-19 from Traditional Chinese Medicine (TCM) by using a data-driven approach. J Ethnopharmacol. (2020) 258:112932. doi: 10.1016/j.jep.2020.112932
8. National Health Commission of the People's Republic of China. Diagnosis and treatment protocol for COVID-19 (10th Edn.). Beijing: National Health Commission of the People's Republic of China (2023). doi: 10.1002/hcs2.36
9. Jiang L, An X, Duan Y, Lian F, Jin D, Zhang Y, et al. The pathological mechanism of the COVID-19 convalescence and its treatment with traditional Chinese medicine. Front Pharmacol. (2022) 13:1054312. doi: 10.3389/fphar.2022.1054312
10. Zhang W, Ma L, Xie W, Li X, Zhang J, Sun J. Advances in the application of traditional Chinese medicine during the COVID-19 recovery period: a review. Medicine. (2024) 103:e37683. doi: 10.1097/MD.0000000000037683
11. Stevens LM, Mortazavi BJ, Deo RC, Curtis L, Kao DP. Recommendations for reporting machine learning analyses in clinical research. Circ Cardiovasc Q Outcomes. (2020) 13:e006556. doi: 10.1161/CIRCOUTCOMES.120.006556
12. Saeed W, Omlin C. Explainable AI (XAI): A systematic meta-survey of current challenges and future opportunities. Knowl Based Syst. (2023) 263:110273. doi: 10.1016/j.knosys.2023.110273
13. Pan D, Guo Y, Fan Y, Wan H. Development and application of traditional chinese medicine using AI machine learning and deep learning strategies. Am J Chin Med. (2024) 52:605–23. doi: 10.1142/S0192415X24500265
14. Wang Y, Shi X, Li L, Efferth T, Shang D. The impact of artificial intelligence on Traditional Chinese Medicine. Am J Chin Med. (2021) 49:1297–314. doi: 10.1142/S0192415X21500622
15. Tang Y, Li Z, Yang D, Fang Y, Gao S, Liang S, et al. Research of insomnia on traditional Chinese medicine diagnosis and treatment based on machine learning. Chin Med. (2021) 16:2. doi: 10.1186/s13020-020-00409-8
16. Tian Z, Fan Y, Sun X, Wang D, Guan Y, Zhang Y, et al. Predictive value of TCM clinical index for diabetic peripheral neuropathy among the type 2 diabetes mellitus population: a new observation and insight. Heliyon. (2023) 9:e17339. doi: 10.1016/j.heliyon.2023.e17339
17. Lai YJ, Liu SH, Manachevakul S, Lee TA, Kuo CT, Bello D. Biomarkers in long COVID-19: a systematic review. Front Med. (2023) 10:1085988. doi: 10.3389/fmed.2023.1085988
18. Bonnett LJ, Snell KIE, Collins GS, Riley RD. Guide to presenting clinical prediction models for use in clinical settings. BMJ. (2019) 365:l737. doi: 10.1136/bmj.l737
19. World Health Organization. Post COVID-19 Condition (Long COVID): Q&A. Geneva: World Health Organization (2022).
20. An YW, Yuan B, Wang JC, Wang C, Liu TT, Song S, et al. Clinical characteristics and impacts of traditional Chinese medicine treatment on the convalescents of COVID-19. Int J Med Sci. (2021) 18:646–51. doi: 10.7150/ijms.52664
21. Sudre CH, Murray B, Varsavsky T, Graham MS, Penfold RS, Bowyer RC, et al. Attributes and predictors of long COVID. Nat Med. (2021) 27:626–31. doi: 10.1038/s41591-021-01292-y
22. Efthimiou O, Seo M, Chalkou K, Debray T, Egger M, Salanti G. Developing clinical prediction models: a step-by-step guide. BMJ. (2024) 386:e078276. doi: 10.1136/bmj-2023-078276
23. Ledford H. Long-COVID treatments: why the world is still waiting. Nature. (2022) 608:258–60. doi: 10.1038/d41586-022-02140-w
24. World Health Organization. WHO Expert Meeting on Evaluation of Traditional Chinese Medicine in the Treatment of COVID-19 (Meeting Report). Geneva: World Health Organization (2022).
25. Bekkar M, Djemaa DHK. Evaluation measures for models assessment over imbalanced data sets. J Inf Eng Appl. (2013) 3:27–38.
26. Sokolova M, Lapalme G. A systematic analysis of performance measures for classification tasks. Inf Process Manag. (2009) 45:427–37. doi: 10.1016/j.ipm.2009.03.002
27. Hsu WH, Ko AT, Weng CS, Chang CL, Jan YT, Lin JB, et al. Explainable machine learning model for predicting skeletal muscle loss during surgery and adjuvant chemotherapy in ovarian cancer. J Cachexia Sarcopenia Muscle. (2023) 14:2044–53. doi: 10.1002/jcsm.13282
29. Chatatikun M, Indo HP, Imai M, Kawakami F, Kubo M, Kitagawa Y, et al. Potential of traditional medicines in alleviating COVID-19 symptoms. Front Pharmacol. (2024) 15:1452616. doi: 10.3389/fphar.2024.1452616
30. Chen YW Li KY, Lin CH, Hung PH, Lai HT, Wu CY. The effect of sequential combination of mirror therapy and robot-assisted therapy on motor function, daily function, and self-efficacy after stroke. Sci Rep. (2023) 13:16841. doi: 10.1038/s41598-023-43981-3
31. Chen T, Guestrin C. XGBoost: a scalable tree boosting system. In: Proceedings of the 22nd ACM SIGKDD International Conference on Knowledge Discovery and Data Mining. New York, NY, USA: Association for Computing Machinery (2016). p. 785–94.
32. Topol EJ. High-performance medicine: the convergence of human and artificial intelligence. Nat Med. (2019) 25:44–56. doi: 10.1038/s41591-018-0300-7
33. Wright G, Senthil K, Zadeh-Kochek A, Au JH-S, Zhang J, Huang J, et al. Health-related quality of life after 12 months post discharge in patients hospitalised with COVID-19-related severe acute respiratory infection (SARI): a prospective analysis of SF-36 data and correlation with retrospective admission data on age, disease severity, and frailty. BMJ Open. (2024) 14:e076797. doi: 10.1136/bmjopen-2023-076797
34. Hailong Z, Yimei S, Yan D, Xinguang L, Jiansheng L. Exploration of biomarkers for efficacy evaluation of traditional Chinese medicine syndromes of acute exacerbation of chronic obstructive pulmonary disease based on metabolomics. Front Pharmacol. (2024) 15:1302950. doi: 10.3389/fphar.2024.1302950
35. Stjernbrandt A, Carlsson D, Pettersson H, Liljelind I, Nilsson T, Wahlström J. Cold sensitivity and associated factors: a nested case-control study performed in Northern Sweden. Int Arch Occup Environ Health. (2018) 91:785–97. doi: 10.1007/s00420-018-1327-2
36. Gyöngyösi M, Alcaide P, Asselbergs FW, Brundel BJJM, Camici GG, Martins PdC, et al. Long COVID and the cardiovascular system—elucidating causes and cellular mechanisms in order to develop targeted diagnostic and therapeutic strategies: a joint Scientific Statement of the ESC Working Groups on Cellular Biology of the Heart and Myocardial and Pericardial Diseases. Cardiovasc Res. (2023) 119:336–56. doi: 10.1093/cvr/cvac115
37. McGroder CF, Zhang D, Choudhury MA, Salvatore MM, D'Souza BM, Hoffman EA, et al. Pulmonary fibrosis 4 months after COVID-19 is associated with severity of illness and blood leucocyte telomere length. Thorax. (2021) 76:1242–5. doi: 10.1136/thoraxjnl-2021-217031
38. Müller L, Di Benedetto S. From aging to long COVID: exploring the convergence of immunosenescence, inflammaging, and autoimmunity. Front Immunol. (2023) 14:1298004. doi: 10.3389/fimmu.2023.1298004
39. Luan YY, Yin CH, Yao YM. Update advances on C-reactive protein in COVID-19 and other viral infections. Front Immunol. (2021) 12:720363. doi: 10.3389/fimmu.2021.720363
40. Buonacera A, Stancanelli B, Colaci M, Malatino L. Neutrophil to lymphocyte ratio: an emerging marker of the relationships between the immune system and diseases. Int J Mol Sci. (2022) 23:3636. doi: 10.3390/ijms23073636
Keywords: machine learning, SHapley Additive exPlanations, nomogram, Traditional Chinese Medicine, Long COVID, efficacy
Citation: Zhang J, Chen Y, Zhang A, Yang Y, Ma L, Meng H, Wu J, Zhu K, Zhang J, Lin K and Lin X (2025) Explainable machine learning model and nomogram for predicting the efficacy of Traditional Chinese Medicine in treating Long COVID: a retrospective study. Front. Med. 12:1529993. doi: 10.3389/fmed.2025.1529993
Received: 18 November 2024; Accepted: 03 March 2025;
Published: 13 March 2025.
Edited by:
Ruida Hou, St. Jude Children's Research Hospital, United StatesReviewed by:
Jun-Jun Yeh, Ditmanson Medical Foundation Chia-Yi Christian Hospital, TaiwanCopyright © 2025 Zhang, Chen, Zhang, Yang, Ma, Meng, Wu, Zhu, Zhang, Lin and Lin. This is an open-access article distributed under the terms of the Creative Commons Attribution License (CC BY). The use, distribution or reproduction in other forums is permitted, provided the original author(s) and the copyright owner(s) are credited and that the original publication in this journal is cited, in accordance with accepted academic practice. No use, distribution or reproduction is permitted which does not comply with these terms.
*Correspondence: Xianming Lin, bGlueGlhbm1pbmcxOTY2QDE2My5jb20=
Disclaimer: All claims expressed in this article are solely those of the authors and do not necessarily represent those of their affiliated organizations, or those of the publisher, the editors and the reviewers. Any product that may be evaluated in this article or claim that may be made by its manufacturer is not guaranteed or endorsed by the publisher.
Research integrity at Frontiers
Learn more about the work of our research integrity team to safeguard the quality of each article we publish.