 Yi Kang1,2,3†
 Qian Jin3†Mengqi Zhou4
 Huijuan Zheng1,2Xiaobin Li1Aoshuang Li1,2Jing Wei Zhou1,2
 Jie Lv1,2*Yaoxian Wang1,2*
- 1Dongzhimen Hospital, Beijing University of Chinese Medicine, Beijing, China
- 2Renal Research Institution of Beijing University of Chinese Medicine, Beijing, China
- 3Graduate School of Beijing University of Chinese Medicine, Beijing, China
- 4Department of Traditional Chinese Medicine, Beijing Puren Hospital, Beijing, China
Background: Diabetic kidney disease (DKD) is one of the common microvascular complications of diabetes. The exploration of serum biomarkers holds promise for improving the efficiency and accuracy of early DKD diagnosis. This study aims to investigate the diagnostic value of transforming growth factor-β1 (TGF-β1) and cystatin C (CysC) in DKD patients.
Methods: A total of 126 patients with type 2 diabetes mellitus (T2DM) diagnosed at Dongzhimen Hospital, Beijing University of Chinese Medicine, between May 2021 and March 2023 were enrolled. Patients were categorized based on proteinuria levels and estimated glomerular filtration rate (eGFR). Correlation analyses were conducted to examine the relationships between serum TGF-β1, CysC, and clinical parameters. Logistic regression was applied to identify correlation factors for DKD and renal function impairment in T2DM patients. Furthermore, receiver operating characteristic (ROC) curve analysis was performed to assess diagnostic efficacy.
Results: Significant differences in TGF-β1 and CysC levels were observed across groups with varying proteinuria levels. CysC was positively correlated with TGF-β1 (r = 0.640, p < 0.001). TGF-β1 has been associated with proteinuria levels in T2DM patients. Each unit increase in TGF-β1 was associated with a 1.122-fold and 1.470-fold higher odds of the presence of microalbuminuria and proteinuria, respectively, in the normal proteinuria (NP) group. TGF-β1 and CysC showed varying diagnostic performance. TGF-β1 better distinguished microalbuminuria group (MP) from NP, while CysC alone was less effective. T2DM patients with impaired renal function exhibited significantly higher CysC and TGF-β1 levels compared to those with normal renal function. CysC emerged as an associated factor of renal function decline (OR = 2.255, p = 0.008). CysC demonstrated superior diagnostic efficacy compared to TGF-β1 in predicting renal function impairment (AUC = 0.974).
Conclusion: CysC and TGF-β1 can serve as potential biomarkers for assessing renal impairment and proteinuria in T2DM patients. Their combined evaluation demonstrates diagnostic value and clinical application potential.
1 Introduction
Diabetes mellitus is a chronic metabolic disorder. According to the IDF Diabetes Atlas, type 2 diabetes mellitus (T2DM) accounts for more than 90% of all diabetes cases globally, with an incidence rate that continues to rise annually (1). Diabetic kidney disease (DKD) is one of the primary microvascular complications of T2DM and has become the leading cause of end-stage renal disease (ESRD) (2). Early diagnosis is critical for the prevention and treatment of DKD (3). However, the current gold standard of renal biopsy is invasive, non-replicable, and carries a risk of bleeding, making it unnecessary for clinical DKD diagnosis. Glomerular filtration rate (GFR) and proteinuria are key parameters for evaluating kidney function and the severity of chronic kidney disease (CKD). However, these changes are not specific to DKD. Moreover, GFR calculated based on serum creatinine levels often remains unremarkable in the early stages of DKD (2, 4). The sensitivity and accuracy of microalbuminuria in assessing renal disease onset and progression in T2DM patients have also been increasingly questioned (5–7). This often results in delayed diagnosis and intervention for DKD, and once overt nephropathy develops, it irreversibly progresses to ESRD. Therefore, researchers have been seeking new biomarkers for DKD to improve early diagnostic accuracy and enhance the ability to predict disease progression.
DKD lesions may involve the glomeruli, tubules, interstitium, and vasculature, ultimately leading to irreversible renal fibrosis. Transforming growth factor-beta1 (TGF-β1) is a recognized profibrotic factor involved in glomerulosclerosis, tubulointerstitial fibrosis, and tubular epithelial cell transdifferentiation, playing a crucial role in the progression of CKD (8). Under DKD pathological conditions, factors such as hyperglycemia and renin-angiotensin system (RAS) activation stimulate the production of TGF-β1 in tubular cells, podocytes, mesangial cells, and glomerular endothelial cells (9–12). TGF-β1 has been identified as a key pathogenic factor in DKD progression (13). Serum cystatin C (CysC), unaffected by race or sex, is emerging as a potential alternative to serum creatinine for assessing kidney function (14). However, some studies suggest that its utility in early DKD evaluation remains controversial (7, 15–17). Additionally, elevated CysC expression triggered by TGF-β1 appears to be a common feature of the fibrotic process (18). Meta-analyses of several randomized controlled trials have confirmed that increased serum levels of TGF-β1 and CysC are associated with an elevated risk of DKD (19, 20), highlighting their significance in the onset and progression of DKD. However, systematic studies on the diagnostic value of TGF-β1 and CysC in DKD patients and their correlation with clinical parameters remain limited.
This study aims to investigate the expression characteristics of TGF-β1 and CysC in patients with varying degrees of renal impairment, analyze their correlation with clinical parameters, and evaluate their diagnostic value. This provides new insights and evidence for early diagnosis and monitoring of DKD. Furthermore, by analyzing the relationship between these biomarkers and disease progression, this study seeks to deepen understanding of disease mechanisms and identify potential therapeutic targets.
2 Methods
2.1 Study design and population
Patients diagnosed with T2DM at Dongzhimen Hospital, Beijing University of Chinese Medicine, from May 2021 to March 2023 were selected as study subjects. The study was approved by the Ethics Committee of Dongzhimen Hospital, Beijing University of Chinese Medicine (Approval No. 2022DZMEC-062-03), and informed consent was obtained from all participants. The study procedures are detailed in Figure 1.
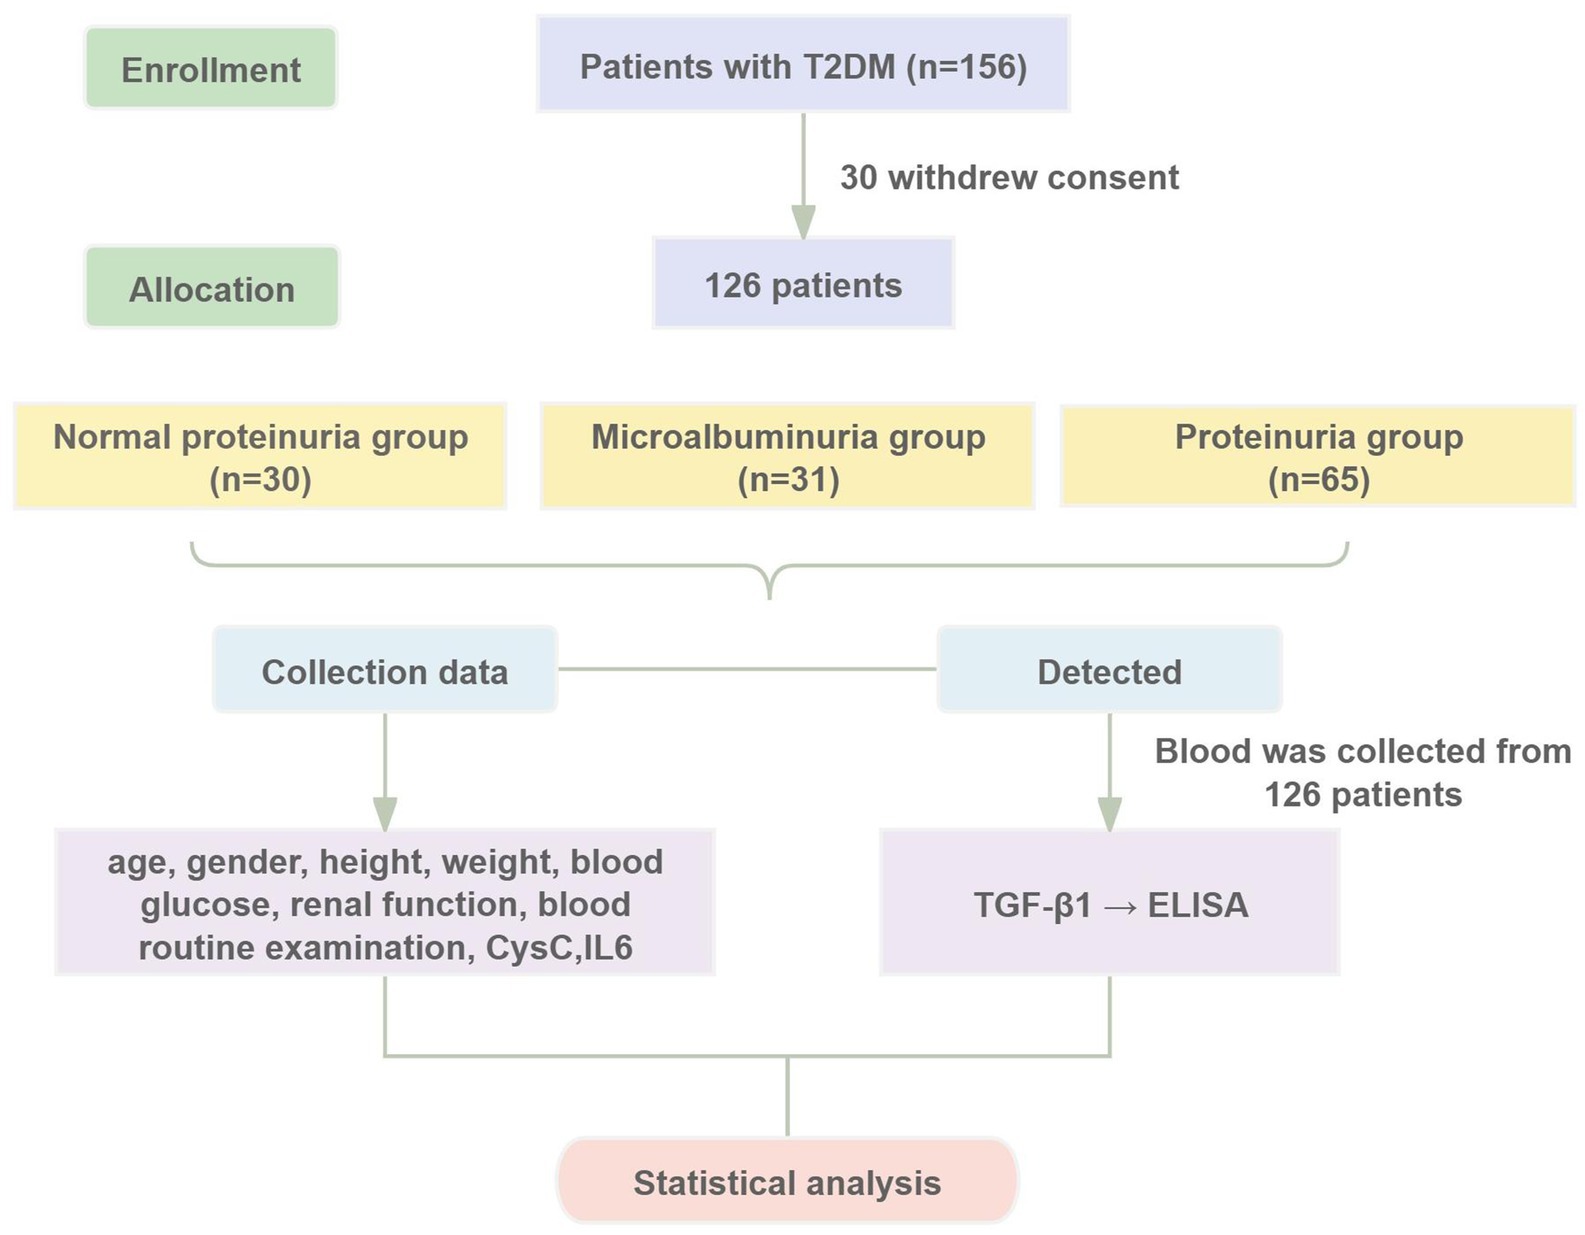
Figure 1. Diagram of the study design.
2.2 Inclusion and exclusion criteria
Inclusion criteria: (1) Age between 30 and 90 years. (2) Diagnosis of T2DM based on the Guidelines for the Prevention and Treatment of Type 2 Diabetes in China (2020 Edition) (21); diagnosis of DKD based on the 2007 National Kidney Foundation (NKF-KD/OQI) Guidelines (22), the 2020 Clinical Practice Guideline for the Evaluation and Management of CKD by the Kidney Disease: Improving Global Outcomes (KDIGO) organization (23) and the 2021 Chinese Clinical Guidelines for the Diagnosis and Treatment of Diabetic Kidney Disease (24). (3) Availability of complete clinical data. (4) Voluntary signing of an informed consent form.
Exclusion criteria: (1) Patients who had undergone dialysis or kidney transplantation. (2) Patients with primary or secondary nephropathy. (3) Patients with urinary tract infections or other acute or chronic inflammatory conditions. (4) Patients with abnormal liver function, autoimmune diseases, malignancies, hematologic disorders, or mental illnesses. (5) Patients who had experienced trauma, surgery, or psychological stress within the past 6 months.
2.3 Grouping strategies
2.3.1 Grouping strategy 1
The T2DM patients were categorized into three distinct groups based on their urinary albumin-to-creatinine ratio (UACR), which serves as an indicator of the severity of albuminuria. The groups included: the normal proteinuria group (NP group) (UACR <30 mg/g, n = 30), the microalbuminuria group (MP group) (UACR ranging from 30 to 300 mg/g, n = 31), and the proteinuria group (P group) (UACR >300 mg/g, n = 65).
2.3.2 Grouping strategy 2
In a second classification, patients with T2DM were divided into two categories according to their estimated glomerular filtration rate (eGFR). These were: the normal renal function group (NRF group) (eGFR ≥90 mL/min/1.73 m2, n = 44) and the group with decreased renal function (DRF group) (eGFR <90 mL/min/1.73 m2, n = 82).
2.4 Data collection
2.4.1 Participant characteristics
Clinical data were collected, including age, gender, height, weight, systolic blood pressure (SBP), and diastolic blood pressure (DBP). Body mass index (BMI) was calculated as weight divided by the square of height (kg/m2).
2.4.2 Laboratory testing
All patients were required to fast for more than 8 h. A single venous blood sample was collected from each patient on the second day after admission, in the early morning, after fasting. The blood sample was processed for centrifugation within 2 h of collection. Key biochemical parameters, including fasting plasma glucose (FPG), total protein (TP), urea, serum creatinine (Scr), uric acid (UA), and CysC, were quantified using an automated biochemical analyzer (Beckman Coulter, AU5821, United States). Complete blood count (CBC) was performed using an automated hematology analyzer (Beckman Coulter, DXH900, United States). The level of interleukin-6 (IL-6) was measured by chemiluminescence assay with an electrochemical luminescence assay (Roche Diagnostics, cobas e401). Five milliliters morning urine sample was collected, and UACR was measured using an automated biochemical analyzer (Beckman Coulter, AU5800, United States) by nephelometric immunoassay.
2.4.3 TGF-β1 measurement
Fasting venous blood samples were collected from all participants early on the second morning after admission and placed in anticoagulant tubes. The samples were centrifuged at 3,000 r/min at 4°C for 10 min, and the supernatant serum was aliquoted into EP tubes, labeled, and stored at −80°C. The TGF-β1 ELISA Kit (Wuhan Elabscience Biotechnology Co., Ltd., E-EL-0162) was used to determine the TGF-β1 concentration. The procedure was strictly followed according to the instructions. The intra-assay and inter-assay coefficients of variation were both <10%. For each plate, a standard curve (0–2,000 pg/mL, R2 > 0.99) and dual blank controls were set. The detailed operational procedure is provided in the Supplementary material.
2.5 Statistical analysis
All statistical analyses were performed using SPSS 26.0. The normality distribution was assessed using the Shapiro–Wilk test (n < 50) or the Kolmogorov–Smirnov test (n ≥ 50). p > 0.05 and the Q–Q plot indicates an approximate normal distribution, the data is considered to follow a normal distribution. For normally distributed data, comparisons between two groups were conducted using independent sample t-tests, and comparisons among multiple groups were performed using one-way analysis of variance (ANOVA). Non-normally distributed data were analyzed using nonparametric tests, with comparisons between two groups conducted using the Mann–Whitney U test and comparisons among multiple groups using the Kruskal–Wallis test. Categorical data were analyzed using the chi-square test. Bonferroni correction was applied to adjust p-values for multiple comparisons within groups. Pearson or Spearman rank correlation tests were used to assess relationships. Logistic regression analysis was conducted to identify correlated factors for DKD in T2DM patients. The area under the receiver operating characteristic (ROC) curve (AUC) was used to evaluate the diagnostic value. p < 0.05 was considered statistically significant.
3 Results
3.1 Analysis based on proteinuria groups
3.1.1 Baseline characteristics of patients by different levels of proteinuria
A total of 126 T2DM patients were enrolled in this study and classified into groups based on proteinuria levels: NP group (n = 30), MP group (n = 31), and P group (n = 65). No statistically significant differences were observed among the three groups in terms of age, gender, BMI, or DBP (p > 0.05). Significant differences in laboratory parameters, including Hb, PLT, FPG, UA, TP, Scr, and eGFR, were found among the three groups. Particularly, UA, Scr, and 24-UTP levels in the P group were significantly higher than other two groups (p < 0.001). Furthermore, SII, IL-6, and UACR showed highly significant differences among the three groups (p < 0.001) (Table 1). Serum CysC concentrations in each group were as follows: NP group, 9.583 ± 3.150 (10 mg/L); MP group, 9.410 ± 2.373 (10 mg/L); P group, 34.98 ± 15.46 (10 mg/L). Significant differences in serum CysC concentrations were observed among the three groups (p < 0.001), with CysC levels in the P group significantly higher than those in the NP and MP groups (p < 0.001) (Figure 2A). Serum TGF-β1 concentrations were as follows: NP group, 21.455 ± 9.790 ng/mL; MP group, 28.881 ± 7.115 ng/mL; P group, 42.041 ± 9.532 ng/mL. Significant differences in TGF-β1 concentrations were detected among the three groups (p < 0.001) (Figure 2B).
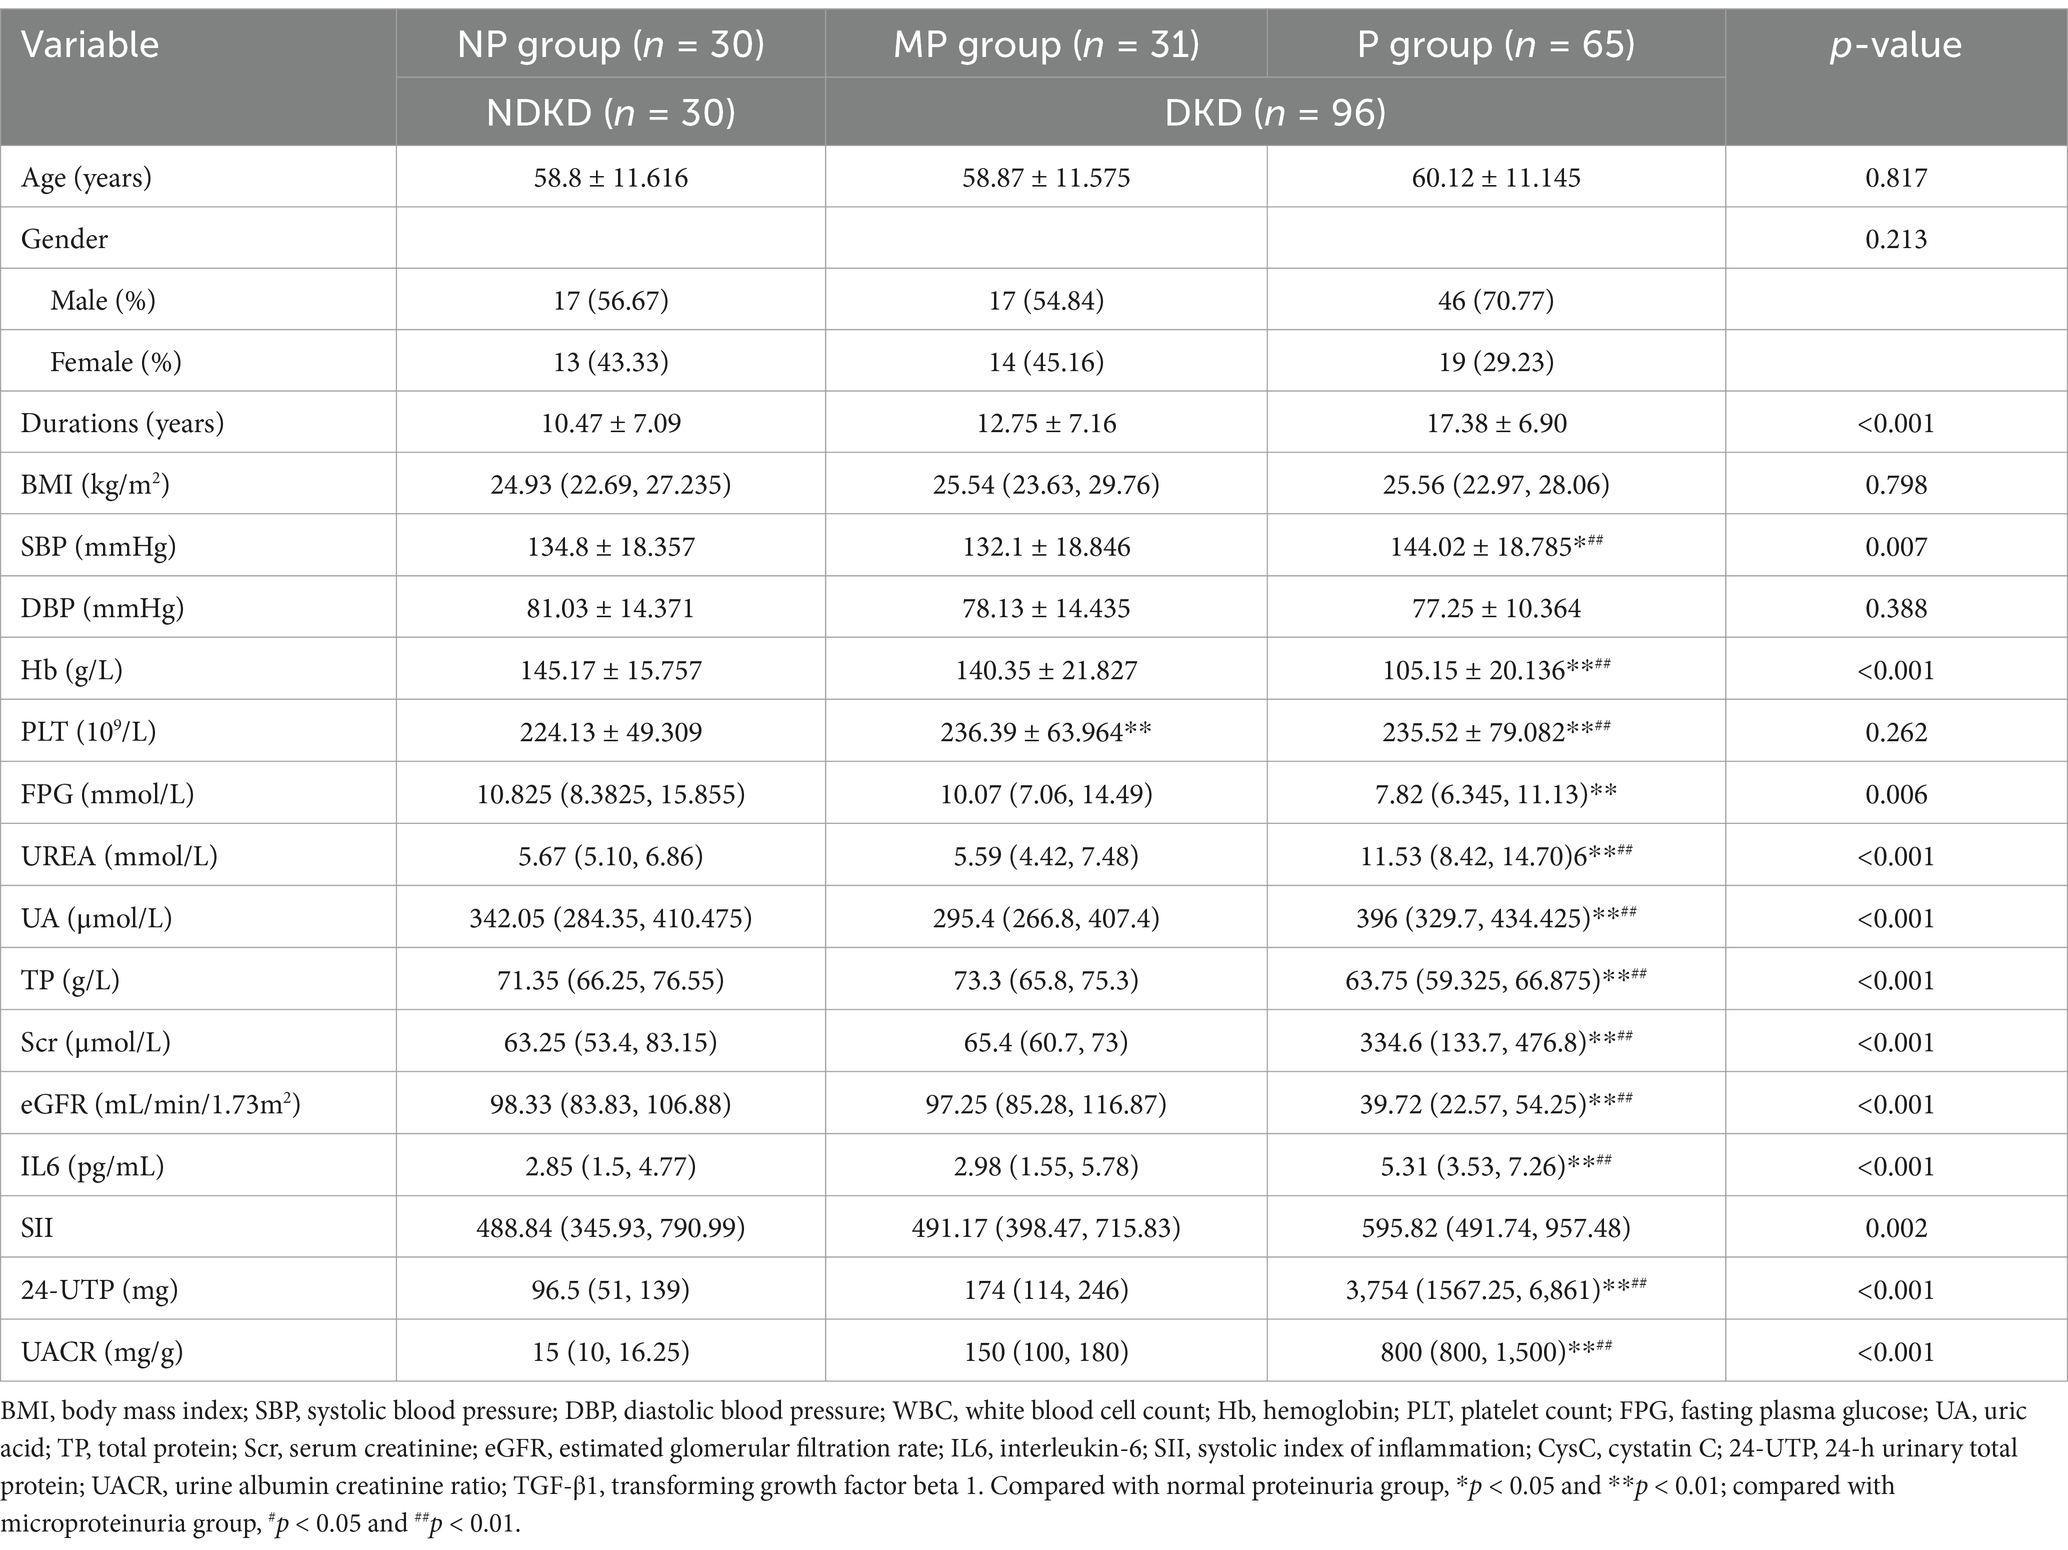
Table 1. Baseline characteristics of patients grouped by proteinuria levels.
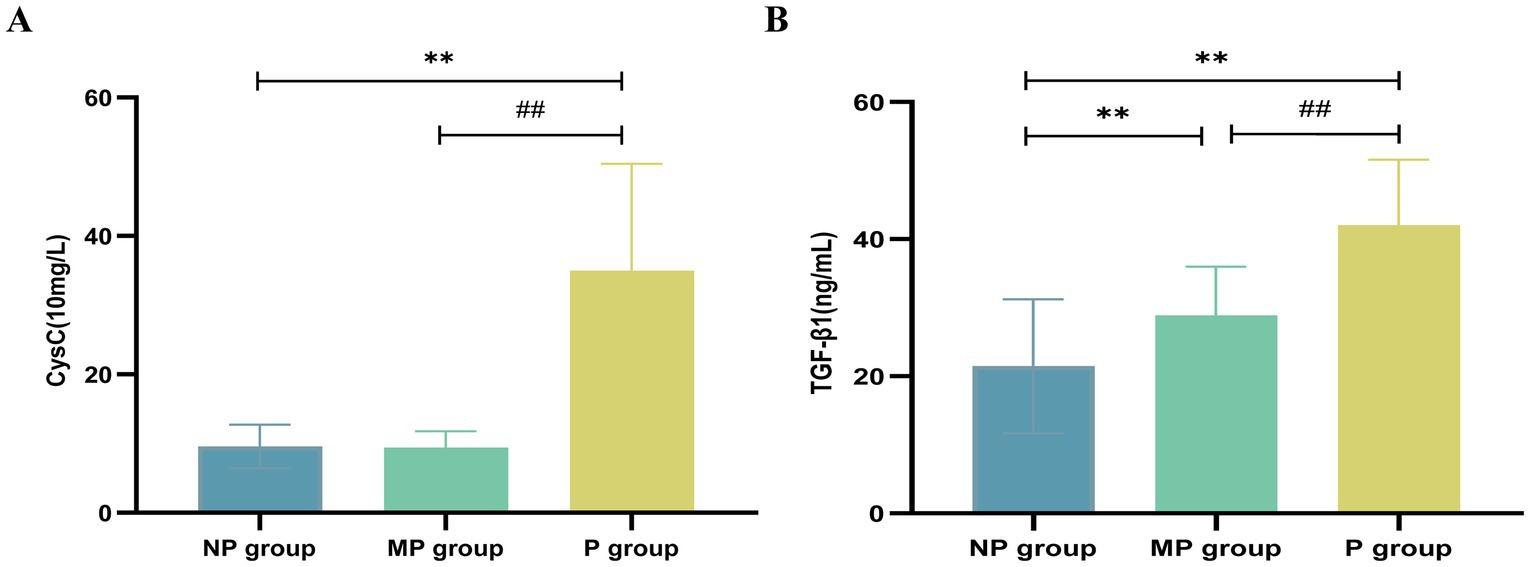
Figure 2. Expression levels of CysC and TGF-β1. (A) CysC. (B) TGF-β1. Compared with NP group, *p < 0.05 and **p < 0.01; compared with MP group, #p < 0.05 and ##p < 0.01.
3.1.2 Correlation of TGF-β1 and CysC with clinical indicators
Serum levels of TGF-β1 and CysC demonstrated complex correlations with multiple physiological markers. TGF-β1 exhibited significant positive associations with CysC (r = 0.640) (Figure 3A). TGF-β1 exhibited significant negative correlations with eGFR (r = −0.611; Figure 3B), age, Hb, and TP, while demonstrating positive correlations with 24-UTP (r = 0.507), UACR (r = 0.386; Figure 3C), PLT, UA, IL-6, SII, and SBP (Table 2). Multivariate linear regression analysis incorporating these covariates revealed that TGF-β1 remained significantly associated with PLT, 24-UTP, and UACR (Table 2). Similarly, CysC demonstrated strong positive correlations with 24-UTP (r = 0.585), UACR (r = 0.658; Figure 3E), IL-6, SII, UREA, UA, and SBP, along with significant inverse correlations with eGFR (r = −0.888; Figure 3D), FPG, Hb, and TP. Multivariate regression analysis adjusting for these variables confirmed that CysC maintained significant associations with eGFR and UACR (Table 3).
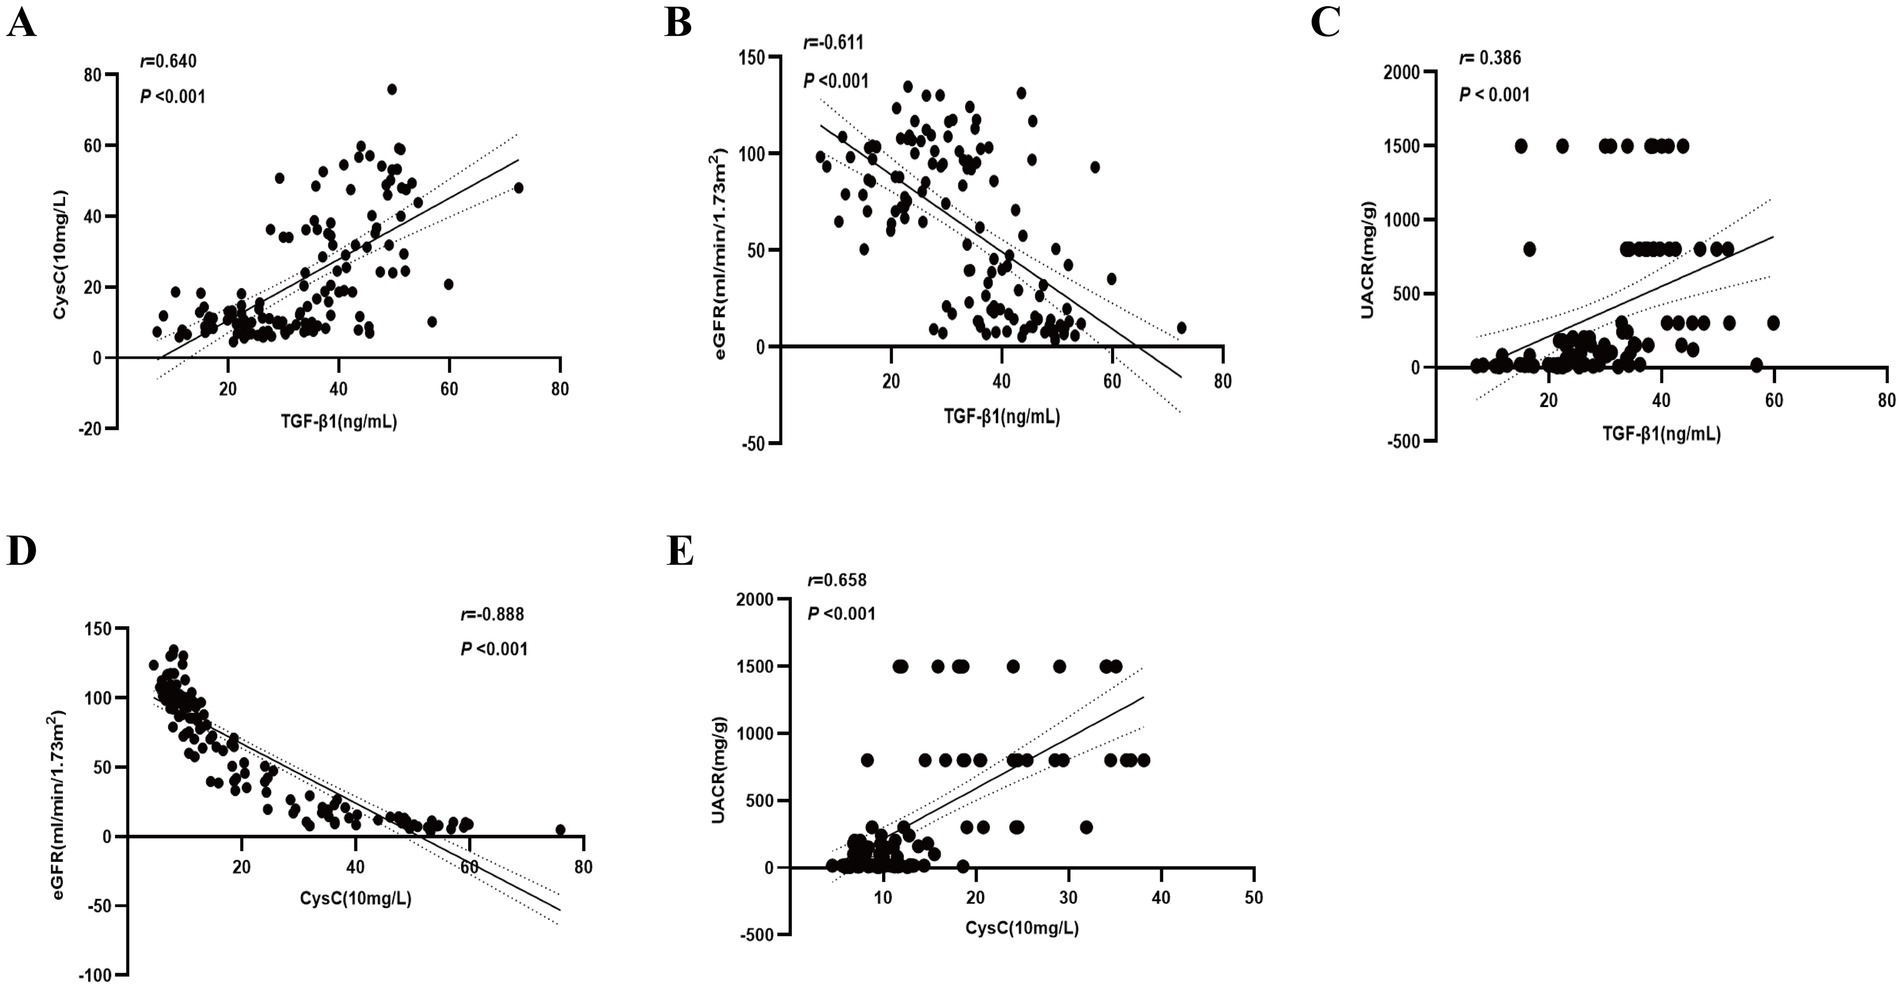
Figure 3. Correlation of TGF-β1 and CysC with clinical indicators. (A) Correlation between TGF-β1 and CysC. (B) Correlation between TGF-β1 and eGFR. (C) Correlation between TGF-β1 and UACR. (D) Correlation between CysC and eGFR. (E) Correlation between CysC and UACR.
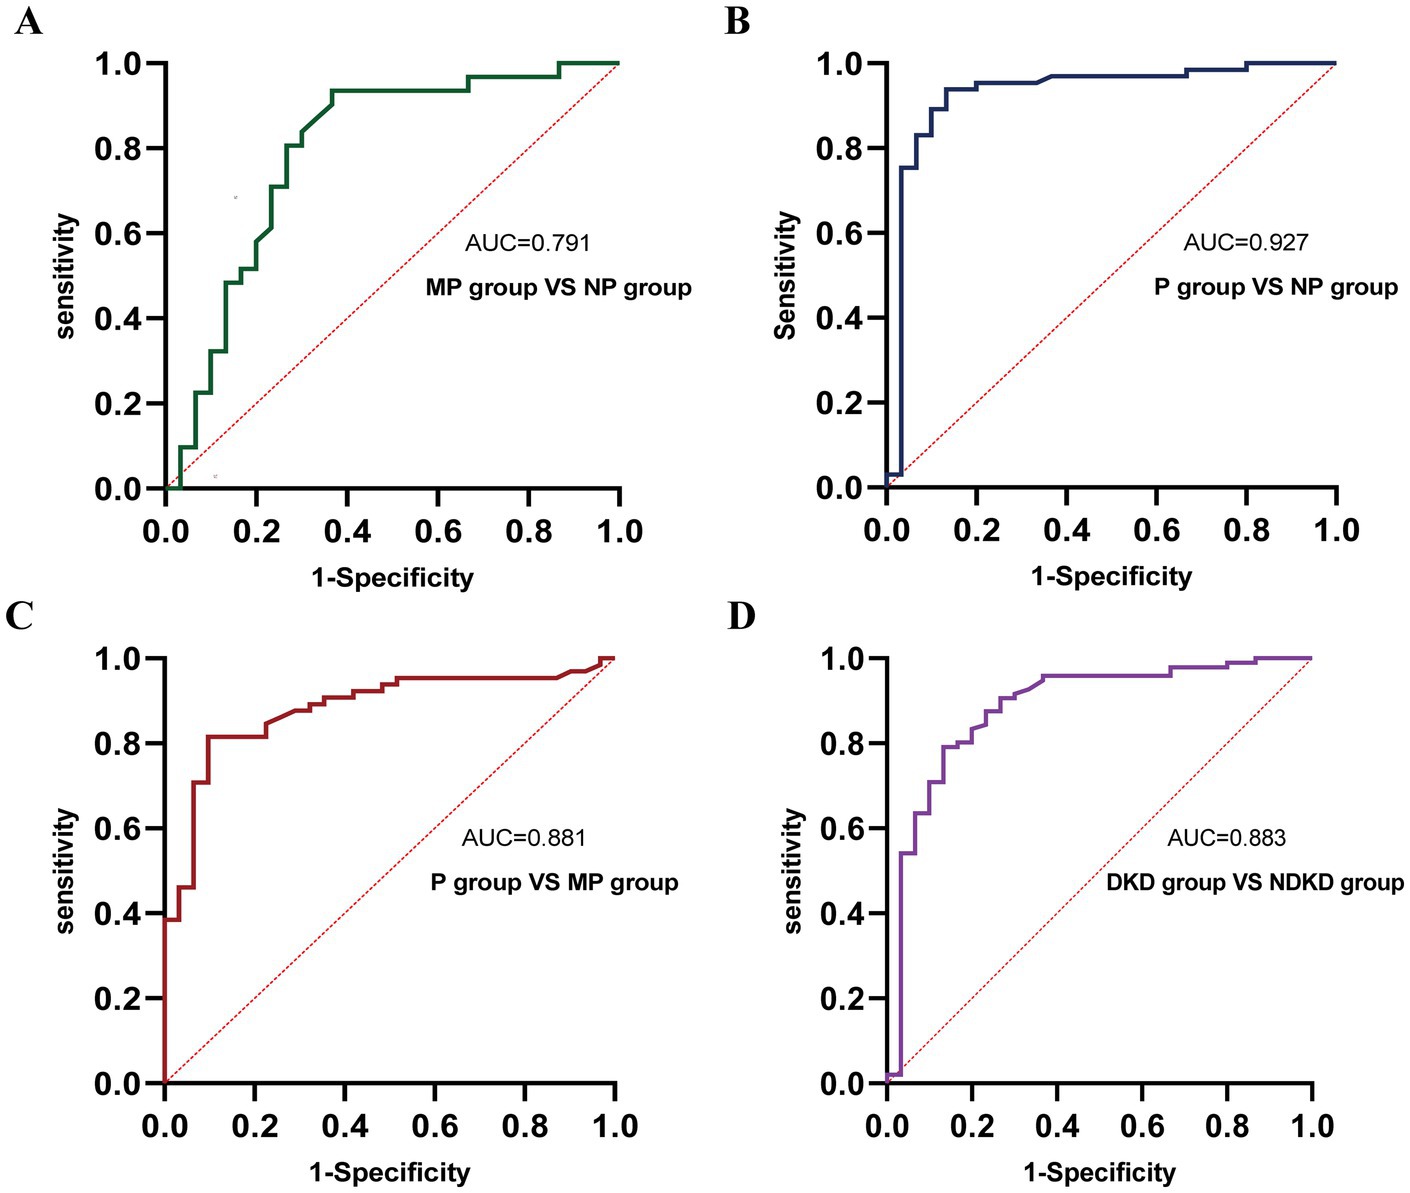
Figure 4. ROC curve analysis of the diagnostic performance of TGF-β1 in different groups. (A) MP group vs. NP group. (B) P group vs. NP group. (C) P group vs. MP group. (D) DKD group vs. NDKD group.
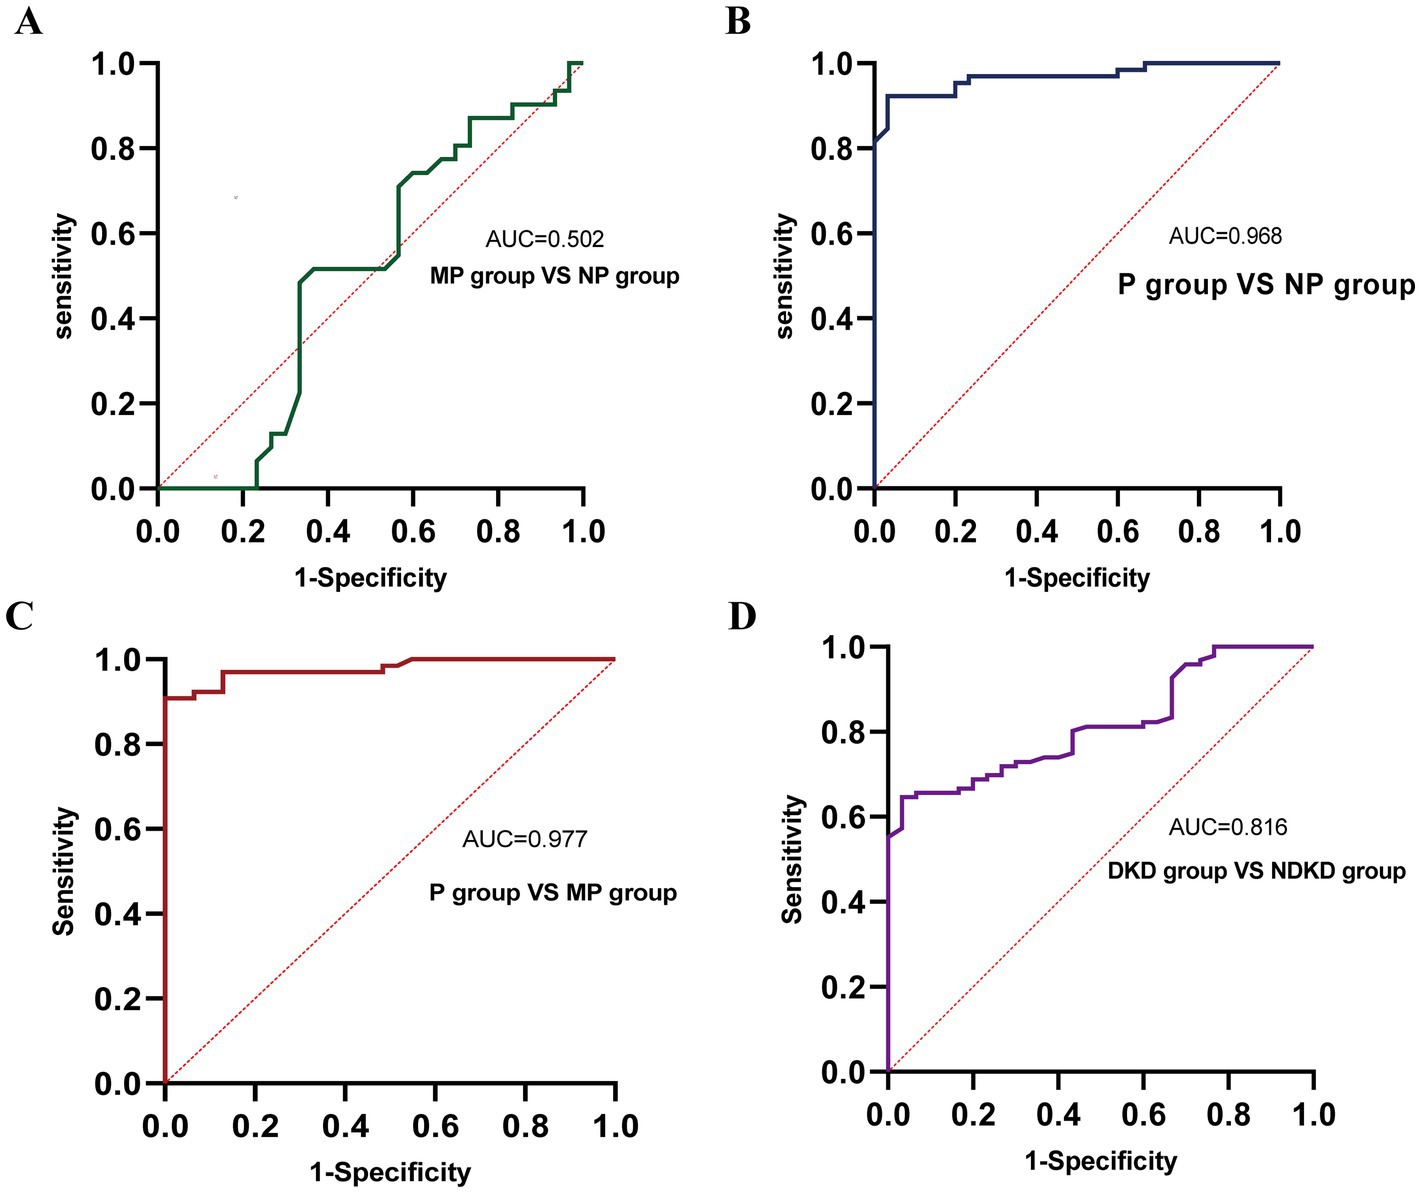
Figure 5. ROC curve analysis of the diagnostic performance of CysC in different groups. (A) MP group vs. NP group. (B) P group vs. NP group. (C) P group vs. MP group. (D) DKD group vs. NDKD group.
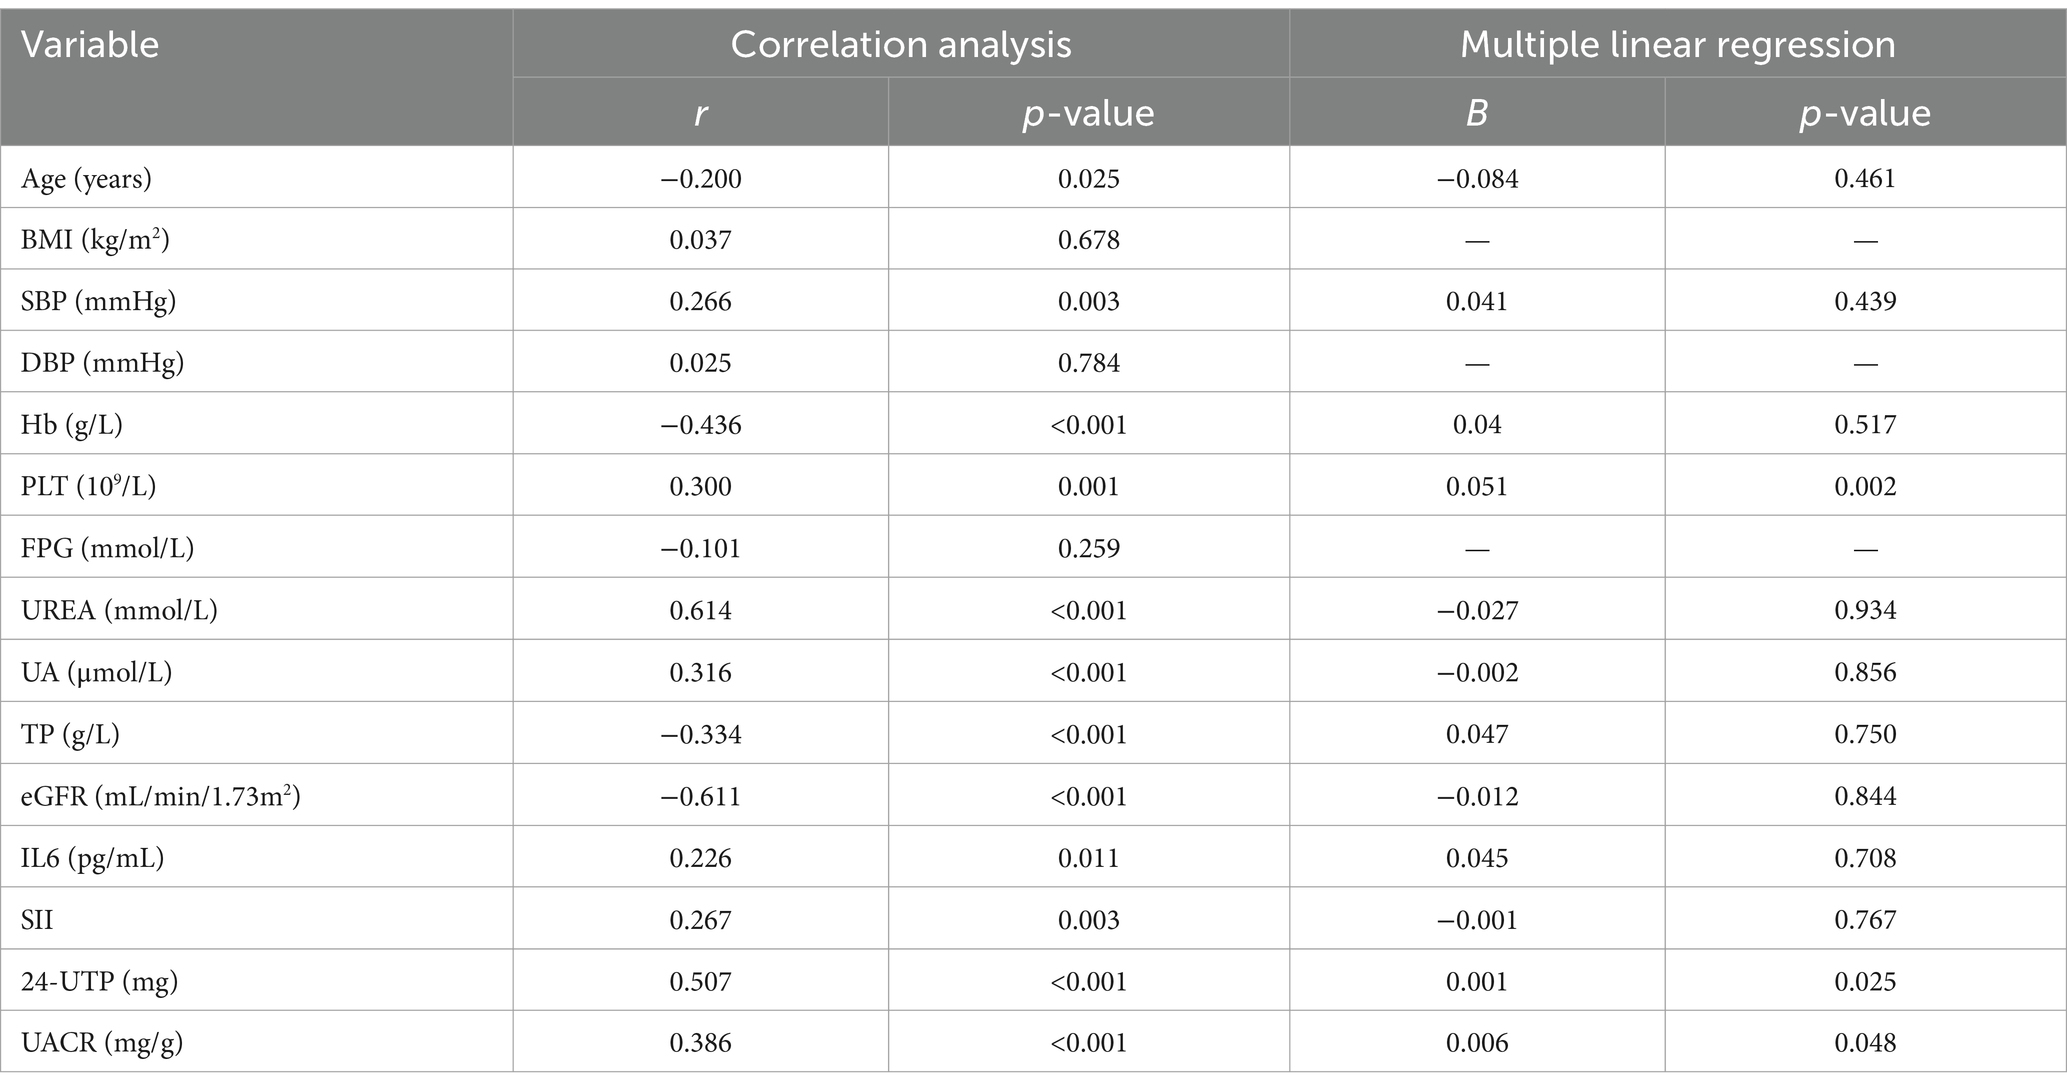
Table 2. Correlation between TGF-β1 and clinical indicators.
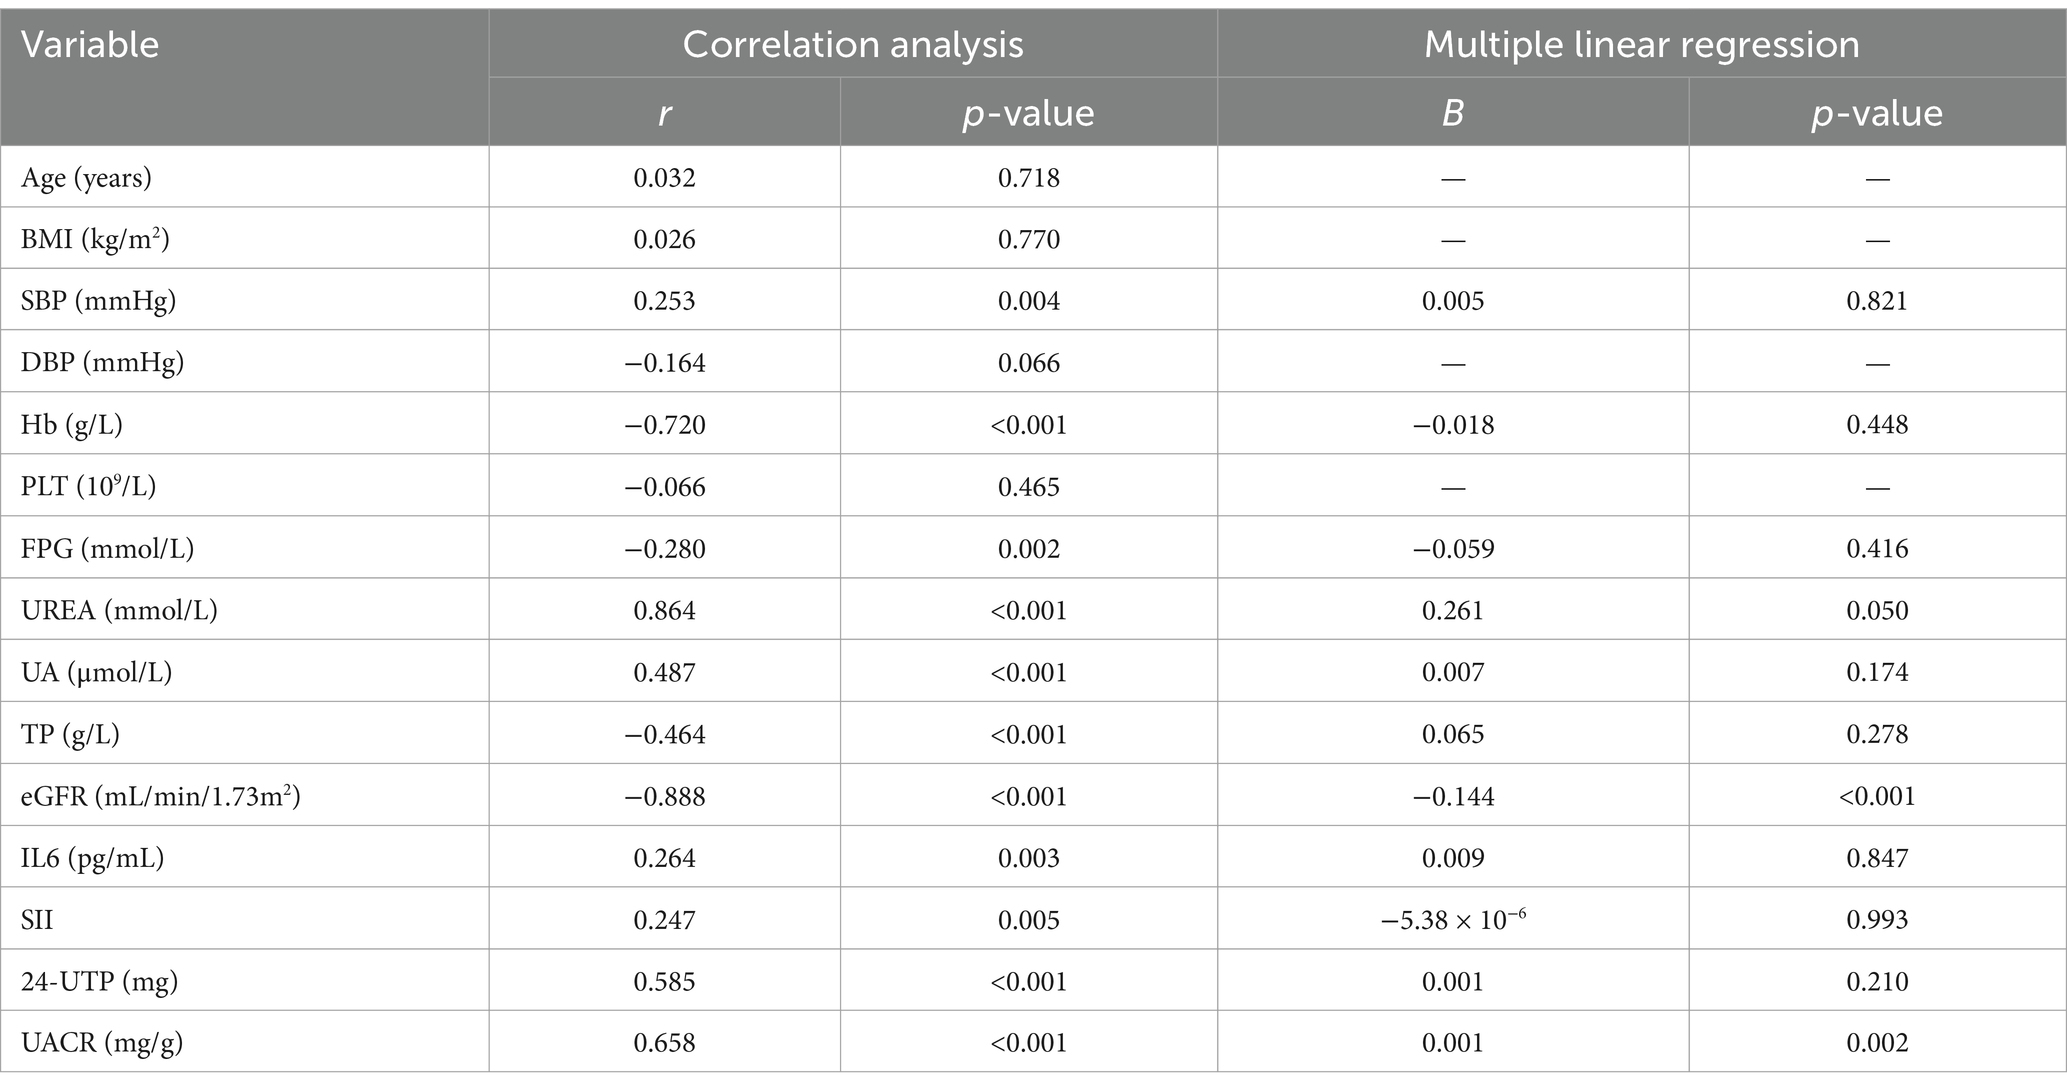
Table 3. Correlation between CysC and clinical indicators.
3.1.3 Logistic regression analysis of TGF-β1 and CysC (grouped by proteinuria)
Univariate logistic regression analysis showed that TGF-β1 may be a factor influencing the occurrence of microproteinuria (p = 0.003); SBP, Hb, FPG, UREA, UA, TP, Scr, eGFR, IL6, TGF-β1, and CysC may be factors influencing the occurrence of proteinuria (p < 0.05) (Supplementary Table S1). After adjusting for factors such as SBP, Hb, FPG, UREA, UA, TP, Scr, eGFR, SII and IL6, it was found that TGF-β1 has been associated with proteinuria levels in T2DM patients. Each unit increase in TGF-β1 was associated with a 1.122-fold and 1.470-fold higher odds of the presence of microalbuminuria and proteinuria, respectively, in the NP group. In contrast, CysC showed no clinical significance after adjustment (see Table 4).

Table 4. Multivariate logistic regression analysis of TGF-β1 and CysC.
3.1.4 Logistic regression analysis of serum TGF-β1 and CysC for DKD
The NP group was defined as the NDKD group, while the MP group and P group were defined as the DKD group. Using the presence of DKD as the dependent variable (NDKD = 0, DKD = 1), univariate logistic regression analysis indicated that Hb, UREA, TP, Scr, eGFR, IL-6, TGF-β1, and CysC were potential factors influencing DKD (p < 0.05) (Supplementary Table S2). Multivariate logistic regression analysis revealed that, after adjusting for SBP, Hb, FPG, UREA, UA, TP, Scr, eGFR, IL-6, and SII, elevated serum TGF-β1 showed a significant association with DKD. Each unit increase in serum TGF-β1 was associated with a 1.151-fold higher likelihood of DKD occurrence in T2DM patients (Table 5).
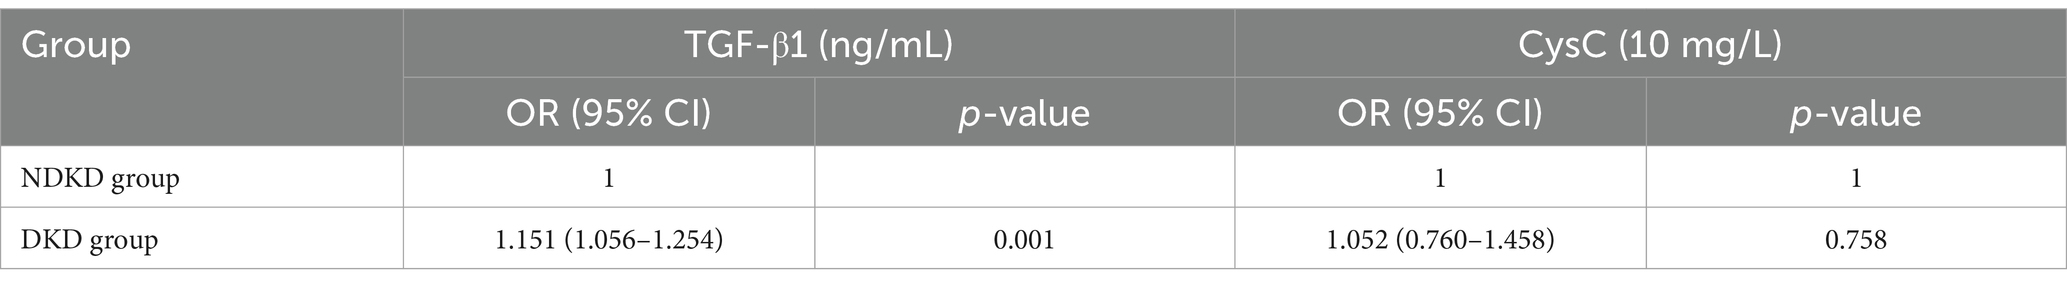
Table 5. Logistic regression analysis of serum TGF-β1 and CysC for DKD.
3.1.5 Diagnostic value of serum TGF-β1 and CysC for DKD
To comprehensively assess the diagnostic potential of TGF-β1 and CysC, we conducted ROC analysis across multiple comparison groups (Figures 4–6 and Table 6). In the MP group versus NP group comparison, TGF-β1 demonstrated an AUC of 0.791, while CysC showed a modest AUC of 0.502, and their combined detection failed to enhance diagnostic accuracy. Notably, in the P group versus NP group, both TGF-β1 (AUC = 0.927) and CysC (AUC = 0.968) exhibited exceptional diagnostic performance, with their combined detection achieving an impressive AUC of 0.984. Similarly, when comparing P group and MP groups, TGF-β1 (AUC = 0.881) and CysC (AUC = 0.977) displayed significant individual diagnostic capabilities, and their combined analysis further elevated the AUC to 0.982. In the DKD versus NDKD group comparison, TGF-β1 yielded an AUC of 0.883, CysC an AUC of 0.816, and their combined analysis resulted in an AUC of 0.912.
Figure 6. ROC curve analysis of the diagnostic performance of TGF-β1 + CysC in different groups. (A) MP group vs. NP group. (B) P group vs. NP group. (C) P group vs. MP group. (D) DKD group vs. NDKD group.
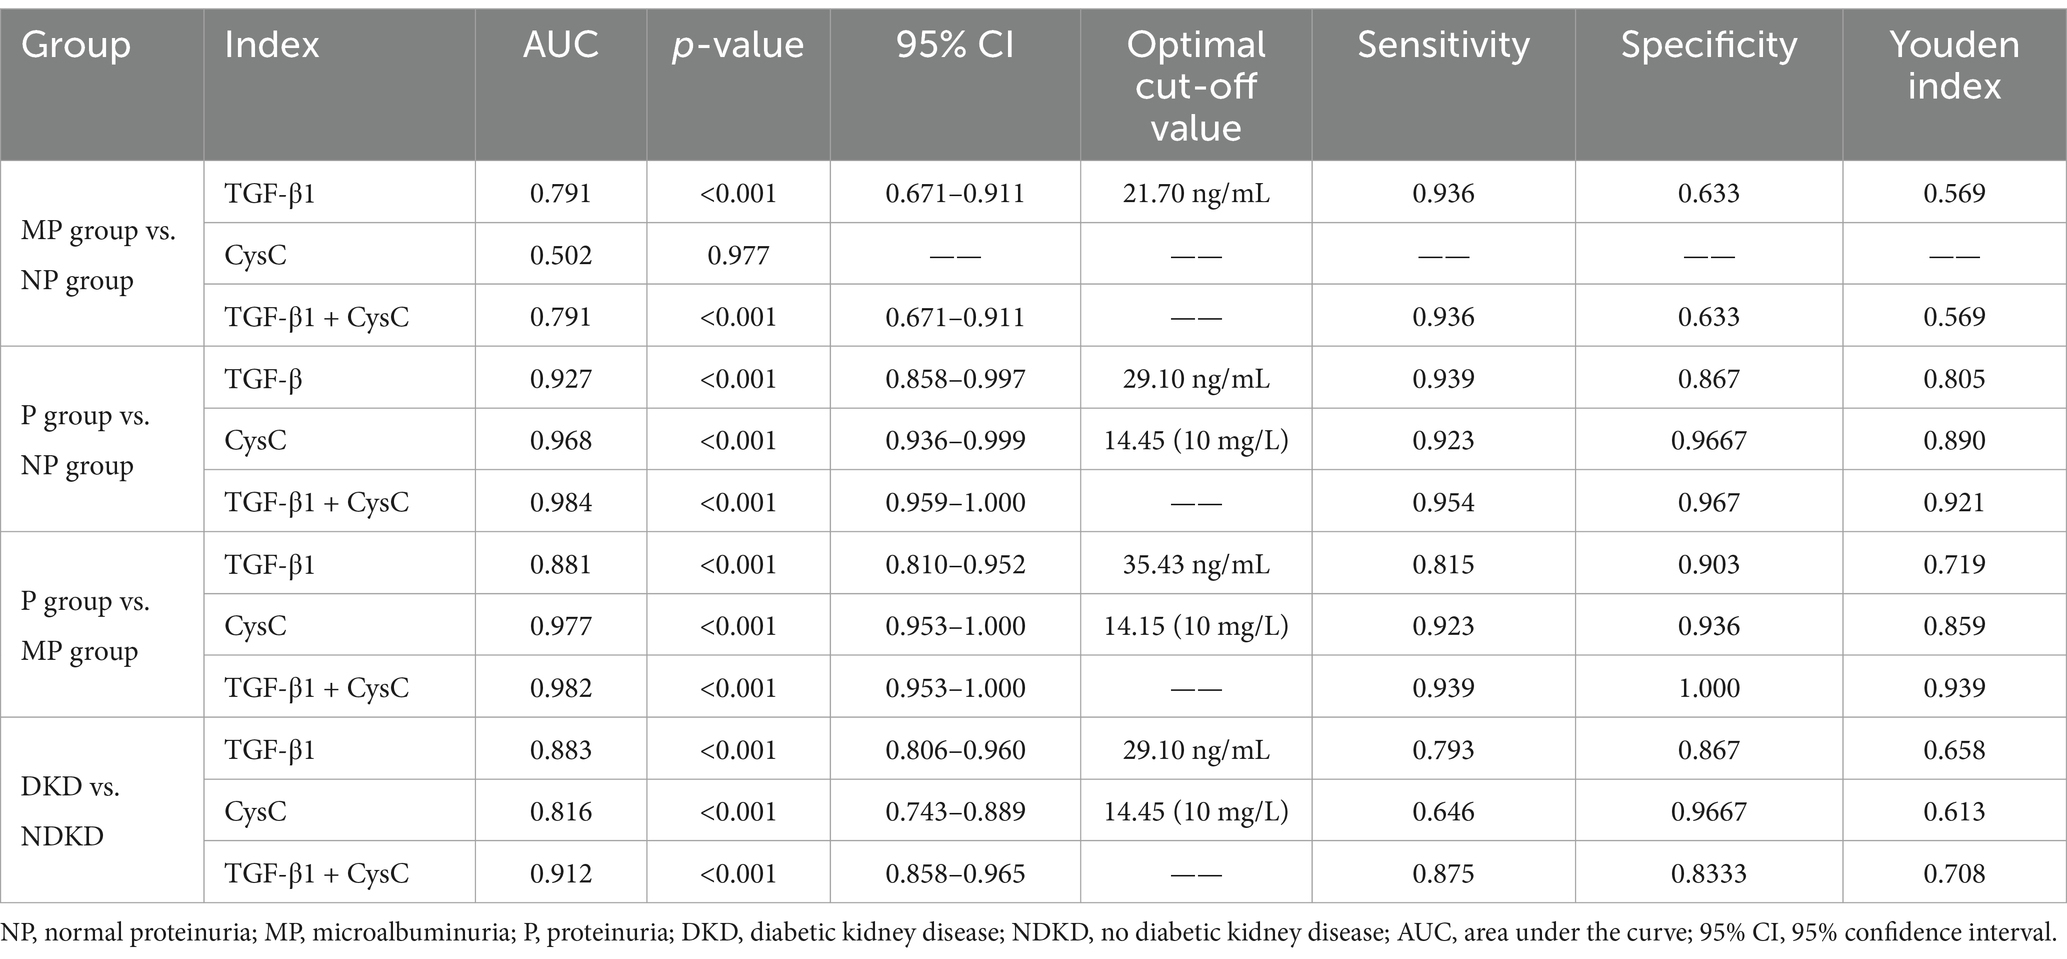
Table 6. Diagnostic performance of TGF-β1 and CysC across different disease groups.
3.2 Analysis based on eGFR groups
3.2.1 Baseline characteristics of patients by eGFR levels
Patients were divided into the NRF group (n = 44) and the DRF group (n = 82) based on eGFR. No significant differences were observed between the two groups in terms of gender and BMI. The DRF group had significantly higher age and SBP compared to the NRF group, while DBP, Hb, and TP were significantly lower in the DRF group (p < 0.05). In terms of metabolic indicators, the DRF group had higher UA levels and lower FPG levels compared to the NRF group (p < 0.05). Regarding renal function and proteinuria, the DRF group exhibited significantly higher Scr, UREA, 24-UTP, and UACR (p < 0.001). In terms of inflammation markers, IL-6 and SII were significantly elevated in the DRF group (p < 0.01) (Table 7). CysC levels were significantly elevated in the DRF group (30.320 ± 16.550 vs. 8.318 ± 1.830 (10 mg/L), p < 0.001) (Figure 7A). TGF-β1 was significantly elevated in the DRF group (37.249 ± 12.569 vs. 27.663 ± 10.138 ng/mL, p < 0.001) (Figure 7B).
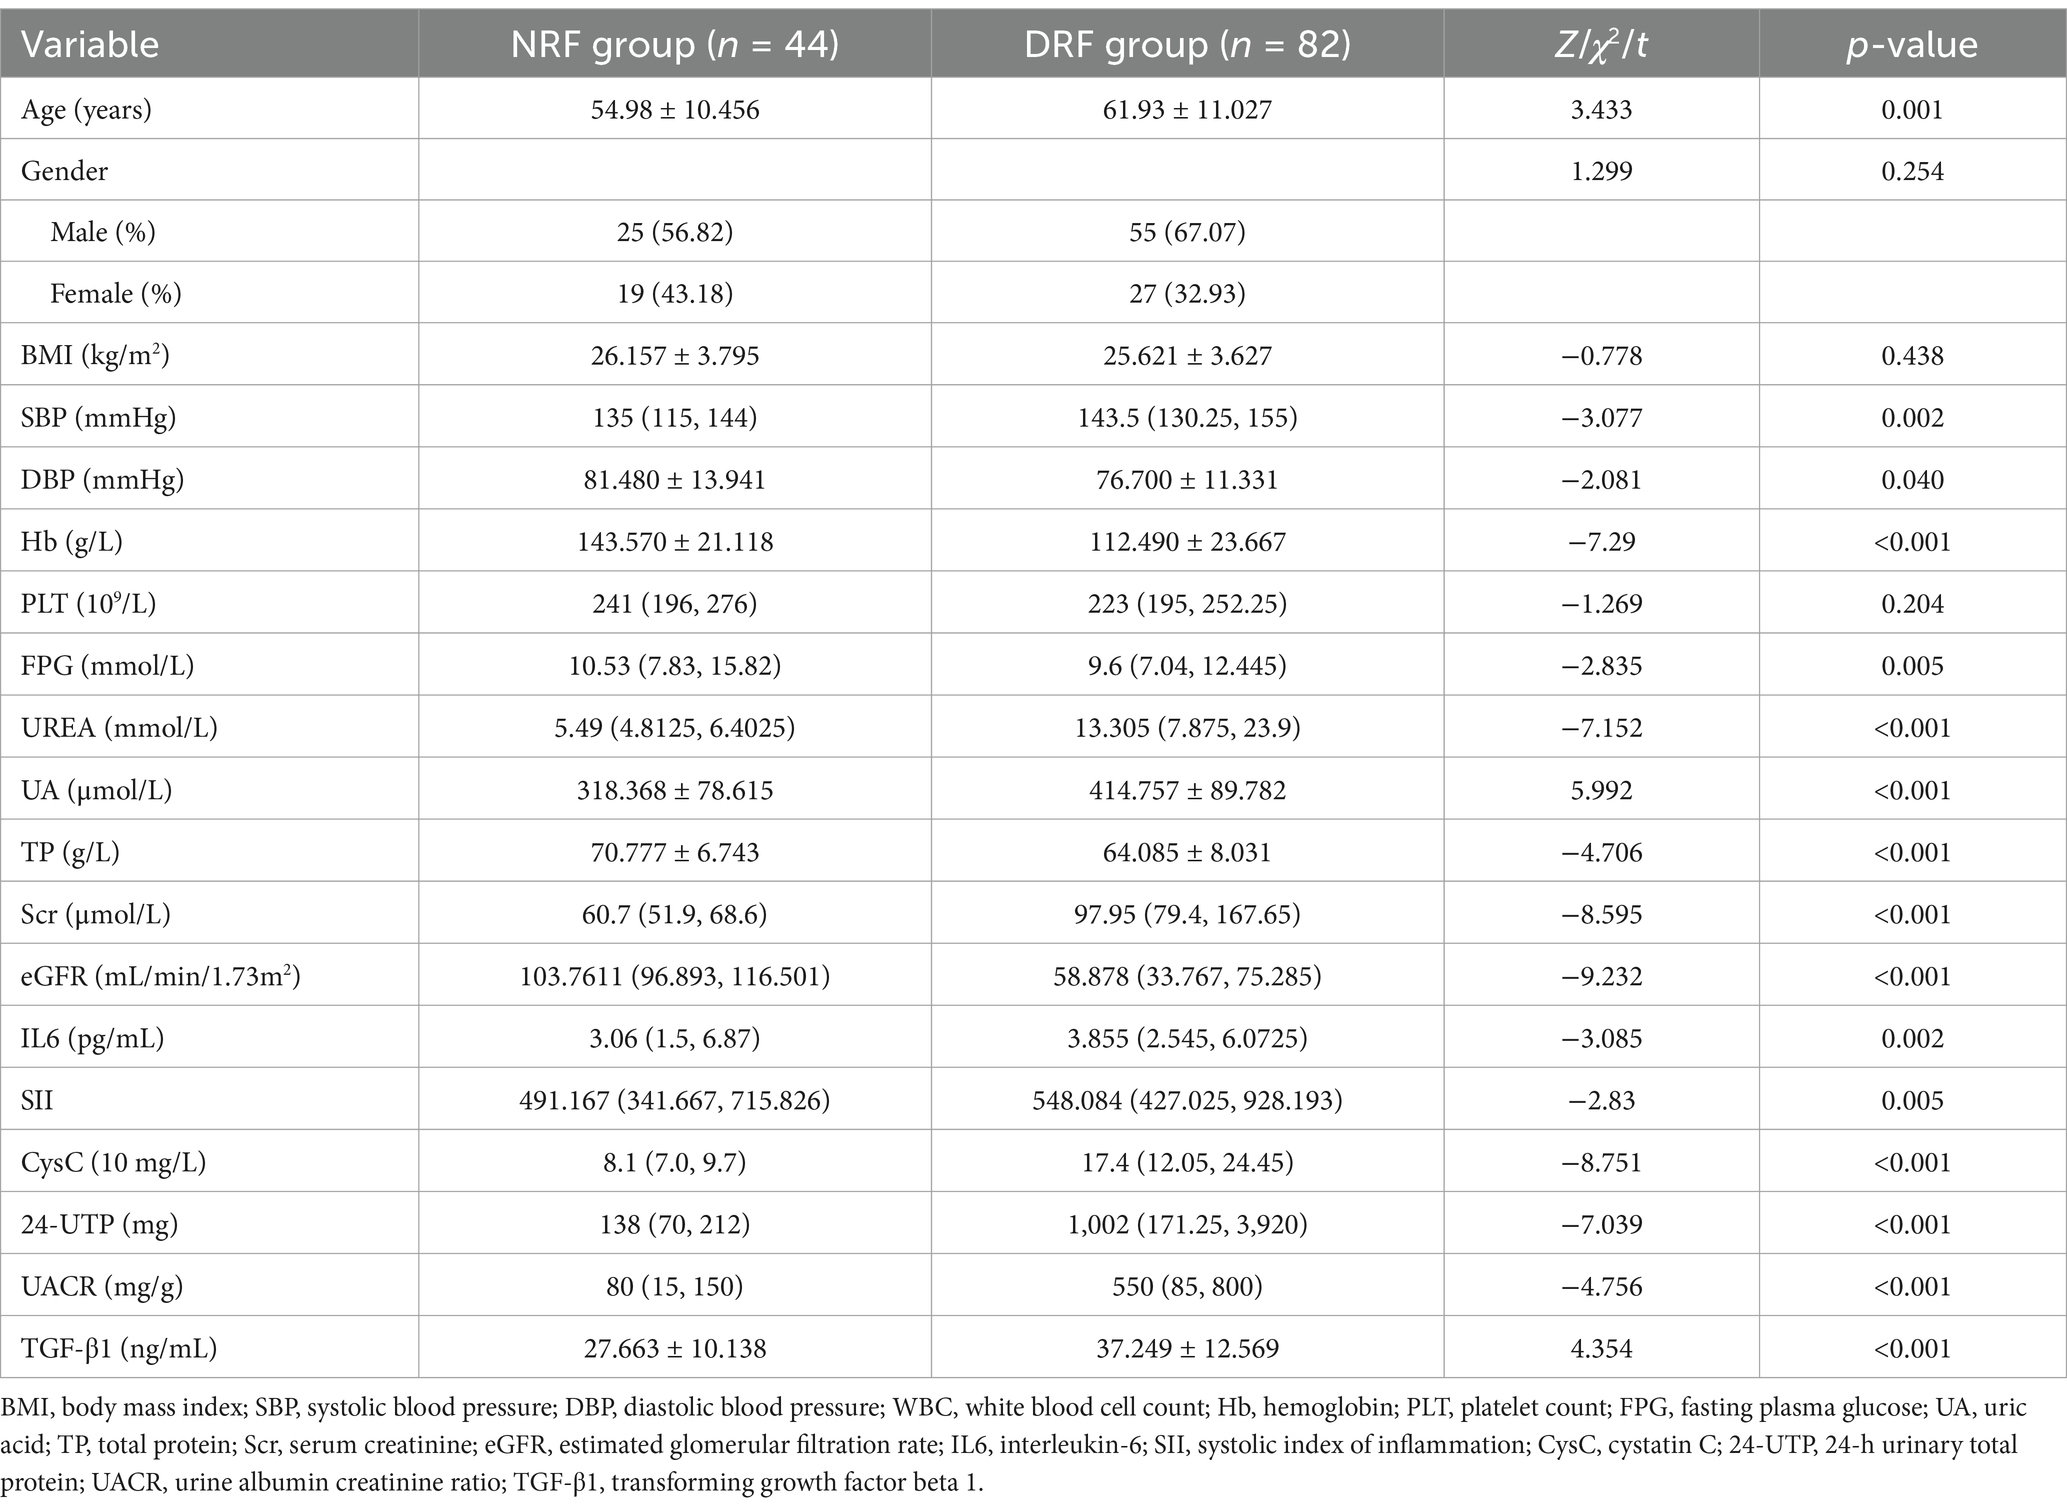
Table 7. Comparison of baseline characteristics of patients grouped by eGFR.
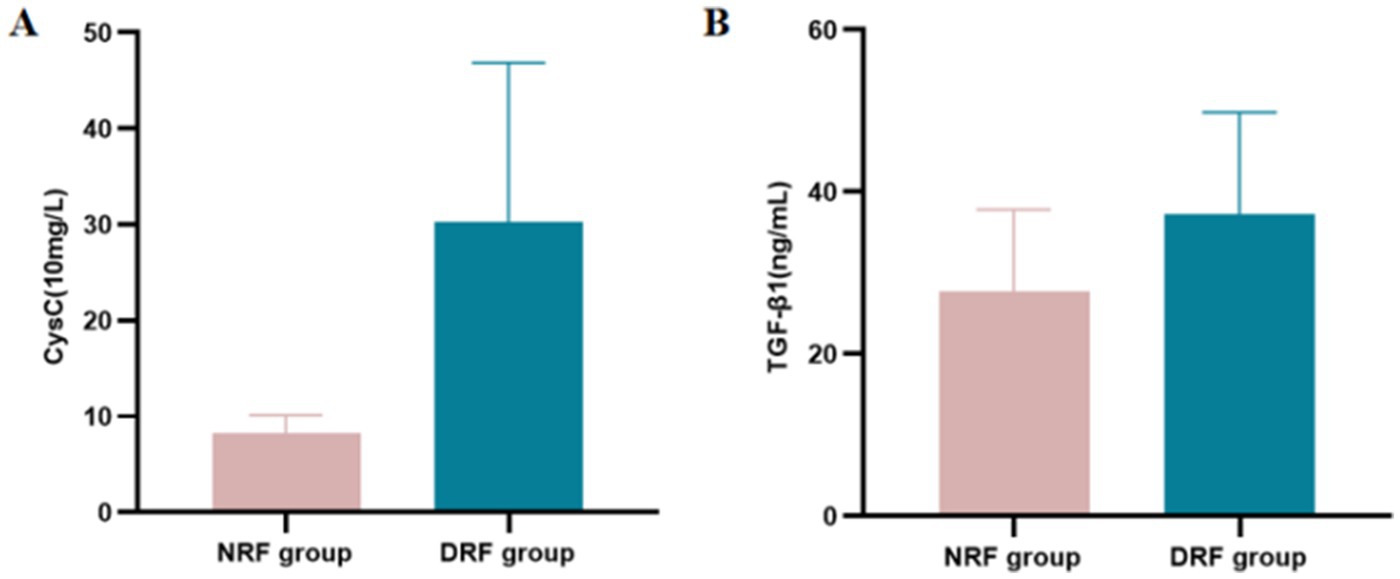
Figure 7. Expression levels of CysC and TGF-β1 in different eGFR groups. (A) CysC. (B) TGF-β1.
3.2.2 Univariate and multivariate logistic regression analysis of TGF-β1 and CysC
The presence or absence of renal function decline was set as the dependent variable (NRF = 0, DRF = 1), with age, SBP, DBP, Hb, FPG, UREA, UA, TP, IL6, SII, 24-UTP, UACR, CysC, and TGF-β1 as independent variables. Univariate logistic regression analysis revealed that age, SBP, DBP, Hb, FPG, UREA, UA, TP, 24-UTP, UACR, CysC, and TGF-β1 may be factors contributing to renal function decline (p < 0.05). In multivariate analysis, after adjustment, only CysC showed a significant independent association (OR = 2.255, 95% CI: 1.240–4.103, p = 0.008), indicating that for every 10-unit increase in CysC, the likelihood of renal function decline in NRF patients increases by 2.255 times (see Table 8).
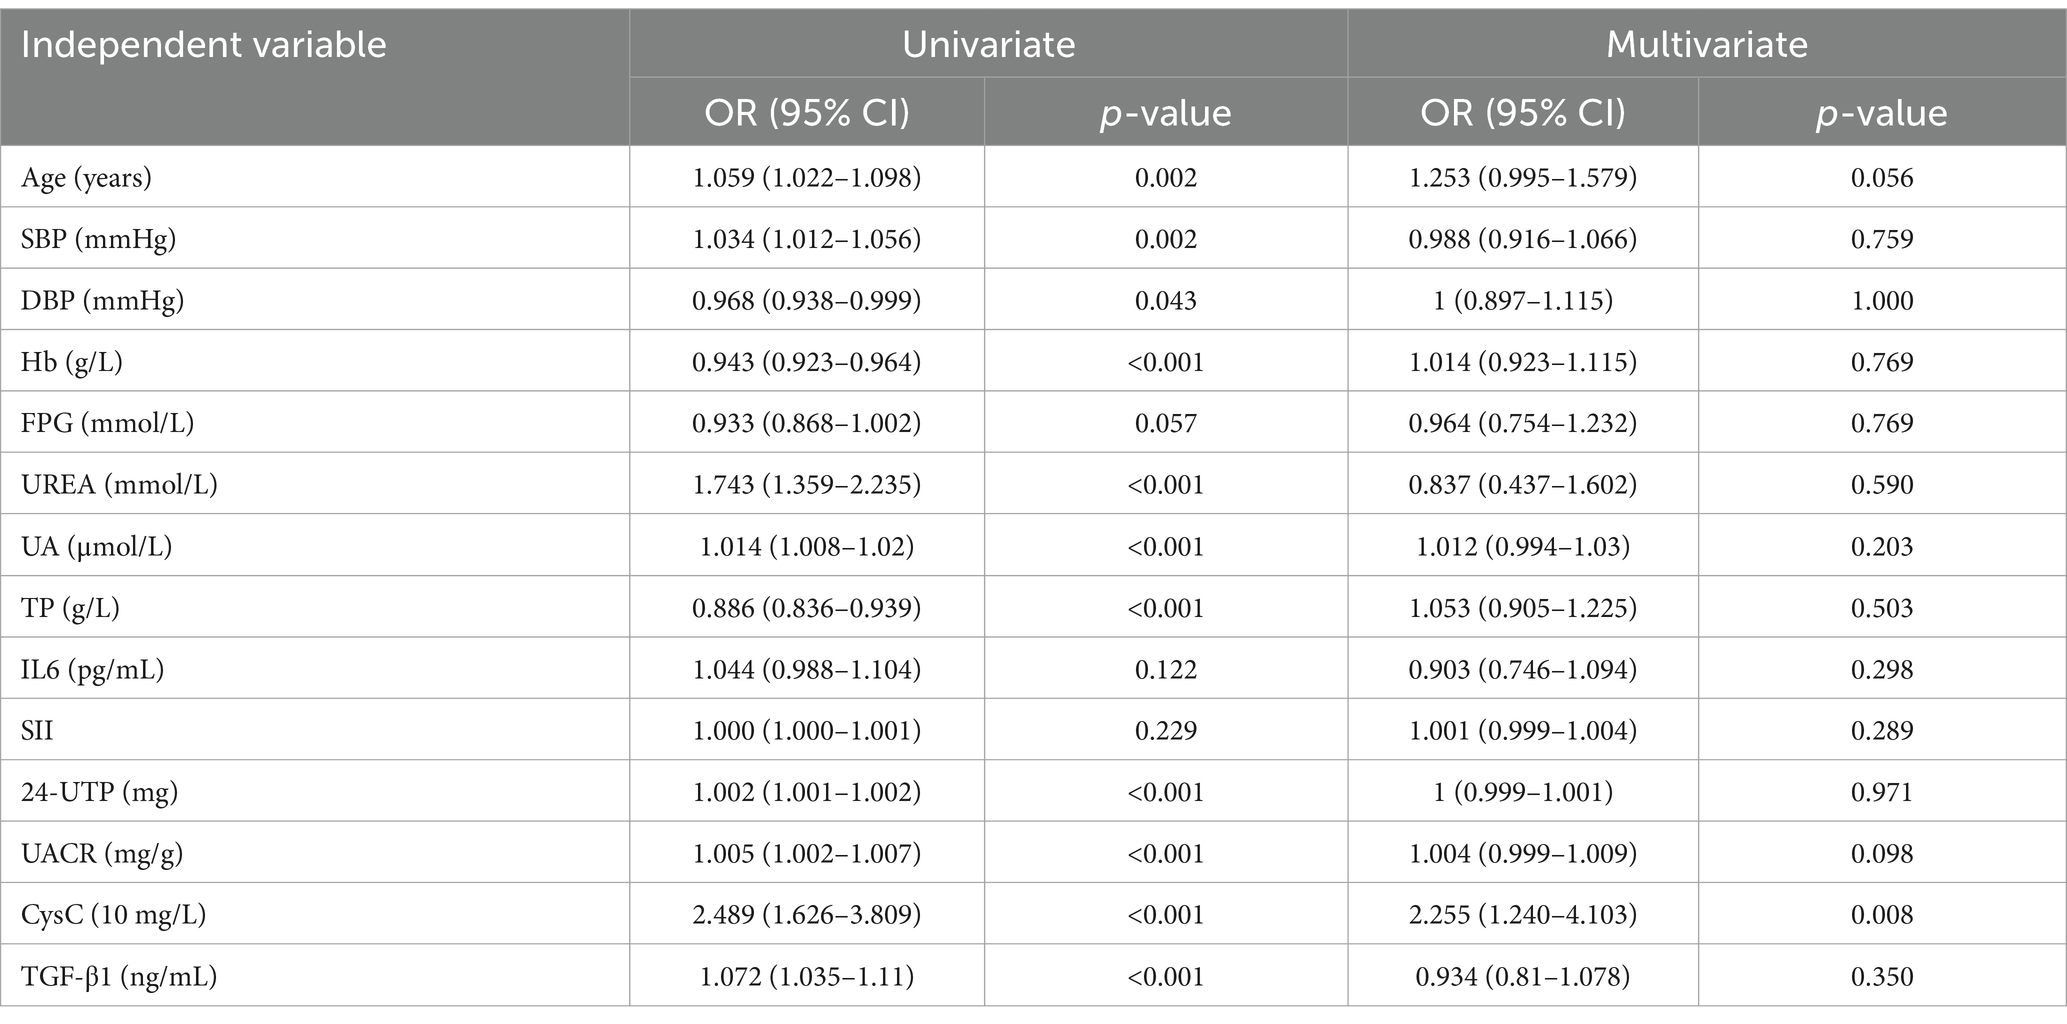
Table 8. Univariate and multivariate logistic regression analysis of TGF-β1 and CysC.
3.2.3 Diagnostic value of serum TGF-β1 and CysC in predicting renal function decline in T2DM patients
The AUC for using TGF-β1 alone to predict renal function decline was 0.726, suggesting it has some diagnostic value. The AUC for CysC alone was 0.974, demonstrating significantly superior diagnostic performance, with an optimal cutoff value of 11.55 (10 mg/L), corresponding to a sensitivity of 0.89 and specificity of 0.955. The combined detection of TGF-β1 and CysC yielded an AUC similar to that of CysC alone, indicating that combined testing did not further enhance diagnostic performance. In summary, CysC alone demonstrated significantly superior diagnostic efficacy in predicting renal function decline compared to TGF-β1, and combined testing had a similar effect to CysC alone. This suggests that CysC can serve as an important marker for predicting renal function decline (see Figure 8 and Table 9).

Figure 8. ROC curve for predicting renal function decline. (A) TGF-β1. (B) CysC. (C) TGF-β1 + CysC.
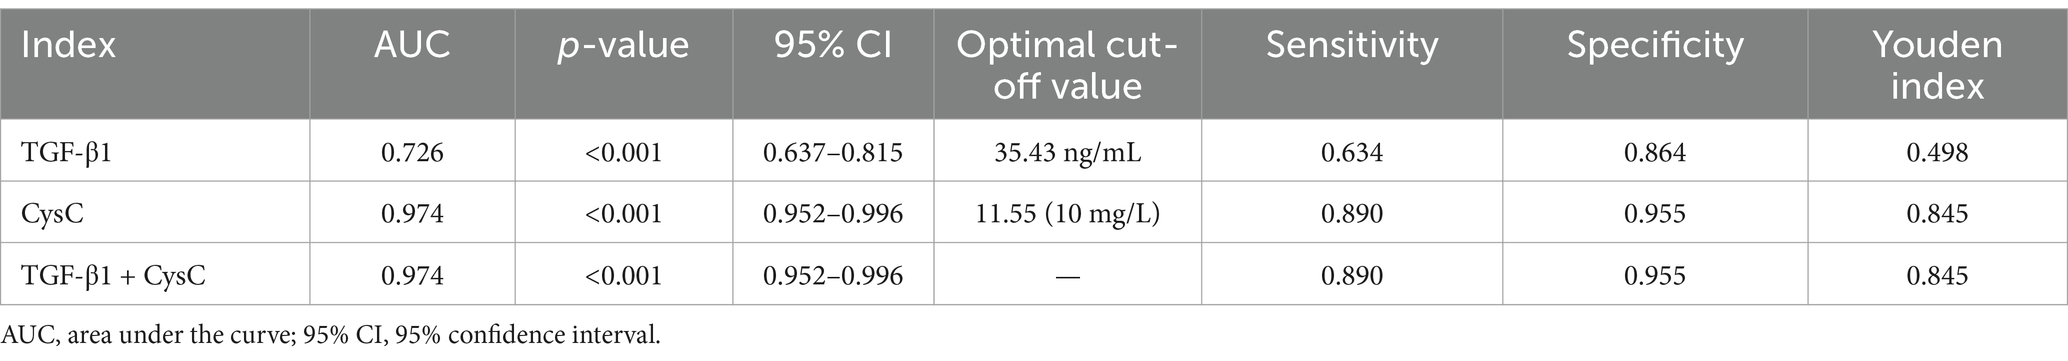
Table 9. Diagnostic performance of TGF-β1 and CysC in predicting renal function decline.
4 Discussion
DKD is characterized by thickening of the glomerular basement membrane, mesangial matrix proliferation, interstitial fibrosis, and chronic inflammatory responses, leading to gradual renal dysfunction. TGF-β1 plays a key regulatory role in these processes (13, 25–27). CysC is a cysteine protease inhibitor expressed and secreted by all nucleated cells, which is ultimately cleared by the kidneys. Serum CysC is a sensitive marker of both acute and chronic renal function changes (28, 29). Cysteine protease is a key substance involved in the recycling and remodeling of basement membrane and extracellular matrix components (30). Studies have shown that dysregulation of CysC and cysteine proteases plays an important pathological role in fibrosis, and CysC may serve as an effective biomarker for organ fibrosis (18). TGF-β1 promotes the production and secretion of CysC (31, 32) (Figure 9). Therefore, this study explored the diagnostic value of TGF-β1 and CysC in patients with DKD and their correlation with clinical indicators. The research findings indicate that these two biomarkers have significant value in the early diagnosis and disease assessment of DKD.
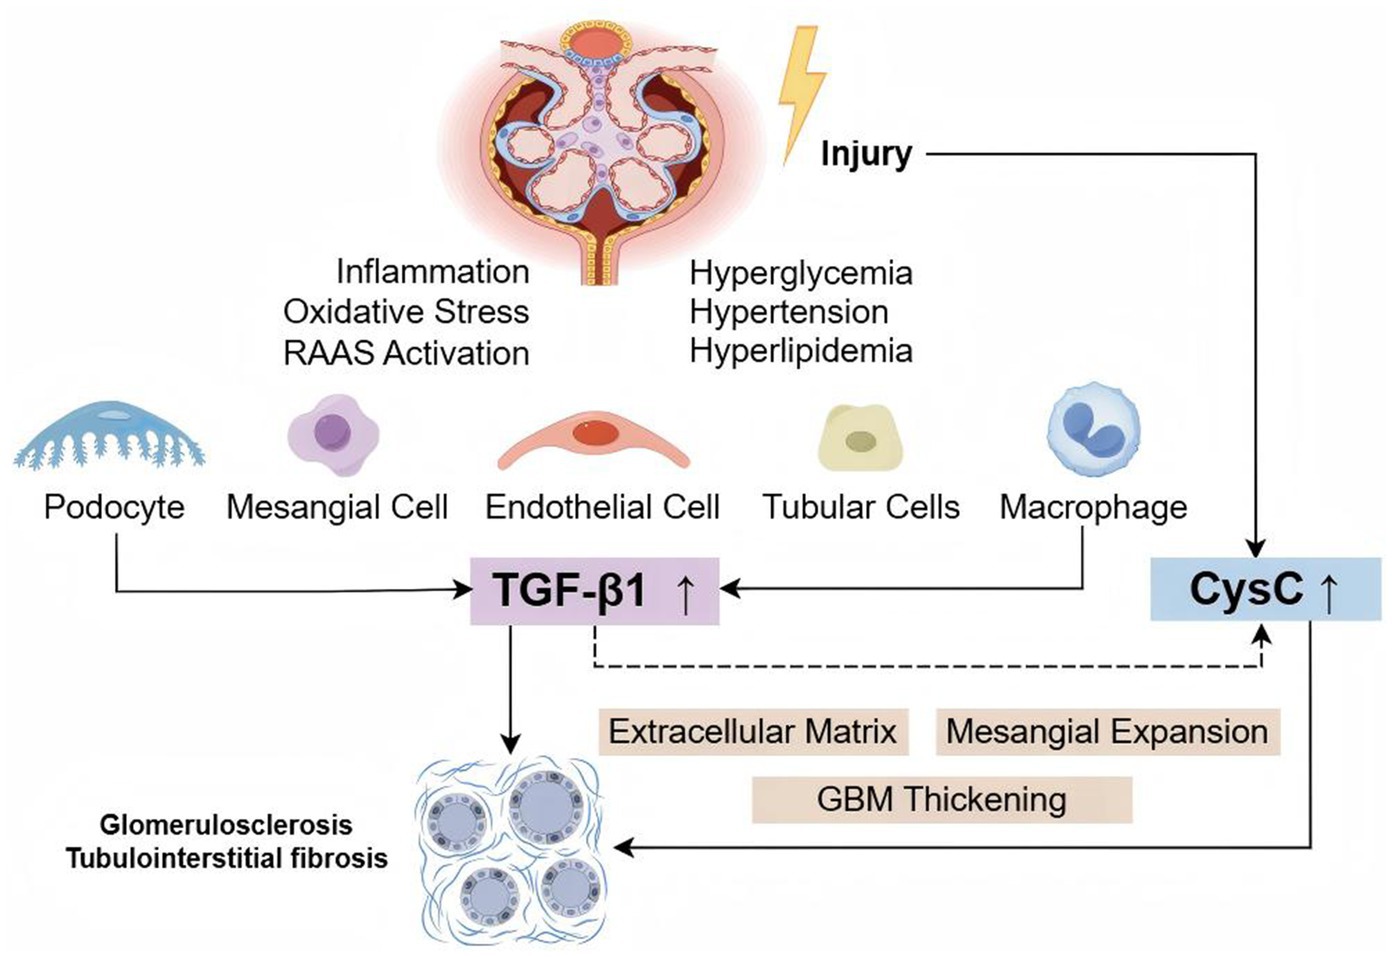
Figure 9. TGF-β1 and CysC in the pathogenesis of DKD. Hyperglycemia, hypertension, hyperlipidemia, inflammation, oxidative stress, and other factors can damage renal cells (podocytes, mesangial cells, endothelial cells, tubular cells, and macrophages), upregulating the expression of TGF-β1 and CysC. TGF-β1 promotes CysC production, and together, they contribute to extracellular matrix accumulation, mesangial expansion, and thickening of the glomerular basement membrane, ultimately leading to glomerulosclerosis and tubulointerstitial fibrosis.
4.1 Diagnostic value of TGF-β1
Serum TGF-β1 has been associated with proteinuria levels in T2DM patients. TGF-β1 levels show a significant positive correlation with proteinuria severity, consistent with previous studies (33, 34). Multivariate logistic regression analysis reveals that each unit increase in TGF-β1 was associated with a 1.122-fold and 1.470-fold higher odds of the presence of microalbuminuria and proteinuria, respectively, in the NP group. TGF-β1 demonstrates good diagnostic performance for DKD and different degrees of proteinuria. Impaired resolution of inflammation is a major driver of DKD progression (35). We found that TGF-β1 is significantly positively correlated with inflammatory markers of DKD, such as IL-6 and SII (36). In studies using the LLC-PK1 cell model of DKD, the protective effect of the antidiabetic drug liraglutide may be associated with the inhibition of TGF-β1, and further in vitro and in vivo studies are needed to clarify its specific mechanism of action (37). Collectively, these findings suggest that TGF-β1 may serve as a biomarker for DKD, providing predictive insights into the progression of kidney disease. Similarly, previous studies have confirmed that serum TGF-β1 levels are also correlated with renal function in other types of CKD (such as IgA nephropathy, hypertensive nephropathy) (38–41). Its diagnostic efficacy in different kidney diseases warrants further investigation.
4.2 Diagnostic value of CysC
This study demonstrated a significant association between serum CysC levels and renal function decline in T2DM patients. Each 10-unit elevation in CysC concentration was associated with a 2.255-fold increased likelihood of renal deterioration. ROC curve analysis demonstrated an AUC of 0.974 for CysC in diagnosing renal function decline in T2DM patients, with a sensitivity of 91.5%, consistent with findings from Ren et al. (17). Additionally, CysC showed a significant positive correlation with proteinuria. However, ROC curve analysis revealed an AUC of only 0.502 for CysC in distinguishing MP from NP groups, indicating limited efficacy in diagnosing microalbuminuria. This is consistent with the study by Visinescu et al. (42): there was no significant difference in serum CysC levels between the normal albuminuria group and the microalbuminuria group. This phenomenon may be attributed to the relatively short and similar duration of diabetes (10–12 years) in the two groups of subjects in this study. It is known that a longer duration of diabetes is a factor contributing to increased CysC levels, which may lead to kidney damage. Moreover, a review of previous literature suggests that fluctuations in CysC levels may not solely reflect renal function (43). And in clinical practice, it is often used in conjunction with serum creatinine to assess GFR (44). However, its limitations should be carefully considered: corticosteroid treatment and abnormal thyroid hormone levels (particularly subclinical thyroid dysfunction) can cause significant fluctuations in CysC concentrations (28, 45). It is noteworthy that there is a significant comorbid relationship and bidirectional pathophysiological association between thyroid dysfunction and chronic kidney disease (46). In terms of detection technology, there is currently no standardized reference system for CysC testing internationally, and the bias in testing systems poses challenges to the clinical interpretation of single CysC measurements. Continuous dynamic monitoring is necessary to improve the reliability of results (44, 47–50). In contrast, CysC demonstrated good diagnostic performance for identifying proteinuria. This finding aligns with the results of Li et al. (51), suggesting that CysC may not be an effective biomarker for early DKD detection. However, numerous studies have shown that serum CysC is more sensitive than albuminuria in early DKD, and equations using CysC for eGFR calculation outperform those using creatinine (42, 52, 53). For diagnosing NDKD and DKD, CysC yielded an AUC of 0.816. While lower than that of TGF-β1, it still exhibited good diagnostic efficacy. This suggests that combined diagnostic approaches may enhance the accuracy of disease evaluation.
4.3 Clinical application of TGF-β1 and CysC
In the clinical management of DKD, the establishment of early evaluation is of significant importance for delaying disease progression. In the assessment of DKD, both CysC and TGF-β1 have their respective advantages in application. TGF-β1 is associated with microalbuminuria and inflammatory markers, showing promise in the early detection of DKD. CysC is more significantly elevated when renal function declines, further reinforcing the current KDIGO guidelines recommending the use of CysC for eGFR in diabetes (54). The diagnostic efficacy of combined assessment of CysC and TGF-β1 is superior to or at least equal to that of individual assessments, with the combined testing strategy demonstrating outstanding ability in distinguishing patients with severe proteinuria. Future efforts should focus on further optimizing the combined diagnostic model, incorporating dynamic monitoring and stratified management, to enhance its clinical feasibility and accuracy. Moreover, its utility in longitudinal studies should be evaluated, providing a more comprehensive diagnosis and treatment plan for DKD patients.
5 Limitations
This study has several limitations: (1) The sample size is relatively limited, and a more detailed stratified analysis could not be performed. (2) The study did not include non-diabetic CKD patients as a control group, which somewhat limits the applicability of the findings. (3) The cross-sectional design limits the ability to infer causality and may introduce confounding factors that could affect the results. (4) Although key clinical variables were adjusted, the potential impact of other factors, such as the treatment with renin-angiotensin-aldosterone system (RAAS) inhibitors and sodium-glucose cotransporter 2 (SGLT2) inhibitors, on biomarker levels could not be fully excluded. Future studies should expand the sample size, conduct multicenter research, and design studies with multiple control groups (including healthy control group, non-diabetic CKD group, and diabetic nephropathy group) to validate the disease specificity of the biomarkers and enhance the generalizability of the findings. Longitudinal study designs should be adopted, with multiple follow-ups and data collection at different time points, enabling the analysis of the trend of variable changes over time.
6 Conclusion
This study confirms the diagnostic value of CysC and TGF-β1 in DKD. The combined detection of both biomarkers provides new methods for early diagnosis, disease monitoring, and prognosis evaluation of DKD. However, these findings still require further research to validate and refine.
Data availability statement
The raw data supporting the conclusions of this article will be made available by the authors, without undue reservation.
Ethics statement
The studies involving humans were approved by Ethics Committee of Dongzhimen Hospital, Beijing University of Chinese Medicine. The studies were conducted in accordance with the local legislation and institutional requirements. The participants provided their written informed consent to participate in this study.
Author contributions
YK: Conceptualization, Data curation, Formal analysis, Investigation, Methodology, Project administration, Software, Supervision, Validation, Writing – original draft, Writing – review & editing. QJ: Conceptualization, Data curation, Formal analysis, Investigation, Methodology, Project administration, Software, Supervision, Writing – original draft, Writing – review & editing. MZ: Conceptualization, Data curation, Investigation, Software, Writing – review & editing. HZ: Conceptualization, Data curation, Investigation, Methodology, Software, Writing – review & editing. XL: Conceptualization, Data curation, Investigation, Methodology, Software, Writing – review & editing. AL: Conceptualization, Investigation, Methodology, Validation, Writing – review & editing. JZ: Conceptualization, Investigation, Project administration, Software, Writing – review & editing. JL: Conceptualization, Formal analysis, Funding acquisition, Project administration, Resources, Writing – original draft, Writing – review & editing. YW: Conceptualization, Data curation, Funding acquisition, Investigation, Methodology, Resources, Software, Supervision, Visualization, Writing – review & editing.
Funding
The author(s) declare that financial support was received for the research and/or publication of this article. This research was funded by the National Natural Science Foundation of China (Grant Nos. 82174342 and 82074361), the National Administration of Traditional Chinese Medicine Inheritance and Innovation “Hundreds and Thousands of Talents” Project [No. (2018)12 issued by the National Administration of Traditional Chinese Medicine]; Central Universities’ Fundamental Research Funds (2023-JYB-JBQN-020) and Joint Project of the China Association of Chinese Medicine (2023DYPLHGG-11).
Conflict of interest
The authors declare that the research was conducted in the absence of any commercial or financial relationships that could be construed as a potential conflict of interest.
Generative AI statement
The authors declare that no Gen AI was used in the creation of this manuscript.
Publisher’s note
All claims expressed in this article are solely those of the authors and do not necessarily represent those of their affiliated organizations, or those of the publisher, the editors and the reviewers. Any product that may be evaluated in this article, or claim that may be made by its manufacturer, is not guaranteed or endorsed by the publisher.
Supplementary material
The Supplementary material for this article can be found online at: https://www.frontiersin.org/articles/10.3389/fmed.2025.1529648/full#supplementary-material
References
1. International Diabetes Federation. IDF diabetes atlas. 10th ed. Brussels: International Diabetes Federation (2021).
2. Kidney Disease: Improving Global Outcomes (KDIGO) Diabetes Work Group. KDIGO 2022 clinical practice guideline for diabetes management in chronic kidney disease. Kidney Int. (2022) 102:S1–S127. doi: 10.1016/j.kint.2022.06.008
3. Rico-Fontalvo, J, Aroca, G, Cabrales, J, Daza-Arnedo, R, Yánez-Rodríguez, T, Martínez-Ávila, MC, et al. Molecular mechanisms of diabetic kidney disease. Int J Mol Sci. (2022) 23:8668. doi: 10.3390/ijms23158668
4. Looker, HC, Mauer, M, and Nelson, RG. Role of kidney biopsies for biomarker discovery in diabetic kidney disease. Adv Chronic Kidney Dis. (2018) 25:192–201. doi: 10.1053/j.ackd.2017.11.004
5. Ceccarelli Ceccarelli, D, Paleari, R, Solerte, B, and Mosca, A. Re-thinking diabetic nephropathy: microalbuminuria is just a piece of the diagnostic puzzle. Clin Chim Acta. (2022) 524:146–53. doi: 10.1016/j.cca.2021.11.009
6. Pugliese, G, Penno, G, Natali, A, Barutta, F, Di Paolo, S, Reboldi, G, et al. Diabetic kidney disease: new clinical and therapeutic issues. Joint position statement of the Italian Diabetes Society and the Italian Society of Nephrology on “The natural history of diabetic kidney disease and treatment of hyperglycemia in patients with type 2 diabetes and impaired renal function”. J Nephrol. (2020) 33:9–35. doi: 10.1007/s40620-019-00650-x
7. Vučić Lovrenčić, M, Božičević, S, and Smirčić, DL. Diagnostic challenges of diabetic kidney disease. Biochem Med. (2023) 33:030501, 227–241. doi: 10.11613/bm.2023.030501
8. Gifford, CC, Tang, J, Costello, A, Khakoo, NS, Nguyen, TQ, Goldschmeding, R, et al. Negative regulators of TGF-β1 signaling in renal fibrosis; pathological mechanisms and novel therapeutic opportunities. Clin Sci. (2021) 135:275–303. doi: 10.1042/cs20201213
9. Liu, C, Zhong, M, Jin, X, Zhu, J, Cheng, Y, Li, L, et al. Sleeve gastrectomy links the attenuation of diabetic kidney disease to the inhibition of renal tubular ferroptosis through down-regulating TGF-β1/Smad3 signaling pathway. J Endocrinol Investig. (2024) 47:1763–76. doi: 10.1007/s40618-023-02267-1
10. Song, S, Shi, C, Bian, Y, Yang, Z, Mu, L, Wu, H, et al. Sestrin2 remedies podocyte injury via orchestrating TSP-1/TGF-β1/Smad3 axis in diabetic kidney disease. Cell Death Dis. (2022) 13:663. doi: 10.1038/s41419-022-05120-0
11. Cao, Y, Su, H, Zeng, J, Xie, Y, Liu, Z, Liu, F, et al. Integrin β8 prevents pericyte-myofibroblast transition and renal fibrosis through inhibiting the TGF-β1/TGFBR1/Smad3 pathway in diabetic kidney disease. Transl Res. (2024) 265:36–50. doi: 10.1016/j.trsl.2023.10.007
12. Sun, L, Sun, C, Zhou, S, Zhang, L, and Hu, W. Tamsulosin attenuates high glucose-induced injury in glomerular endothelial cells. Bioengineered. (2021) 12:5184–94. doi: 10.1080/21655979.2021.1955527
13. Zhao, L, Zou, Y, and Liu, F. Transforming growth factor-Beta1 in diabetic kidney disease. Front Cell Dev Biol. (2020) 8:187. doi: 10.3389/fcell.2020.00187
14. Delgado, C, and Powe, NR. Cystatin C-based equation to estimate GFR without race and sex. N Engl J Med. (2023) 388:1722–2. doi: 10.1056/NEJMc2303329
15. Zhang, D, Ye, S, and Pan, T. The role of serum and urinary biomarkers in the diagnosis of early diabetic nephropathy in patients with type 2 diabetes. PeerJ. (2019) 7:e7079. doi: 10.7717/peerj.7079
16. Li, JJ, Sa, RL, Zhang, Y, and Yan, ZL. Evaluating new biomarkers for diabetic nephropathy: role of α2-macroglobulin, podocalyxin, α-L-fucosidase, retinol-binding protein-4, and cystatin C. World J Diabetes. (2024) 15:1212–25. doi: 10.4239/wjd.v15.i6.1212
17. Ren, X, Wang, W, Cao, H, and Shao, F. Diagnostic value of serum cathepsin S in type 2 diabetic kidney disease. Front Endocrinol. (2023) 14:1180338. doi: 10.3389/fendo.2023.1180338
18. Lalmanach, G, Rigoux, B, David, A, Tahri-Joutey, M, Lecaille, F, Marchand-Adam, S, et al. Human cystatin C in fibrotic diseases. Clin Chim Acta. (2024) 565:120016. doi: 10.1016/j.cca.2024.120016
19. Zhou, T, Li, HY, Zhong, H, and Zhong, Z. Relationship between transforming growth factor-β1 and type 2 diabetic nephropathy risk in Chinese population. BMC Med Genet. (2018) 19:201. doi: 10.1186/s12881-018-0717-3
20. Liao, X, Zhu, Y, and Xue, C. Diagnostic value of serum cystatin C for diabetic nephropathy: a meta-analysis. BMC Endocr Disord. (2022) 22:149. doi: 10.1186/s12902-022-01052-0
21. Chinese Diabetes Society. Guidelines for the prevention and treatment of type 2 diabetes in China (2020 edition). Chin J Diabetes. (2021) 13:315–409. doi: 10.3760/cma.j.cn115791-20210221-00095
22. KDOQI. KDOQI clinical practice guidelines and clinical practice recommendations for diabetes and chronic kidney disease. Am J Kidney Dis. (2007) 49:S12–S154. doi: 10.1053/j.ajkd.2006.12.005
23. Navaneethan, SD, Zoungas, S, Caramori, ML, Chan, JCN, Heerspink, HJL, Hurst, C, et al. Diabetes management in chronic kidney disease: synopsis of the KDIGO 2022 clinical practice guideline update. Ann Intern Med. (2023) 176:381–7. doi: 10.7326/m22-2904
24. Expert Group of Chinese Society of Nephrology. Chinese clinical practice guidelines for the diagnosis and treatment of diabetic kidney disease. Chin J Nephrol. (2021) 37:255–304. doi: 10.3760/cma.j.cn441217-20201125-00041
25. Wang, B, Ding, X, Ding, C, Tesch, G, Zheng, J, Tian, P, et al. WNT1-inducible-signaling pathway protein 1 regulates the development of kidney fibrosis through the TGF-β1 pathway. FASEB J. (2020) 34:14507–20. doi: 10.1096/fj.202000953R
26. Xu, F, Jiang, H, Li, X, Pan, J, Li, H, Wang, L, et al. Discovery of PRDM16-mediated TRPA1 induction as the mechanism for low Tubulo-interstitial fibrosis in diabetic kidney disease. Advanced Sci. (2024) 11:e2306704. doi: 10.1002/advs.202306704
27. Feng, L, Chen, C, Xiong, X, Wang, X, Li, X, Kuang, Q, et al. PS-MPs promotes the progression of inflammation and fibrosis in diabetic nephropathy through NLRP3/Caspase-1 and TGF-β1/Smad2/3 signaling pathways. Ecotoxicol Environ Saf. (2024) 273:116102. doi: 10.1016/j.ecoenv.2024.116102
28. Malmgren, L, Öberg, C, den Bakker, E, Leion, F, Siódmiak, J, Åkesson, A, et al. The complexity of kidney disease and diagnosing it—cystatin C, selective glomerular hypofiltration syndromes and proteome regulation. J Intern Med. (2023) 293:293–308. doi: 10.1111/joim.13589
29. Harris, E. Including cystatin C levels may be better for diagnosing CKD. JAMA. (2024) 331:635. doi: 10.1001/jama.2024.0172
30. Vizovišek, M, Fonović, M, and Turk, B. Cysteine cathepsins in extracellular matrix remodeling: extracellular matrix degradation and beyond. Matrix Biol. (2019) 75–76:141–59. doi: 10.1016/j.matbio.2018.01.024
31. Kasabova, M, Joulin-Giet, A, Lecaille, F, Gilmore, BF, Marchand-Adam, S, Saidi, A, et al. Regulation of TGF-β1-driven differentiation of human lung fibroblasts: emerging roles of cathepsin B and cystatin C. J Biol Chem. (2014) 289:16239–51. doi: 10.1074/jbc.M113.542407
32. Kotajima, N, Yanagawa, Y, Aoki, T, Tsunekawa, K, Morimura, T, Ogiwara, T, et al. Influence of thyroid hormones and transforming growth factor-β1 on cystatin C concentrations. J Int Med Res. (2010) 38:1365, 1373–73. doi: 10.1177/147323001003800418
33. Ren, H, Shao, Y, Ma, X, Yang, M, Liu, Y, and Wang, Q. Expression levels of serum vasohibin-1 and other biomarkers in type 2 diabetes mellitus patients with different urinary albumin to creatinine ratios. J Diabetes Complicat. (2019) 33:477–84. doi: 10.1016/j.jdiacomp.2019.04.008
34. John, P, and Yadla, M. Noninvasive method of differentiating diabetic nephropathy and nondiabetic renal disease using serum bone morphogenetic protein-7 and transforming growth factor-beta 1 levels in patients with type-2 diabetes mellitus. Saudi J Kidney Dis Transpl. (2019) 30:1300–9. doi: 10.4103/1319-2442.275474
35. Wu, L, Liu, C, Chang, DY, Zhan, R, Sun, J, Cui, SH, et al. Annexin A1 alleviates kidney injury by promoting the resolution of inflammation in diabetic nephropathy. Kidney Int. (2021) 100:107–21. doi: 10.1016/j.kint.2021.02.025
36. Guo, W, Song, Y, Sun, Y, Du, H, Cai, Y, You, Q, et al. Systemic immune-inflammation index is associated with diabetic kidney disease in type 2 diabetes mellitus patients: evidence from NHANES 2011–2018. Front Endocrinol. (2022) 13:1071465. doi: 10.3389/fendo.2022.1071465
37. Ninčević, V, Zjalić, M, Kolarić, TO, Smolić, M, Kizivat, T, Kuna, L, et al. Renoprotective effect of liraglutide is mediated via the inhibition of TGF-Beta 1 in an LLC-PK1 cell model of diabetic nephropathy. Curr Issues Mol Biol. (2022) 44:1087–114. doi: 10.3390/cimb44030072
38. Bharti, N, Agrawal, V, Kamthan, S, Prasad, N, and Agarwal, V. Blood TGF-β1 and miRNA-21-5p levels predict renal fibrosis and outcome in IgA nephropathy. Int Urol Nephrol. (2023) 55:1557–64. doi: 10.1007/s11255-023-03464-w
39. Torun, D, Ozelsancak, R, Turan, I, Micozkadioglu, H, Sezer, S, and Ozdemir, FN. The relationship between obesity and transforming growth factor beta on renal damage in essential hypertension. Int Heart J. (2007) 48:733–41. doi: 10.1536/ihj.48.733
40. Xuan, X, Pu, X, Yang, Y, Yang, J, Li, Y, Wu, H, et al. Plasma MCP-1 and TGF-β1 levels are associated with kidney injury in children with congenital anomalies of the kidney and urinary tract. Appl Biochem Biotechnol. (2024) 196:6222–33. doi: 10.1007/s12010-023-04808-z
41. Van Nguyen, T, Duc Ngo, K, Hoang Thi, M, Dam, LTP, and Huynh, TQ. Evaluating the serum transforming growth factor-Beta 1 level in chronic kidney disease caused by glomerulonephritis. Nephrourol Mon. (2021) 13:e113161. doi: 10.5812/numonthly.113161
42. Visinescu, AM, Rusu, E, Cosoreanu, A, and Radulian, G. CYSTATIN C-A monitoring perspective of chronic kidney disease in patients with diabetes. Int J Mol Sci. (2024) 25:8135. doi: 10.3390/ijms25158135
43. Xu, Y, Ding, Y, Li, X, and Wu, X. Cystatin C is a disease-associated protein subject to multiple regulation. Immunol Cell Biol. (2015) 93:442–51. doi: 10.1038/icb.2014.121
44. Benoit, SW, Ciccia, EA, and Devarajan, P. Cystatin C as a biomarker of chronic kidney disease: latest developments. Expert Rev Mol Diagn. (2020) 20:1019–26. doi: 10.1080/14737159.2020.1768849
45. Xin, C, Xie, J, Fan, H, Sun, X, and Shi, B. Association between serum cystatin C and thyroid diseases: a systematic review and meta-analysis. Front Endocrinol. (2021) 12:766516. doi: 10.3389/fendo.2021.766516
46. Narasaki, Y, Sohn, P, and Rhee, CM. The interplay between thyroid dysfunction and kidney disease. Semin Nephrol. (2021) 41:133–43. doi: 10.1016/j.semnephrol.2021.03.008
47. Zhang, J, Ren, B, Liu, J, and Li, H. Electrochemical and optical methods for detection of cystatin C as a biomarker of kidney disease. Chem Biol Interact. (2025) 406:111355. doi: 10.1016/j.cbi.2024.111355
48. Kim, DJ, Kang, HS, Choi, HS, Cho, HJ, Kim, ES, Keum, B, et al. Serum cystatin C level is a useful marker for the evaluation of renal function in patients with cirrhotic ascites and normal serum creatinine levels. Korean J Hepatol. (2011) 17:130–8. doi: 10.3350/kjhep.2011.17.2.130
49. Nizhamuding, X, Liu, Y, Zeng, J, Zhao, H, Zhang, T, and Zhang, C. Challenges and perspectives on the adoption of cystatin C testing in China: a laboratory technician’s perspective. Clin Biochem. (2024) 133–134:110839. doi: 10.1016/j.clinbiochem.2024.110839
50. Stehlé, T, and Delanaye, P. Which is the best glomerular filtration marker: creatinine, cystatin C or both? Eur J Clin Investig. (2024) 54:e14278. doi: 10.1111/eci.14278
51. Li, W, Wang, J, Ge, L, Shan, J, Zhang, C, and Liu, J. Growth arrest-specific protein 6 (Gas6) as a noninvasive biomarker for early detection of diabetic nephropathy. Clin Exp Hypertens. (2017) 39:382–7. doi: 10.1080/10641963.2017.1288739
52. Wang, N, Lu, Z, Zhang, W, Bai, Y, Pei, D, and Li, L. Serum cystatin C trajectory is a marker associated with diabetic kidney disease. Front Endocrinol. (2022) 13:824279. doi: 10.3389/fendo.2022.824279
53. Akpınar, K, Aslan, D, and Fenkçi, SM. Assessment of estimated glomerular filtration rate based on cystatin C in diabetic nephropathy. J Bras Nefrol. (2021) 43:340–8. doi: 10.1590/2175-8239-jbn-2020-0145
Keywords: type 2 diabetes, diabetic kidney disease, TGF-β1, CysC, diagnostic value
Citation: Kang Y, Jin Q, Zhou M, Zheng H, Li X, Li A, Zhou JW, Lv J and Wang Y (2025) Diagnostic value of serum TGF-β1 and CysC in type 2 diabetic kidney disease: a cross-sectional study. Front. Med. 12:1529648. doi: 10.3389/fmed.2025.1529648
Edited by:
Giuseppe Regolisti, University of Parma, ItalyReviewed by:
Alberto Martínez-Castelao, Bellvitge University Hospital, SpainZijian Ye, University Medical Center Utrecht, Netherlands
Copyright © 2025 Kang, Jin, Zhou, Zheng, Li, Li, Zhou, Lv and Wang. This is an open-access article distributed under the terms of the Creative Commons Attribution License (CC BY). The use, distribution or reproduction in other forums is permitted, provided the original author(s) and the copyright owner(s) are credited and that the original publication in this journal is cited, in accordance with accepted academic practice. No use, distribution or reproduction is permitted which does not comply with these terms.
*Correspondence: Jie Lv, bHZqaWVidWNtQDE2My5jb20=; Yaoxian Wang, dGNtd3l4MTIzQDEyNi5jb20=
†These authors have contributed equally to this work and share first authorship