- 1Department of Hepatobiliary Surgery, School of Medicine, Mianyang Central Hospital, University of Electronic Science and Technology of China, Mianyang, China
- 2Tongji Medical College, Huazhong University of Science and Technology, Wuhan, China
- 3Department of Urology, School of Medicine, Mianyang Central Hospital, University of Electronic Science and Technology of China, Mianyang, China
- 4NHC Key Laboratory of Nuclear Technology Medical Transformation, School of Medicine, Mianyang Central Hospital, University of Electronic Science and Technology of China, Mianyang, China
Objective: We investigated the association between serum uric acid (SUA) levels and gallstone (GS) prevalence in adult women.
Methods: Participants' information were taken from the United States National Health and Nutrition Examination Survey (2017–2020). Logistic regression analysis and dose-response curve were used to assess the association between SUA levels and the prevalence of GS in adult women. Subgroup analyses were performed to investigate associations between SUA levels and age, ethnicity, body mass index, hypertension, and diabetes.
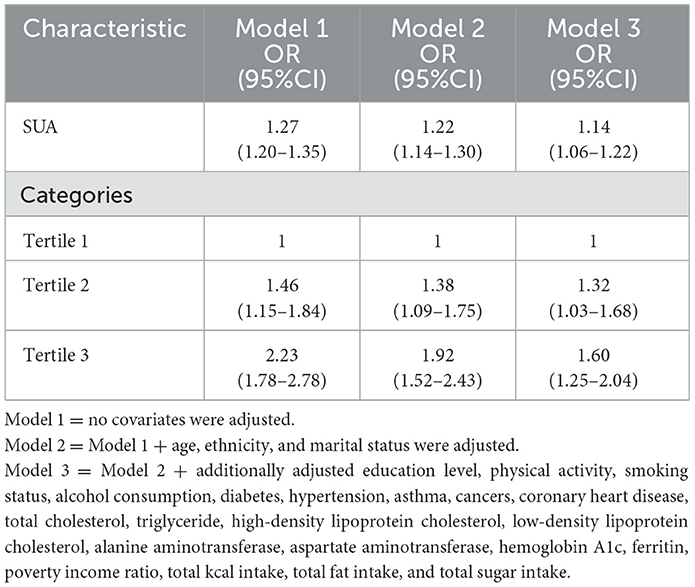
Results: A total of 600 participants self-reported a history of GS. After adjusting for confounding, the prevalence of GS in adult women increased by 14% for every 1 mg/dL increase in SUA (odds ratio [OR]: 1.14, 95% confidence interval [CI]: 1.06, 1.22). Testing SUA as a categorical variable for sensitivity analyses indicated a 1.6-fold increase in the prevalence of GS in tertile 3 (OR=1.60, 95% CI: 1.25, 2.04) compared to tertile 1. Dose-response curves showed a nonlinear correlation between SUA levels and the prevalence of GS. Subgroup analyses indicated that SUA level was associated with an increased prevalence of GS in most subgroups, although subtle differences existed.
Conclusion: SUA was positively and non-linearly associated with the prevalence of GS in adult females. Despite the inability to clarify the causal relationship between them, our results remain interesting.
1 Introduction
Gallstones (GS) are a common disease associated with the digestive system, and their prevalence is increasing worldwide (1). Approximately 800,000 of the adult population in the United States is affected by GS (2). Although benign, GS is also a high-risk factor for gallbladder cancer (3). In the population with GS, most patients are asymptomatic and are often incidentally diagnosed; a few patients may experience abdominal pain, nausea, vomiting, fever, and other discomforts (4). In addition, patients may experience cholangitis, pancreatitis, and even infectious shock when stones enter the common bile duct, which can be life-threatening in severe cases (4). Therefore, most patients undergo surgery. According to the composition, GS are classified into cholesterol, melanin, and mixed stones (5), of which cholesterol stones account for more than 80% (6).
Epidemiological investigations have shown that the prevalence of GS is generally higher in women than in men (7–9). Several factors influence this difference. For example, higher estrogen levels in women increase cholesterol secretion through several pathways, leading to an increase in the concentration of cholesterol in bile, which increases the risk of gallstone formation (10–12). The gallbladder's lower responsiveness to cholecystokinin in women, combined with estrogen's impact on gallbladder smooth muscle function, leads to incomplete emptying and prolonged bile retention, increasing the likelihood of stone formation (13, 14). Genetic factors and lifestyle habits significantly influence GS development in women, with mutations in genes like ABCG5/ABCG8, more prevalent in women, increasing GS risk (10). A growing number of recent studies have pointed out that obesity and metabolic syndrome (MetS) are strongly associated with the pathogenesis of GS and that the prevalence of obesity and MetS is often higher in women than in men (15–17).
Serum uric acid (SUA) metabolism involves multiple steps and organs and is the end product of purine metabolism (18). Moderate levels of SUA are considered beneficial antioxidants; however, excessive SUA levels have been identified as an independent risk factor for a variety of diseases, including MetS, diabetes, hypertension, cardiovascular events, and kidney disease (19–21). However, the relationship between SUA levels and GS in women has yet to be effectively explored. We conducted this nationally representative cross-sectional study to deepen our understanding of the SUA-metabolism-related mechanisms of GS formation and help identify groups at high risk for GS.
2 Methods
2.1 Data source
The data of all study participants were extracted from the National Health and Nutrition Examination Survey (NHANES, https://www.cdc.gov/nchs/nhanes/index.htm.), a major survey conducted by the National Center for Health Statistics (NCHS). NHANES uses a stratified multistage probability sampling methodology (mainly consisting of the following steps: stratification, primary sampling units, secondary sampling units, household sampling, oversampling) to ensure that the survey sample is nationally representative. The participants encompassed diverse age, sex, ethnicity, and socioeconomic status groups. Step-by-step instructions for finding the NHANES dataset are provided in the Supplementary material. The data provided by NHANES help identify health priorities, develop disease prevention strategies, and public health policy. The NHANES also plays a vital role in preventing chronic diseases, improving nutrition, and promoting healthy lifestyles. The NHANES is updated every 2 years with a population of approximately 10,000 at a time and paused in March 2020 due to the COVID-19 epidemic. Questionnaires regarding GS and surgery were only used in the 2017–2020 cycle; participants from that cycle were selected for our study (Figure 1). All NHANES protocols were conducted in accordance with the U.S. Department of Health and Human Services Policy for the Protection of Human Research Subjects and are reviewed and standardized annually by the NCHS Research Ethics Review Board. All participants signed informed consent forms; therefore, there were no additional requirements for informed consent or ethical review for this study.

Figure 1. Flowchart for participants from NHANES (2017–2020). NHANES, National Health and Nutrition Examination Survey; SUA, serum uric acid; GS, gallstone; CHD, coronary heart disease.
2.2 Data collection
The questionnaire was administered to adults aged ≥20 years. Patients with and without GS were assessed based on questionnaire results. The other covariates included in this study consisted of five main components: demographic variables, comorbidities, dietary intake factors, laboratory test results, and other parameters (Supplementary Table 1). Dietary data were collected using two 24-hour dietary recalls administered to each participant. The average intake from these two recalls was calculated and used in our analysis to ensure accuracy and account for daily variability. The procedures or methods of measurement for all covariates are available at www.cdc.gov/nchs/nhanes. SUA was the exposure variable, and GS prevalence was the outcome variable in this study.
2.3 Statistical analysis
Categorical variables are expressed as numbers (%). Continuous variables are expressed as mean ± standard deviation for normally distributed data and as medians and interquartile ranges for skewed distributions. Pearson's χ2 test and Fisher's test were used for comparisons of categorical variables, and the t-test or one-way analysis of variance was used for comparisons of continuous variables. According to these guidelines, we constructed multivariable logistic regression models to test the association between SUA levels, the prevalence of GS, and age at first gallstone surgery in adult women. Model 1: Covariates were not adjusted. Model 2: Adjusted for age, ethnicity, and marital status. Model 3 was adjusted for all potential confounders based on Model 2. Generalized additive model regression and smoothed curve fitting (penalized spline method) were used to assess the relationship between SUA levels and GS prevalence in adult women. A natural ratio test was used to calculate the inflection point when a nonlinear relationship was observed. Subgroup analyses were also performed for age, race, body mass index (BMI), and the presence of hypertension and diabetes. These subgroups were chosen due to their established or potential roles as modifiers or confounders in the relationship between serum uric acid levels and gallstone prevalence. For example, age and BMI are well-recognized risk factors for gallstones, while hypertension and diabetes are commonly associated with metabolic syndrome, which may share a pathophysiological link with serum uric acid levels and gallstone formation. All analyses were performed using R version 4.0.2 (http://www.R-project.org; The R Foundation) and Empower (www.empowerstats.com; X&Y Solutions Inc., Boston, MA, USA). Statistical significance was set at P < 0.05.
3 Results
3.1 Baseline characteristics
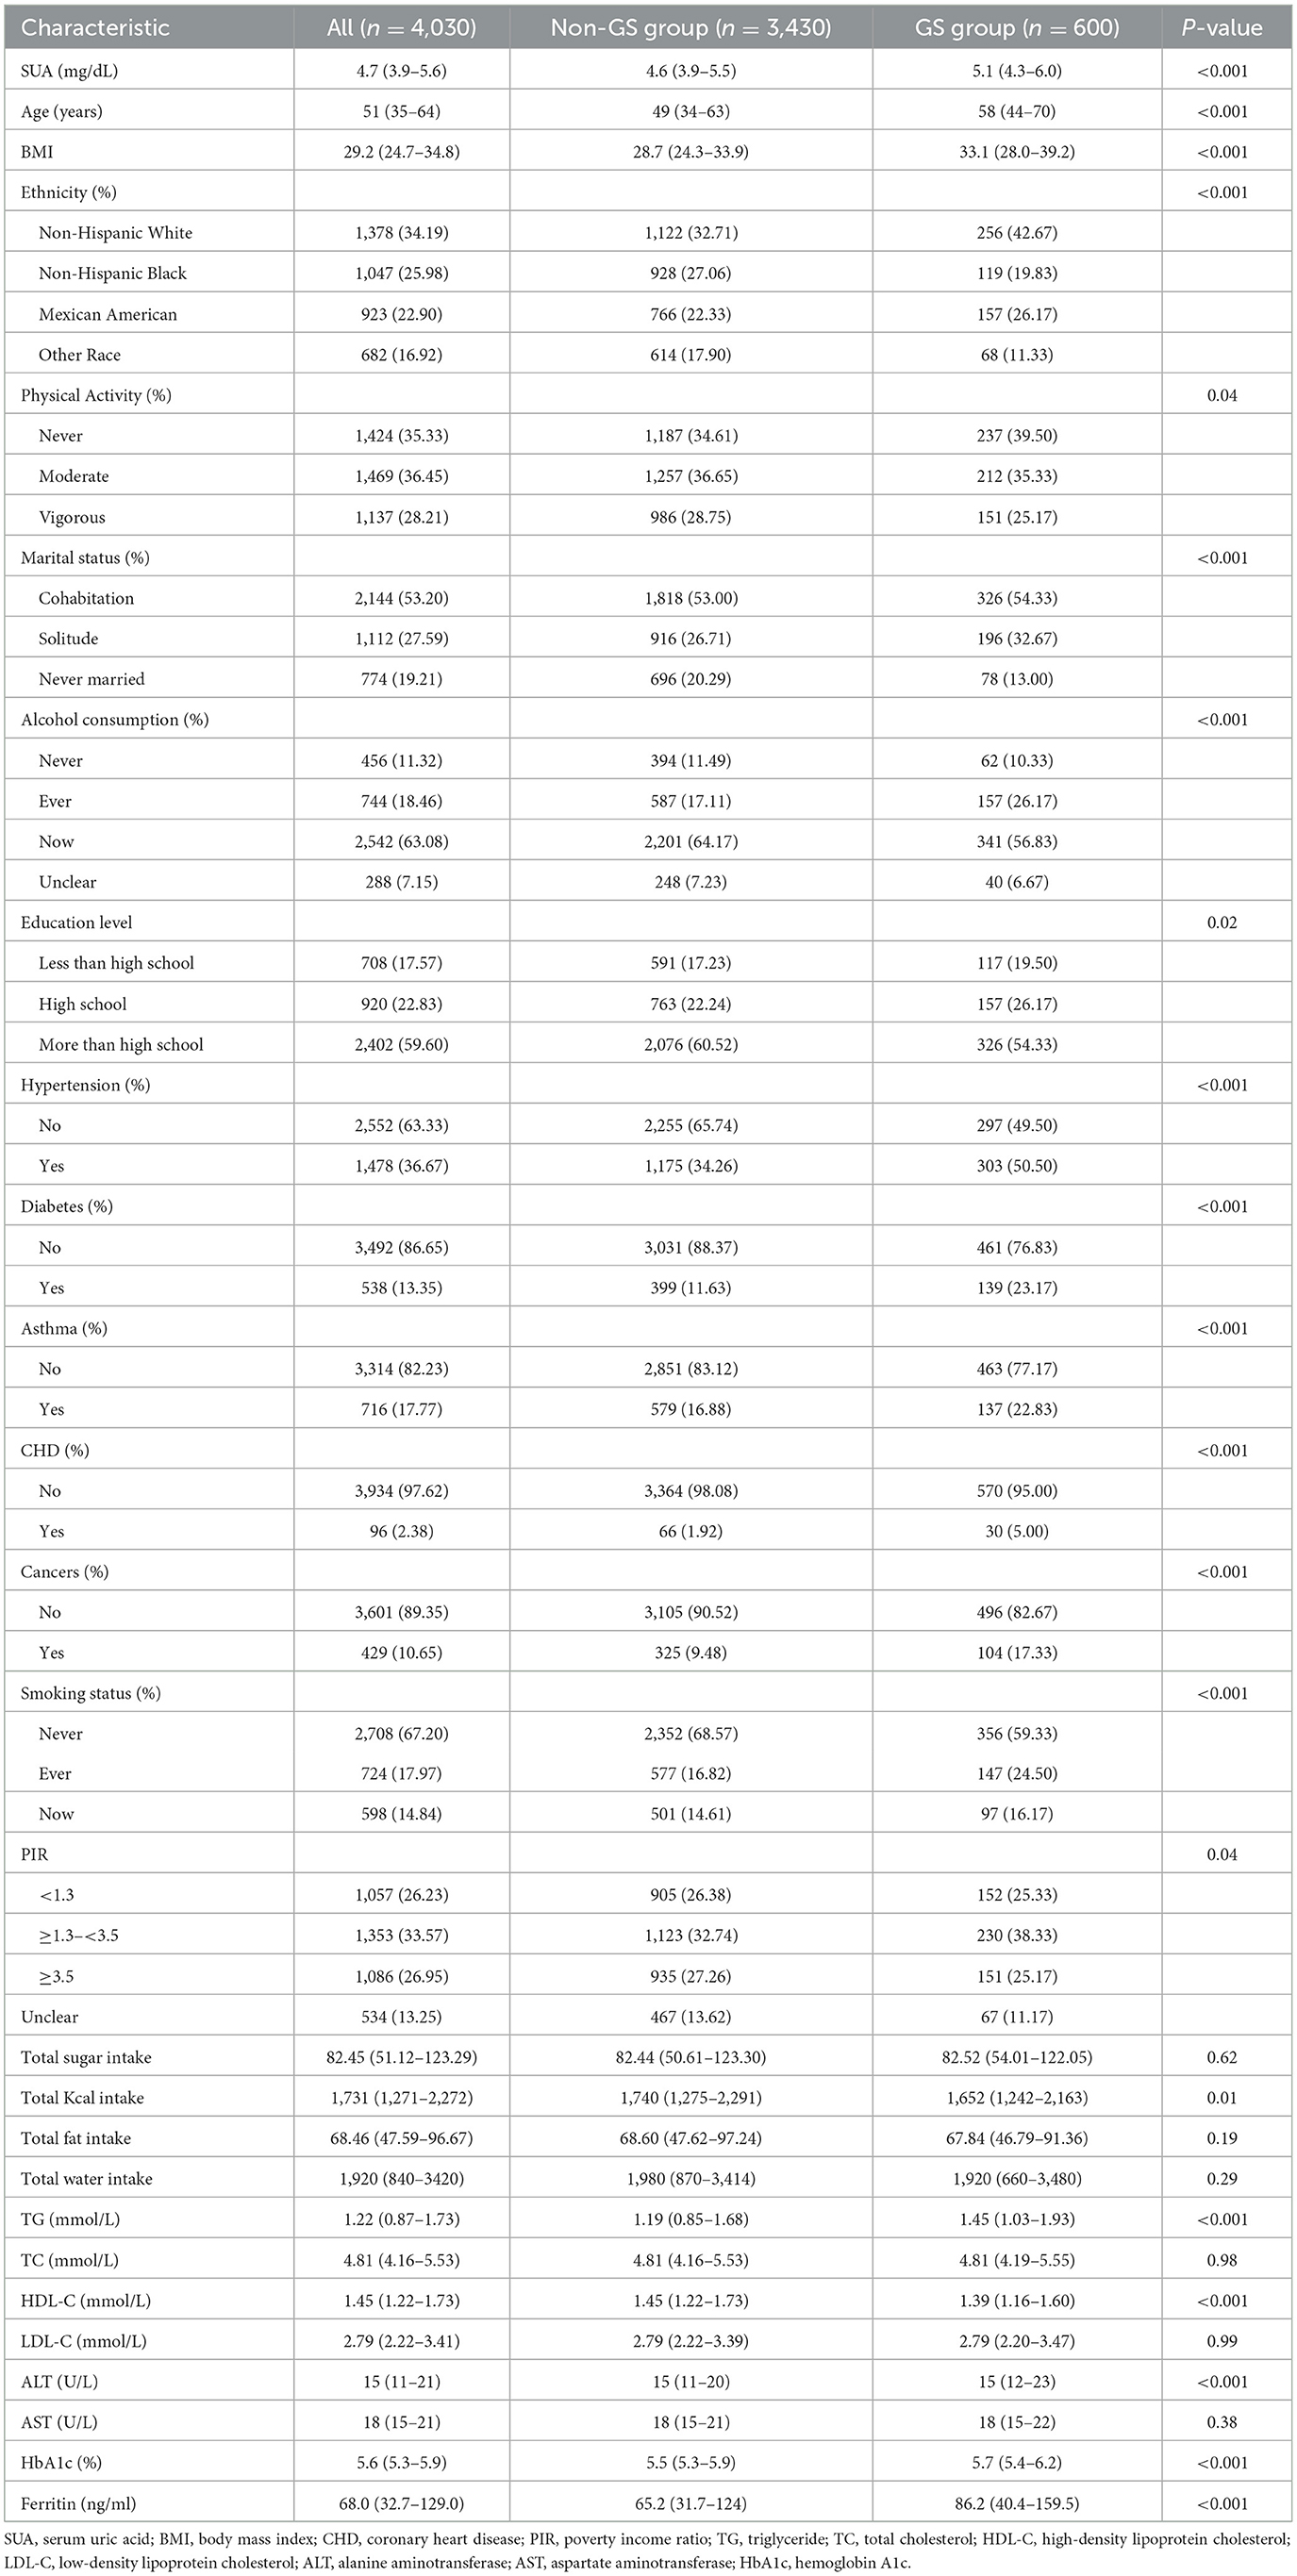
Finally, 4,030 participants were included in this study, including 600 in the GS group and 3,430 in the non-GS group. Compared with the non-GS group, SUA levels were significantly higher in the GS group [4.6 (3.9–5.5) vs. 5.1 (4.3–6.0), P < 0.001]. In addition, patients in the GS group were older and had higher odds of having hypertension, diabetes, asthma, coronary heart disease, and cancer (All P < 0.001). In addition, there were significant differences in BMI, ethnicity, physical activity level, marital status, alcohol consumption, education level, smoking status, poverty income ratio, total kcal intake, and triglyceride, high-density lipoprotein cholesterol, alanine aminotransferase, hemoglobin A1c, and ferritin levels between the two groups. More details are shown in Table 1.
3.2 Logistic regression results between SUA and the prevalence of GS in adult women
Logistic regression analysis revealed a positive association between SUA levels and the prevalence of GS in adult women (Table 2). Even after adjusting for all potential confounders, this positive association persisted (odds ratio [OR] = 1.14, 95% confidence interval [CI]: 1.06, 1.22). Specifically, for every 1 mg/dL increase in SUA, the prevalence of GS in adult women increases by 14%. When we converted SUA from a continuous variable to a categorical variable (tertiles) for sensitivity analyses, we found a 1.6-fold increase in the prevalence of GS in adult women in tertile 3 (OR = 1.60, 95% CI: 1.25, 2.04) compared with SUA tertile 1.
3.3 Dose-response and threshold effects of SUA on the prevalence of GS in adult women
Additive generalized models and smoothed curve fitting were used to further explore the relationship between SUA levels and GS prevalence in adult women. Figure 2 and Table 3 show a nonlinear correlation between SUA levels and the prevalence of GS in adult women. Considering the effect of the saturation thresholds between them, the likelihood natural ratio test found that the best SUA threshold was 5.
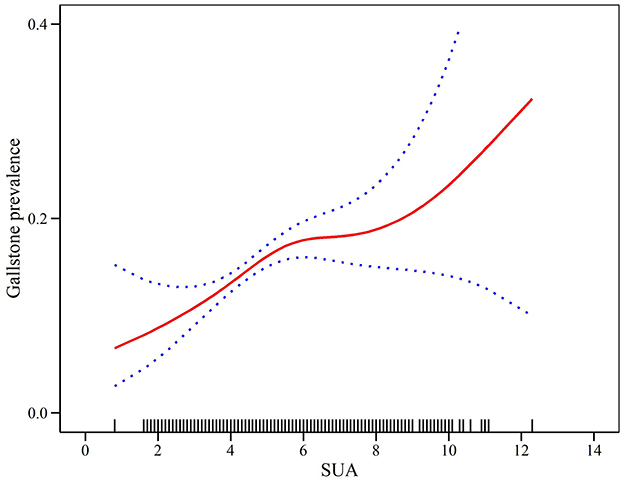
Figure 2. Density dose-response relationship between SUA with GS prevalence in adult women. The area between the upper and lower dashed lines is represented as 95% CI.
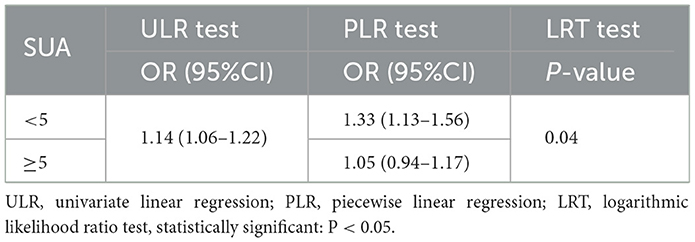
Table 3. Two-piecewise linear regression and logarithmic likelihood ratio test explained the threshold effect analysis of SUA with GS prevalence in adult women.
3.4 Subgroup analysis
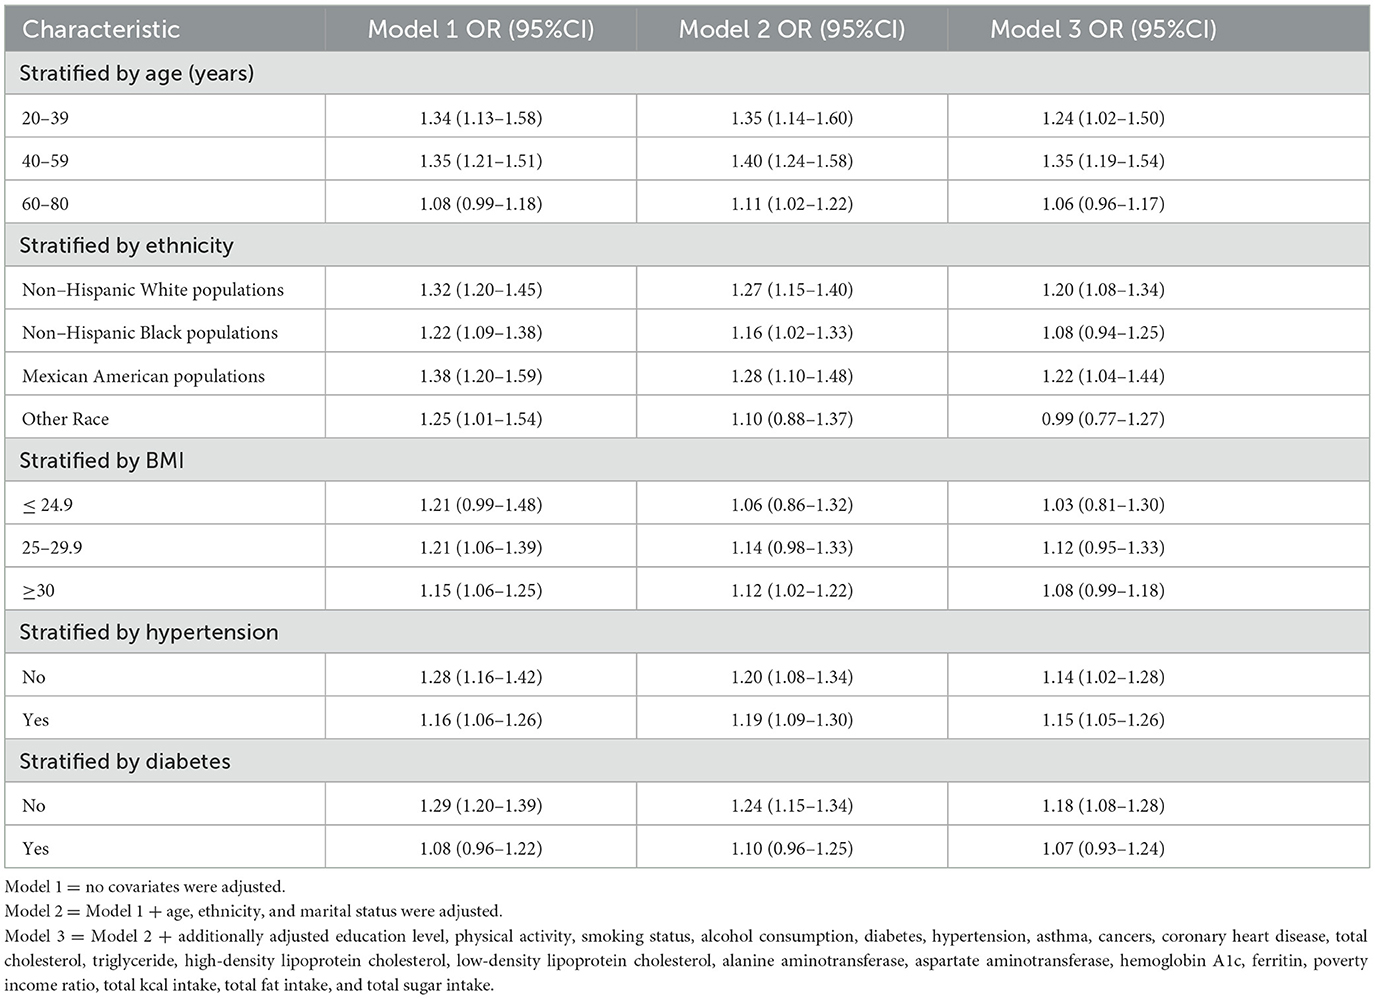
Subgroup analyses further assessed the robustness of the relationship between SUA levels and GS prevalence in adult women across the subgroups. The results suggested that the prevalence of GS in adult women increased with increasing SUA levels, but there were subtle differences among the different subgroups (Table 4). Results indicated significant ORs in demographic groups: 1.24 (95% CI: 1.02, 1.50) for women aged 20–39, 1.35 (95% CI: 1.19, 1.54) for those aged 40–59, and 1.06 (95% CI: 0.96, 1.17) for individuals aged 60–80. Within different racial and ethnic groups, the ORs were as follows: 1.20 (95% CI: 1.08, 1.34) for non-Hispanic white individuals, 1.08 (95% CI: 0.94, 1.25) for non-Hispanic black individuals, 1.22 (95% CI: 1.04, 1.44) for Mexican-American individuals, and 0.99 (95% CI: 0.77, 1.27) for Other Race groups. Among the different BMI groups, ORs were 1.03 (95% CI: 0.81, 1.30) for ≤ 24.9 individuals, 1.12 (95% CI: 0.95, 1.33) for 25–29.9 individuals, and 1.08 (95% CI: 0.99, 1.18) for ≥30 individuals. The OR was 1.15 (95% CI: 1.05, 1.26) in those with hypertension compared with and 1.14 (95% CI: 1.02, 1.28) in the non-hypertensive population. The OR was 1.07 (95% CI: 0.93, 1.24) in those with diabetes and was 1.18 (95% CI: 1.08, 1.28) in the non-diabetes population.
3.5 Logistic regression results of SUA and age at first GS surgery in adult women
After adjusting for all potential confounders, the results showed no significant correlation between SUA and age at first GS surgery in adult women (β = −0.05, 95% CI: −0.88, 0.78) (Table 5).
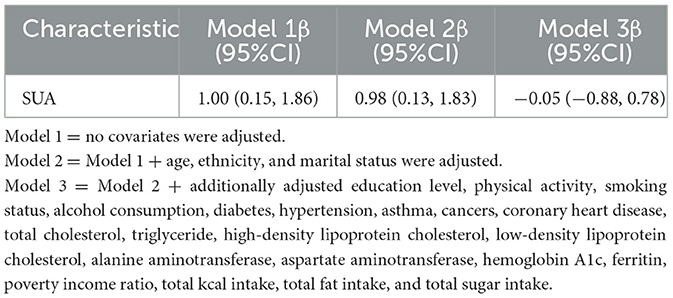
Table 5. Results of logistic regression analyses of SUA and age at first gallstone surgery in adult women.
4 Discussion
This is the first study to investigate the relationship between SUA levels and the prevalence of GS in adult women. The results showed a nonlinear association between SUA levels and GS prevalence in a nationally representative sample of 4,030 adult women. More specifically, each 1 mg/dL increase in SUA level was associated with a 14% increase in the prevalence of GS in adult women. When SUA was converted from a continuous variable to a categorical variable, the prevalence of GS increased 1.6-fold in adult women in tertile 3 compared with those in tertile 1. The subgroup analyses showed that the positive association between SUA levels and the prevalence of GS in adult women remained in most subgroups. However, there were some differences between the subgroups.
The pathogenesis of GS is complex and has not yet been fully elucidated. Epidemiological surveys have shown that the prevalence of GS is higher in women than in men (7, 8). It is influenced by various physiological, hormonal, and lifestyle factors, the most important of which are sex hormone differences. Estrogens can promote cholesterol synthesis and secretion through a variety of pathways, including modulation of the classical “e2-esr1-srebp-2” pathway, up-regulation of ABCG5/ABCG8 expression, and increased hepatic HMG-CoA reductase activity (10–12). Estrogen can also activate G protein-coupled receptor 30 through the signaling cascade of epidermal growth factor receptor, which inhibits cholesterol 7α-hydroxylase activity and bile acid synthesis, leading to an increase in cholesterol secretion and promoting gallstone formation (22). Pregnancy is associated with significantly higher progesterone levels, attenuating gallbladder motility and delaying gallbladder emptying, leading to cholestasis and stone formation (23). Additionally, the lipid metabolism in women differs from that in men. During the childbearing years, women store more fat and have a more active lipid metabolism, which can also lead to higher cholesterol levels and an increased risk of cholesterol stone formation (24–26).
Genetic factors also influence by genetic pathogenesis. Previous reports have shown that the prevalence of GS varies widely across ethnicities. The prevalence was higher in white populations than black populations (27, 28). Everhart et al. (28) found that the prevalence of GS in white women in the United States was 16.6% compared with 13.9% in black women, and the prevalence of GS in white men was 8.6% compared with 5.3% in black men. Our study also found a higher prevalence of GS in non-Hispanic white women than in non-Hispanic black women (32.71% vs. 27.06%, respectively). Such differences may be related to diet, lifestyle, and the level of healthcare among different races. Age is also an important risk factor for the development of GS (29, 30). The prevalence of GS increases significantly after age 40, with a 4- to 10-fold increase in GS prevalence in the older adult population (27). Our study also found that the GS group was significantly older than the non-GS group [58 (44–70) vs. 49 (34–63) P < 0.001]. As we age, the ability of the liver to synthesize and secrete cholesterol increases. In contrast, bile acid synthesis decreases, leading to higher cholesterol concentrations and a greater tendency to form cholesterol stones (31). In addition, the composition of bile changes with age. In older adults, the ratio of phospholipids to bile acids in bile decreases, cholesterol solubility decreases, and the risk of cholesterol crystal formation increases (27, 32). In addition, the motor function of the gallbladder decreases with age, leading to less efficient emptying of the gallbladder and cholestasis (27, 32). Emerging evidence suggests that gut microbiota may play a role in GS development by influencing bile acid metabolism, cholesterol absorption, and inflammation. Future research could explore the interplay between gut microbiota, metabolic factors, and SUA levels in GS pathogenesis to uncover novel therapeutic targets (9, 27, 33). Recent studies have also found that the incidence of GS is increasing at an alarming rate in younger populations and may be closely related to the prevalence of obesity, diabetes, MetS, and other diseases (33, 34).
SUA is the end product of purine metabolism and is closely associated with various metabolic diseases, including diabetes, hypertension, triglyceridemia, and MetS (35–39). Li et al. (18) found that for every 1 mg/dL increase in SUA level in a population with diabetes, there was an 8% and 5% increase in all-cause and cardiovascular disease mortality, respectively. Si et al. (38) found a significant positive correlation between SUA levels and the prevalence of triglyceridemia in US adolescents aged 12–18 years. Similarly, Che et al. (40) found that hyperuricemia was a risk factor for all-cause and cardiovascular mortality in people with hypertension and that asymptomatic hyperuricemia was significantly associated with a poor long-term prognosis. A recent study noted that SUA levels were negatively associated with lung function in the general population (41). In addition, SUA levels are strongly associated with the risk of developing MetS and related disorders in adolescents, and this relationship holds even in non-obese populations (42).
However, the mechanisms underlying the relationship between SUA levels and the GS remain unclear. Metabolic disorders may function as bridges between SUA and GS. SUA has an inherent antioxidant effect; however, at high levels, it can cause oxidative stress (43). SUA is capable of generating reactive oxygen species (ROS) via a peroxidase reaction, and excessive ROS can cause cellular damage, leading to lipid peroxidation, protein oxidation, and DNA damage (44, 45). Such oxidative stress can impair pancreatic islet cell function and reduce insulin secretion and activity, leading to insulin resistance (IR) (46, 47). IR is closely associated with the pathogenesis of GS pathogenesis (48). Next, SUA activates the NLRP3, a multi-protein complex that can activate the production of pro-inflammatory cytokines, such as IL-1β (49, 50), a potent inflammatory mediator that induces the release of other inflammatory factors, creating an inflammatory cascade response (50), which is closely associated with metabolic diseases (51). Oxidative stress can also induce adipocytes to secrete additional inflammatory factors, exacerbating metabolic disorders (52). SUA contributes to IR via various pathways. For example, SUA can affect insulin-mediated glucose uptake by inhibiting endothelial nitric oxide production, affecting vascular endothelium health (53). SUA can also inhibit key enzymes in the insulin signaling pathway, such as PI3K and AKT, through direct action on muscle and adipose tissues (44, 54). IR reduces glucose utilization, elevates blood glucose levels, and promotes excessive insulin secretion. A chronic high insulin state (hyperinsulinemia) increases adipogenesis, further exacerbating obesity and MetS (55, 56). The metabolic function of adipocytes is also affected by SUA, which activates the expression of specific genes, such as adipogenesis-related genes while inhibiting lipolytic enzyme activity and reducing lipolysis (57). These metabolic changes lead to fat accumulation in adipose tissue, increasing the risk of obesity. Obesity is a high-risk factor for the development of GS (58). Therefore, the mechanisms underlying the association between SUA levels and GS remain unclear. Future basic science research should focus on elucidating the precise molecular pathways, such as the role of oxidative stress, inflammation, and insulin resistance in linking SUA to GS formation.
Our findings suggest that elevated SUA levels may serve as a potential biomarker for GS risk in adult women. Clinically, SUA levels are routinely measured in patients, making them a practical and accessible marker for identifying individuals at higher risk for GS. Integrating SUA levels into risk prediction models for GS could improve early identification and prevention strategies. Furthermore, interventions aimed at lowering SUA levels through dietary, pharmacological, or lifestyle modifications might offer a novel approach to reducing GS risk, although further interventional studies are warranted to confirm these potential benefits.
Our study has several advantages. First, this is the first study to identify a relationship between SUA levels and the prevalence of GS in adult women. Specifically, SUA levels were positively and non-linearly associated with the prevalence of GS in adult women. Second, the NHANES encompasses a large number of participants, including people of different ages, sexes, races, and socioeconomic backgrounds, and the NHANES data are based on a national sample from the United States, which is highly representative. Our results provide a good representation of the health status of adult women in the United States. In addition, NHANES data were collected and processed by professionals following strict standards to ensure high quality and consistency. This standardization provided our findings with a high degree of reliability. Finally, we adjusted for potential confounders to ensure our findings apply to the general population.
Our study has some limitations. First, restricted by the nature of this cross-sectional study, we could not clarify the causal relationship between SUA levels and the prevalence of GS in adult women. Longitudinal cohort studies are necessary to clarify the temporal relationship and causative pathways. Second, the diagnosis of GS relied on participants' self-reports; thus, recall or reporting biases may exist. Third, the participants in this study were adult women aged ≥20 years; therefore, the applicability of our findings to men or populations < 20 years requires further investigation. In addition, our findings were based on adult women from the NHANES dataset. Additional studies are needed to validate these results in other populations, including men, younger individuals, and diverse ethnic groups, to enhance the generalizability of the findings. Furthermore, given the association between elevated SUA levels and GS, interventional studies could investigate whether lowering SUA levels through dietary, pharmacological, or lifestyle modifications could reduce the risk of GS. Moreover, NHANES only provides dietary data based on two 24-h recalls, which reflect short-term intake rather than long-term dietary habits. Thus, the data may not fully capture participants' habitual dietary patterns, which are crucial in GS pathogenesis. Finally, considering that SUA is associated with various metabolic disorders, future studies could explore the interactions between SUA, metabolic syndrome components, and GS in greater detail, including potential synergistic effects.
5 Conclusion
This study revealed, for the first time, the relationship between SUA levels and the prevalence of GS in women. Higher SUA levels are associated with an increased prevalence of GS in adult females.
Data availability statement
The original contributions presented in the study are included in the article/Supplementary material, further inquiries can be directed to the corresponding authors.
Author contributions
GL: Conceptualization, Data curation, Formal analysis, Investigation, Project administration, Writing – original draft, Writing – review & editing. DW: Conceptualization, Data curation, Formal analysis, Investigation, Methodology, Project administration, Writing – original draft, Writing – review & editing. YH: Methodology, Project administration, Supervision, Validation, Writing – original draft, Writing – review & editing. RS: Conceptualization, Data curation, Investigation, Methodology, Project administration, Writing – original draft, Writing – review & editing. CQ: Conceptualization, Data curation, Formal analysis, Project administration, Writing – original draft, Writing – review & editing. XC: Conceptualization, Investigation, Methodology, Project administration, Validation, Writing – original draft, Writing – review & editing. XZ: Conceptualization, Data curation, Investigation, Methodology, Validation, Writing – original draft, Writing – review & editing. HL: Formal analysis, Methodology, Project administration, Validation, Writing – original draft, Writing – review & editing. PY: Conceptualization, Methodology, Project administration, Supervision, Validation, Writing – original draft, Writing – review & editing. SC: Investigation, Methodology, Project administration, Supervision, Validation, Writing – original draft, Writing – review & editing. JW: Formal analysis, Funding acquisition, Investigation, Project administration, Resources, Supervision, Validation, Writing – original draft, Writing – review & editing, Conceptualization, Data curation.
Funding
The author(s) declare financial support was received for the research, authorship, and/or publication of this article. This study was supported by the National Natural Science Foundation of China (NSFC) (Grant No. 82400758), the NHC Key Laboratory of Nuclear Technology Medical Transformation (Mianyang Central Hospital) (Grant No. 2023HYX032), the Incubation Subject of Mianyang Central Hospital (Grant No. 2022FH010), the Medical Research Youth Innovation Project of Sichuan Province, China (Grant No. Q23046), and the Health Commission of Sichuan Province Medical Science and Technology Program (Grant No. 24QNMP028).
Acknowledgments
We are grateful to the NHANES participants and staff. We appreciate all the reviewers who participated in the review.
Conflict of interest
The authors declare that the research was conducted in the absence of any commercial or financial relationships that could be construed as a potential conflict of interest.
Publisher's note
All claims expressed in this article are solely those of the authors and do not necessarily represent those of their affiliated organizations, or those of the publisher, the editors and the reviewers. Any product that may be evaluated in this article, or claim that may be made by its manufacturer, is not guaranteed or endorsed by the publisher.
Supplementary material
The Supplementary Material for this article can be found online at: https://www.frontiersin.org/articles/10.3389/fmed.2025.1487974/full#supplementary-material
References
1. Baiu I, Hawn MT. Gallstones and biliary colic. JAMA. (2018) 320:1612. doi: 10.1001/jama.2018.11868
2. Wang X, Yu W, Jiang G, Li H, Li S, Xie L, et al. Global epidemiology of gallstones in the 21st century: a systematic review and meta-analysis. Clin Gastroenterol Hepatol. (2024) 22:1586–95. doi: 10.1016/j.cgh.2024.01.051
3. Malcomson FC, Parra-Soto S, Ho FK, Lu L, Celis-Morales C, Sharp L, et al. Adherence to the 2018 World Cancer Research Fund (WCRF)/American Institute for Cancer Research (AICR) Cancer Prevention Recommendations and risk of 14 lifestyle-related cancers in the UK Biobank prospective cohort study. BMC Med. (2023) 21:407. doi: 10.1186/s12916-023-03107-y
4. Madden AM, Smeeton NC, Culkin A, Trivedi D. Modified dietary fat intake for treatment of gallstone disease in people of any age. Cochrane Database Syst Rev. (2024) 2:CD012608. doi: 10.1002/14651858.CD012608.pub3
5. Portincasa P, Di Ciaula A, de Bari O, Garruti G, Palmieri VO, Wang DQ. Management of gallstones and its related complications. Expert Rev Gastroenterol Hepatol. (2016) 10:93–112. doi: 10.1586/17474124.2016.1109445
6. European Association for the Study of the Liver (EASL). EASL Clinical Practice Guidelines on the prevention, diagnosis and treatment of gallstones. J Hepatol. (2016) 65:146–81. doi: 10.1016/j.jhep.2016.03.005
7. Fujita N, Yasuda I, Endo I, Isayama H, Iwashita T, Ueki T, et al. Evidence-based clinical practice guidelines for cholelithiasis 2021. J Gastroenterol. (2023) 58:801–33. doi: 10.1007/s00535-023-02014-6
8. Zhu Q, Xing Y, Fu Y, Chen X, Guan L, Liao F, et al. Causal association between metabolic syndrome and cholelithiasis: a Mendelian randomization study. Front Endocrinol (Lausanne). (2023) 14:1180903. doi: 10.3389/fendo.2023.1180903
9. Tazuma S. Gallstone disease: Epidemiology, pathogenesis, and classification of biliary stones (common bile duct and intrahepatic). Best Pract Res Clin Gastroenterol. (2006) 20:1075–83. doi: 10.1016/j.bpg.2006.05.009
10. Berge KE, Tian H, Graf GA, Yu L, Grishin NV, Schultz J, et al. Accumulation of dietary cholesterol in sitosterolemia caused by mutations in adjacent ABC transporters. Science. (2000) 290:1771–5. doi: 10.1126/science.290.5497.1771
11. Jackson SS, Graubard BI, Gabbi C, Koshiol J. Association with menopausal hormone therapy and asymptomatic gallstones in US women in the third National Health and Nutrition Examination Study. Sci Rep. (2024) 14:191. doi: 10.1038/s41598-023-50509-2
12. Wang HH, de Bari O, Arnatt CK, Liu M, Portincasa P, Wang DQ. Activation of estrogen receptor g protein-coupled receptor 30 enhances cholesterol cholelithogenesis in female mice. Hepatology. (2020) 72:2077–89. doi: 10.1002/hep.31212
13. Portincasa P, Di Ciaula A, Bonfrate L, Stella A, Garruti G, Lamont JT. Metabolic dysfunction-associated gallstone disease: expecting more from critical care manifestations. Intern Emerg Med. (2023) 18:1897–918. doi: 10.1007/s11739-023-03355-z
14. Festi D, Colecchia A, Orsini M, Sangermano A, Sottili S, Simoni P, et al. Gallbladder motility and gallstone formation in obese patients following very low calorie diets. Use it (fat) to lose it (well). Int J Obes Relat Metab Disord. (1998) 22:592–600. doi: 10.1038/sj.ijo.0800634
15. Cooper AJ, Gupta SR, Moustafa AF, Chao AM. Sex/gender differences in obesity prevalence, comorbidities, and treatment. Curr Obes Rep. (2021) 10:458–66. doi: 10.1007/s13679-021-00453-x
16. Karnes JH, Arora A, Feng J, Steiner HE, Sulieman L, Boerwinkle E, et al. Racial, ethnic, and gender differences in obesity and body fat distribution: an All of Us Research Program demonstration project. PLoS ONE. (2021) 16:e0255583. doi: 10.1371/journal.pone.0255583
17. Di Tecco C, Fontana L, Adamo G, Petyx M, Iavicoli S. Gender differences and occupational factors for the risk of obesity in the Italian working population. BMC Public Health. (2020) 20:706. doi: 10.1186/s12889-020-08817-z
18. Li B, Chen L, Hu X, Tan T, Yang J, Bao W, et al. Association of serum uric acid with all-cause and cardiovascular mortality in diabetes. Diabetes Care. (2023) 46:425–33. doi: 10.2337/dc22-1339
19. Chen WY, Fu YP, Zhou M. The bidirectional relationship between metabolic syndrome and hyperuricemia in China: a longitudinal study from CHARLS. Endocrine. (2022) 76:62–9. doi: 10.1007/s12020-022-02979-z
20. Nishizawa H, Maeda N, Shimomura I. Impact of hyperuricemia on chronic kidney disease and atherosclerotic cardiovascular disease. Hypertens Res. (2022) 45:635–40. doi: 10.1038/s41440-021-00840-w
21. Jiang J, Zhang T, Liu Y, Chang Q, Zhao Y, Guo C, et al. Prevalence of diabetes in patients with hyperuricemia and gout: a systematic review and meta-analysis. Curr Diab Rep. (2023) 23:103–17. doi: 10.1007/s11892-023-01506-2
22. de Bari O, Wang TY, Liu M, Portincasa P, Wang DQ. Estrogen induces two distinct cholesterol crystallization pathways by activating ERα and GPR30 in female mice. J Lipid Res. (2015) 56:1691–700. doi: 10.1194/jlr.M059121
23. Cong P, Pricolo V, Biancani P, Behar J. High levels of caveolar cholesterol inhibit progesterone-induced genomic actions in human and guinea pig gallbladder muscle. Am J Physiol Gastrointest Liver Physiol. (2009) 296:G948–54. doi: 10.1152/ajpgi.90699.2008
24. Ko CW, Beresford SA, Schulte SJ, Matsumoto AM, Lee SP. Incidence, natural history, and risk factors for biliary sludge and stones during pregnancy. Hepatology. (2005) 41:359–65. doi: 10.1002/hep.20534
25. Cirillo DJ, Wallace RB, Rodabough RJ, Greenland P, LaCroix AZ, Limacher MC, et al. Effect of estrogen therapy on gallbladder disease. JAMA. (2005) 293:330–9. doi: 10.1001/jama.293.3.330
26. Tierney S, Nakeeb A, Wong O, Lipsett PA, Sostre S, Pitt HA, et al. Progesterone alters biliary flow dynamics. Ann Surg. (1999) 229:205–9. doi: 10.1097/00000658-199902000-00007
27. Shaffer EA. Gallstone disease: Epidemiology of gallbladder stone disease. Best Pract Res Clin Gastroenterol. (2006) 20:981–96. doi: 10.1016/j.bpg.2006.05.004
28. Everhart JE, Khare M, Hill M, Maurer KR. Prevalence and ethnic differences in gallbladder disease in the United States. Gastroenterology. (1999) 117:632–9. doi: 10.1016/s0016-5085(99)70456-7
29. Liew PL, Lee WJ, Wang W, Lee YC, Chen WY, Fang CL, et al. Fatty liver disease: predictors of nonalcoholic steatohepatitis and gallbladder disease in morbid obesity. Obes Surg. (2008) 18:847–53. doi: 10.1007/s11695-007-9355-0
30. Festi D, Dormi A, Capodicasa S, Staniscia T, Attili AF, Loria P, et al. Incidence of gallstone disease in Italy: results from a multicenter, population-based Italian study (the MICOL project). World J Gastroenterol. (2008) 14:5282–9. doi: 10.3748/wjg.14.5282
31. Misciagna G, Leoci C, Guerra V, Chiloiro M, Elba S, Petruzzi J, et al. Epidemiology of cholelithiasis in southern Italy. Part II: Risk factors. Eur J Gastroenterol Hepatol. (1996) 8:585–93. doi: 10.1097/00042737-199606000-00017
32. Wang HH, Portincasa P, Wang DQ. Molecular pathophysiology and physical chemistry of cholesterol gallstones. Front Biosci. (2008) 13:401–23. doi: 10.2741/2688
33. Su PY, Hsu YC, Cheng YF, Kor CT, Su WW. Strong association between metabolically-abnormal obesity and gallstone disease in adults under 50 years. BMC Gastroenterol. (2019) 19:117. doi: 10.1186/s12876-019-1032-y
34. Shabanzadeh DM, Sørensen LT, Jørgensen T. Determinants for gallstone formation - a new data cohort study and a systematic review with meta-analysis. Scand J Gastroenterol. (2016) 51:1239–48. doi: 10.1080/00365521.2016.1182583
35. Khichar S, Choudhary S, Singh VB, Tater P, Arvinda RV, Ujjawal V. Serum uric acid level as a determinant of the metabolic syndrome: a case control study. Diabetes Metab Syndr. (2017) 11:19–23. doi: 10.1016/j.dsx.2016.06.021
36. Kubota M. Hyperuricemia in children and adolescents: present knowledge and future directions. J Nutr Metab. (2019) 2019:3480718. doi: 10.1155/2019/3480718
37. Wei F, Sun N, Cai C, Feng S, Tian J, Shi W, et al. Associations between serum uric acid and the incidence of hypertension: a Chinese senior dynamic cohort study. J Transl Med. (2016) 14:110. doi: 10.1186/s12967-016-0866-0
38. Si SA, Chen MQ, Zhang GJ. Association of serum uric acid with hypertriglyceridemia in children and adolescents: a cross-sectional study. Lipids Health Dis. (2024) 23:195. doi: 10.1186/s12944-024-02182-1
39. Zhang S, Wang Y, Cheng J, Huangfu N, Zhao R, Xu Z, et al. Hyperuricemia and cardiovascular disease. Curr Pharm Des. (2019) 25:700–9. doi: 10.2174/1381612825666190408122557
40. Che J, Tong J, Kuang X, Zheng C, He N, Liu Z. Hyperuricemia and gout enhanced the risk of long-term mortality in hypertension: insights from the National Health and Nutrition Examination Survey 2007-2018. J Hypertens. (2024) 42:1390–8. doi: 10.1097/HJH.0000000000003744
41. Luo W, Wang C, Wang W, Yao X, Lu F, Wu D, et al. Serum uric acid is inversely associated with lung function in US adults. Sci Rep. (2024) 14:1300. doi: 10.1038/s41598-024-51808-y
42. Seo YJ, Shim YS, Lee HS, Hwang JS. Association of serum uric acid Levels with metabolic syndromes in Korean adolescents. Front Endocrinol. (2023) 14:1159248. doi: 10.3389/fendo.2023.1159248
43. Sautin YY, Johnson RJ. Uric acid: the oxidant-antioxidant paradox. Nucleosides Nucleotides Nucleic Acids. (2008) 27:608–19. doi: 10.1080/15257770802138558
44. Sautin YY, Nakagawa T, Zharikov S, Johnson RJ. Adverse effects of the classic antioxidant uric acid in adipocytes: NADPH oxidase-mediated oxidative/nitrosative stress. Am J Physiol Cell Physiol. (2007) 293:C584–96. doi: 10.1152/ajpcell.00600.2006
45. Yu MA, Sánchez-Lozada LG, Johnson RJ, Kang DH. Oxidative stress with an activation of the renin-angiotensin system in human vascular endothelial cells as a novel mechanism of uric acid-induced endothelial dysfunction. J Hypertens. (2010) 28:1234–42.
46. Poitout V, Robertson RP. Glucolipotoxicity: fuel excess and beta-cell dysfunction. Endocr Rev. (2008) 29:351–66. doi: 10.1210/er.2007-0023
47. Robertson RP. Chronic oxidative stress as a central mechanism for glucose toxicity in pancreatic islet beta cells in diabetes. J Biol Chem. (2004) 279:42351–4. doi: 10.1074/jbc.R400019200
48. Wang J, Li H, Hu J, Shi R, Qin C, Chen X, et al. Relationship of triglyceride-glucose index to gallstone prevalence and age at first gallstone surgery in American adults. Sci Rep. (2024) 14:16749. doi: 10.1038/s41598-024-67883-0
49. Kelley N, Jeltema D, Duan Y, He Y. The NLRP3 Inflammasome: An Overview of Mechanisms of Activation and Regulation. Int J Mol Sci. (2019) 20:3328. doi: 10.3390/ijms20133328
50. Sharma D, Kanneganti TD. The cell biology of inflammasomes: Mechanisms of inflammasome activation and regulation. J Cell Biol. (2016) 213:617–29. doi: 10.1083/jcb.201602089
51. Martinon F, Pétrilli V, Mayor A, Tardivel A, Tschopp J. Gout-associated uric acid crystals activate the NALP3 inflammasome. Nature. (2006) 440:237–41. doi: 10.1038/nature04516
52. Furukawa S, Fujita T, Shimabukuro M, Iwaki M, Yamada Y, Nakajima Y, et al. Increased oxidative stress in obesity and its impact on metabolic syndrome. J Clin Invest. (2004) 114:1752–61. doi: 10.1172/JCI21625
53. Khosla UM, Zharikov S, Finch JL, Nakagawa T, Roncal C, Mu W, et al. Hyperuricemia induces endothelial dysfunction. Kidney Int. (2005) 67:1739–42. doi: 10.1111/j.1523-1755.2005.00273.x
54. Wan X, Xu C, Lin Y, Lu C, Li D, Sang J, et al. Uric acid regulates hepatic steatosis and insulin resistance through the NLRP3 inflammasome-dependent mechanism. J Hepatol. (2016) 64:925–32. doi: 10.1016/j.jhep.2015.11.022
55. Muoio DM, Newgard CB. Mechanisms of disease:Molecular and metabolic mechanisms of insulin resistance and beta-cell failure in type 2 diabetes. Nat Rev Mol Cell Biol. (2008) 9:193–205. doi: 10.1038/nrm2327
56. Samuel VT, Shulman GI. Mechanisms for insulin resistance: common threads and missing links. Cell. (2012) 148:852–71. doi: 10.1016/j.cell.2012.02.017
57. Lanaspa MA, Sanchez-Lozada LG, Cicerchi C, Li N, Roncal-Jimenez CA, Ishimoto T, et al. Uric acid stimulates fructokinase and accelerates fructose metabolism in the development of fatty liver. PLoS ONE. (2012) 7:e47948. doi: 10.1371/journal.pone.0047948
Keywords: gallstones, serum uric acid, NHANES, women, cross-sectional study
Citation: Lv G, Wang D, Huang Y, Shi R, Qin C, Chen X, Zeng X, Luo H, Yang P, Chen S and Wang J (2025) High serum uric acid levels are associated with increased prevalence of gallstones in adult women: a cross-sectional study based on NHANES. Front. Med. 12:1487974. doi: 10.3389/fmed.2025.1487974
Received: 29 August 2024; Accepted: 02 January 2025;
Published: 17 January 2025.
Edited by:
Sahil Sharma, Memorial Sloan Kettering Cancer Center, United StatesReviewed by:
Atamjit Singh, Guru Nanak Dev University, IndiaHarbinder Singh, University of Toledo, United States
Andreas Antzoulas, General University Hospital of Patras, Greece
Copyright © 2025 Lv, Wang, Huang, Shi, Qin, Chen, Zeng, Luo, Yang, Chen and Wang. This is an open-access article distributed under the terms of the Creative Commons Attribution License (CC BY). The use, distribution or reproduction in other forums is permitted, provided the original author(s) and the copyright owner(s) are credited and that the original publication in this journal is cited, in accordance with accepted academic practice. No use, distribution or reproduction is permitted which does not comply with these terms.
*Correspondence: Sirui Chen, NjQ1Mzc2NUBxcS5jb20=; Jianjun Wang, d2FuZ2ppYW5qdW5tY2hAMTYzLmNvbQ==
†These authors have contributed equally to this work and share first authorship
 Guozheng Lv
 Decai Wang
 Yu Huang1†
 Ruizi Shi
 Xintao Zeng
 Jianjun Wang