 Wenlu Dong
 Longyang Xiao
 Ziwei Luo
 Haiyang Yu
 Lili Wang
 Yuanxiang Gao
 Zhiming Li
94% of researchers rate our articles as excellent or good
Learn more about the work of our research integrity team to safeguard the quality of each article we publish.
Find out more
ORIGINAL RESEARCH article
Front. Med. , 21 January 2025
Sec. Hepatobiliary Diseases
Volume 11 - 2024 | https://doi.org/10.3389/fmed.2024.1477685
Objectives: This study was aimed to assess the diagnostic performance of intravoxel incoherent motion (IVIM) magnetic resonance imaging (MRI) and T1 mapping in detecting hypoxia status of chronic liver disease using a carbon tetrachloride (CCl4)-induced rat model.
Materials and methods: The hypoxia group of chronic liver disease consisted of eight rats induced by injection of CCl4 and the control group consisted of nine rats injected with pure olive oil. All 17 rats underwent MRI examination at week 13 after injection, using T1 mapping and IVIM. Liver specimens were subjected to immunohistochemical staining for the exogenous hypoxia marker pimonidazole and the endogenous hypoxia marker HIF-1α and scored semi-quantitatively. Differences in MRI multiparameters, pimonidazole H-scores, and HIF-1α were analyzed between the control and hypoxia groups. Correlations between MRI multiparameters and H-score, and MRI multiparameters and HIF-1α, were analyzed, and the diagnostic performance of multiparameter MRI was evaluated by receiver operating characteristic (ROC) curve analysis.
Results: There were significant differences between the control group and the hypoxia group in D* values (p = 0.01) and f values (p = 0.025) of IVIM parameters, T1 mapping (p = 0.003), HIF-1α (p < 0.001) and pimonidazole scores (p = 0.004). D* (r = 0.508, p = 0.037) and T1 mapping (r = 0.489, p = 0.046) values positively correlated with pimonidazole scores. D* (r = 0.556, p = 0.020) and T1 mapping (r = 0.505, p = 0.039) showed a positive correlation with HIF-1α. The optimal cut-off value of T1 mapping was 941.527, and the sensitivity, specificity, and AUC were 87.5, 77.8, and 0.889 (95% confidence interval [CI]: 0.734–1), respectively.
Conclusion: IVIM and T1 Mapping are promising methods for non-invasive detection of hypoxia status in chronic liver diseases.
Chronic liver disease (CLD) is a significant public health burden worldwide, causing over 2 million deaths annually (1). Although several causes behind the development of CLD, some of the most common include alcohol abuse, obesity/metabolic disease, autoimmune hepatitis, and viral hepatitis (hepatitis B virus [HBV] and hepatitis B virus [HCV]) (2). The course of chronic liver disease (CLD) is marked by a prolonged history of chronic parenchymal injury, persistent activation of the inflammatory response, and continuous activation of hepatic fibrosis and wound healing responses (3).
Chronic liver diseases, such as metabolic fatty liver disease (MAFLD) and viral hepatitis, are characterized by persistent inflammation and subsequent liver fibrosis (4, 5). Metabolic fatty liver disease (MAFLD) is a recent terminology that refers to non-alcoholic fatty liver disease (NAFLD)—more precisely denotes the metabolic dysfunction that primarily drives the condition and highlights the pivotal role of metabolic dysfunction in the progression of liver disease. Improvements in nomenclature, diagnostic criteria, heterogeneity, and subtype research will facilitate comprehensive studies on MAFLD and yield more effective therapy and care approaches for patients (6). Liver fibrosis is a dynamic, highly integrated process in chronic liver injury of any etiology and is characterized by an abnormal accumulation of extracellular matrix (ECM) (7). The progression of liver fibrosis can lead to liver cirrhosis and even to hepatocellular carcinoma (HCC). The advancement of hepatocellular carcinoma is intricately linked to liver fibrosis, with over 80% of hepatocellular carcinomas (HCC) manifesting in fibrotic or cirrhotic livers (8). This indicates that liver fibrosis significantly contributes to the liver’s precancerous environment (PME) (9). Liver fibrogenesis and the chronic inflammatory response, play a primary role in the progression of chronic liver diseases (CLD) (5). In addition, circadian rhythms significantly influence the advancement of metabolic disorders, including NAFLD, with numerous genes associated with metabolic regulation governed by these rhythms. Circadian disruption may influence the initiation and progression of NAFLD/non-alcoholic steatohepatitis (NASH), expedite the fibrotic response, and eventually result in HCC. Connecting biological clocks to metabolic processes and carcinogenesis offers potential avenues for treating and preventing metabolic liver disease and hepatocellular carcinoma (HCC) (10–12). Hepatic hypoxia plays a vital role in the formation and progression of chronic liver disease (13, 14). Hepatic hypoxia is present at all stages of chronic liver disease and progressively increases with different stages, from early hepatocellular injury to cirrhosis (15). Mesarwi et al. (16) found that hypoxia accelerated the progression of non-alcoholic fatty liver disease (NAFLD) and aggravated liver fibrosis. Liver fibrosis, in turn, can significantly aggravate the degree of hypoxia (17). Hypoxia is still the main driver of sustained progression of liver fibrosis (18–20). Chronic liver disease caused by viral infection, excessive alcohol consumption, or metabolic disorders all activate HIF through hypoxia-dependent and hypoxia-independent signaling (13). HIF-1α is a marker of hepatic hypoxia and produces prohepatic fibrogenic effects mediated by HIF-1α in different cell types within the liver (21). Detecting or monitoring the hypoxia status of chronic liver disease will contribute to a better understanding of the process and finding more proper ways to treat it (22–24).
There is a pressing need for a non-invasive and accurate method for assessing hepatic hypoxia for clinical practice. Intravoxel incoherent motion (IVIM) MRI is a functional imaging technique that utilizes the Brownian motion of water molecules, and its parameters can reflect tissue diffusivity and tissue microcapillary perfusion (25, 26). Previous studies have applied IVIM to monitor hypoxia in different types of malignant tumors (27–29). Malignant tumors are frequently linked to reduced oxygen levels in the tumor tissue. The hypoxic environment may facilitate the emergence of distant metastases and adversely affect patient prognoses (30). The prognostic relevance of HIF-1α expression to various malignant tumors has been demonstrated (31–33). Consequently, the assessment of tumor hypoxia using IVIM magnetic resonance imaging (MRI) is crucial for prognostic evaluation and treatment decision-making. However, limited studies exist about the application of IVIM for identifying hypoxic conditions in chronic liver disease. MR T1 mapping technique is a non-invasive quantitative method to reflect the T1 relaxation time of specific tissue. T1 relaxation time is prolonged in liver fibrosis due to excessive ECM deposition (34). At present, T1 mapping for the evaluation of liver fibrosis has been widely studied (35). However, a few studies have reported detecting the hypoxia status of chronic liver disease using the IVIM and T1 mapping.
In this study, therefore, we proposed to apply IVIM and T1 mapping for detecting the hypoxia status of chronic liver disease in a CCl4-induced rat model.
The Institutional Animal Care and Welfare Committee of our institution approved this study.
In total, 17 healthy Wistar male rats (250 ± 10 g, 6 weeks old) were randomly divided into two groups, namely, a hypoxia group of chronic liver disease (n = 8) and a control group (n = 9). All Wistar Rats were housed in a specific pathogen-free (SPF) animal house with environmental conditions of 21 ± 2°C, humidity (52.5 ± 12.5)%, and a light–dark cycle of 12 h. All rats started the experiments 1 week after acclimatization when they had free access to water and commercial rat chow (Meadow Feeds™ Standard Maintenance Rat Chow, Keao Xieli Feed Co., Ltd, Tianjin, China). The rats in the hypoxia group of chronic liver disease were subjected to intraperitoneal (i.p.) injection of 3 mL/kg CCl4 dissolved in olive oil, with a ratio of 4:6, twice per week at 1–6 weeks and once per week at 7–13 week. Whereas the rats in the control group underwent intraperitoneal injections of 3 mL/kg of pure olive oil solution similarly. Changes in the body weight of rats in the hypoxia and control groups were analyzed over 13 weeks to determine their health status.
At week 13 after the initial injection of CCl4 and oil, rats in both the hypoxia group (n = 8) and control group (n = 9) underwent MRI examinations with an 8-channel coil (CG-MUC22-H300-AG, Chenguang, Shanghai, China) on a 3-T MRI scanner (Magnetom skyra, Siemens Medical Solutions Erlangen, Germany). All rats were injected with pimonidazole (Hypoxyprobe-3; Hypoxyprobe, Inc., Burlington, MA, USA) through the tail vein with a dose of 60 mg/kg before MR scanning. Furthermore, the rats were placed in a small animal anesthesia equipment by ventilation anesthesia with 3.5% isoflurane (RWD Life Science Co., Ltd, Shenzhen, China). T1 mapping was performed using the variable flip angle (VFA) T1 mapping technique, flip angle 1 is 3°, and flip angle 2 is 17°. The parameters were as follows: Three orthogonal directions: time of repeat (TR), 5.48 ms; time of echo (TE), 19 ms; field of view (FOV), 100 mm × 100 mm; slice thickness, 2.0 mm, 20 slices. IVIM was acquired using a free-breathing single-shot echo-planar imaging pulse sequence with eight b-values. The parameters were as follows: TR, 4,900 ms; TE, 64 ms; FOV, 136 mm × 136 mm; slice thickness, 2.5 mm; 20 slices; b = 0, 50, 100, 150, 200, 400, 800, and 1,200 mm2/s; scan time, 10 min.
T1 maps, and f, D, and D* maps, were collected for image analysis. To reduce the error caused by the small sample size, we outlined three releases of information (ROIs) at the maximum level of each slice, excluding artifacts, significant vessels, bile ducts, and liver boundaries, and the average value was used as the final measurement result. The area of ROI was controlled within 6–8 cm2. The IVIM data were postprocessed using Medical Imaging Interaction Toolkit (MITK)-Diffusion software (MITKv2023.04, German Cancer Research Center, Heidelberg, Germany). The IVIM mode is a biexponential model defined by the parameters f, D, and D*. The fitting method we use is Fit D & f (high b), then fit D*: First fit f and D (monoexponentially (1 − f)e{−bD}) and use these; second fixed parameters in a second fit of D* with the complete biexponential model; the equation is expressed as follows:
where SI0 denotes the mean signal intensity of the ROI under consideration at b = 0 mm2/s, and SI represents the signal intensity at higher b values, D* refers to the microcirculation perfusion (pseudo-diffusion) coefficient, f is the perfusion fraction, and f multiplied by D* is the perfusion coefficient, D—also called the slow diffusion coefficient—which is non-perfusion-related but molecular diffusion-related diffusivity, represents the actual molecular diffusion (36). This equation was established as an IVIM-DWI exponential model. The T1 mapping data were postprocessed using Syngovia software on an Advantage Workstation (Version VB20A, Siemens Medical Solutions Erlangen, Germany). The mean values of T1 relaxation time, D, D*, and f for each ROI were generated.
After MR scanning, the rats were euthanized immediately, and then the liver tissues were harvested. Liver specimens were fixed in formalin, embedded in paraffin, and sectioned. Some sections were stained with hematoxylin–eosin (HE) for morphological analysis of liver parenchyma, and some sections were stained with Masson staining and immunohistochemical staining for α-smooth muscle actin (α-SMA) to assess the extent of liver fibrosis. The remaining fixed liver tissues were subjected to immunohistochemical staining for the endogenous hypoxia marker, hypoxia-inducible factor-1α (HIF-1α), and the exogenous hypoxia marker, pimonidazole. The histopathologic results were determined by two pathologists with more than 10 years of experience in liver pathology. The degree of liver fibrosis was evaluated using the meta-analysis of histological data in viral hepatitis (METAVIR) scoring system and was divided into five stages from F0 to F4. The area of Masson positive areas was measured using image analysis software (Image J, version 1.52a, National Institute of Health, Bethesda, Maryland 20892 USA).
Paraffin sections were taken as antigen, closed with 5% BSA, and then incubated with primary antibody a-SMA (Rabbit, 14395-1-AP, Proteintech, USA) overnight. Sections were incubated with secondary antibody at 37°C for 20 min, stained with DAB, counterstained with hematoxylin, and observed under a light microscope, and the integrated optical density (IOD) was measured by Image-Pro Plus software to determine the expression abundance. After antigen repair, the sections were incubated with anti-HIF-1α antibody (HIF1-α, PB9253, Boster, Wuhan, China) at 4°C overnight. Sections were then incubated with secondary antibody (1:200 dilution) for 2 h at RT and re-stained for 30 s. The area of HIF-1α-positive regions was analyzed semi-quantitatively using ImageJ open-source software (Image J, version 1.52a, National Institute of Health, Bethesda, Maryland 20892 USA). Sections were incubated with primary antibody pimonidazole (Hypoxyprobe, Inc., Burlington, MA, USA) for 30 min. Pimonidazole staining was visualized with 3,3-diaminobenzidine (DAB), and sections were restained with hematoxylin and scored semi-quantitatively with H-score. The H-score—including the percent of positive pimonidazole cells and coloring strength—for all the rectangular ROIs was automatically evaluated by software using (3DHISTECH Ltd., Budapest, Hungary) (37).
Where pi denotes the positive signal pixel area/number of cells as a percentage and i represents the intensity of coloring (38). The H-score measures how much of a specific biomarker is present in an immunohistochemistry (IHC) image. It ranges from 0 to 300, with higher values indicating a more severe hypoxia (39).
All statistical analyses were performed using the Statistical Package for the Social Sciences (SPSS) version 25.0 (IBM). The Kolmogorov–Smirnov test was utilized to evaluate the normality of the data. The IVIM parameters (D, f, and D*) and T1 mapping demonstrated a normal distribution. A one-way ANOVA was utilized to do multiple comparisons of IVIM parameters and T1 mapping. Multiple two-by-two comparisons were conducted employing Bonferroni correction. Spearman’s correlation coefficient was used to assess the correlation between different imaging parameters (D, D*, f, and T1 relaxation time) and the H-score, and the correlation between different imaging parameters and the HIF-1α semiquantitative score. Simple linear regression analyses were performed to illustrate the correlation between imaging parameters and H-score, imaging parameters, and HIF-1α semiquantitative score. The differences between the control group and the hypoxia group were assessed. An Independent sample t-test was used for continuous variables. The p < 0.05 were considered statistically significant. Receiver operating characteristic (ROC) curve analysis was performed, and sensitivity and specificity were calculated. The areas under the ROC curve (AUCs) were compared to evaluate the diagnostic performance of IVIM and T1 mapping.
In total, 17 rats underwent histopathological examination. According to HE staining, there were nine rats with no fibrosis, one rat with fibrosis stage F1, two rats with F2, one rat with F3, and four rats with F4. We sent 17 paraffin blocks for HIF-1α and α-SMA immunohistochemical staining, and 1 paraffin block from the experimental group was missing during the experiment. To maintain the integrity of the dataset, we used the mean HIF-1α values and α-SMA values of the remaining seven rats in the experimental group to represent the missing values. The integrated optical density (IOD) of α-SMA in the hypoxia group was higher than that in the control group (45130.692 ± 22212.153 vs. 742.720 ± 375.388, p < 0.001). The percentage area of positive Masson immunohistochemical staining was statistically significantly different between the control and hypoxia groups (9.142 ± 3.542 vs. 0.253 ± 0.068, p < 0.001) (Table 1). These rats were divided into three groups based on histopathological findings, including the group with no fibrosis (F0, n = 9), the group with progressive fibrosis (F1–F3, n = 4), and the group with severe fibrosis or cirrhosis (F4, n = 4). A one-way ANOVA was used to test whether there was a dose–response relationship between the severity of liver injury and imaging findings. The results showed a statistically significant trend of increasing D* and T1 mapping values with increasing fibrosis stage (Table 2). Table 3 shows that D* values were statistically different in the progressive liver fibrosis and no liver fibrosis groups, and T1 mapping was statistically different in the no liver fibrosis and liver cirrhosis groups.
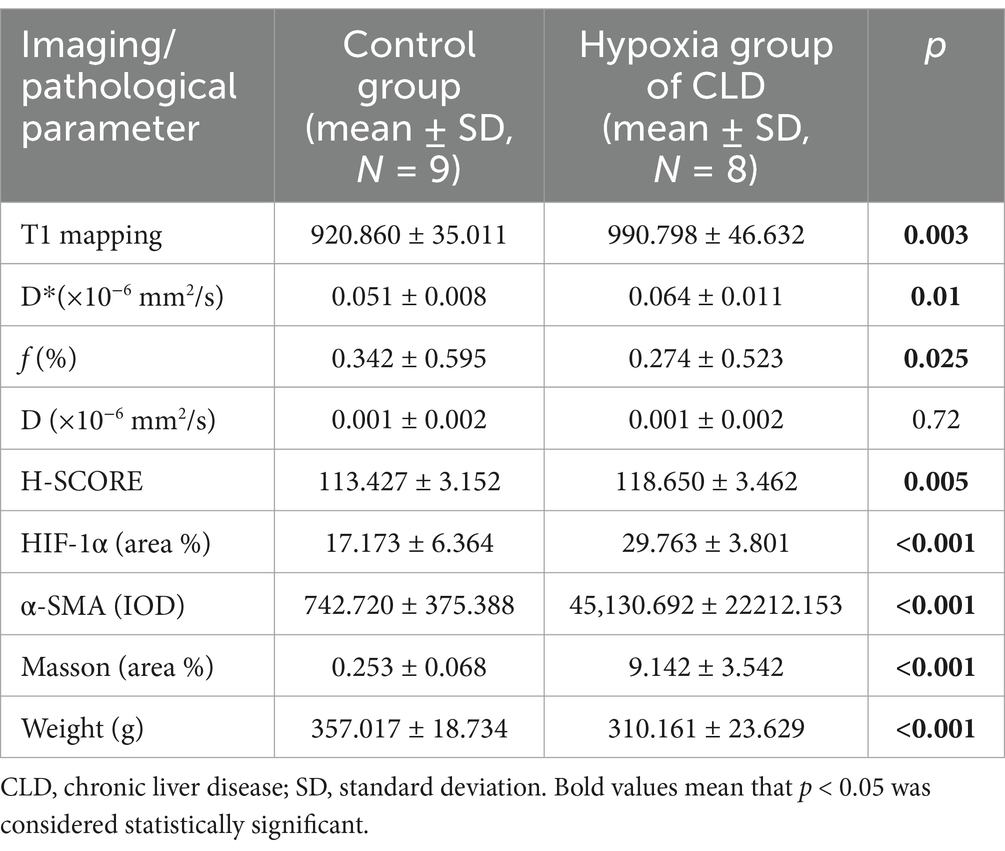
Table 1. Mean parameter values for pathological and imaging features.
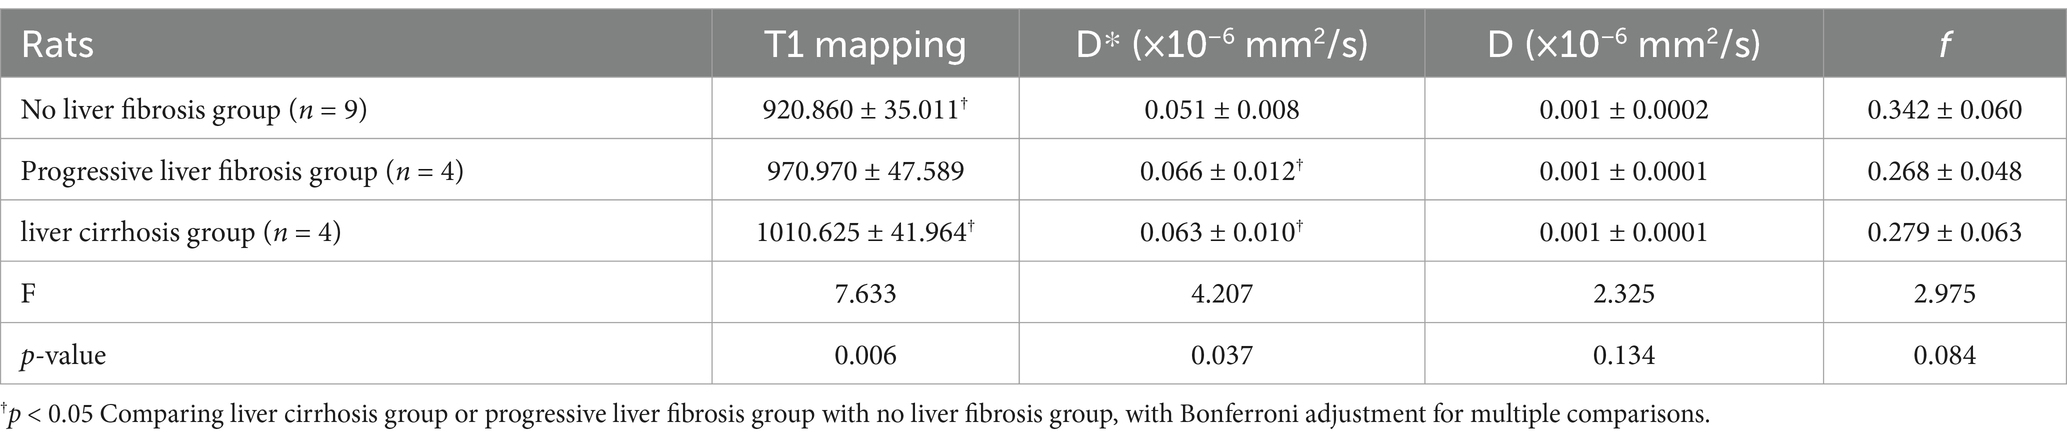
Table 2. Pure molecular diffusion (D), perfusion fraction (f), microcirculation perfusion coefficient (D*), and T1 mapping values in different stages of fibrotic livers.

Table 3. The p-value with Bonferroni adjustment for comparison of pure molecular diffusion (D), perfusion fraction (f), microcirculation perfusion coefficient (D*), and T1 mapping values in different stages of fibrotic livers.
The H-score in the hypoxia group was higher than that in the control group (118.650 ± 3.462 vs. 113.427 ± 3.152, p = 0.005). The HIF-1α semiquantitative score (area%) in the hypoxia group was higher than that in the control group (29.763 ± 3.801 vs. 17.173 ± 6.364, p < 0.001) (Table 1). The examples of histological and immunohistochemical images of the control and hypoxia groups are shown in Figure 1. The average weight in the hypoxia group of CLD was lower than that in the control group (310.161 ± 23.629 vs. 357.017 ± 18.734, p < 0.001). With the progression of liver fibrosis, the average body weight of the rats gradually decreased; the weight in the liver cirrhosis group was lower than the progressive liver fibrosis group (330.01 ± 24.271 vs. 293.180 ± 4.880, p = 0.025).
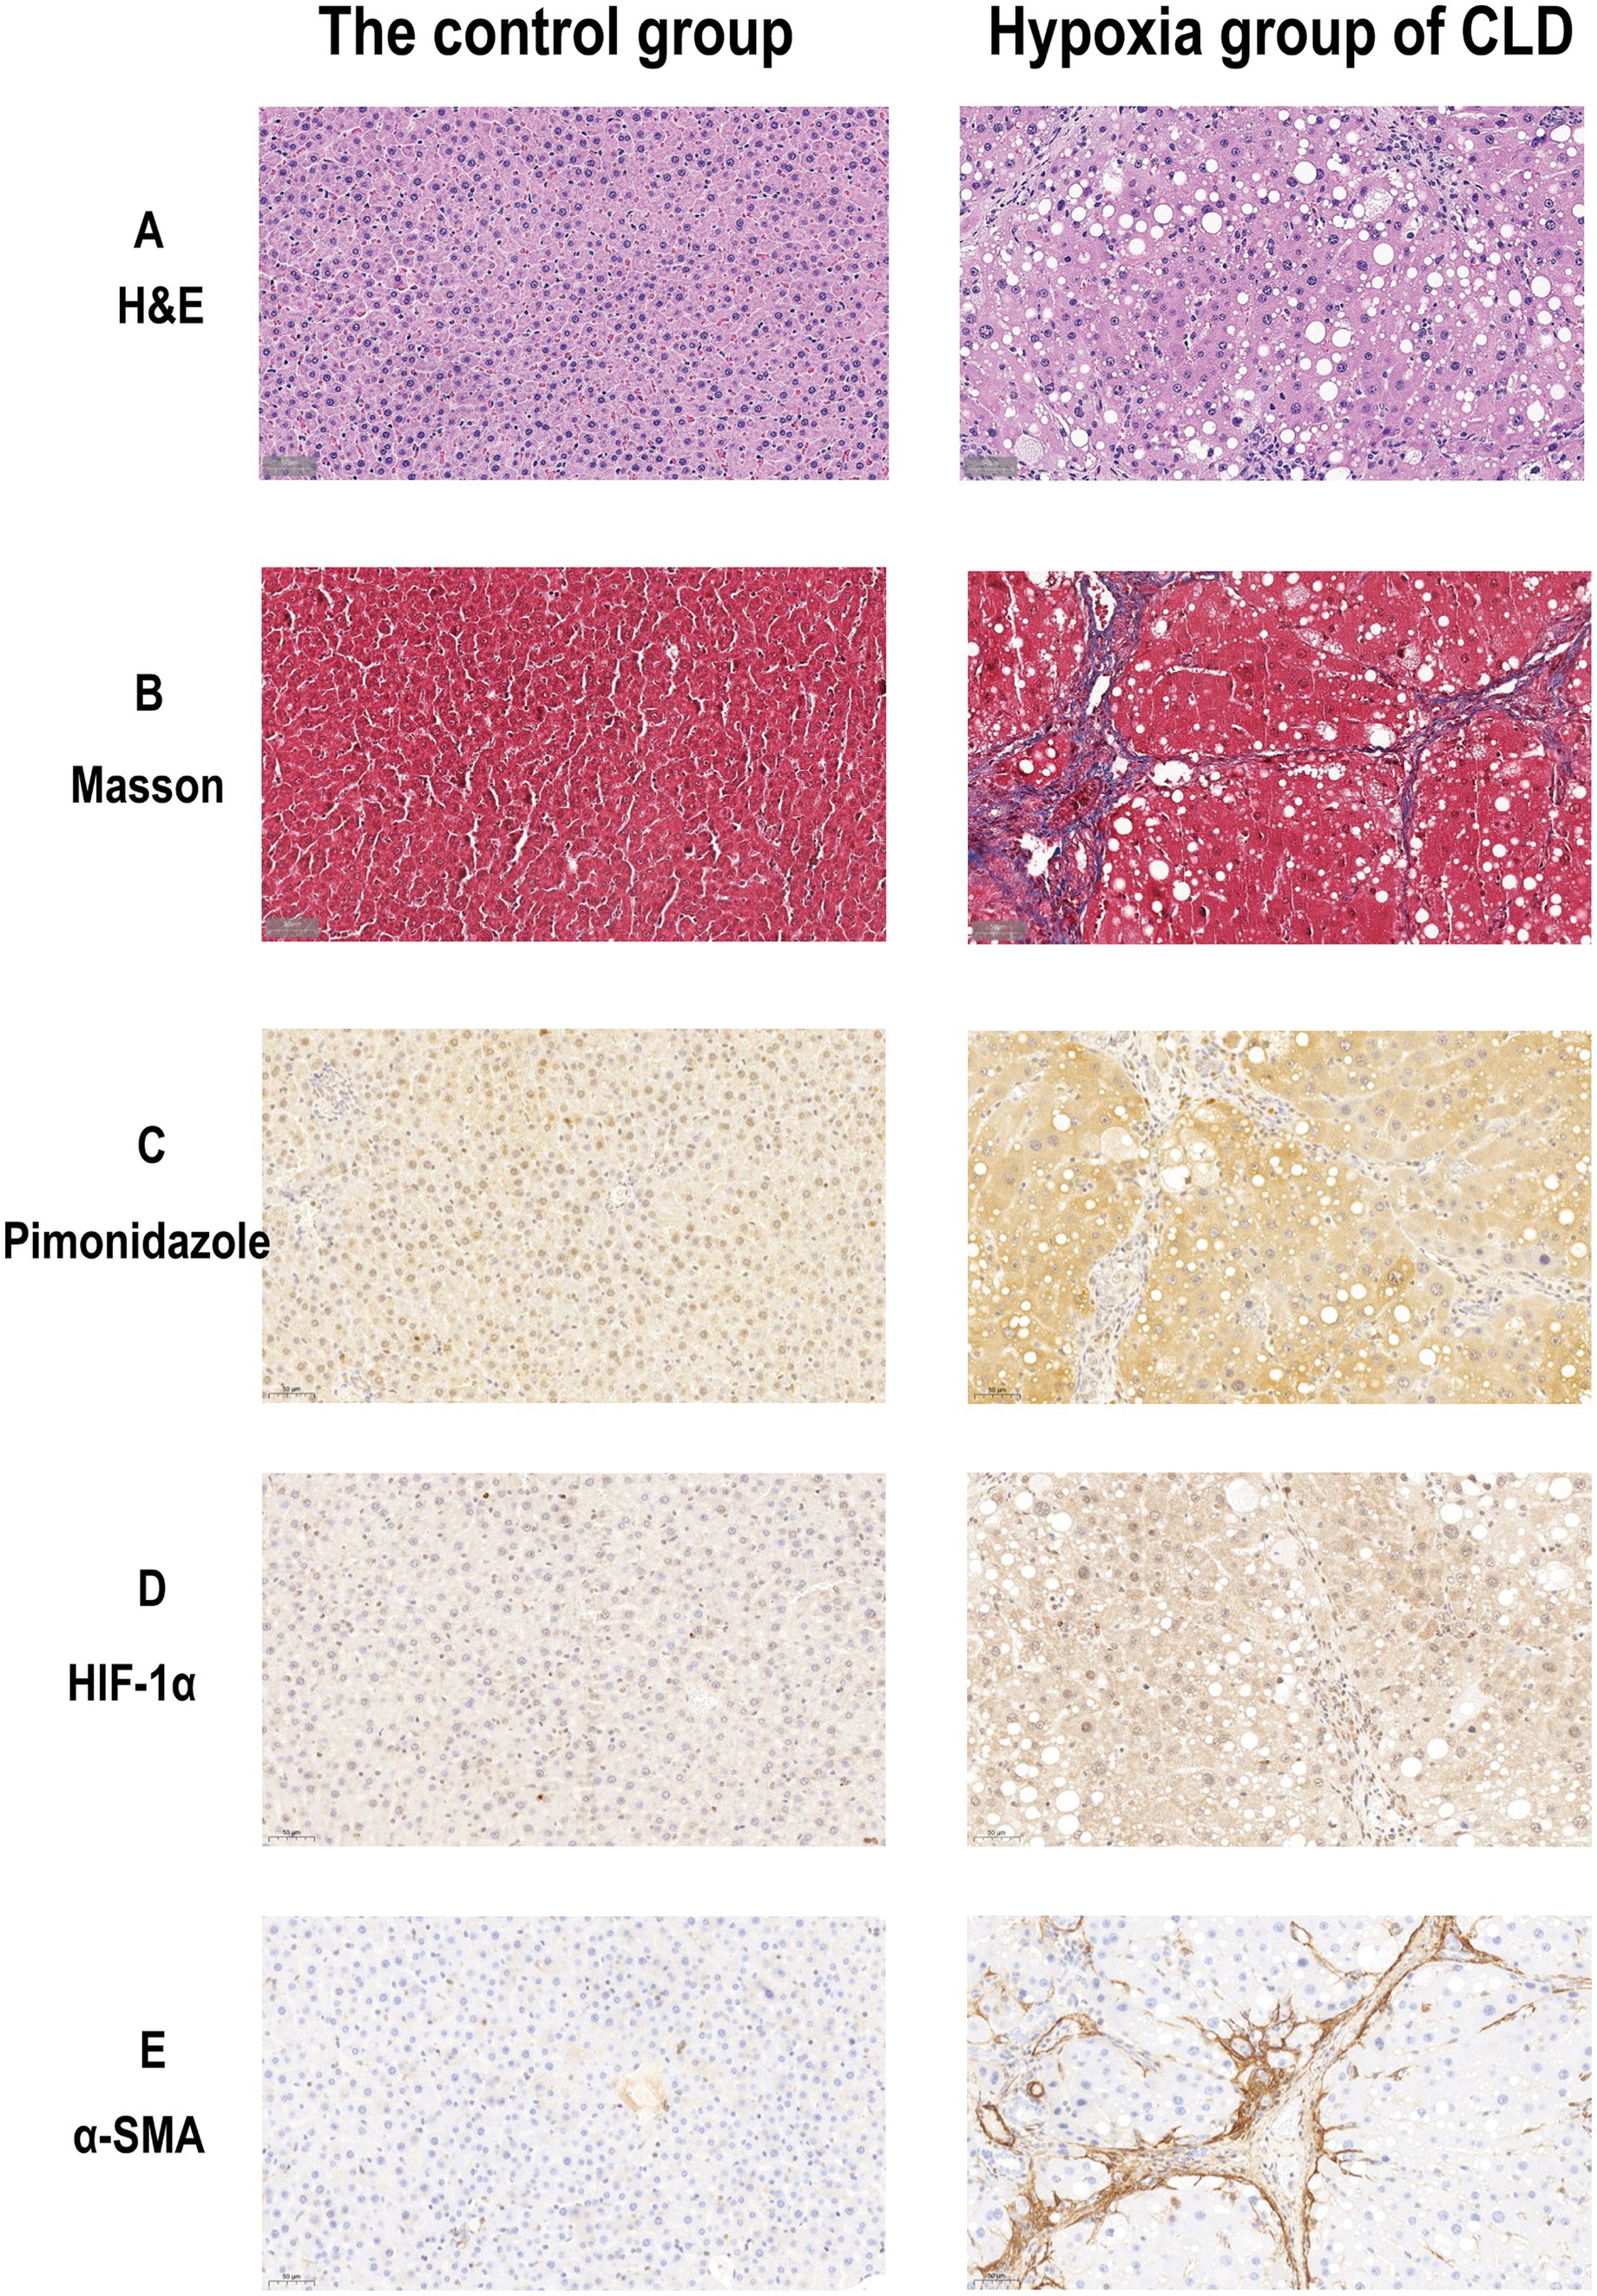
Figure 1. Histological and immunohistochemical images of the rat livers of the control group and hypoxia group of CLD. (A) H&E staining images (× 40) of the control and hypoxia group of CLD. (B) Masson staining images (× 40) of the control group and hypoxia group of CLD. (C) Pimonidazole Immunohistochemical staining images (× 40) of control and hypoxia group of CLD. (D) HIF-1α Immunohistochemical staining images (× 40) of control and hypoxia group of CLD. (E) α-SMA Immunohistochemical staining images (× 40) of control and hypoxia group of CLD.
The f value of the hypoxia group was lower than those of the control group (0.274 ± 0.523 vs. 0.342 ± 0.595, p = 0.025). The D* and T1 relaxation time of the hypoxia group were higher than those of the control group (0.064 ± 0.011 vs. 0.051 ± 0.008, p = 0.01; 990.798 ± 46.632 vs. 920.860 ± 35.011, p = 0.003). There was no significant difference in D values between the hypoxia group and the control group (Table 1). The examples of MR images of the control group and hypoxia group are shown in Figure 2.
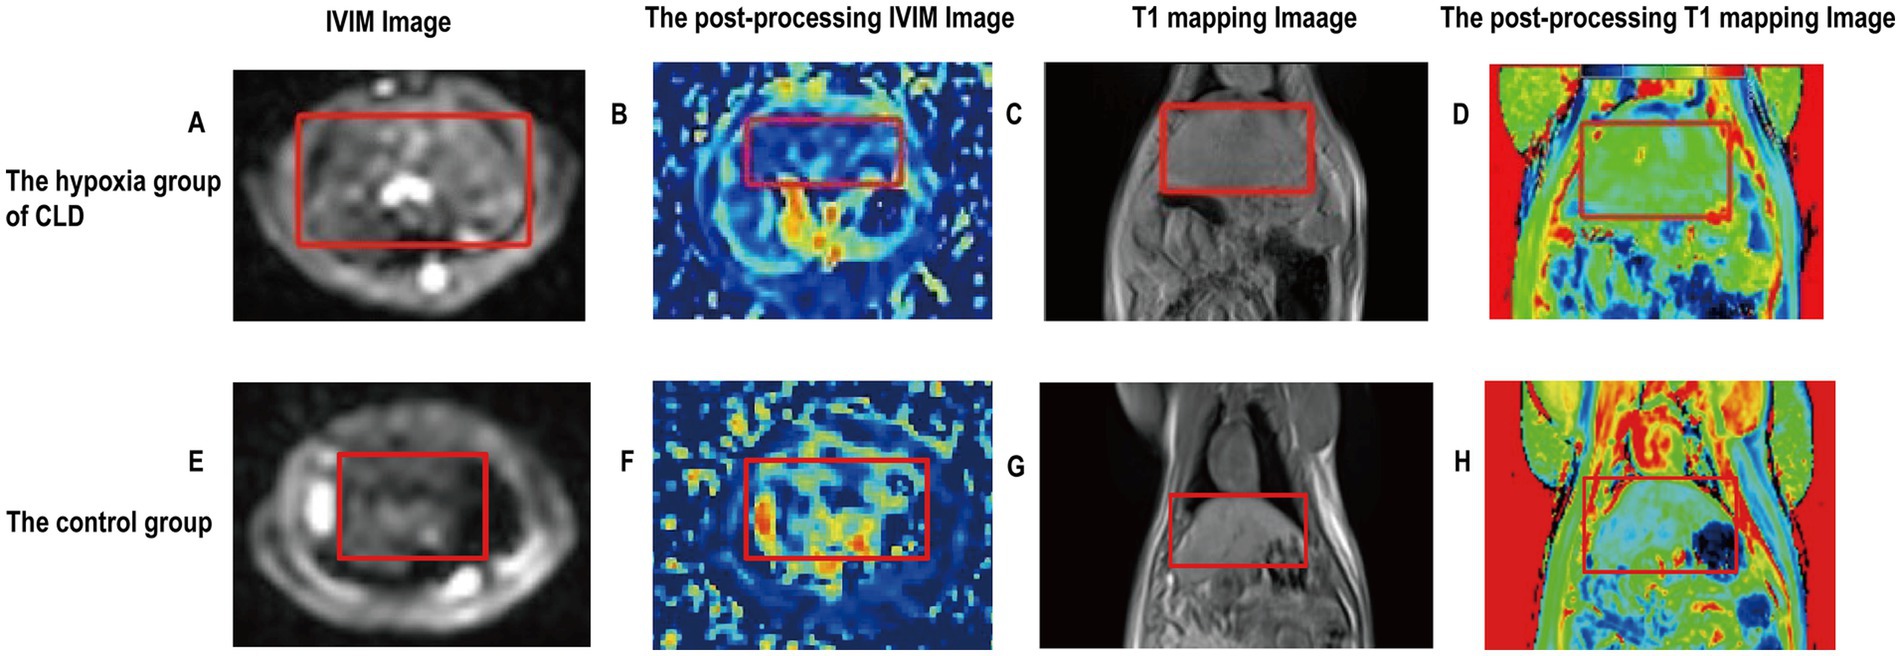
Figure 2. Imaging images of the rat livers of the control group and hypoxia group of CLD. (A) Rat liver fibrosis was observed in an IVIM image. (B) The postprocessing IVIM of liver fibrosis; D* value is 0.055. (C) Rat liver fibrosis was observed in a T1WI image. (D) The postprocessing T1 mapping of liver fibrosis; T1 mapping value is 992.191. (E) Rat liver was observed in an IVIM image. (F) The postprocessing IVIM of the liver; D* value is 0.042. (G) The rat liver was observed in a T1WI image. (H) The postprocessing T1 mapping of the liver; T1 mapping value is 880.460. Rat livers are shown in red labeled boxes.
A Spearman correlation analysis revealed no correlation between D and the H-score (r = 0.15, p = 0.573), f and the H-score (r = −0.206, p = 0.330). The H-score had a moderate correlation with D* (r = 0.508, p = 0.037) and a weak correlation with T1 mapping (r = 0.489, p = 0.046) (Figure 3). A Spearman correlation analysis revealed no correlation between D and the HIF-1α (r = 0.066, p = 0.801), f and the HIF-1α (r = −0.240, p = 0.353). The HIF-1α had a moderate correlation with D* (r = 0.556, p = 0.020); and a moderate correlation with T1 mapping (r = 0.505, p = 0.039) (Figure 4). The hypoxia group and the control group were differentiated with the cut-off value D* = 0.059, and the sensitivity, specificity, and 95% CI of D* as 75%; 88.9%; and 0.71, 1, respectively. The cut-off value of T1 mapping was 941.527, and the sensitivity, specificity, and 95% CI were 87.5%; 77.8%; and 0.734, 1, respectively. The AUCs of D* and T1 mapping for differentiating the hypoxia group and control group were 0.875 and 0.889 (Figure 5).
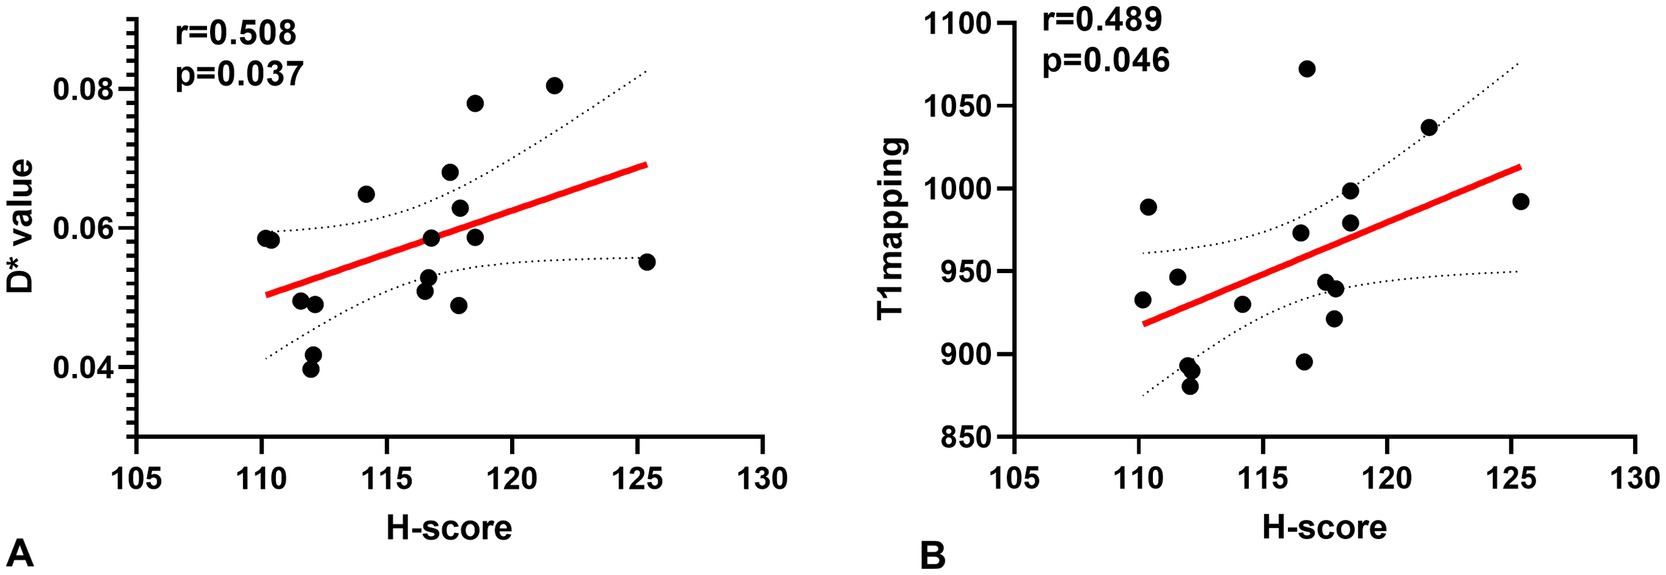
Figure 3. Correlations for the hypoxia score (H-score) with the pseudo diffusion coefficient (D*) and the T1 mapping. (A) H-score correlated positively with the D* (r = 0.508, p = 0.037). (B) H-score correlated positively with T1 mapping (r = 0.489, p = 0.046).
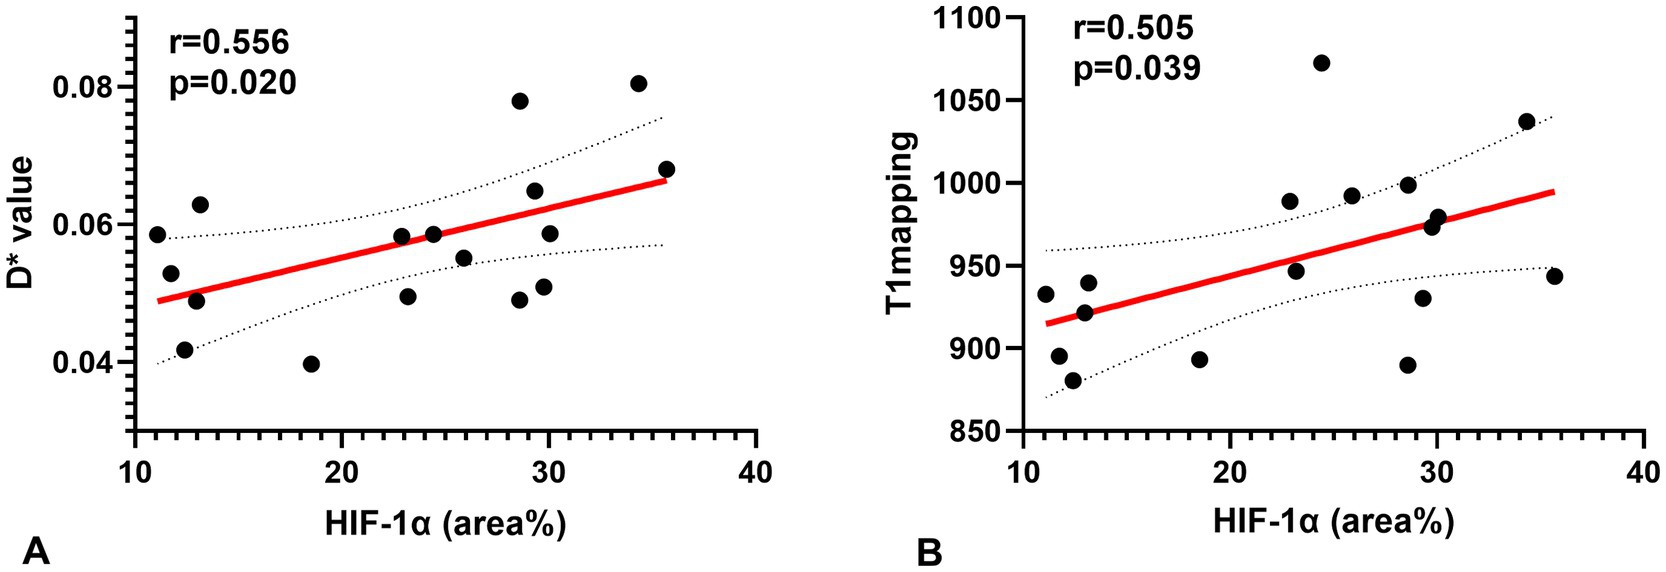
Figure 4. Correlations for the hypoxia score (HIF-1α) with the pseudo-diffusion coefficient (D*) and the T1 mapping. (A) HIF-1α correlated positively with the D* (r = 0.556, p = 0.020). (B) HIF-1α correlated positively with T1 mapping (r = 0.505, p = 0.039).
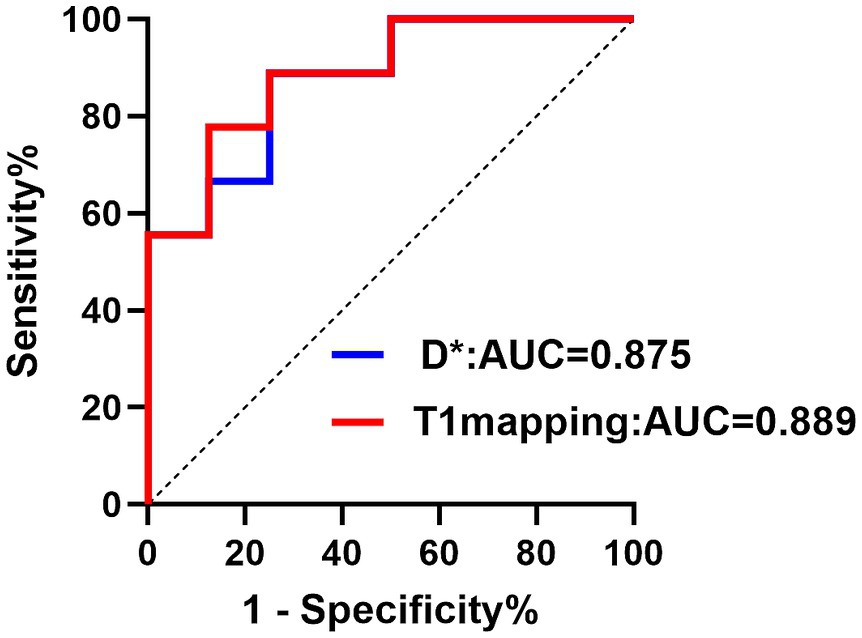
Figure 5. The ROC curve showed the performance of D* and T1 mapping in predicting hypoxia. Receiver operating characteristic (ROC) curves for D*, T1 mapping. The AUC values were 0.875 and 0.889, respectively.
Our study used IVIM and T1 mapping to detect chronic liver disease hypoxia status. The results showed that the parameters of D* and T1 mapping were significantly correlated with the H-score of pimonidazole and HIF-1α. Furthermore, D* was the most reliable parameter to evaluate hypoxia status in chronic liver disease.
CLD is a highly dynamic condition. Chronic liver injury is known to lead to the persistent activation of liver fibrogenesis, which is a critical and dynamic biological process involving numerous molecular mechanisms, mediators, and interactions/responses of different cell populations in liver fibrosis (40–42). Liver fibrosis is regarded as a potentially reversible pathophysiological event characterized by excess deposition of extracellular matrix (ECM) components (43). Hypoxia plays a vital role in this dynamic process (44), and it may also be a potential target for the treatment of chronic liver disease (45). Pathologically, hypoxia status can be detected by pimonidazole staining (46, 47). We quantitatively analyzed immunohistochemical images using QuantCenter software to calculate a density heatmap of pimonidazole, including quantitatively determining the staining intensity and the corresponding percentage of positive cells. The automatic calculation of H-scores prevents the introduction of bias from different pathologists calculating H-scores (48). We also used an additional hypoxia marker, HIF-1α, to further assess and validate hypoxia in the liver. HIF-1α is a transcription factor mediating cellular and systemic homeostatic responses to reduced oxygen supply in mammals, including angiogenesis, erythropoiesis, and glycolysis. HIF-1α directly regulates cell survival and function in the inflammatory microenvironment and plays a key role in cellular adaptation to changes in oxygen supply (49–51). The study results showed a statistically significant difference in oxygen concentration between the chronic liver disease group and the control group, whether measured by HIF-1α or pimonidazole.
Many previous studies have demonstrated that IVIM can be used to detect hypoxia in different types of tumors (27–29). For predicting hypoxia niches in glioma, the D* value showed a negative correlation with HIF-1α expression. A dysfunctional and impaired vasculature in gliomas reduces blood and oxygen supply, decreasing D* values, while HIF-1α expression increases as tumor cells grow (52). Moreover, the D* and f values of IVIM are reliable parameters for predicting the expression of HIF-1α in soft tissue sarcomas (28). The results of our study also showed that the IVIM parameters could be used to detect the hypoxic status of liver fibrosis. The positive correlation between D* and H-score, D* and HIF-1α could be attributed to the theory of D* mainly being a measure of microcirculation perfusion. The neovascularization in the liver was found to be directly proportional to the degree of hepatic fibrosis (53). Hypoxia is one of the main drivers of angiogenesis. Studies have shown that hepatocyte hypoxia and angiogenesis progress together with fiber formation after liver injury (15). Due to the increase of hepatic neovascularization during hypoxia status, there may be a corresponding increase in local blood microperfusion, resulting in increased D*. However, our study showed that D and f cannot be used as parameters to identify hypoxic status in chronic liver disease, because of technical problems, such as data instability and a low SNR, which resulted in inaccurate measurement of f and D. These factors may be the main reasons why these factors did not work well in predicting low oxygen levels in chronic liver disease (54).
The T1 mapping technique is a noninvasive quantitative method for evaluating the T1 relaxation time of liver tissues. The T1 value can quantitatively assess the content of water molecules and macromolecules in the tissues (55). Excess extracellular matrix (ECM) results in extended T1 relaxation, thus, T1 mapping can effectively evaluate liver fibrosis stages (56, 57). Our study concluded that T1 mapping can assess the hypoxic status of chronic liver disease. We found that the H-score—an indicator of hepatic hypoxia—positively correlated with T1 mapping values. The MRI longitudinal relaxation rate R1 (1/T1) is sensitive to changes in the level of molecular oxygen (O2) dissolved in plasma or interstitial tissue fluids (58–60). In hypoxic tissues, the decrease in dissolved oxygen, due to the paramagnetic properties of dissolved oxygen, leads to a reduction in the tissue’s R1 rate, which means an increase in T1 time. The detection of hypoxic zones is standard at all stages of chronic liver disease and increases progressively from early injury to the development of cirrhosis (54). The above reasons may explain why T1 values positively correlate with the degree of hypoxia.
Our study has several limitations. First, the sample size of this study was relatively small and we could not confirm whether there were differences in the level of hypoxia in the liver parenchyma of rats with different stages of chronic liver disease. We will increase the sample size and continue to improve the experiment. Second, the experimental design was inadequate, as it lacked the administration of antioxidants and the targeting of metabolic pathways involved in hypoxia. Furthermore, liver function tests and oxidative stress tests were not conducted. In subsequent research, these experiments will be incorporated. Third, the ROIs need to be selected manually to avoid necrotic areas, which inevitably introduce errors. Fourth, we will use intelligent software for automatic sketching to reduce the error. In addition, the occurrence and progression of liver fibrosis in animals is not the same as in humans, and therefore further clinical research in liver fibrosis will be required.
In conclusion, IVIM and T1 Mapping are promising methods for non-invasive detection of hypoxic status in chronic liver disease. The D* and T1 relaxation time are significantly correlated with hypoxia and, therefore, can be used for the assessment of hypoxic status in chronic liver disease. We provide a feasible method for non-invasive hypoxia imaging in chronic liver disease.
The raw data supporting the conclusions of this article will be made available by the authors, without undue reservation.
The animal study was approved by the Institutional Animal Care and Welfare Committee of The Affiliated Hospital of Qingdao University. The study was conducted in accordance with the local legislation and institutional requirements.
WD: Data curation, Formal analysis, Investigation, Methodology, Software, Supervision, Writing – original draft, Writing – review & editing. LX: Conceptualization, Investigation, Methodology, Software, Writing – review & editing, Formal analysis, Supervision. ZiL: Methodology, Writing – review & editing, Supervision. HY: Methodology, Software, Writing – review & editing. LW: Writing – review & editing, Formal analysis. YG: Supervision, Writing – review & editing. ZhL: Conceptualization, Funding acquisition, Investigation, Methodology, Supervision, Visualization, Writing – review & editing.
The author(s) declare that financial support was received for the research, authorship, and/or publication of this article. This study has received funding from the Natural Science Foundation of Shandong Province (Project no. ZR2024MH140).
The authors declare that the research was conducted in the absence of any commercial or financial relationships that could be construed as a potential conflict of interest.
All claims expressed in this article are solely those of the authors and do not necessarily represent those of their affiliated organizations, or those of the publisher, the editors and the reviewers. Any product that may be evaluated in this article, or claim that may be made by its manufacturer, is not guaranteed or endorsed by the publisher.
ECM, extracellular matrix; FOV, field of view; IVIM, intravoxel incoherent motion; CCL4, carbon tetrachloride; VFA, variable flip angle; TE, time of echo; TR, time of repeat; HCC, hepatocellular carcinoma; NAFLD, non-alcoholic fatty liver disease; AUC, area under the curves; ROC, receiver operating characteristic; CLD, chronic liver disease
1. Paik, JM, Golabi, P, Younossi, Y, Mishra, A, and Younossi, ZM (2020). Changes in the global burden of chronic liver diseases from 2012 to 2017: the growing impact of NAFLD. Hepatology 72:1605–16. doi: 10.1002/hep.31173
2. Sepanlou, SG, Safiri, S, Bisignano, C, Ikuta, KS, Merat, S, Saberifiroozi, M, et al. (2020). The global, regional, and national burden of cirrhosis by cause in 195 countries and territories, 1990–2017: a systematic analysis for the global burden of disease study 2017. Lancet Gastroenterol Hepatol 5:245–66. doi: 10.1016/s2468-1253(19)30349-8
3. Parola, M, and Pinzani, M (2019). Liver fibrosis: pathophysiology, pathogenetic targets and clinical issues. Mol Asp Med 65:37–55. doi: 10.1016/j.mam.2018.09.002
4. Hammerich, L, and Tacke, F (2023). Hepatic inflammatory responses in liver fibrosis. Nat Rev Gastroenterol Hepatol 20:633–46. doi: 10.1038/s41575-023-00807-x
5. Foglia, B, Novo, E, Protopapa, F, Maggiora, M, Bocca, C, Cannito, S, et al. (2021). Hypoxia, hypoxia-inducible factors and liver fibrosis. Cells 10:1764. doi: 10.3390/cells10071764
6. Eslam, M, Sanyal, AJ, George, J, Sanyal, A, Neuschwander-Tetri, B, Tiribelli, C, et al. (2020). MAFLD: a consensus-driven proposed nomenclature for metabolic associated fatty liver disease. Gastroenterology 158:1999–2014. doi: 10.1053/j.gastro.2019.11.312
7. Seki, E, and Schwabe, RF (2015). Hepatic inflammation and fibrosis: functional links and key pathways. Hepatology 61:1066–79. doi: 10.1002/hep.27332
8. Colombo, M., Berr, F., Bruix, J., Hauss, J., Wands, J., and Wittekind, C., (2003). Malignant liver tumors: Basic concepts and clinical management. Risk groups and preventative strategies. Kluwer Academic Publishers BV and Falk Foundation, Dordrecht, pp.67–74.
9. Affo, S, Yu, LX, and Schwabe, RF (2017). The role of cancer-associated fibroblasts and fibrosis in liver cancer. Ann Rev Pathol Mech Dis 12:153–86. doi: 10.1146/annurev-pathol-052016-100322
10. Gnocchi, D, Custodero, C, Sabbà, C, and Mazzocca, A (2019). Circadian rhythms: a possible new player in non-alcoholic fatty liver disease pathophysiology. J Mol Med 97:741–59. doi: 10.1007/s00109-019-01780-2
11. Jokl, E, Llewellyn, J, Simpson, K, Adegboye, O, Pritchett, J, Zeef, L, et al. (2023). Circadian disruption primes myofibroblasts for accelerated activation as a mechanism underpinning fibrotic progression in non-alcoholic fatty liver disease. Cells 12:1582. doi: 10.3390/cells12121582
12. Gnocchi, D, and Bruscalupi, G (2017). Circadian rhythms and hormonal homeostasis: pathophysiological implications. Biology 6:10. doi: 10.3390/biology6010010
13. Friedman, SL, and Pinzani, M (2022). Hepatic fibrosis 2022: unmet needs and a blueprint for the future. Hepatology 75:473–88. doi: 10.1002/hep.32285
14. Cai, J, Hu, M, Chen, Z, and Ling, Z (2021). The roles and mechanisms of hypoxia in liver fibrosis. J Transl Med 19:186. doi: 10.1186/s12967-021-02854-x
15. Bocca, C, Novo, E, Miglietta, A, and Parola, M (2015). Angiogenesis and fibrogenesis in chronic liver diseases. Cell Mol Gastroenterol Hepatol 1:477–88. doi: 10.1016/j.jcmgh.2015.06.011
16. Mesarwi, OA, Moya, EA, Zhen, X, Gautane, M, Zhao, H, Wegbrans Giró, P, et al. (2021). Hepatocyte HIF-1 and intermittent hypoxia independently impact liver fibrosis in murine nonalcoholic fatty liver disease. Am J Respir Cell Mol Biol 65:390–402. doi: 10.1165/rcmb.2020-0492OC
17. Natarajan, V, Harris, EN, and Kidambi, S (2017). SECs (sinusoidal endothelial cells), liver microenvironment, and fibrosis. Biomed Res Int 2017:1–9. doi: 10.1155/2017/4097205
18. Onori, P, Morini, S, Franchitto, A, Sferra, R, Alvaro, D, and Gaudio, E (2000). Hepatic microvascular features in experimental cirrhosis: a structural and morphometrical study in CCl4-treated rats. J Hepatol 33:555–63. doi: 10.1016/S0168-8278(00)80007-0
19. Li, Z, Sun, J, Chen, L, Huang, N, Hu, P, Hu, X, et al. (2016). Assessment of liver fibrosis using pharmacokinetic parameters of dynamic contrast-enhanced magnetic resonance imaging. J Magn Reson Imaging 44:98–104. doi: 10.1002/jmri.25132
20. Strickland, J, Garrison, D, and Copple, BL (2020). Hypoxia upregulates Cxcl12 in hepatocytes by a complex mechanism involving hypoxia-inducible factors and transforming growth factor-β. Cytokine 127:154986. doi: 10.1016/j.cyto.2020.154986
21. Roth, KJ, and Copple, BL (2015). Role of hypoxia-inducible factors in the development of liver fibrosis. Cell Mol Gastroenterol Hepatol 1:589–97. doi: 10.1016/j.jcmgh.2015.09.005
22. Ju, C, Colgan, SP, and Eltzschig, HK (2016). Hypoxia-inducible factors as molecular targets for liver diseases. J Mol Med 94:613–27. doi: 10.1007/s00109-016-1408-1
23. Ning, L, Zou, Y, Li, S, Cao, Y, Xu, B, Zhang, S, et al. (2023). Anti-PCSK9 treatment attenuates liver fibrosis via inhibiting hypoxia-induced autophagy in hepatocytes. Inflammation 46:2102–19. doi: 10.1007/s10753-023-01865-8
24. Zhao, T, Gong, B, Luo, S, Zhang, R, Zhang, L, Huang, Y, et al. (2023). A fibroblastic foci-targeting and hypoxia-cleavable delivery system of pirfenidone for the treatment of idiopathic pulmonary fibrosis. Acta Biomater 167:574–82. doi: 10.1016/j.actbio.2023.06.024
25. Li, YT, Cercueil, JP, Yuan, J, Chen, W, Loffroy, R, and Wáng, YXJ (2017). Liver intravoxel incoherent motion (IVIM) magnetic resonance imaging: a comprehensive review of published data on normal values and applications for fibrosis and tumor evaluation. Quant Imaging Med Surg 7:59–78. doi: 10.21037/qims.2017.02.03
26. Le Bihan, D (2019). What can we see with IVIM MRI? NeuroImage 187:56–67. doi: 10.1016/j.neuroimage.2017.12.062
27. Yin, Z, Li, X, Zhang, Y, Tao, J, Yang, Y, Fang, S, et al. (2022). Correlations between DWI, IVIM, and HIF-1α expression based on MRI and pathology in a murine model of rhabdomyosarcoma. Magn Reson Med 88:871–9. doi: 10.1002/mrm.29250
28. Li, X, Yang, L, Wang, Q, Tao, J, Pan, Z, and Wang, S (2021). Soft tissue sarcomas: IVIM and DKI correlate with the expression of HIF-1α on direct comparison of MRI and pathological slices. Eur Radiol 31:4669–79. doi: 10.1007/s00330-020-07526-w
29. Hompland, T, Hole, KH, Ragnum, HB, Aarnes, EK, Vlatkovic, L, Lie, AK, et al. (2018). Combined MR imaging of oxygen consumption and supply reveals tumor hypoxia and aggressiveness in prostate cancer patients. Cancer Res 78:4774–85.
30. Vaupel, P, Kallinowski, F, and Okunieff, P (1989). Blood flow, oxygen and nutrient supply, and metabolic microenvironment of human tumors: a review. Cancer Res 49:6449–65.
31. Ranasinghe, WK, Baldwin, GS, Shulkes, A, Bolton, D, and Patel, O (2014). Normoxic regulation of HIF-1α in prostate cancer. Nat Rev Urol 11:419–9. doi: 10.1038/nrurol.2013.110-c2
32. Cheng, W, Cheng, Z, Yang, Z, Xing, D, and Zhang, M (2019). Upregulation of hypoxia-inducible factor 1α mRNA expression was associated with poor prognosis in patients with hepatocellular carcinoma. Onco Targets Ther 12:6285–96. doi: 10.2147/OTT.S197077
33. Potharaju, M, Mathavan, A, Mangaleswaran, B, Patil, S, John, R, Ghosh, S, et al. (2019). Clinicopathological analysis of HIF-1alpha and TERT on survival outcome in glioblastoma patients: a prospective, single institution study. J Cancer 10:2397–406. doi: 10.7150/jca.32909
34. Iima, M (2021). Perfusion-driven intravoxel incoherent motion (IVIM) MRI in oncology: applications, challenges, and future trends. Magn Reson Med Sci 20:125–38. doi: 10.2463/mrms.rev.2019-0124
35. Taylor, AJ, Salerno, M, Dharmakumar, R, and Jerosch-Herold, M (2016). T1 mapping: basic techniques and clinical applications. JACC Cardiovasc Imaging 9:67–81. doi: 10.1016/j.jcmg.2015.11.005
36. Wang, Q, Liu, H, Zhu, Z, Sheng, Y, Du, Y, Li, Y, et al. (2021). Feasibility of T1 mapping with histogram analysis for the diagnosis and staging of liver fibrosis: preclinical results. Magn Reson Imaging 76:79–86. doi: 10.1016/j.mri.2020.11.006
37. Le Bihan, D, Breton, E, Lallemand, D, Aubin, ML, Vignaud, J, and Laval-Jeantet, M (1988). Separation of diffusion and perfusion in intravoxel incoherent motion MR imaging. Radiology 168:497–505. doi: 10.1148/radiology.168.2.3393671
38. Xu, J, Yang, X, Deng, Q, Yang, C, Wang, D, Jiang, G, et al. (2021). TEM8 marks neovasculogenic tumor-initiating cells in triple-negative breast cancer. Nat Commun 12:4413. doi: 10.1038/s41467-021-24703-7
39. Ram, S, Vizcarra, P, Whalen, P, Deng, S, Painter, CL, Jackson-Fisher, A, et al. (2021). Pixelwise H-score: a novel digital image analysis-based metric to quantify membrane biomarker expression from immunohistochemistry images. PLoS One 16:e0245638. doi: 10.1371/journal.pone.0245638
40. Parola, M, Marra, F, and Pinzani, M (2008). Myofibroblast–like cells and liver fibrogenesis: emerging concepts in a rapidly moving scenario. Mol Asp Med 29:58–66. doi: 10.1016/j.mam.2007.09.002
41. Pellicoro, A, Ramachandran, P, Iredale, JP, and Fallowfield, JA (2014). Liver fibrosis and repair: immune regulation of wound healing in a solid organ. Nat Rev Immunol 14:181–94. doi: 10.1038/nri3623
42. Novo, E, Cannito, S, Paternostro, C, Bocca, C, Miglietta, A, and Parola, M (2014). Cellular and molecular mechanisms in liver fibrogenesis. Arch Biochem Biophys 548:20–37. doi: 10.1016/j.abb.2014.02.015
43. Aeffner, F, Wilson, K, Martin, NT, Black, JC, Hendriks, CLL, Bolon, B, et al. (2017). The gold standard paradox in digital image analysis: manual versus automated scoring as ground truth. Arch Pathol Lab Med 141:1267–75. doi: 10.5858/arpa.2016-0386-RA
44. Paternostro, C, David, E, Novo, E, and Parola, M (2010). Hypoxia, angiogenesis and liver fibrogenesis in the progression of chronic liver diseases. World J Gastroenterol: WJG 16:281–8. doi: 10.3748/wjg.v16.i3.281
45. Wu, W, Li, W, Wei, J, Wang, C, Yao, Y, Zhu, W, et al. (2019). Chronic intermittent hypoxia accelerates liver fibrosis in rats with combined hypoxia and nonalcoholic steatohepatitis via angiogenesis rather than endoplasmic reticulum stress. Acta Biochim Biophys Sin 51:159–67. doi: 10.1093/abbs/gmy169
46. Masaki, Y, Shimizu, Y, Yoshioka, T, Feng, F, Zhao, S, Higashino, K, et al. (2016). Imaging mass spectrometry revealed the accumulation characteristics of the 2-nitroimidazole-based agent “pimonidazole” in hypoxia. PLoS One 11:e0161639. doi: 10.1371/journal.pone.0161639
47. Arteel, GE, Thurman, RG, Yates, JM, and Raleigh, JA (1995). Evidence that hypoxia markers detect oxygen gradients in liver: pimonidazole and retrograde perfusion of rat liver. Br J Cancer 72:889–95. doi: 10.1038/bjc.1995.429
48. Jagomast, T, Idel, C, Klapper, L, Kuppler, P, Proppe, L, Beume, S, et al. Comparison of manual and automated digital image analysis systems for quantification of cellular protein expression. Murcia: Universidad de Murcia (2022).
49. Nath, B, and Szabo, G (2012). Hypoxia and hypoxia inducible factors: diverse roles in liver diseases. Hepatology 55:622–33. doi: 10.1002/hep.25497
50. Suzuki, T, Shinjo, S, Arai, T, Kanai, M, and Goda, N (2014). Hypoxia and fatty liver. World J Gastroenterol: WJG 20:15087–97. doi: 10.3748/wjg.v20.i41.15087
51. Sun, K, Tordjman, J, Clément, K, and Scherer, PE (2013). Fibrosis and adipose tissue dysfunction. Cell Metab 18:470–7. doi: 10.1016/j.cmet.2013.06.016
52. Wang, D, Lu, Y, Li, X, Mei, N, Wu, PY, Geng, D, et al. (2022). Evaluation of HIF-1α expression in a rat glioma model using intravoxel incoherent motion and R2* mapping. Front Oncol 12:902612. doi: 10.3389/fonc.2022.902612
53. Patra, K, Jana, S, Sarkar, A, Mandal, DP, and Bhattacharjee, S (2019). The inhibition of hypoxia-induced angiogenesis and metastasis by cinnamaldehyde is mediated by decreasing HIF-1α protein synthesis via PI3K/Akt pathway. Biofactors 45:401–15. doi: 10.1002/biof.1499
54. Li, X, Wu, S, Li, D, Yu, T, Zhu, H, Song, Y, et al. (2019). Intravoxel incoherent motion combined with dynamic contrast-enhanced perfusion MRI of early cervical carcinoma: correlations between multimodal parameters and HIF-1α expression. J Magn Reson Imaging 50:918–29. doi: 10.1002/jmri.26604
55. Roller, FC, Harth, S, Schneider, C, and Krombach, GA (2015). T1, T2 mapping and extracellular volume fraction (ECV): application, value and further perspectives in myocardial inflammation and cardiomyopathies. Rofo 187:760–70. doi: 10.1055/s-0034-1399546
56. Luetkens, JA, Klein, S, Träber, F, Schmeel, FC, Sprinkart, AM, Kuetting, DL, et al. (2018). Quantification of liver fibrosis at T1 and T2 map** with extracellular volume fraction MRI: preclinical results. Radiology 288:748–54. doi: 10.1148/radiol.2018180051
57. Xu, X, Zhu, H, Li, R, Lin, H, Grimm, R, Fu, C, et al. (2021). Whole-liver histogram and texture analysis on T1 maps improves the risk stratification of advanced fibrosis in NAFLD. Eur Radiol 31:1748–59. doi: 10.1007/s00330-020-07235-4
58. Young, IR, Clarke, GJ, Bailes, DR, Pennock, JM, Doyle, FH, and Bydder, GM (1981). Enhancement of relaxation rate with paramagnetic contrast agents in NMR imaging. J Comput Tomogr 5:543–7. doi: 10.1016/0149-936X(81)90089-8
59. Berkowitz, BA (1997). Role of dissolved plasma oxygen in hyperoxia-induced contrast. Magn Reson Imaging 15:123–6. doi: 10.1016/S0730-725X(96)00230-5
Keywords: hypoxia, chronic liver disease, IVIM, T1 mapping, pimonidazole, HIF-1α
Citation: Dong W, Xiao L, Luo Z, Yu H, Wang L, Gao Y and Li Z (2025) Assessment of hypoxia status in a rat chronic liver disease model using IVIM and T1 mapping. Front. Med. 11:1477685. doi: 10.3389/fmed.2024.1477685
Edited by:
Davide Gnocchi, University of Bari Medical School, ItalyReviewed by:
Antonio Mazzocca, University of Bari Aldo Moro, ItalyCopyright © 2025 Dong, Xiao, Luo, Yu, Wang, Gao and Li. This is an open-access article distributed under the terms of the Creative Commons Attribution License (CC BY). The use, distribution or reproduction in other forums is permitted, provided the original author(s) and the copyright owner(s) are credited and that the original publication in this journal is cited, in accordance with accepted academic practice. No use, distribution or reproduction is permitted which does not comply with these terms.
*Correspondence: Zhiming Li, emhpbWluZ2xlZUB5ZWFoLm5ldA==
†These authors have contributed equally to this work
Disclaimer: All claims expressed in this article are solely those of the authors and do not necessarily represent those of their affiliated organizations, or those of the publisher, the editors and the reviewers. Any product that may be evaluated in this article or claim that may be made by its manufacturer is not guaranteed or endorsed by the publisher.
Research integrity at Frontiers
Learn more about the work of our research integrity team to safeguard the quality of each article we publish.