 Jikun Yang
 Bin Wu2
- 1Aier Eye Medical Center of Anhui Medical University, Anhui, China
- 2Shenyang Aier Excellence Eye Hospital, Shenyang, Liaoning, China
- 3School of automation, Shenyang Aerospace University, Shenyang, Liaoning, China
Background: Dry age-related macular degeneration (AMD) is a retinal disease, which has been the third leading cause of vision loss. But current AMD classification technologies did not focus on the classification of early stage. This study aimed to develop a deep learning architecture to improve the classification accuracy of dry AMD, through the analysis of optical coherence tomography (OCT) images.
Methods: We put forward an ensemble deep learning architecture which integrated four different convolution neural networks including ResNet50, EfficientNetB4, MobileNetV3 and Xception. All networks were pre-trained and fine-tuned. Then diverse convolution neural networks were combined. To classify OCT images, the proposed architecture was trained on the dataset from Shenyang Aier Excellence Hospital. The number of original images was 4,096 from 1,310 patients. After rotation and flipping operations, the dataset consisting of 16,384 retinal OCT images could be established.
Results: Evaluation and comparison obtained from three-fold cross-validation were used to show the advantage of the proposed architecture. Four metrics were applied to compare the performance of each base model. Moreover, different combination strategies were also compared to validate the merit of the proposed architecture. The results demonstrated that the proposed architecture could categorize various stages of AMD. Moreover, the proposed network could improve the classification performance of nascent geographic atrophy (nGA).
Conclusion: In this article, an ensemble deep learning was proposed to classify dry AMD progression stages. The performance of the proposed architecture produced promising classification results which showed its advantage to provide global diagnosis for early AMD screening. The classification performance demonstrated its potential for individualized treatment plans for patients with AMD.
1 Introduction
AMD is a retinal disease that is a major cause of blindness around the world (1). According to the World Health Organization, it was estimated that 288 million people globally suffered from intermediate or late-stage AMD (2). As the global population aged, AMD was expected to affect more people. Therefore, it was important to detect and screen AMD, especially for early stage of AMD. Based on the clinical appearance of AMD, it could be classified into early stage, intermediate stage and late stage (3). Early and intermediate AMD, also known as non-advanced dry AMD, were described by a slow progressive dysfunction of the retinal pigment epithelium (RPE) and presence of drusen. The late stage was defined by presence of geographic atrophy (GA) (4).
A recent approval released by the U.S. Food and Drug Administration highlights the importance of early detection of GA, which demonstrated that nGA was a pivotal marker for the prediction of the development of GA (5). It could help clinicians to better detect and screen AMD in the early stage. However, nGA has drusen with a diameter larger than 63 μm without atrophy or neovascular disease. This condition made it difficult to detect nGA accurately. Moreover, complex interference factors of nGA in shape, size and location exacerbated the difficulty to differentiate it from other retinal lesions (6).
In traditional retinal images, OCT images enabled visualization of thickness, structure and detail of various layers of the retina (7). In addition, when the retina developed a disease, OCT enabled the visualization of abnormal features and damaged retinal structures (8). Therefore, retinal OCT images were used in this article to detect nGA. In OCT images, spectral-domain OCT features unique in these areas included: subsidence of the outer plexiform layer (OPL) and inner nuclear layer (INL), and development of a hyporeflective wedge-shaped band within the limits of the OPL. These characteristics were defined as nGA, describing features that portended the development of drusen-associated atrophy. Cross-sectional examination of participants with bilateral intermediate AMD revealed that independent risk fact (9). The hypo-reflective wedge in nGA represented the presence of a hyporeflective wedge-shaped band within the limits of the OPL that subsequently developed as the characteristic feature of this stage. There was also typically drusen regression that was accompanied by a vortexlike subsidence of the INL and OPL at this stage. Different stages of dry AMD in OCT images were shown in Figure 1.
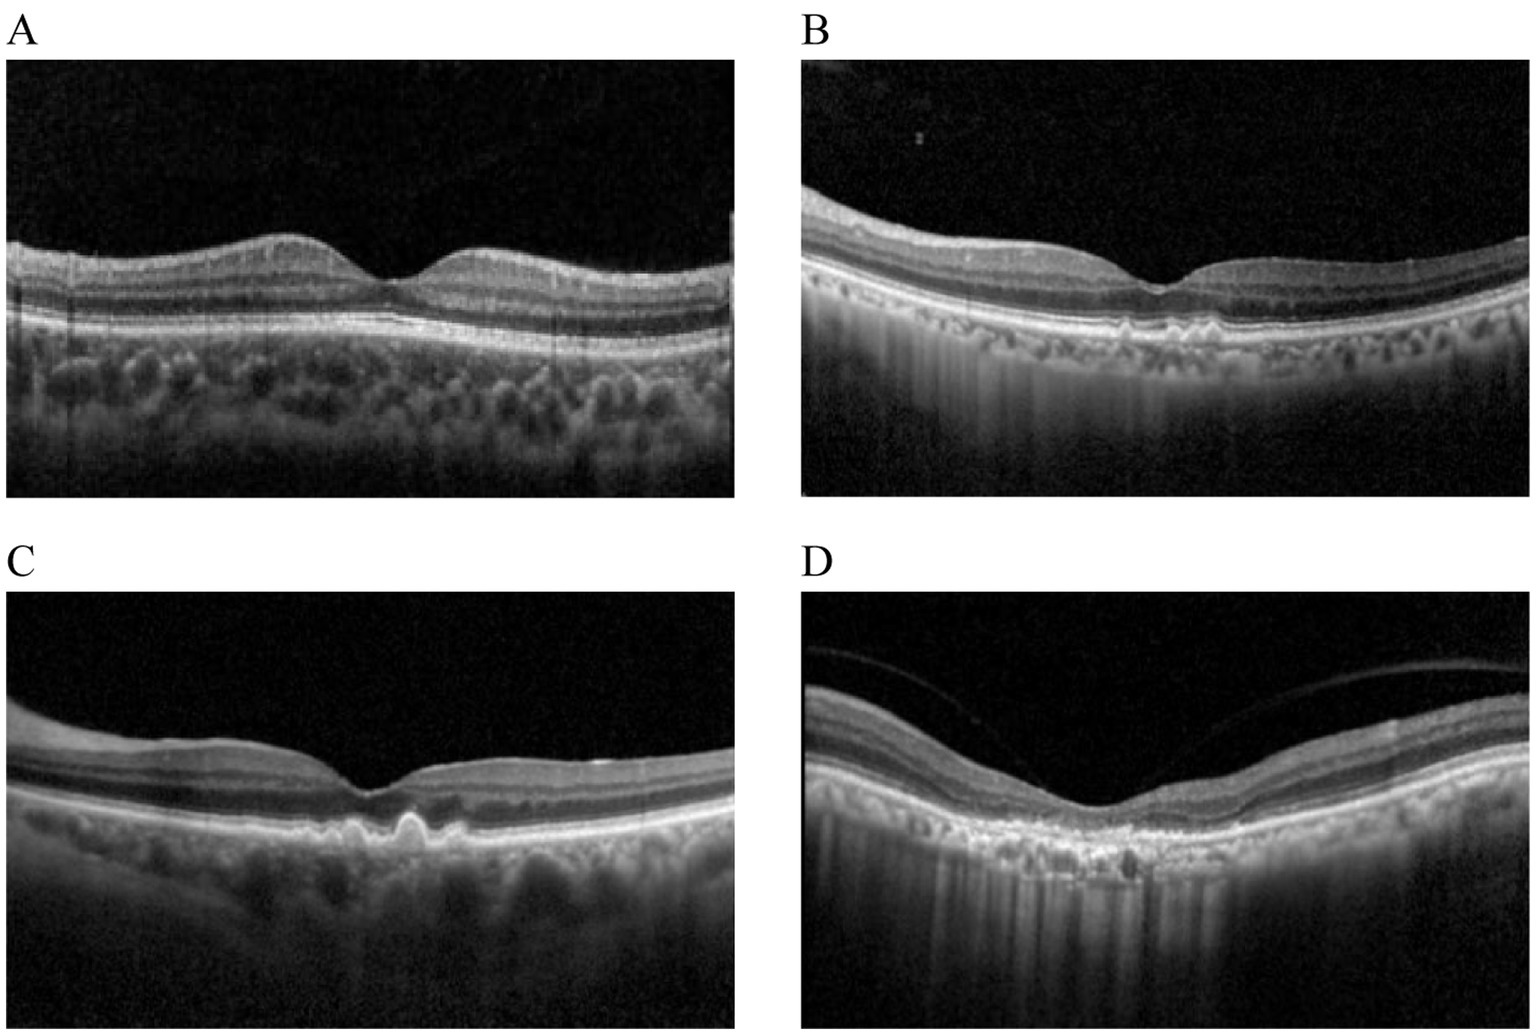
Figure 1. Different stages of dry AMD in OCT imaging. (A) Normal. (B) Drusen. (C) nGA. (D) GA.
Although OCT images were widely applied into the treatment and diagnosis of AMD (10–13), the process was time-consuming due to manual operation and analysis. Ophthalmologists may provide incorrect results even if they had great expertise. With the development of artificial intelligence, machine learning and deep learning algorithms had been used in the diagnosis and treatment tasks, such as classification, detection and segmentation of AMD (14). Deep Learning (DL) had been widely used in the medical field to monitor information in medical images for the diagnosis of various diseases (7, 15–18). Recently, DL integrated with OCT imaging analysis, had been utilized for intelligent and accurate classification of AMD (19). However, most of previous DL-based retinal OCT detection technologies focused primarily on the advanced stage. The main limitation came from the datasets which were mainly comprised of intermediate and late stages of AMD. Additionally, the challenge from the OCT image noise, the accuracy of diagnosis and the division among diverse stages increased the difficulty of early detection (20). A detection architecture based on a two-stage convolution neural network (CNN) with OCT images was proposed by He (21). In the first stage, ResNet50 CNN model was employed to categorize OCT images. Then image feature vector set was accepted by the local outlier factor algorithm in the second stage. This model was tested on the external Duke dataset which consisted of 723 AMD and 1,407 healthy control volumes. This architecture was able to achieve the performance of sensitivity of 95.0% and specificity of 95.0%. Similarly, a two-stage DL architecture was proposed by Motozawa (22). The first stage was capable of distinguishing healthy controls from OCT images. Then AMD with and without exudative changes could be detected in the second stage. This architecture was able to achieve a performance of 98.4% sensitivity, 88.3% specificity and 93.9% accuracy.
Similarly, a visual geometry group CNN architecture was developed by Lee for the categories of retinal diseases (23). This CNN model was trained and tested on 80,839 OCT images to evaluate the performance. The performance of AUC of 92.7% with an accuracy of 87.6% could be obtained. CNN models with fully automated technology were proposed by Derradji to segment retinal atrophy lesions in dry AMD (24). Due to segmentation technologies, this architecture was able to achieve a performance of 85% accuracy and 91% sensitivity.
To better differentiate AMD from healthy controls, Holland developed a pre-trained self-supervised deep learning architecture (25). The performance of 92% AUC was able to be achieved on the test images. However, it was difficult to distinguish between early stage and intermediate stage. To overcome this challenge, Bulut applied Xception models to the detection of AMD based on color fundus images (26). Through analysis of 50 different parameters, this architecture could obtain the highest performance of accuracy of 82.5%. Moreover, Chakravorti proposed an efficient CNN for AMD classification (27). This network trained on fundus images could categorize them in four types of AMD, reducing computational complexity with high performance. Instead of training networks on fundus images, Tomas developed an algorithm for the diagnosis of AMD in retinal OCT images. This algorithms was able to perform the detection of AMD based on the estimate of statistical approaches and randomization (28). Additionally, Zheng extended a five-category intelligent auxiliary diagnosis architecture for common retinal diseases. For the 4 common diseases, the best results of sensitivity, specificity, and F1-scores were 97.12, 99.52 and 98.21%, respectively (29). Vaiyapuri presented a new multi-retinal disease diagnosis model to determine diverse types of retinal diseases. Experimental results demonstrated that this architecture outperformed the exiting technologies for advanced AMD with the performance of accuracy 0.963 (30). Inspired by nature language processing, Lee presented CNN-LSTM and CNN-Transformer. Both deep learning architectures used a Long-Short Term Memory and a Transformer module, respectively with CNN, to capture the sequential information in OCT images for classification tasks. The proposed architecture was superior to the baseline architectures that utilized only single-visit CNN model to predict the risk of late AMD (31). Combining a multi-scale residual convolutional neural network and a vision transformer, Kar featured a generative adversarial network for the detection of AMD (32). Rigorous evaluations on multiple databases validated the architecture’s robustness and efficacy.
In summary, many of the mentioned studies had focused on the application of deep learning and OCT for classifcation of AMD, achieving impressive accuracy rates. However, these studies lacked a comprehensive prediction for nGA. In this paper, we aimed to diagnose early stage of AMD with strong predictor nGA. We provided an ensemble deep learning architecture consisting of four components (ResNet50, EfficientNetB4, MobileNetV3 and Xception) to analyze OCT images. In order to accurately detect the early stage of AMD, an OCT-based ensemble DL architecture was proposed in which the images would be classified into four categories: normal, Drusen, nGA and GA. The main contributions of this work were as follows:
1. To the best of our knowledge, this was the first investigation to use ensemble DL technologies to detect and classify nGA.
2. The proposed architecture showed its advantage and provided detection results which could be utilized as a useful computer-aided diagnostic tool for clinical OCT-based early AMD diagnosis.
3. This paper proposed an ensemble technique by combining the predictions of four base CNNs—ResNet50, EfficientNetB4, MobileNetV3 and Xception. Based on the knowledge gained from ImageNet dataset, each base CNN was fine-tuned for the specific OCT image classification task.
2 Methods
2.1 Datasets
Although there were some public OCT datasets, they were not suitable for the detection of early stage of AMD. This study was retrospective. We used OCT images collected in 2019–2023 which were gathered from 1,310 patients (male and female) of diverse age groups and ethnicity from Shenyang Aier Excellence Eye Hospital. The images in this dataset had been divided into four different classes: normal, drusen, nGA and GA. The training set and the test set were about 80 and 20% of the patients, respectively. All OCT images were captured from Heidelberg Spectralis HRA which was able to provide 6 mm × 6 mm B-scan length. The quality of OCT images were analyzed by ophthalmologists. All OCT images were clear and free of artifacts. Every OCT image was either normal or AMD without other retinal diseases. According to the judgment of ophthalmologists, OCT images that met the selection criteria were stored in the database. Any participant with any other ocular, systemic or neurological disease that could have an impact on the assessment of the retina, was excluded.
To improve the generalizability and reduce the risk of overfitting of the proposed architecture, this paper employed three-fold cross-validation to evaluate the performance. In one epoch of cross-validation, two-fold OCT images were used for training while the rest of OCT images were used for test. The training and test process would be performed three times and the average of results could be utilized to assess the performance of the proposed architecture. The number of training and test images were detailed in Table 1.
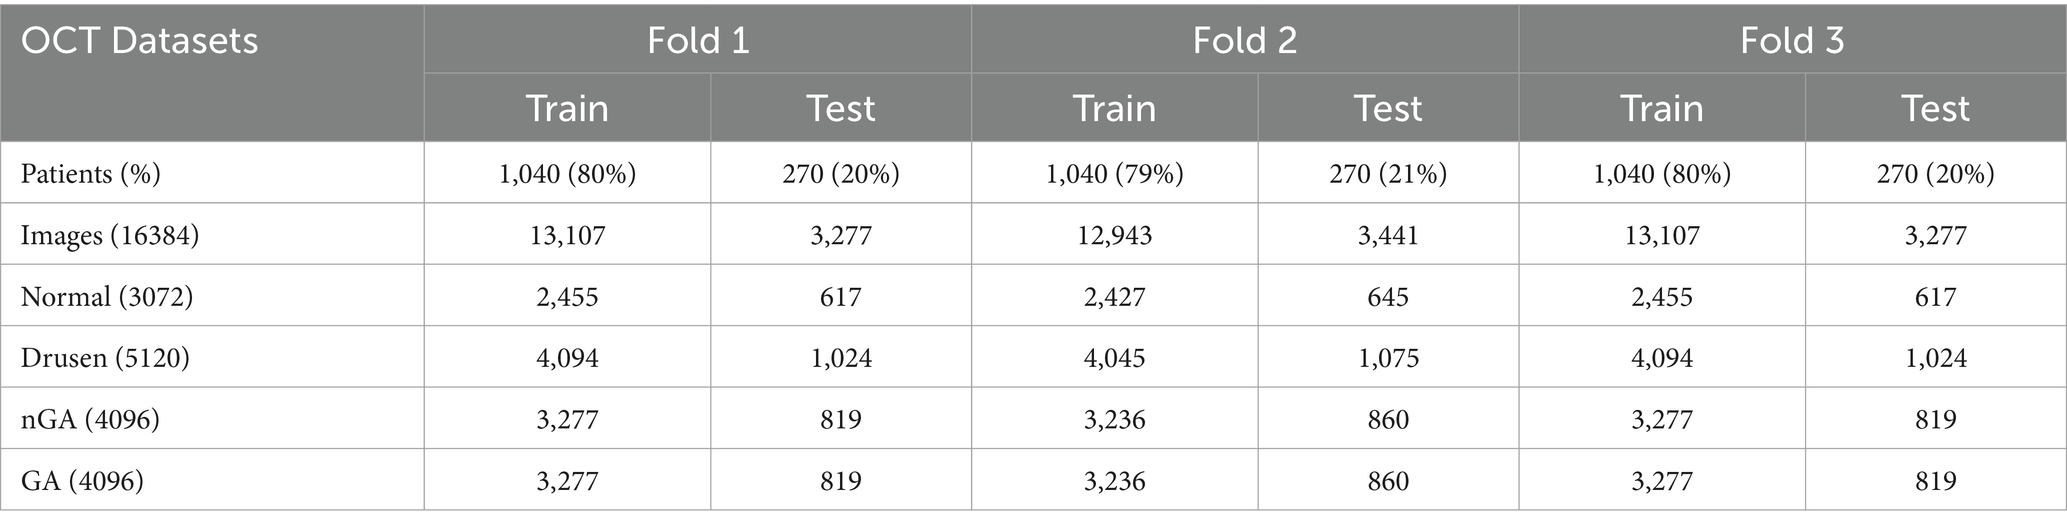
Table 1. The detail of three cross-fold training and test datasets.
2.2 Image enhancement
The aim of OCT images enhancement was to provide high quality images which would improve the performance of the proposed architecture. The visibility of significant features would be enhanced by image enhancement algorithms, such as diffusion filtering, linear enhancement and exponential enhancement. Results of different image enhancement algorithms were displayed in Figure 2, where the original OCT image was shown in Figure 2A. To start with, a diffusion filtering algorithm (33) was applied to reduce noise from the original OCT image, as presented in Figure 2B. Then linear enhancement (34) was employed to highlight the contrast between background and retinal layers, as shown in Figure 2C. At last, the OCT image was processed based on exponential enhancement (35) to further accentuate contrast between different layers. With the enhancement procedure, the final result could be obtained, as shown in Figure 2D.
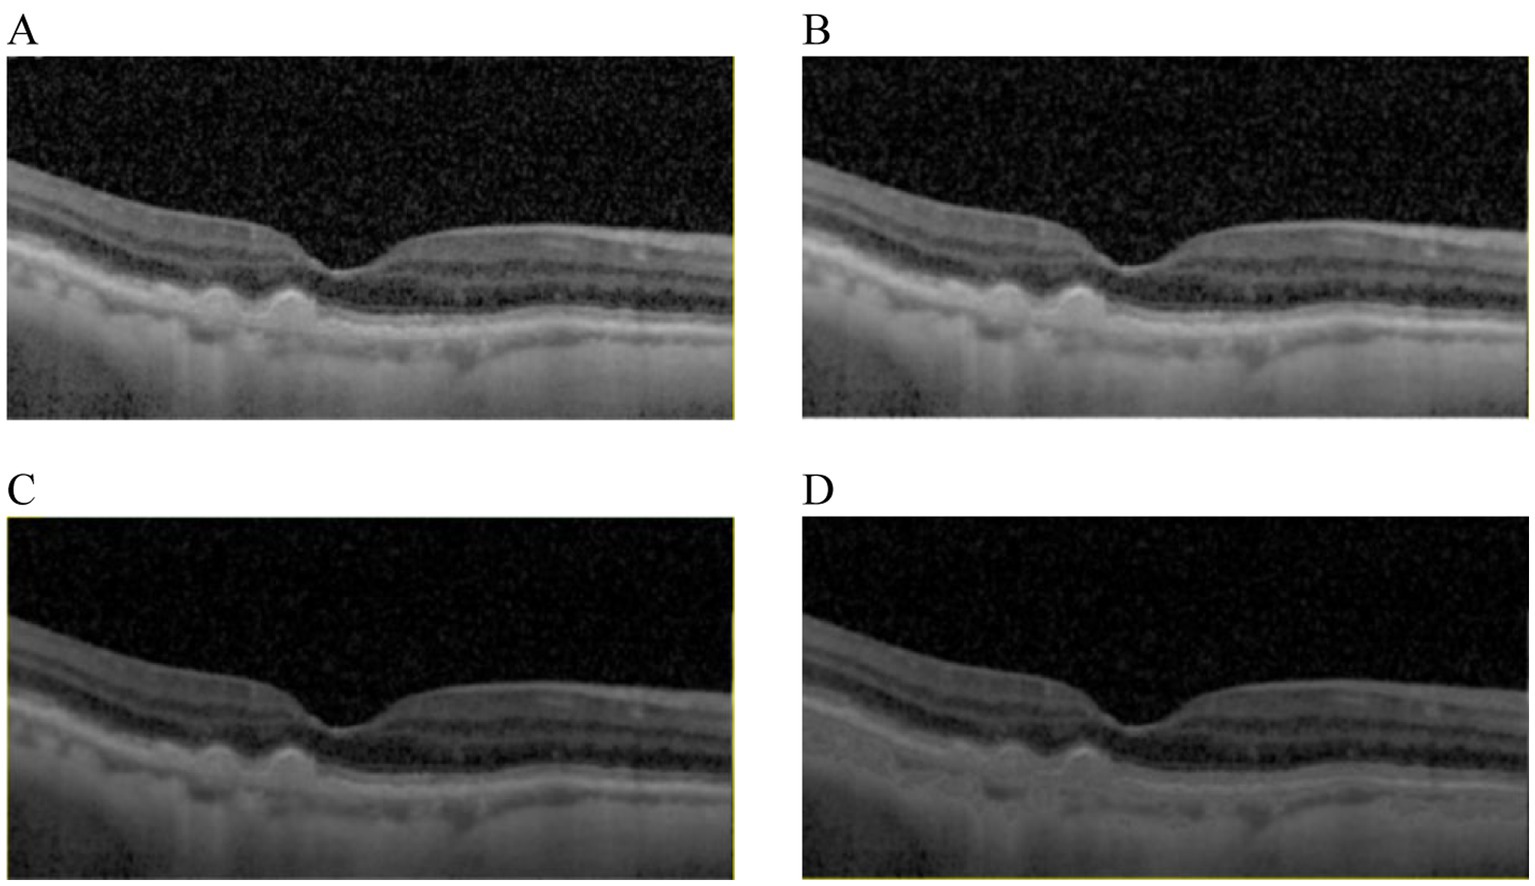
Figure 2. Results comparison from image enhancement. (A) The original image. (B) The OCT image from (A) with diffusion filtering. (C) The OCT image from (B) with linear enhancement. (D) The OCT image from (C) with the exponential enhancement.
2.3 Ensemble deep learning architecture
In this article, we built an ensemble deep learning architecture which consisted of four base models (ResNet50, EfficientNetB4, MobileNetV3 and Xception). After image enhancement, OCT images were further processed via image preprocessing, such as reshaping, normalization and augmentation. Then the OCT images were fed to every base model which was pre-trained on ImageNet and connected to full-connection layers. The prediction scores (i = 1,2,3,4) were obtained from four models. The weights would also be calculated based on these scores. As distributing weights to base models, we could obtain the final prediction through adding and normalizing these prediction scores. The global ensemble architecture was presented in Figure 3.
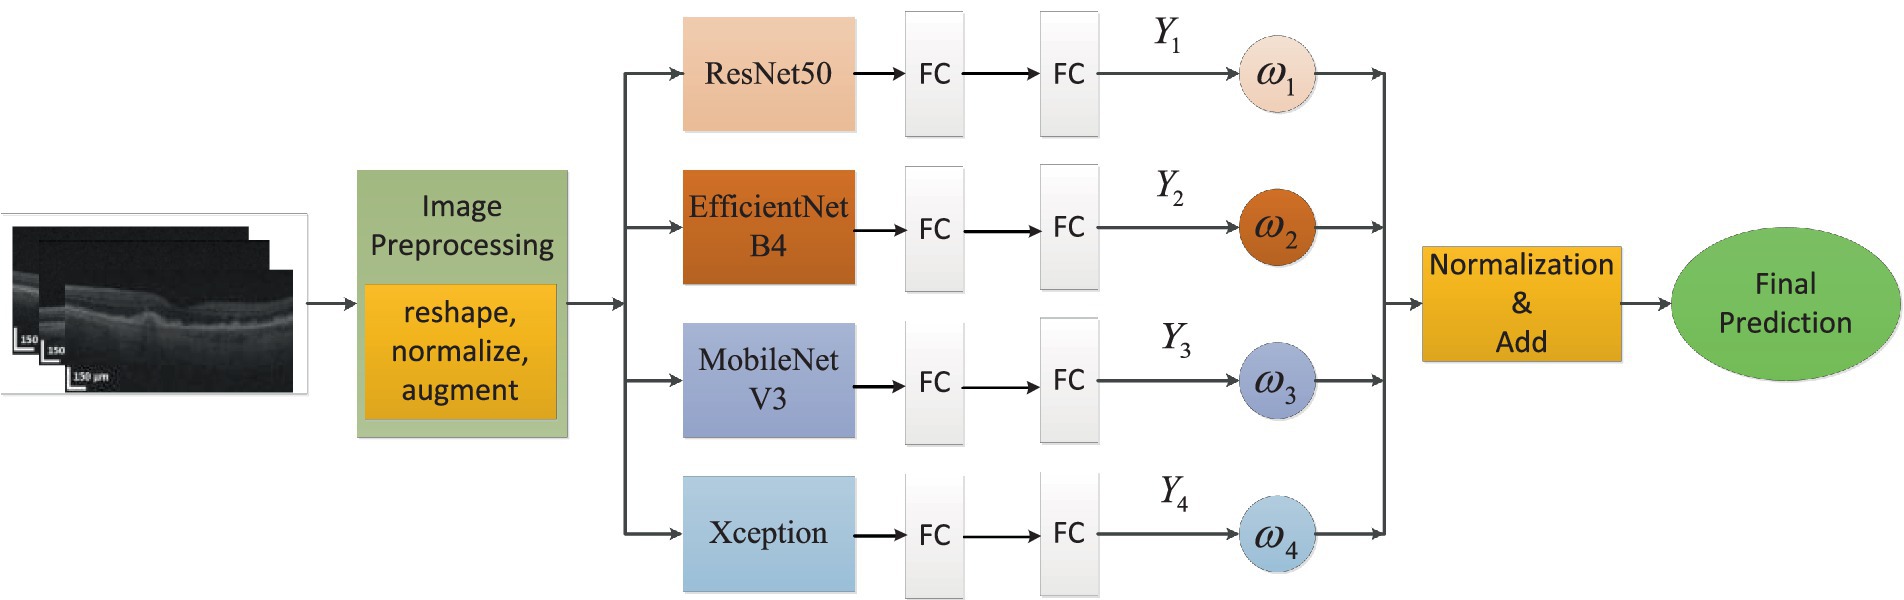
Figure 3. The global ensemble architecture.
In the OCT image pre-processing step, all OCT images were converted into gray values which ranged from 0 to 1. In order to obtain optimal classification performance, we tested OCT images with different shapes. We found that input images with 320 × 320 could provide the best performance. The visibility of AMD features were emphasized to accentuate contrast between different retinal layers. Moreover, data augmentation could improve the generality of the proposed method. The size of training data could be augmented. The number of original images was 4,096. Every original image was rotated , , and respectively. Besides all original images could be flipped. After augmentation, the total number of images was 16,384. 80% of the total images were used for training and the unseen images were employed for test purpose. The whole dataset was labeled by two ophthalmologists. Then the proposed architecture was comprised of four fine-tuning models. To reduce training time, transfer learning technology was used. The base models were pre-trained on ImageNet dataset. The weights before ‘FC’ were kept frozen. Then the training process would fine-tune weights between ‘FC’ layers with a learning rate 0.001. To further avoid overfitting and reduce computation, ‘dropout layer’ with a dropout rate of 0.4 had also been added between ‘FC’ layers. Because classification of AMD was performed with four categories, soft-max activation with four categories had been added after ‘FC’ layer for classification task of AMD. The training process of transfer learning was shown in Figure 4.
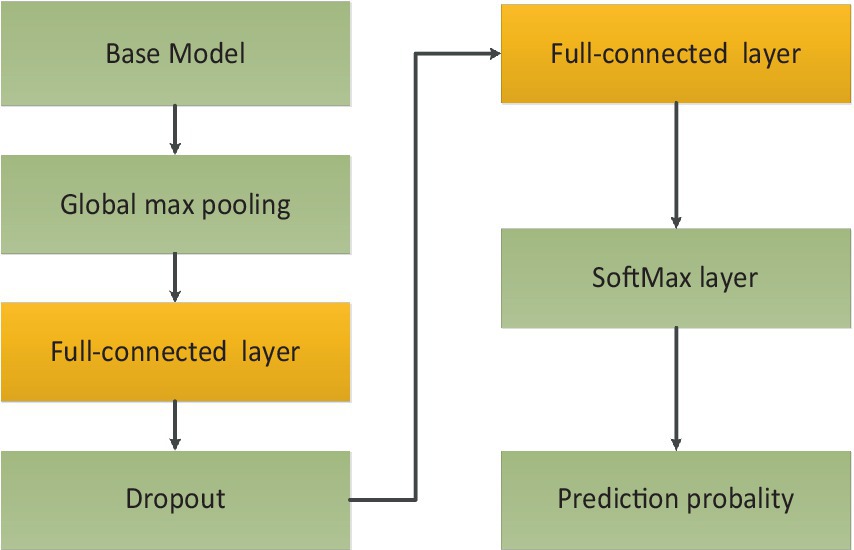
Figure 4. The training process of transfer learning.
The proposed architecture could be formed with the following steps: First, different base models, also known as CNNs, were analyzed after fine-tuning. Based on the performance of different base models, it could be found that the ResNet50, EfficientNetB4, MobileNetV3 and Xception had better performance compared to other CNN models on the test dataset. Then a comparative analysis of the weights combination strategies among different base models were performed. These strategies contained simple averaging, weighting function, majority voting and stacking methods. The weighting function was proportional to the performance of base models on test dataset. From these comparison results, the weighting function strategy could obtain the best performance for the classification of early AMD. The combination strategy of the proposed ensemble-based architecture was shown in Figure 5.
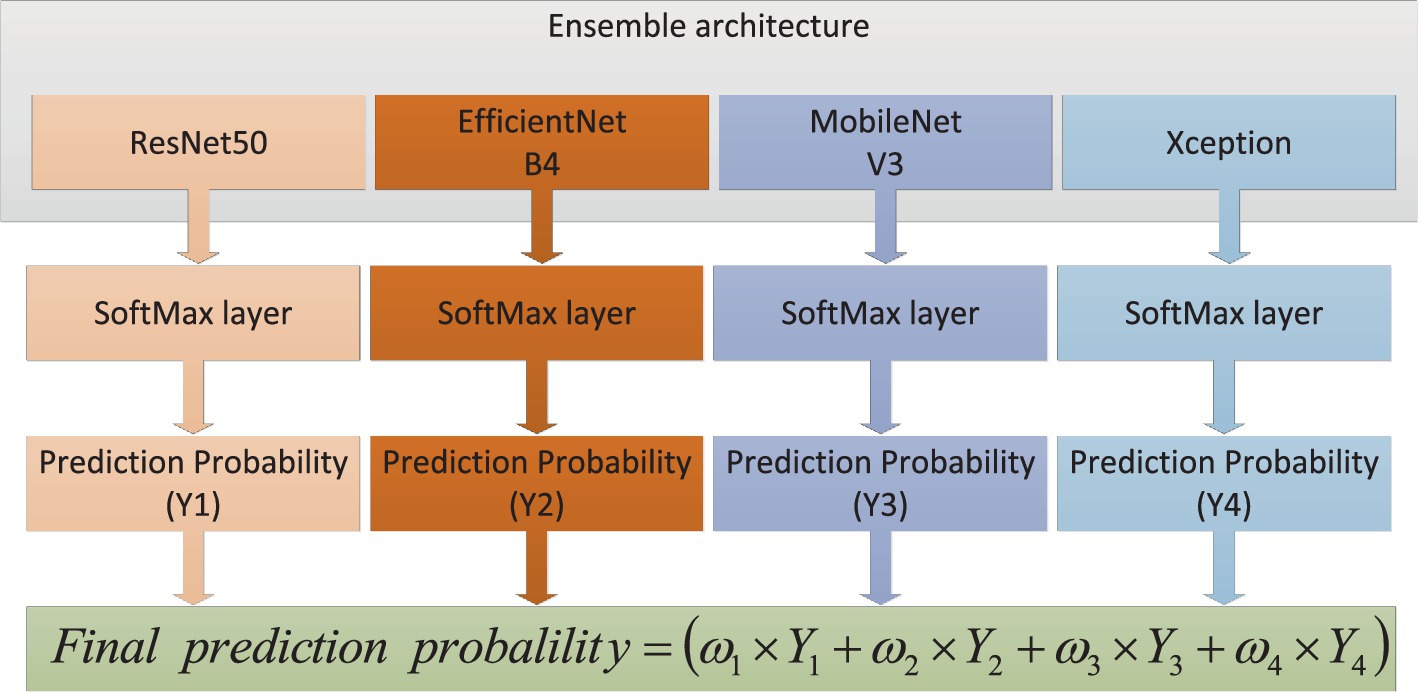
Figure 5. The combination strategy of the proposed ensemble-based architecture.
It could be found that four base models produced four prediction scores (i = 1,2,3,4). The final prediction score could be calculated based on weights which were proportional to the performance of base models. At last, the accuracy of diagnosis was compared with the ground truth to evaluate the performance of the ensemble deep learning architecture. The weights could be calculated based on the following mathematical formulation, as shown in Equation 1:
Where was the combination function which represented an aggregation strategy with various weights . If the the prediction probabilities from th model was , then the weight could be expressed as Equation 2:
The weights which denoted the significance of every base model. The final prediction probability P on the test dataset could be obtained based on the weights combination strategy, as shown in Equation 3:
The experimental results would be obtained and analyzed based on the proposed architecture in the next section.
3 Results
All experiments were conducted in Pytorch and the hardware was composed of 64 hyper-thread processors, 8 × RTX 2080 Ti, and windows10. All OCT images were set to the shape .
Base CNN models were evaluated on the test dataset. The classification task was performed for four categories of dry AMD (normal, drusen, nGA, and GA). Diverse metrics were used to evaluate the efficacy of base models, including accuracy (Acc), sensitivity (Sen), specificity (Spc) and F1-score (F1) for overall classification performance. Sen described how well the test caught all of positive cases and Spc described how well the test classified negative cases as negatives. F1 was a metric that offered an overall measure of the model’s accuracy. These metrics could be expressed from Equations 4–7:
Where , , , and represented true positives, true negatives, false positives, false negatives, respectively. The performance of each base model and the proposed architecture would be compared and evaluated using above performance metrics. 80% of the sample images were employed for training and the rest of images were used for testing. Different base models were assessed on the test dataset. The performance results were presented in Table 2.
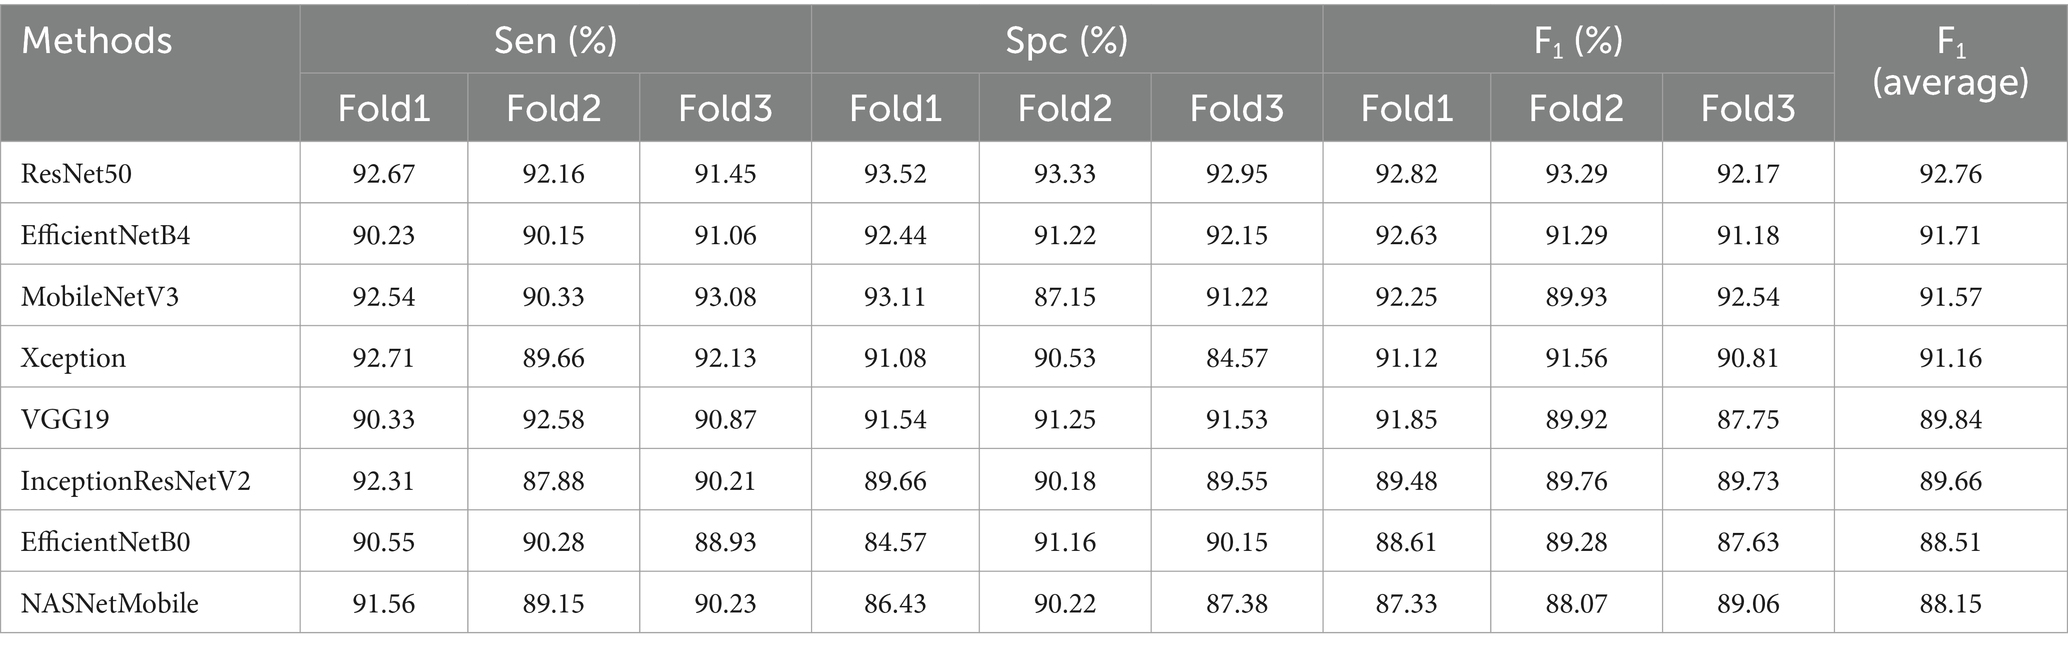
Table 2. The performance comparison among different methods.
Different ensemble strategies were also compared, such as majority voting, stacking, simple averaging, and weighting function (the proposed method). Majority voting meant that the prediction result from every base model was defined as a “vote.” The most votes were used as the final prediction result. Stacking could be conducted by training classifiers on the combined classification scores in an ensemble architecture. Then the ensemble architecture would classify test images based on the trained classifiers. Simple averaging overlooked the effect from weights. It used an average weight to process every prediction scores. Instead of obtaining an average weight, the weighting function would allocate weights to various base models. The weights were proportional to the performance of base models on the train dataset. The prediction scores would be further processed to get the final prediction result. The comparison results were detailed in Table 3.
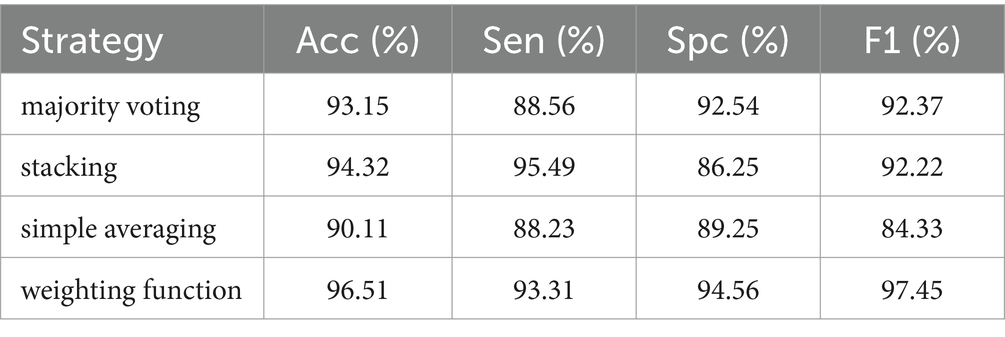
Table 3. The performance comparison from different ensembling strategies.
Based on the F1 score in Table 3, the confusion matrix was also utilized to further show overall classification results with different architectures, as shown in Figure 6.
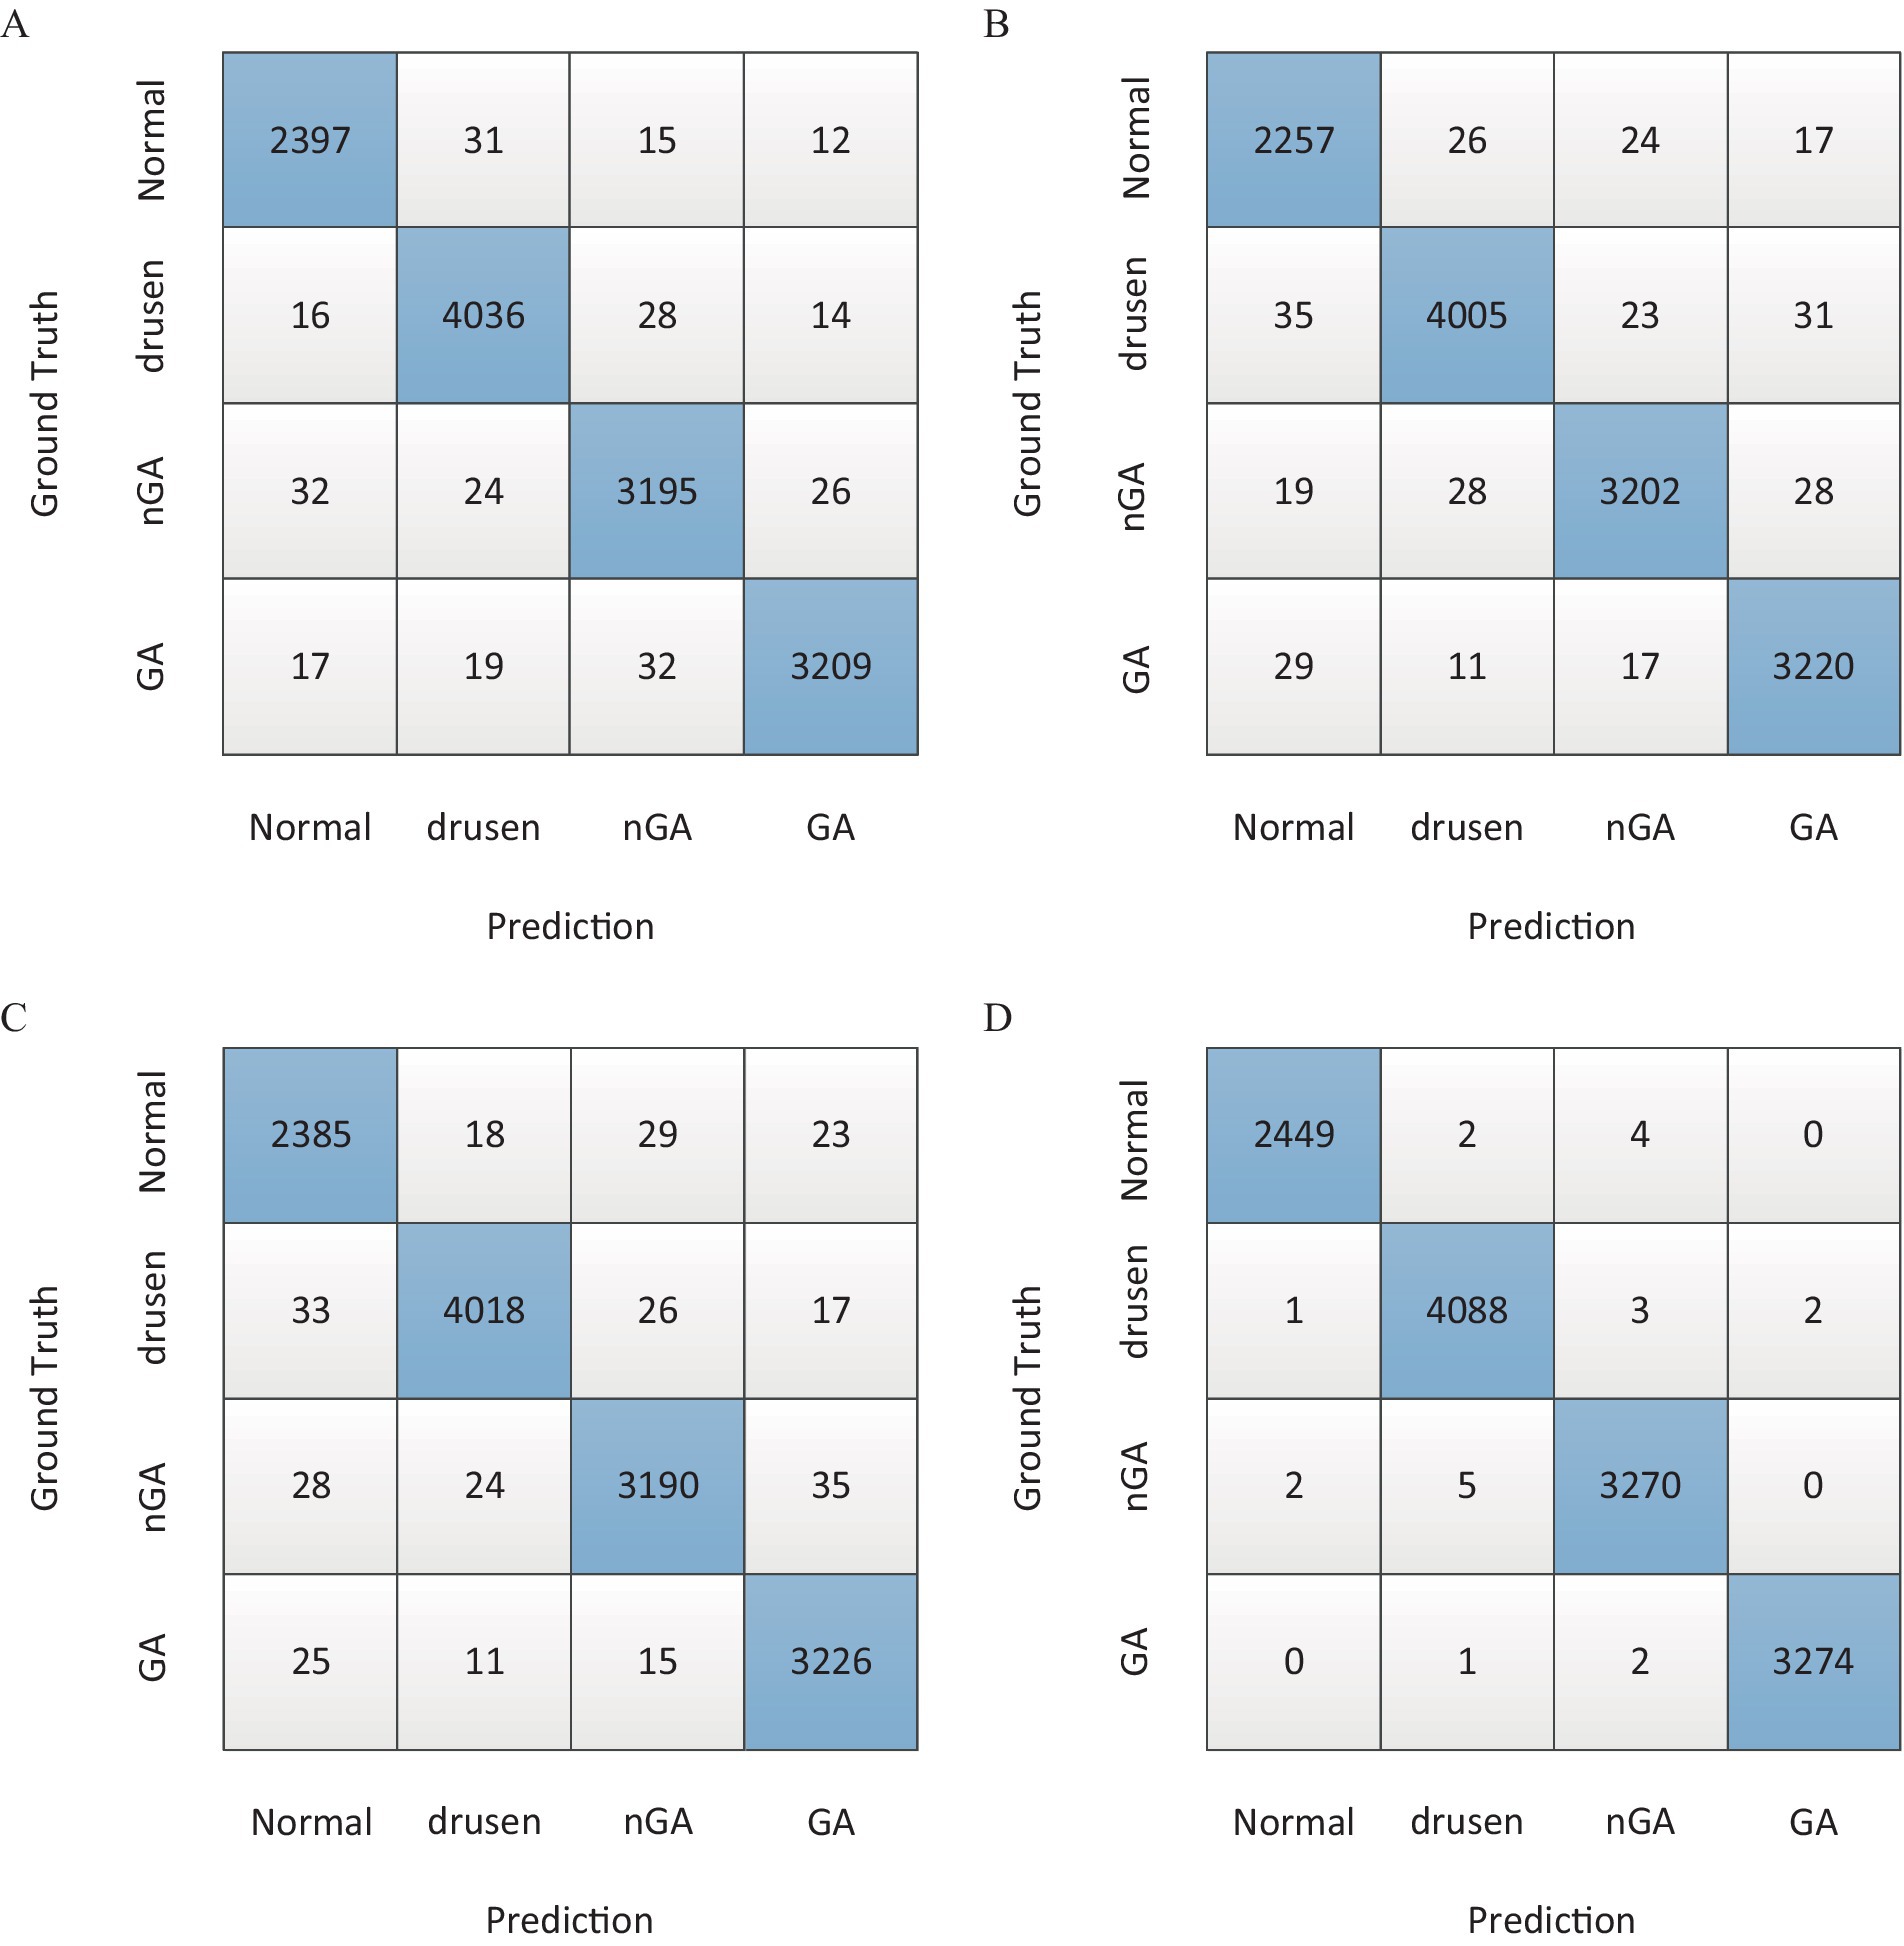
Figure 6. The confusion matrix of overall classification results. (A) Majority voting. (B) Stacking. (C) Simple averaging. (D) Weighting function.
The performance between the proposed ensemble architecture and base models were also analyzed. The training epoch was set to 400. In every epoch, the corresponding results were recorded. The comparison results were shown in Figure 7. Four categories of dry AMD were used to analyze the performance of classification. The classification Acc from base models and ensemble architecture were presented in Table 4.
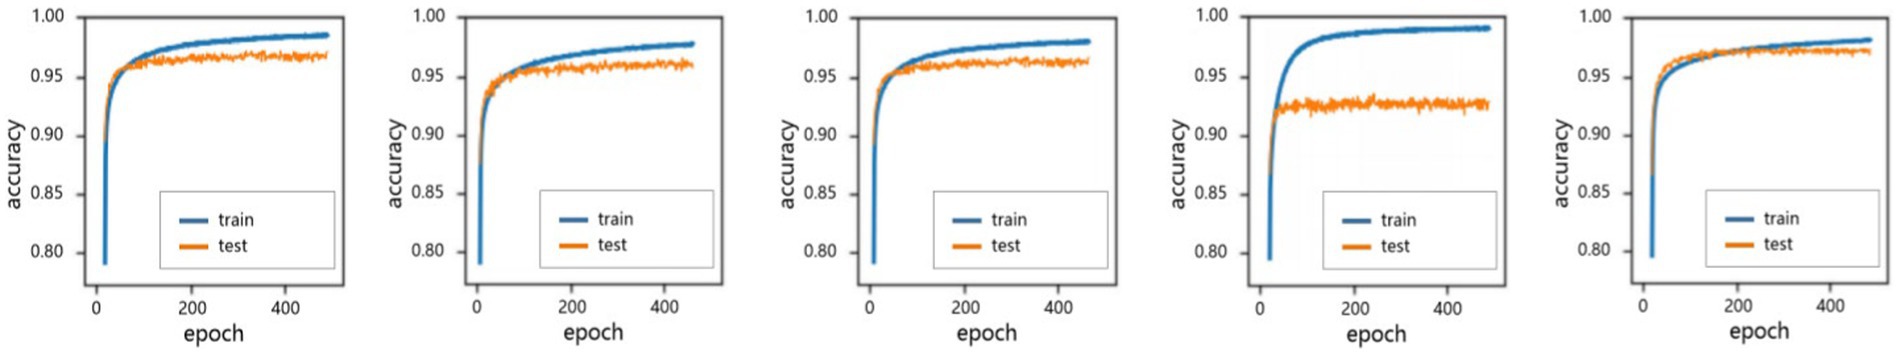
Figure 7. The performance of accuracy in 400 epochs. (A) ResNet 50. (B) EfficientNetB4. (C) MobileNetV3. (D) Xception. (E) Proposed.
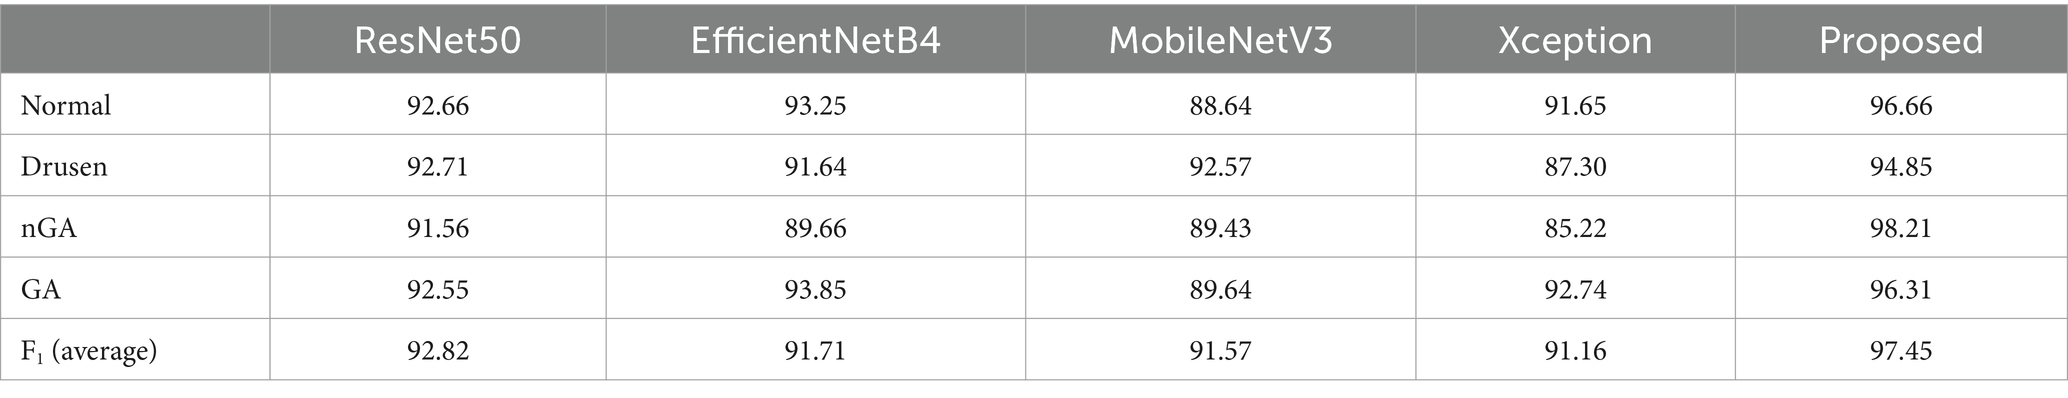
Table 4. The Acc (%) comparison among different classification results.
To give a comprehensive analysis from true positive rate and false positive rate, receiver operating characteristics curve (ROC) was also plotted for four categories: normal, drusen, nGA and GA, as shown in Figure 8.
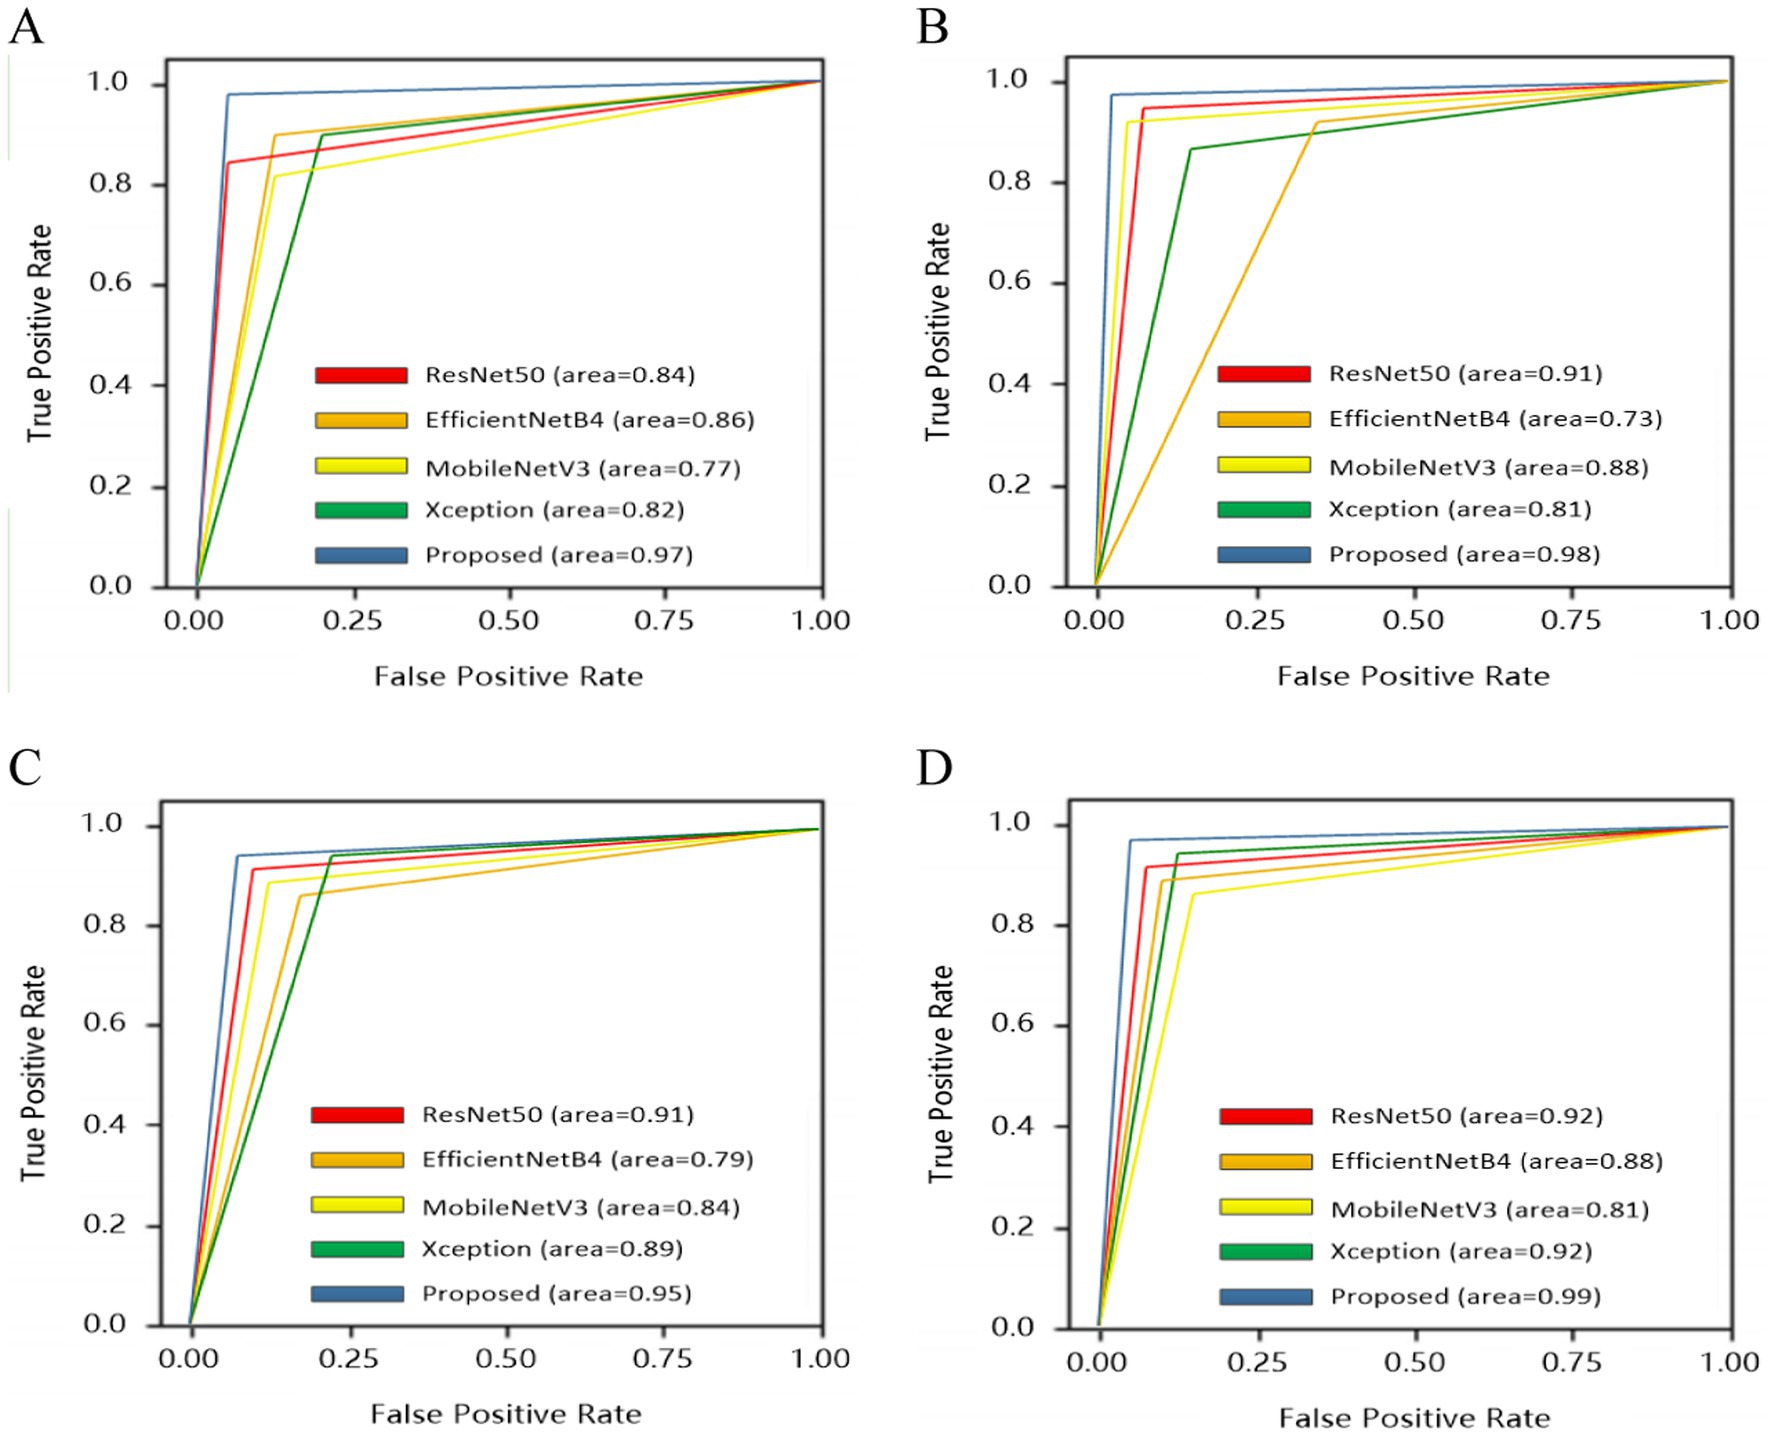
Figure 8. ROC comparison among different methods. (A) Normal. (B) Drusen. (C) nGA. (D) GA.
The visualization of heatmaps could also be generated to improve the interpretability in OCT images based on Grad-CAM. To show the classification basis, heatmaps of drusen, nGA, GA were generated respectively, as shown in Figure 9.
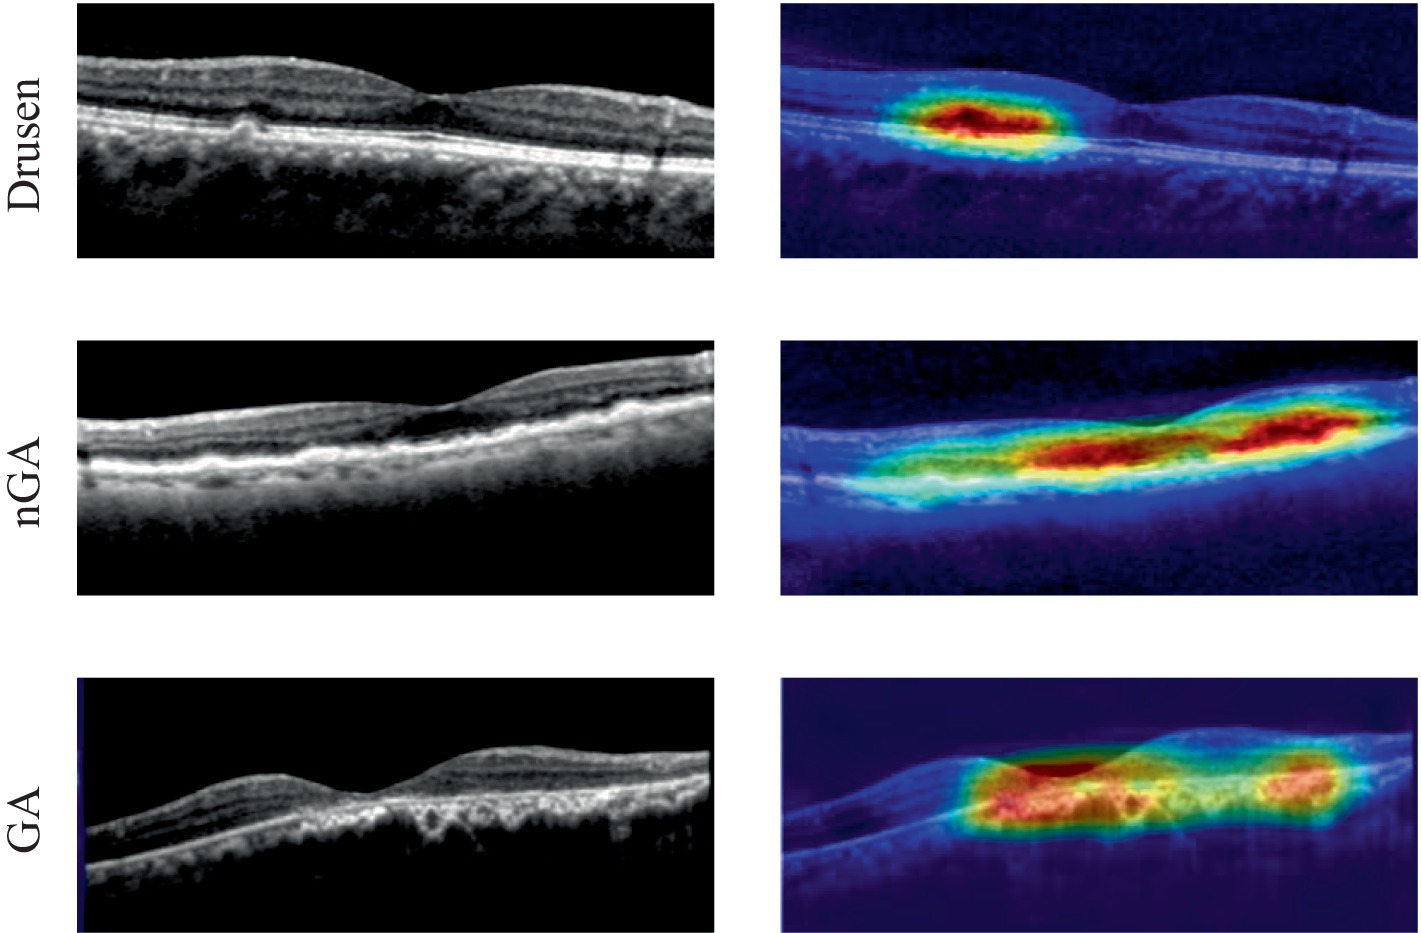
Figure 9. Heatmaps from dry AMD with pathological features.
4 Discussion
In this study, an ensemble deep learning architecture was proposed. To choose base models, different base models were tested and the performance results were shown in Table 2. The results were sorted in descending order based on F1 score since it offered a comprehensive evaluation of different models. Therefore F1 score could provide a basis for base models selection. Notably, four CNN models (ResNet50, EfficientNetB4, MobileNetV3 and Xception) could produce better results due to the consideration of local detail features and global semantic features. These base models would be served as base components in the ensemble architecture.
For the same base models, there were different combination strategies. In this study, majority voting, stacking, simple averaging and weighting function (the proposed method) were compared. The comparison results in Table 3 showed that both stacking and weighting function had better accuracy with 94.32% Acc and 96.51% Acc, respectively. Stacking strategy had the similar performance of sensitivity to the weighting function strategy which had better performance with 94.56% Spc. As presented in the column of F1 score, it could be found that weighting function had the best performance of classification with 97.45% F1 score. Moreover, the confusion matrices in Figure 6 demonstrated the advantage of the proposed architecture which could provide the best overall classification with less errors.
All base models could be fused based on tasks. Therefore, four categories of dry AMD were used to analyze the performance of different models. Comparison results were shown in Figure 7. It could be found that the proposed architecture and base models had similar performance. There were no over-fitting. Besides, the proposed architecture had better performance than base models with training epochs increasing. From comparison results in Table 4, it could also be found that the proposed architecture could generate commendable results. Compared with base models, the ensemble architecture could significantly improve the classification performance with the highest accuracy for all classes, especially for nGA. In terms of sensitivity and specificity, the proposed architecture outperformed all base models. It demonstrated that the proposed architecture could detect true positives and true negatives much better. For base models, F1-score were 92.82, 91.71, 91.57, and 91.16%, respectively, while the proposed method could archive the highest F1-score (97.45%). The comparison results demonstrated that the proposed architecture had better robustness and better performance of accuracy due to the combination of base models. ROC was provided to analyze overall performance of classification. Comparison results in Figure 8 showed that the maximum area could be obtained from the proposed architecture. It meant that the proposed architecture could provide more accurate classification results, especially for nGA.
The heat maps generated through Gram-CAM validated that typical features from dry AMD could be successfully detected. Three categories of pathological features (drusen, nGA and GA) could be correctly accentuated. In particular, the early stage of AMD with nGA could be correctly highlighted and observed, as shown in Figure 9. The heat maps demonstrated that the proposed architecture could successfully identify distinctive features and relevant lesions.
5 Conclusion
The intention of this article was to provide an architecture for an automated diagnosis and classification of AMD using OCT images, including the detection of early-stage dry AMD with nGA. The proposed architecture did not need to segment biomarkers. By combining image enhancement and base CNN models, the performance of detection of dry AMD could be improved. Experimental results showed that three categories of pathological features could be correctly detected and observed, particularly for the nGA feature. The proposed ensemble architecture and base models had similar performance. There were no over-fitting. Moreover, the proposed ensemble architecture had the best classification performance for the present OCT images classification task. It suggested that the proposed ensemble architecture was superior in classification task for early stage of AMD. In the future, multi-modal images such as fundus photography and angiography can be used to supplement OCT images. Besides the diagnostic performance can be improved by integrating other artificial intelligence technologies such as segmentation and attention mechanism.
Data availability statement
The raw data supporting the conclusions of this article will be made available by the authors, without undue reservation.
Ethics statement
Written informed consent was obtained from the individual(s) for the publication of any potentially identifiable images or data included in this article.
Author contributions
JY: Writing – original draft. BW: Investigation, Writing – original draft. JW: Software, Writing – original draft. YL: Data curation, Writing – review & editing. ZZ: Methodology, Writing – review & editing. YD: Formal analysis, Writing – review & editing. KT: Formal analysis, Writing – review & editing. FL: Project administration, Writing – review & editing. LM: Supervision, Writing – original draft, Writing – review & editing.
Funding
The author(s) declare that financial support was received for the research, authorship, and/or publication of this article. The authors of this paper wish to express their sincere gratitude to the Shenyang Science and Technology Plan Public Health R&D Special Project (Grant No. 21173912), Clinic Research Foundation of Aier Eye Hospital Group (Grant No. AC2214D01), Clinic Research Foundation of Aier Eye Hospital Group (Grant No. AC2214D01), and Clinic Research Foundation of Aier Eye Hospital Group (Grant No. AR2201D4) for providing the financial support necessary.
Conflict of interest
The authors declare that the research was conducted in the absence of any commercial or financial relationships that could be construed as a potential conflict of interest.
Publisher’s note
All claims expressed in this article are solely those of the authors and do not necessarily represent those of their affiliated organizations, or those of the publisher, the editors and the reviewers. Any product that may be evaluated in this article, or claim that may be made by its manufacturer, is not guaranteed or endorsed by the publisher.
Abbreviations
AMD, Age-related macular degeneration; OCT, Optical coherence tomography; nGA, Nascent geographic atrophy; INL, Inner nuclear layer; OPL, Outer plexiform layer; DL, Deep Learning; CNN, Convolutional neural network; ROC, Receiver operating characteristics curve; Acc, Accuracy; Sen, Sensitivity; Spc, Specificity; F1, F1-score.
References
1. Wu, Z, Fletcher, EL, Kumar, H, Greferath, U, and Guymer, RH. Reticular pseudodrusen: a critical phenotype in age-related macular degeneration. Prog Retin Eye Res. (2022) 88:101017. doi: 10.1016/j.preteyeres.2021.101017
2. Yang, S, Zhao, J, and Sun, X. Resistance to anti-VEGF therapy in neovascular age-related macular degeneration: a comprehensive review. Drug Des Devel Ther. (2016):1857–67. doi: 10.2147/DDDT.S97653
3. Mitchell, P, Liew, G, Gopinath, B, and Wong, TY. Age-related macular degeneration. Lancet. (2018) 392:1147–59. doi: 10.1016/S0140-6736(18)31550-2
4. Mrowicka, M, Mrowicki, J, Kucharska, E, and Majsterek, I. Lutein and zeaxanthin and their roles in age-related macular degeneration—neurodegenerative disease. Nutrients. (2022) 14:827. doi: 10.3390/nu14040827
5. Schmidt-Erfurth, U, and Waldstein, SM. A paradigm shift in imaging biomarkers in neovascular age-related macular degeneration. Prog Retin Eye Res. (2016) 50:1–24. doi: 10.1016/j.preteyeres.2015.07.007
6. Wong, CW, Yanagi, Y, Lee, WK, Ogura, Y, Yeo, I, Wong, TY, et al. Age-related macular degeneration and polypoidal choroidal vasculopathy in Asians. Prog Retin Eye Res. (2016) 53:107–39. doi: 10.1016/j.preteyeres.2016.04.002
7. Sadda, SR, Guymer, R, Holz, FG, Schmitz-Valckenberg, S, Curcio, CA, Bird, AC, et al. Consensus definition for atrophy associated with age-related macular degeneration on OCT: classification of atrophy report 3. Ophthalmology. (2018) 125:537–48. doi: 10.1016/j.ophtha.2017.09.028
8. Grunwald, JE, Pistilli, M, Ying, G, Maguire, MG, Daniel, E, Martin, DF, et al. Growth of geographic atrophy in the comparison of age-related macular degeneration treatments trials. Ophthalmology. (2015) 122:809–16. doi: 10.1016/j.ophtha.2014.11.007
9. Wu, Z, Luu, CD, Ayton, LN, Goh, JK, Lucci, LM, Hubbard, WC, et al. Optical coherence tomography–defined changes preceding the development of drusen-associated atrophy in age-related macular degeneration. Ophthalmology. (2014) 121:2415–22. doi: 10.1016/j.ophtha.2014.06.034
10. Burlina, PM, Joshi, N, Pekala, M, Pacheco, KD, Freund, DE, and Bressler, NM. Automated grading of age-related macular degeneration from color fundus images using deep convolutional neural networks. JAMA Ophthalmol. (2017) 135:1170–6. doi: 10.1001/jamaophthalmol.2017.3782
11. Ting, DSW, Pasquale, LR, Peng, L, Campbell, JP, Lee, AY, Raman, R, et al. Artificial intelligence and deep learning in ophthalmology. Br J Ophthalmol. (2019) 103:167–75. doi: 10.1136/bjophthalmol-2018-313173
12. Ting, DSJ, Foo, VHX, Yang, LWY, Sia, JT, Ang, M, Lin, H, et al. Artificial intelligence for anterior segment diseases: emerging applications in ophthalmology. Br J Ophthalmol. (2021) 105:158–68. doi: 10.1136/bjophthalmol-2019-315651
13. Aggarwal, R, Sounderajah, V, Martin, G, Ting, DSW, Karthikesalingam, A, King, D, et al. Diagnostic accuracy of deep learning in medical imaging: a systematic review and meta-analysis. NPJ Dig Med. (2021) 4:65. doi: 10.1038/s41746-021-00438-z
14. Chen, R, Zhang, W, Song, F, Yu, H, Cao, D, Zheng, Y, et al. Translating color fundus photography to indocyanine green angiography using deep-learning for age-related macular degeneration screening. NPJ Dig Med. (2024) 7:34. doi: 10.1038/s41746-024-01018-7
15. Gholami, S, Scheppke, L, Kshirsagar, M, Wu, Y, Dodhia, R, Bonelli, R, et al. Self-supervised learning for improved optical coherence tomography detection of macular telangiectasia type 2. JAMA Ophthalmol. (2024) 142:226–33. doi: 10.1001/jamaophthalmol.2023.6454
16. Jin, K, Yan, Y, Chen, M, Wang, J, Pan, X, Liu, X, et al. Multimodal deep learning with feature level fusion for identification of choroidal neovascularization activity in age-related macular degeneration. Acta Ophthalmol. (2022) 100:e512–20. doi: 10.1111/aos.14928
17. Iafe, NA, Phasukkijwatana, N, and Sarraf, D. Optical coherence tomography angiography of type 1 neovascularization in age-related macular degeneration. OCT Angiography Retinal Macular Dis. (2016) 56:45–51. doi: 10.1159/000442776
18. Jia, Y, Bailey, ST, Wilson, DJ, Tan, O, Klein, ML, Flaxel, CJ, et al. Quantitative optical coherence tomography angiography of choroidal neovascularization in age-related macular degeneration. Ophthalmology. (2014) 121:1435–44. doi: 10.1016/j.ophtha.2014.01.034
19. Tombolini, B, Crincoli, E, Sacconi, R, Battista, M, Fantaguzzi, F, Servillo, A, et al. Optical coherence tomography angiography: a 2023 focused update on age-related macular degeneration. Ophthalmol Therapy. (2024) 13:449–67. doi: 10.1007/s40123-023-00870-2
20. El-Ateif, S, and Idri, A. Eye diseases diagnosis using deep learning and multimodal medical eye imaging. Multimed Tools Appl. (2023) 83:30773–818. doi: 10.1007/s11042-023-16835-3
21. He, T, Zhou, Q, and Zou, Y. Automatic detection of age-related macular degeneration based on deep learning and local outlier factor algorithm. Diagnostics. (2022) 12:532. doi: 10.3390/diagnostics12020532
22. Motozawa, N, An, G, Takagi, S, Kitahata, S, Mandai, M, Hirami, Y, et al. Optical coherence tomography-based deep-learning models for classifying normal and age-related macular degeneration and exudative and non-exudative age-related macular degeneration changes. Ophthalmol Therapy. (2019) 8:527–39. doi: 10.1007/s40123-019-00207-y
23. Lee, CS, Baughman, DM, and Lee, AY. Deep learning is effective for the classification of OCT images of Normal versus age-related macular degeneration. Ophthalmology. Retina. (2017) 1:322–7. doi: 10.1016/j.oret.2016.12.009
24. Derradji, Y, Mosinska, A, Apostolopoulos, S, Ciller, C, de Zanet, S, and Mantel, I. Fully-automated atrophy segmentation in dry age-related macular degeneration in optical coherence tomography. Sci Rep. (2021) 11:21893. doi: 10.1038/s41598-021-01227-0
25. Holland, R, Menten, MJ, Leingang, O, Bogunovic, H, Hagag, AM, Kaye, R, et al. Self-supervised pretraining enables deep learning-based classification of AMD with fewer annotations. Invest Ophthalmol Vis Sci. (2022) 63:3004.
26. Bulut, B, Kalın, V, Güneş, B B, and Khazhin, Rim. Deep learning approach for detection of retinal abnormalities based on color fundus images. 2020 innovations in intelligent systems and applications conference (ASYU), (2020): 1–6.
27. Chen, YM, Huang, WT, Ho, WH, and Tsai, JT. Classification of age-related macular degeneration using convolutional-neural-network-based transfer learning. BMC Bioinformat. (2021) 22:1–16. doi: 10.1186/s12859-021-04001-1
28. Thomas, A, Sunija, AP, Manoj, R, Ramachandran, R, Ramachandran, S, Varun, PG, et al. RPE layer detection and baseline estimation using statistical methods and randomization for classification of AMD from retinal OCT. Comput Methods Prog Biomed. (2021) 200:105822. doi: 10.1016/j.cmpb.2020.105822
29. Zheng, B, Jiang, Q, Lu, B, He, K, Wu, MN, Hao, XL, et al. Five-category intelligent auxiliary diagnosis model of common fundus diseases based on fundus images. Transl Vis Sci Technol. (2021) 10:20–11. doi: 10.1167/tvst.10.7.20
30. Vaiyapuri, T, Srinivasan, S, Yacin Sikkandar, M, Balaji, TS, Kadry, S, Meqdad, MN, et al. Intelligent deep learning based multi-retinal disease diagnosis and classification framework. Comput Materials Continua. (2022) 73:5543–57. doi: 10.32604/cmc.2022.023919
31. Lee, J, Wanyan, T, Chen, Q, Keenan, Tiarnan D. L., Glicksberg, Benjamin S., Chew, Emily Y., et al. (2022). Predicting age-related macular degeneration progression with longitudinal fundus images using deep learning[C]//international workshop on machine learning in medical imaging. Cham: Springer Nature Switzerland: 11–20.
32. Kar, MK, Neog, DR, and Nath, MK. Retinal vessel segmentation using multi-scale residual convolutional neural network (MSR-net) combined with generative adversarial networks. Circuits Syst Signal Process. (2023) 42:1206–35. doi: 10.1007/s00034-022-02190-5
33. Deng, L, Zhu, H, Yang, Z, and Li, Y. Hessian matrix-based fourth-order anisotropic diffusion filter for image denoising. Opt Laser Technol. (2019) 110:184–90. doi: 10.1016/j.optlastec.2018.08.043
34. Wang, W, Wu, X, Yuan, X, and Gao, Z. An experiment-based review of low-light image enhancement methods. IEEE Access. (2020) 8:87884–917. doi: 10.1109/ACCESS.2020.2992749
Keywords: dry age-related macular degeneration, optical coherence tomography, ensemble deep learning, NGA, early AMD detection
Citation: Yang J, Wu B, Wang J, Lu Y, Zhao Z, Ding Y, Tang K, Lu F and Ma L (2024) Dry age-related macular degeneration classification from optical coherence tomography images based on ensemble deep learning architecture. Front. Med. 11:1438768. doi: 10.3389/fmed.2024.1438768
Edited by:
Xiaojun Yu, Northwestern Polytechnical University, ChinaReviewed by:
Bhim Bahadur Rai, Australian National University, AustraliaJing Ji Ji, Shanghai Ninth People’s Hospital, China
Copyright © 2024 Yang, Wu, Wang, Lu, Zhao, Ding, Tang, Lu and Ma. This is an open-access article distributed under the terms of the Creative Commons Attribution License (CC BY). The use, distribution or reproduction in other forums is permitted, provided the original author(s) and the copyright owner(s) are credited and that the original publication in this journal is cited, in accordance with accepted academic practice. No use, distribution or reproduction is permitted which does not comply with these terms.
*Correspondence: Liwei Ma, MTg5MDA5MTM1ODhAMTYzLmNvbQ==