
94% of researchers rate our articles as excellent or good
Learn more about the work of our research integrity team to safeguard the quality of each article we publish.
Find out more
ORIGINAL RESEARCH article
Front. Med. , 23 July 2024
Sec. Geriatric Medicine
Volume 11 - 2024 | https://doi.org/10.3389/fmed.2024.1436977
This article is part of the Research Topic Assessment of Nutritional Status in Chronic Diseases View all 20 articles
 Sultan H. Alamri1,2,3*
 Mayar M. Simbawa3
Background: Malnutrition is prevalent among hospitalized older patients. Early identification is therefore essential to implementing appropriate therapeutic interventions. This study aimed to explore the correlation between handgrip strength (HGS) and nutritional status in hospitalized older adults.
Materials and methods: This observational cross-sectional study was conducted at King Abdulaziz University Hospital, where a consecutive cohort of older adult inpatients was enrolled for participation. Shortly after admission, HGS and nutritional status were assessed using a dynamometer and the most recent version of the Mini-Nutritional Assessment Short Form (MNA-SF) test, respectively. Key anthropometric and biochemical indicators were also collected.
Results: A total of 135 consecutive patients were evaluated. Among participants with low HGS, 18 (16.22%) were malnourished, 43 (38.74%) were at risk of malnutrition, and 50 (45.05%) had normal nutrition status. The participants with low HGS had low hemoglobin, low lymphocyte levels, high creatinine levels, high BUN levels, high CRP levels, high HbA1c levels, and high vitamin B12 levels. Multiple logistic regression analysis showed that age, hemoglobin, and HbA1C were independently associated with low HGS. Based on the cut-off values for the HGS by the European Working Group on Sarcopenia in Older People-2 (EWGSOP2), low HGS showed high sensitivity to detect “malnourished and at risk of malnutrition” as well as “malnourished alone;” however, the specificity was low to exclude “malnourished and at risk of malnutrition” as well as “malnutrition alone.”
Conclusion: Age over 75 years, low hemoglobin, and elevated HbA1C levels were independent risk factors for low HGS. While HGS was sensitive in detecting malnutrition or risk, its specificity was low. Therefore, HGS may not be adequate as a standalone tool to assess nutritional status in hospitalized older adults. Replication of this study using locally reliable and validated HGS cut-off values is warranted to confirm these findings.
Malnutrition is defined as “a state resulting from the lack of appropriate nutritional intake or uptake that leads to altered body composition (decreased fat-free mass) and body cell mass, leading to diminished physical and mental function and an altered clinical outcome from disease” (1). Nutritional risk or malnutrition is prevalent among hospitalized older patients (2). According to a systematic review, the prevalence rates of individuals at high risk of malnutrition were estimated to be 28.0% in hospital settings and 8.5% in community settings (2). In the hospital setting, malnutrition has been independently linked to a higher risk of adverse consequences, including longer hospital stays, more complications, increased mortality, and higher healthcare expenditures (3, 4). Malnourished patients are also more susceptible to infections, impaired wound healing, and reduced muscle function, all of which contribute to a reduced quality of life and an overall poor prognosis (4). Early identification is therefore essential to mitigate these negative impacts and improve clinical outcomes (5). Traditionally, nutritional status assessment has relied on biochemical markers to identify malnourished patients. However, functional assessment, HGS in particular, has recently gained considerable attention as a potential indicator of nutritional status, signifying a shift in the approach to nutritional assessment (6, 7).
Although a definitive conclusion on the utility of HGS is lacking, research on its correlation with nutritional status is currently limited across many countries, including Saudi Arabia. Hence, the present study aimed to explore whether HGS is a predictor of nutritional status in a cohort of hospitalized older adults in Saudi Arabia.
This observational cross-sectional study was conducted during April and May 2022 at King Abdulaziz University Hospital, Jeddah, Saudi Arabia. The study protocol was approved by the Research Ethics Committee (REC) of KAUH (Reference No. 591–21), and all participants provided verbal informed consent.
A total of 135 consecutive patients aged 60 years or older were recruited from the medical and surgical wards of King Abdulaziz University Hospital. Data were obtained directly from participants. Patients who were readmitted during the study period, experiencing terminal illness or upper limb disabilities (neurological or musculoskeletal), or were unable to provide consent were excluded from the study.
Shortly after hospital admission, anthropometric measurements including body mass index (BMI), weight, and height were obtained using standard techniques. Biochemical data were extracted from the electronic medical records including albumin (ALB), total protein (TP), creatinine (Cr), triglycerides (TG), total cholesterol (TC), hemoglobin (Hb), white blood cells (WBC), lymphocytes, blood urea nitrogen (BUN), hemoglobin A1C (HbA1C), and C-reactive protein (CRP). Other information was also collected, such as age, sex, and admission diagnosis.
The nutritional status of the patients was estimated using the Mini Nutrition Assessment Short Form (MNA-SF). The form was initially developed in 1994 to assess nutritional and functional status among older patients, as well as to predict mortality. It has been widely used, both in research and in clinical practice, as a simple and inexpensive tool with 96% sensitivity and 98% specificity (8). With the revised MNA-SF, quick screening of potential candidates is allowed, and the tool has increased clinical applicability in clinical practice (8, 9). MNA-SF score ranges from 0 to 14. Subjects who score less than 8 are considered malnourished. At-risk participants score between 8 and 11, while those who are well-nourished score above 12.
The HGS was measured using an electronic handgrip dynamometer (CAMRY, Model 1 EH101). Before the assessment, a healthcare provider provided verbal instructions and demonstrated the test procedure to each participant. The patients were clearly instructed to squeeze the device firmly for 3 s with their dominant hand. The arm and dynamometer were held on the side of the body with the elbow flexed at 90° (10). Every patient was required to perform three maximal isometric contractions while upright, with a minimum of 10 s and a maximum of 30 s of rest between tests. The highest score was then recorded.
Based on the revised algorithm for the diagnosis of sarcopenia of the European Working Group on Sarcopenia in Older People-2 (EWGSOP2), the low grip strength is defined as <16 kg for women and < 27 kg for men (11).
Descriptive statistics were presented for sociodemographic data. The continuous data were presented as mean and standard deviation (SD), and the categorical data were presented as frequencies and percentages. The groups were compared using the Welch two-sample t-test for continuous data, and Pearson’s chi-squared test or Fisher’s exact was used for categorical variables as appropriate. Receiver operating characteristic (ROC) analysis is a powerful tool for evaluating the performance of diagnostic tests that deal with binary outcomes. The area under the ROC curve (AUC) is a single numerical value summarizing the overall performance of the model. An AUC of 1 represents perfect discrimination, while an AUC of 0.5 indicates no better than chance performance. ROC analysis was performed to evaluate the predictive performance of HGS (kg) to malnourished and/or at risk of malnourished versus normal and to detect malnourished versus rest (at risk of malnourished and normal). The sensitivity, specificity, and AUC were evaluated for each of the above ROC analyses and provided 95% confidence intervals.
Logistic regression analysis was performed to identify the factors associated with the low HGS. The baseline characteristics and biochemical markers that were significant at group comparisons were used as exposure variables. Stepwise variable selection was adopted to identify the independent variables associated with low HGS. A p-value of <0.05 was considered significant. R programming language version 3.6.3 was used for the analysis.
In this study, 135 participants aged 60 years and older were included; of whom, 50.4% were women (n = 68). Approximately one-third (30.4%) of the participants were illiterate, and the majority (68.9%) were married. Approximately three-quarters (73.3%) of the participants were non-smokers, and 38.5% (n = 52) had a BMI between 25.0 and 29.9. Diabetes, hypertension, heart disease, cancer, and polypharmacy were the most prevalent conditions among the participants. The baseline characteristics of the study population are presented in Table 1.
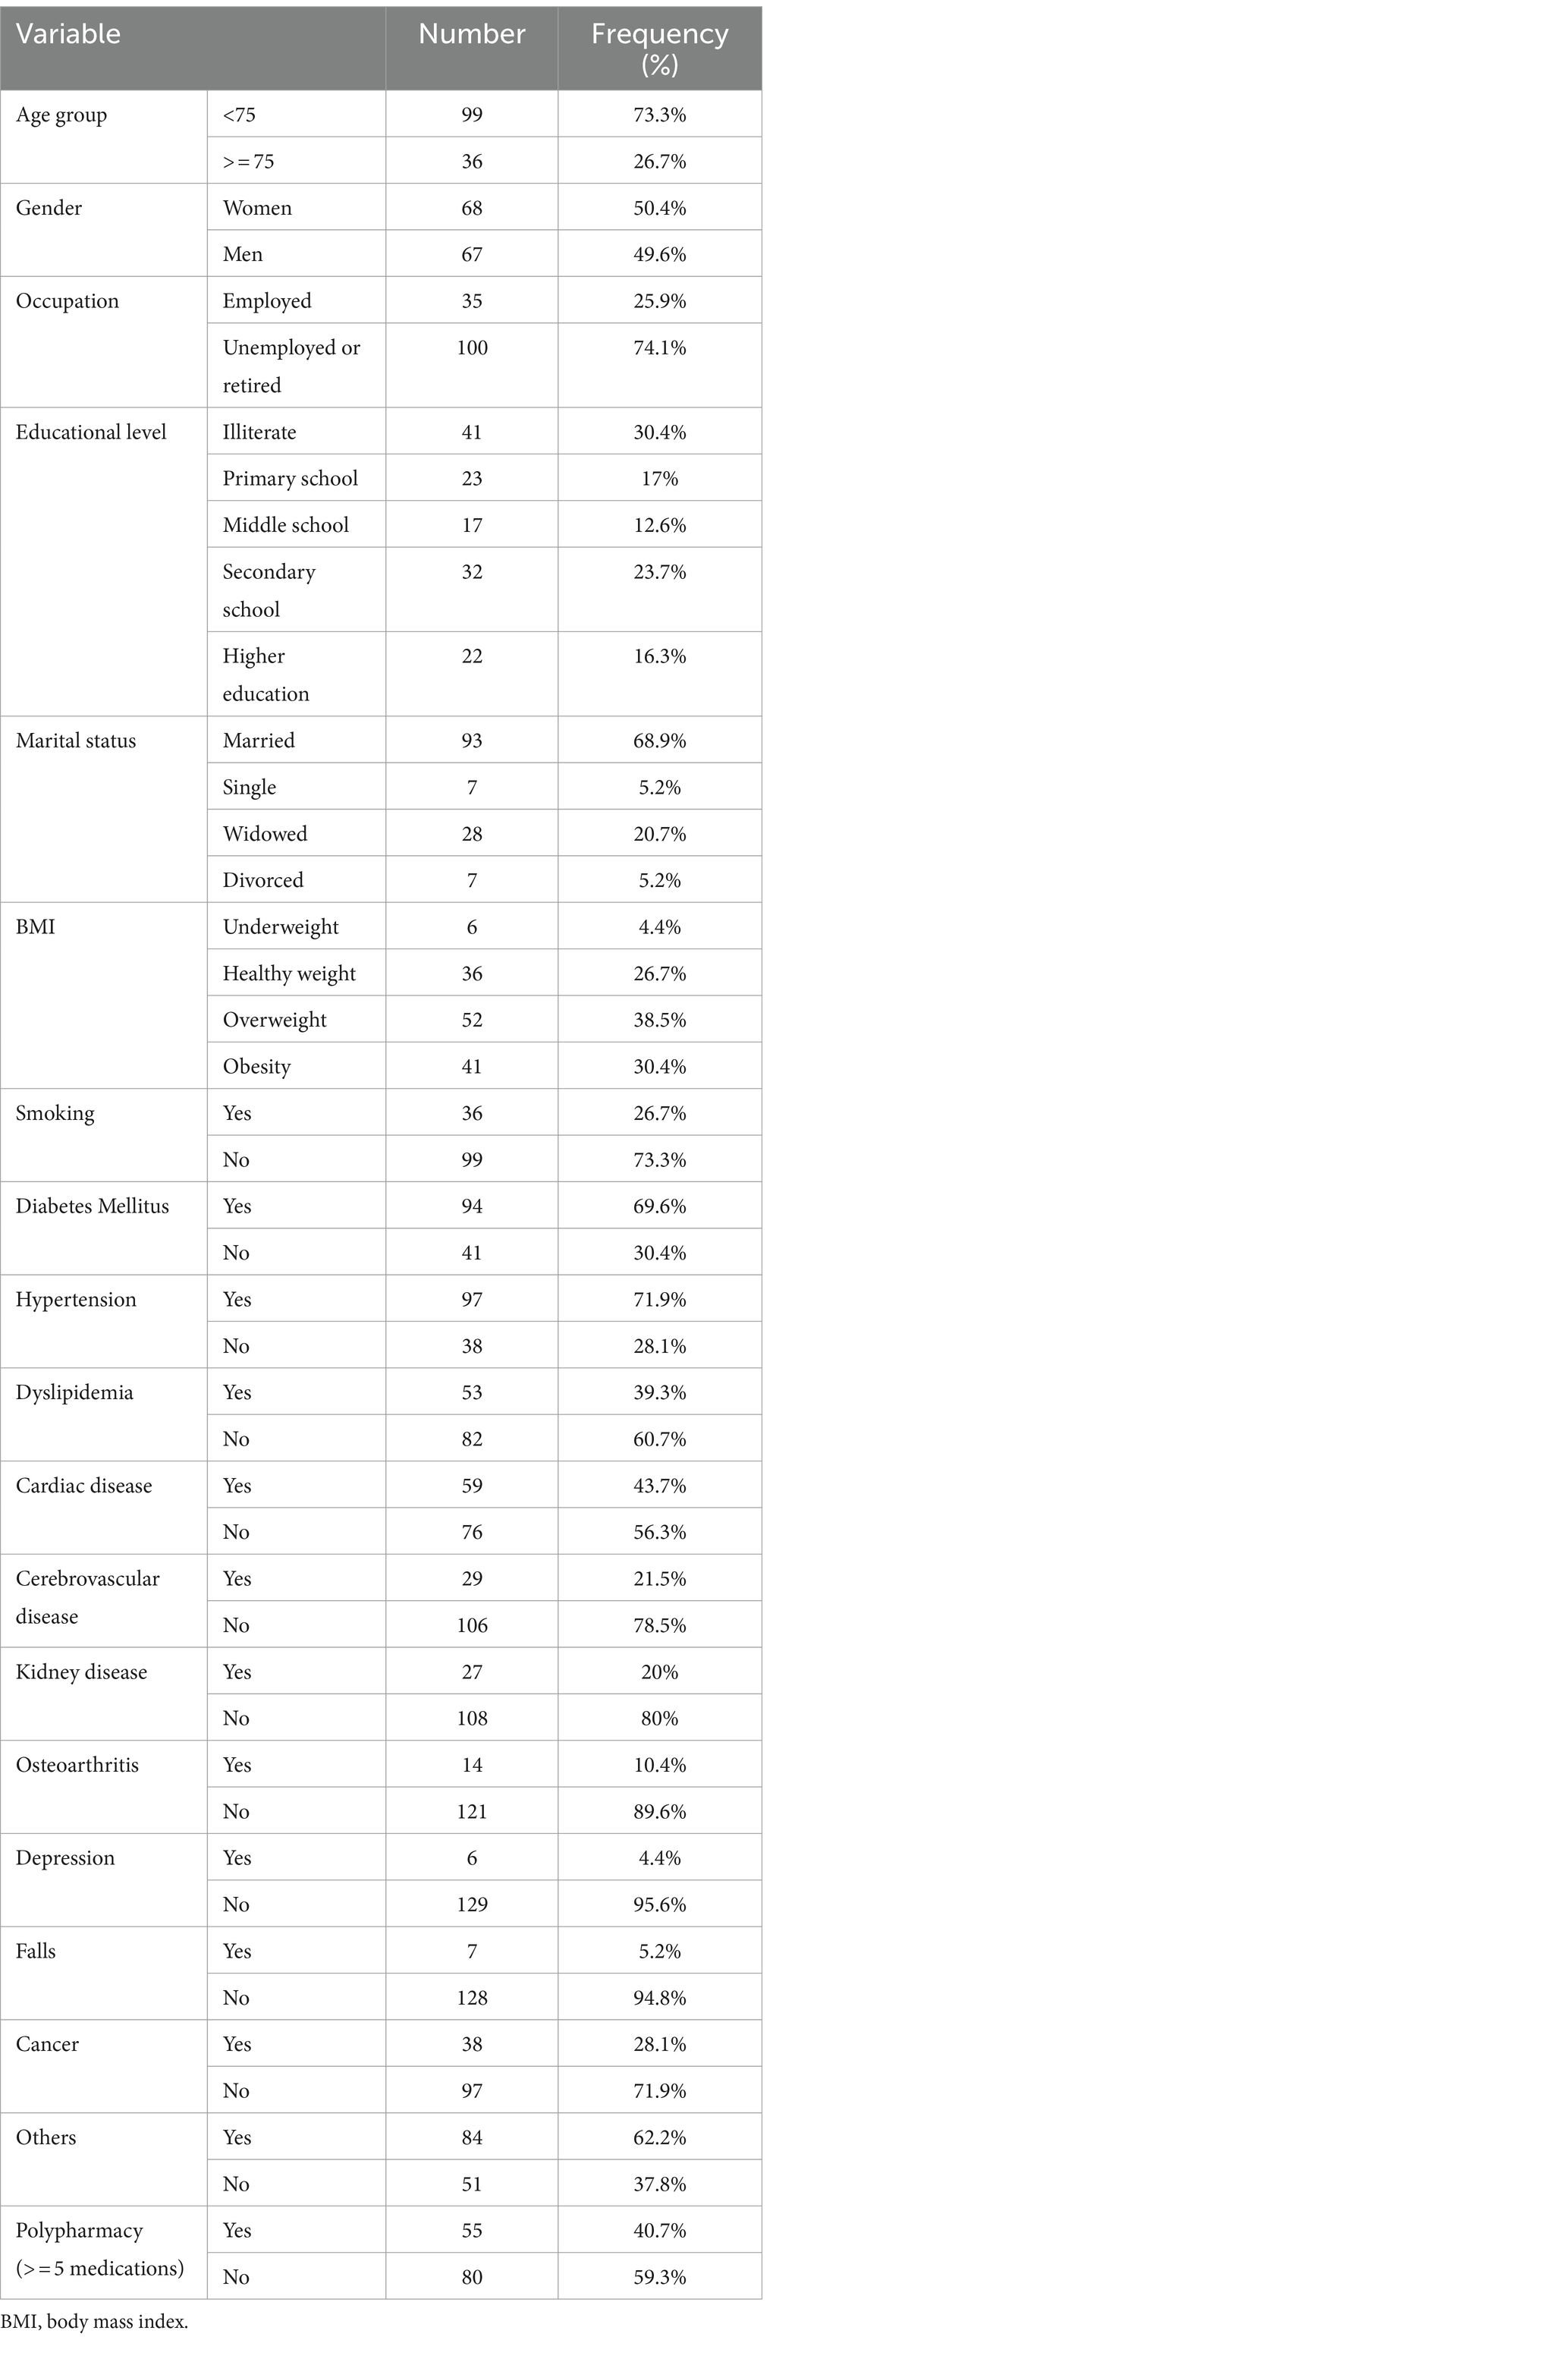
Table 1. Baseline characteristics of the study participants.
According to the MNA-SF classification, 14.1% (n = 19) of the study participants were malnourished, 37% (n = 50) were at risk of malnutrition, and 48.9% (n = 66) had normal nutritional status (Figure 1). The MNA-SF score did not differ significantly between men and women.
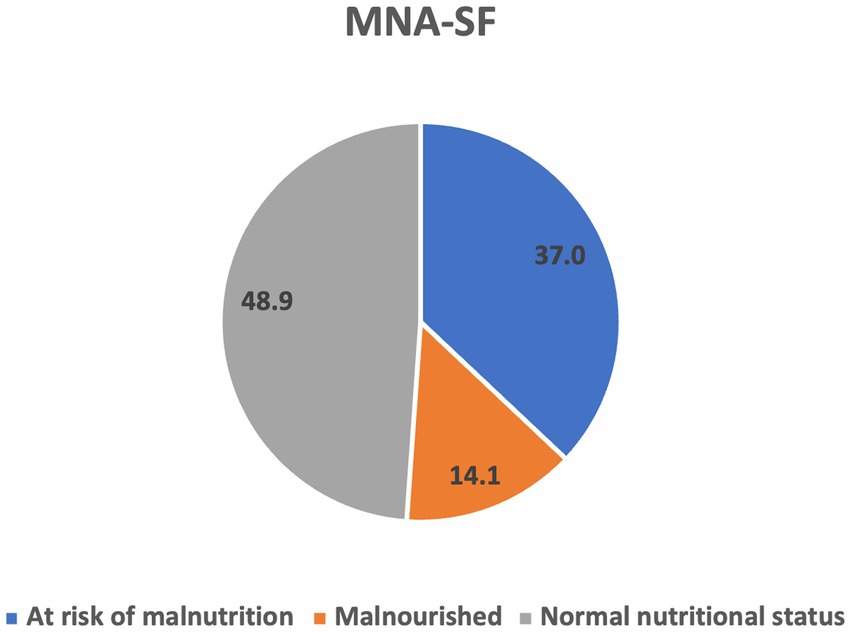
Figure 1. Nutritional status according to MNA-SF.
The average value of the strength of the handgrip was 17.027 kg in men and 10.625 kg in women. Low HGS was prevalent in 82.2% of the participants (Figure 2). There was a statistically significant difference in low HGS with respect to age group, occupation, and education level (p < 0.05). A higher percentage of those with low HGS had cardiac diseases compared to those with normal HGS (54 (48.6%) versus 5 (20.8%), p = 0.013). Similarly, a higher percentage of those with low HGS had kidney disease compared to those with normal HGS [26 (23.4%) versus 1 (4.16%), p = 0.045]. Among those who had normal HGS, 1 (4.16%) was malnourished, 7 (29.16%) were at risk of malnourished, and 16 (66.67%) had normal nutritional status. On the other hand, among those who had low HGS, 18 (16.22%) were malnourished, 43 (38.74%) were at risk of malnutrition, and 50 (45.05%) had normal nutrition status (Table 2).
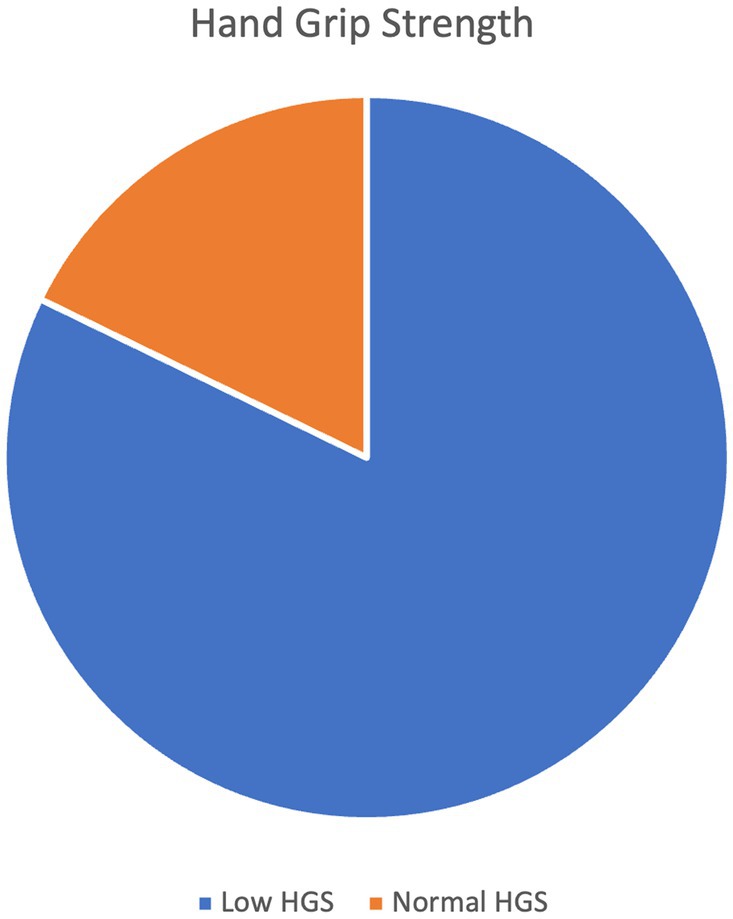
Figure 2. Hand grip strength (HGS).
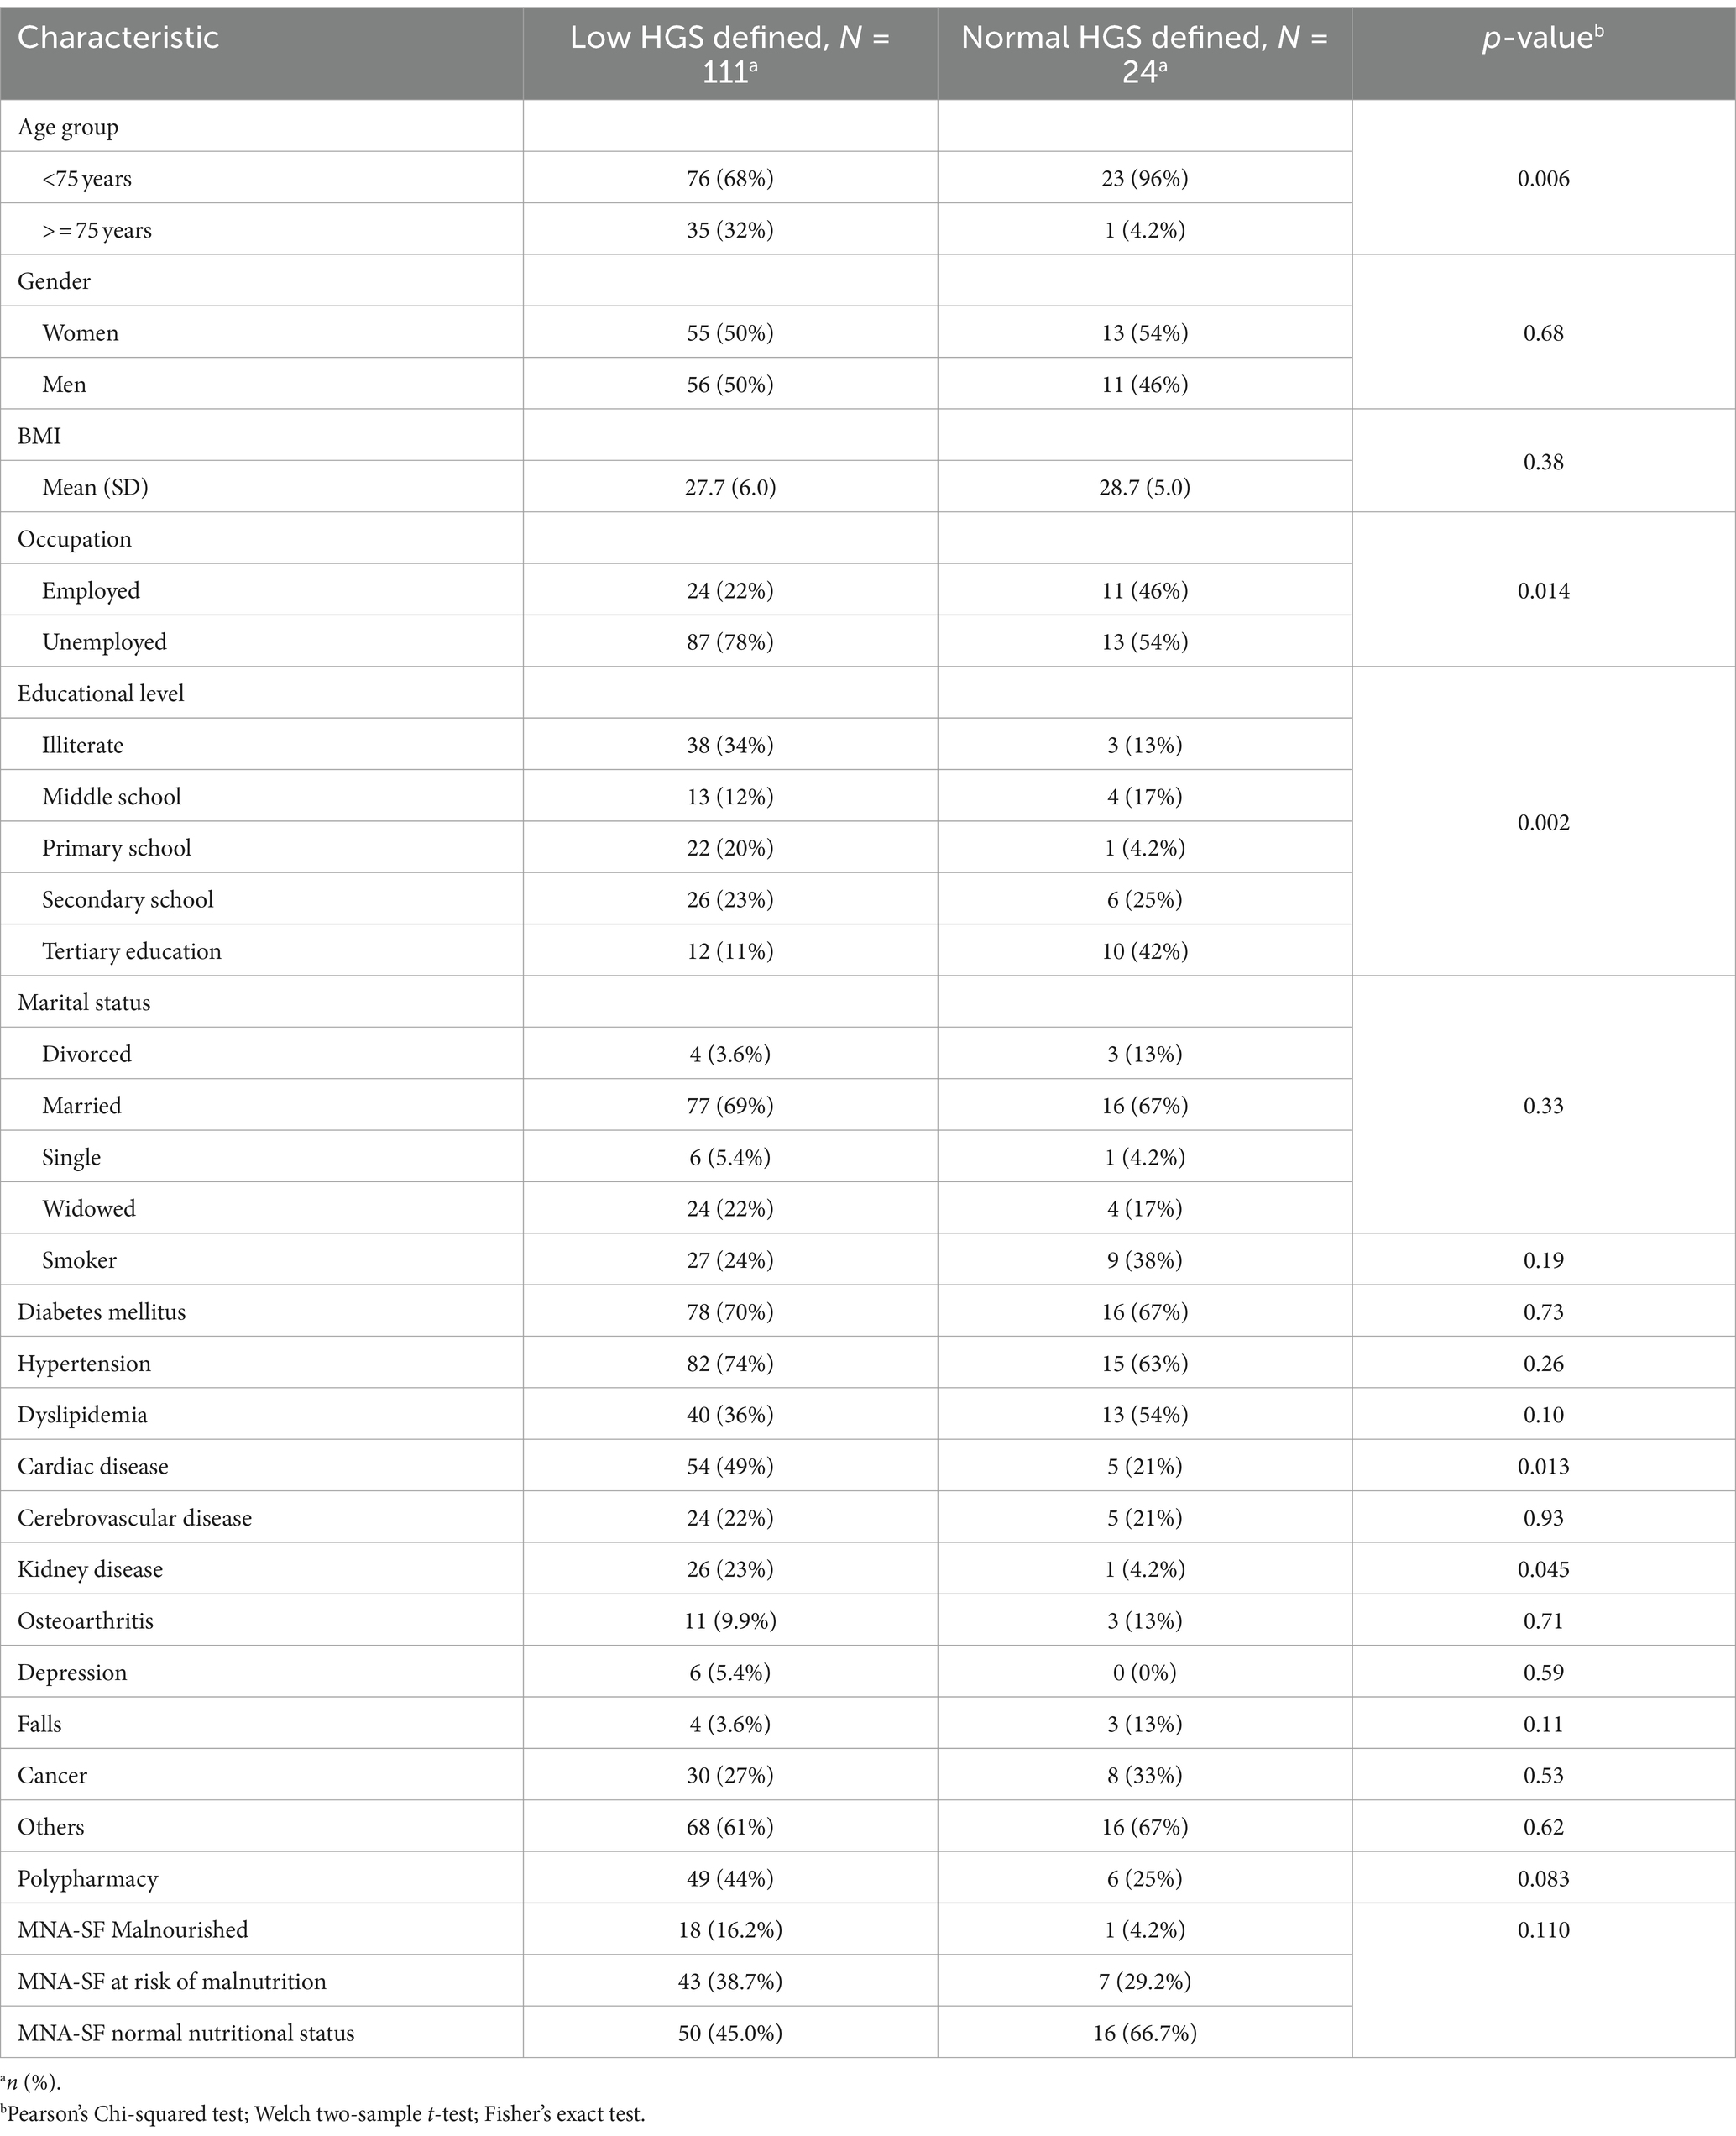
Table 2. The correlation between HGS and baseline characteristics.
In addition, the participants with low HGS had low hemoglobin levels (p < 0.001), low lymphocyte levels (p = 0.040), high creatinine levels (p = 0.004), high BUN levels (p = 0.007), high CRP levels (p = 0.007), high HbA1c levels (p = 0.029), and high vitamin B12 levels (p = 0.042) (Table 3).
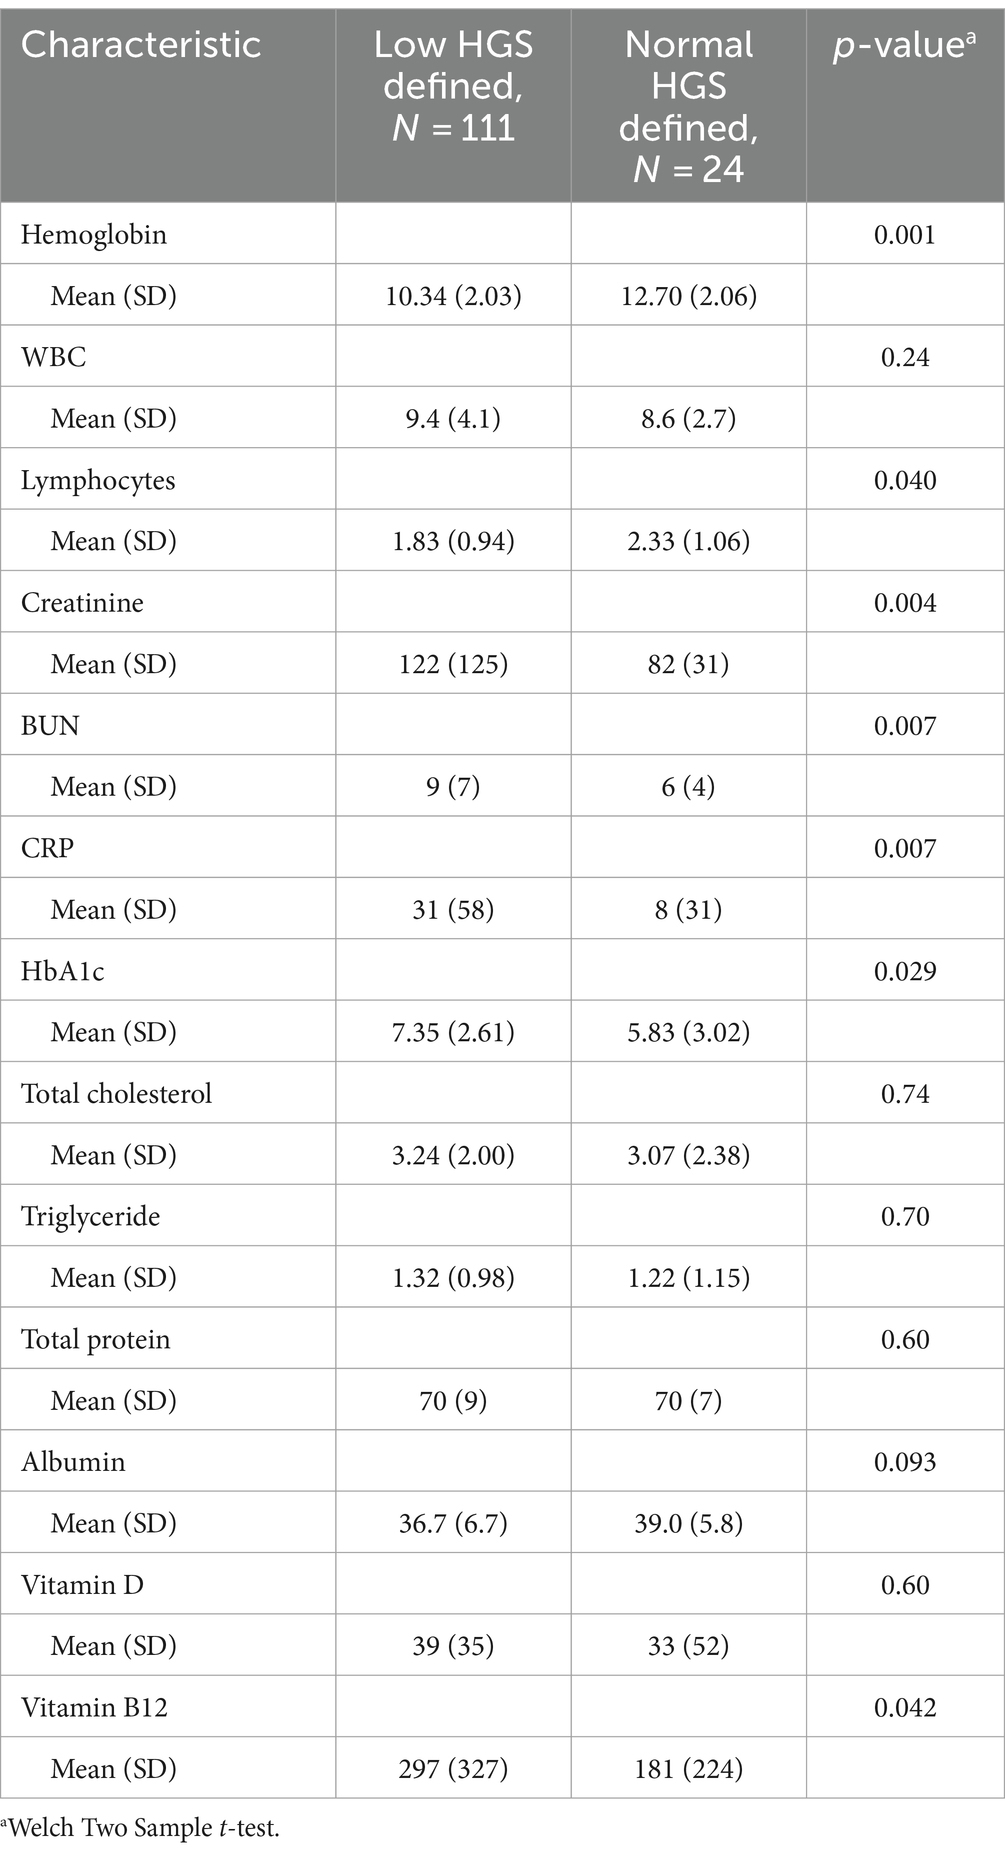
Table 3. The correlation between HGS and biochemical markers.
Logistic regression analysis showed that age, hemoglobin level, and HbA1C were independently associated with low HGS. Age above 75 years was associated with a high risk of low HGS, with an odds ratio of 20.47 (95% CI: 3.006–447.0, p = 0.011). High hemoglobin was inversely associated with low HGS, with an odds ratio of 0.526 for each unit increase (95%CI: 0.364–0.706, p < 0.001). High HbA1C levels were also associated with a high risk of low HGS, with an odds ratio of 1.324 for each unit increase (95%CI, 1.084–1.677, p = 0.011) (Table 4).
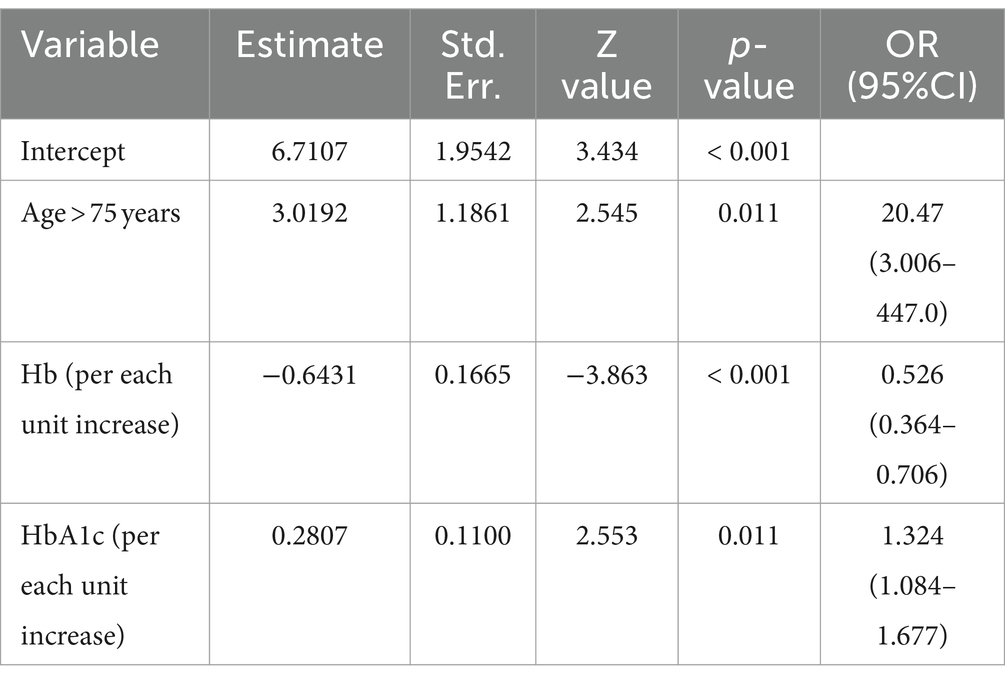
Table 4. Parameter estimates and odds ratio of factors associated with low HGS.
ROC curve analysis was performed to examine the sensitivity and specificity of the observed HGS and nutritional status. An HGS () score of 27 for men showed a sensitivity of 93.75% and a specificity of 22.6% to detect malnourished or at risk of malnourished participants. ROC analysis showed an area under the curve of 70.8% (95%CI: 58.44–83.16%) (Figure 3). An HGS (kg) score of 16 for women showed a sensitivity of 86.5% and a specificity of 19.3% to detect malnourished or at risk of malnourished participants. ROC analysis showed an area under the curve of 59.9% (95%CI: 46.39–73.49%) (Figure 4).
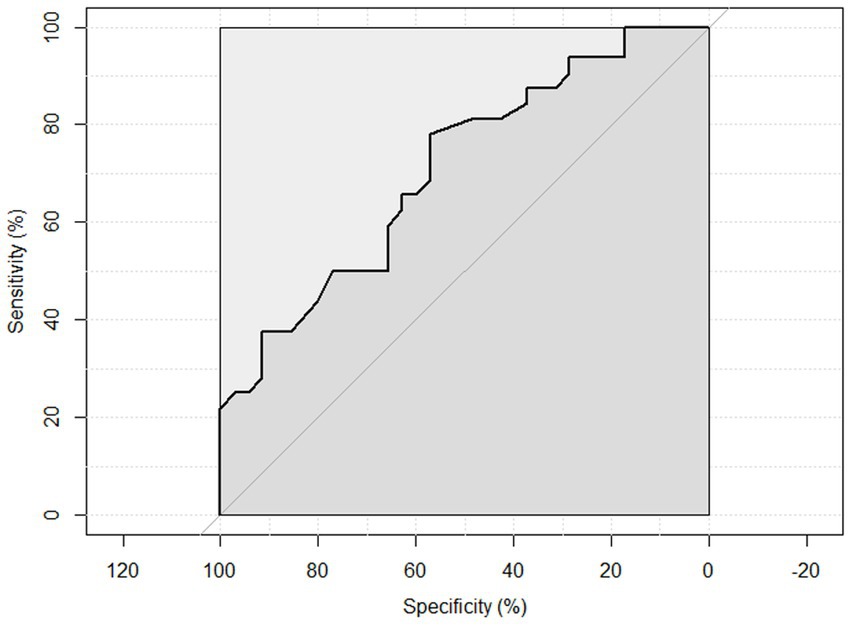
Figure 3. ROC curve of males to detect malnourished or at risk of malnourished using Hand Grip Strength Kg score.
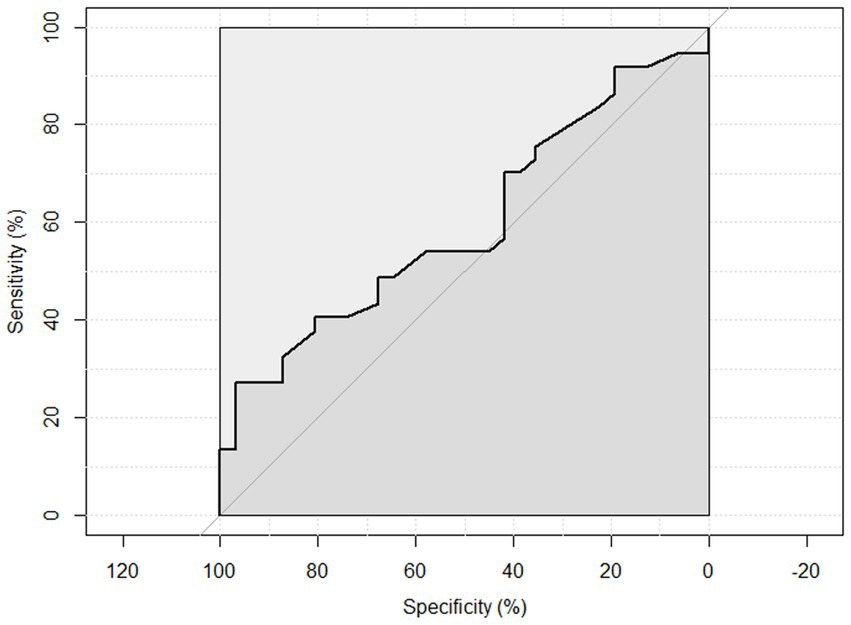
Figure 4. ROC curve of females to detect malnourished or at risk of malnourished using Hand Grip Strength Kg score.
An HGS (kg) score of 27 for men showed a sensitivity of 100 and a specificity of 17.6% to detect malnourished participants. ROC analysis showed an area under the curve of 71.3% (95%CI: 58.64–88.06%) (Figure 5). An HGS (kg) score of 16 for women showed a sensitivity of 87.5% and a specificity of 16.7% to detect malnourished participants. ROC analysis showed an area under the curve of 67.2% (95%CI: 44.79–89.68%) (Figure 6).
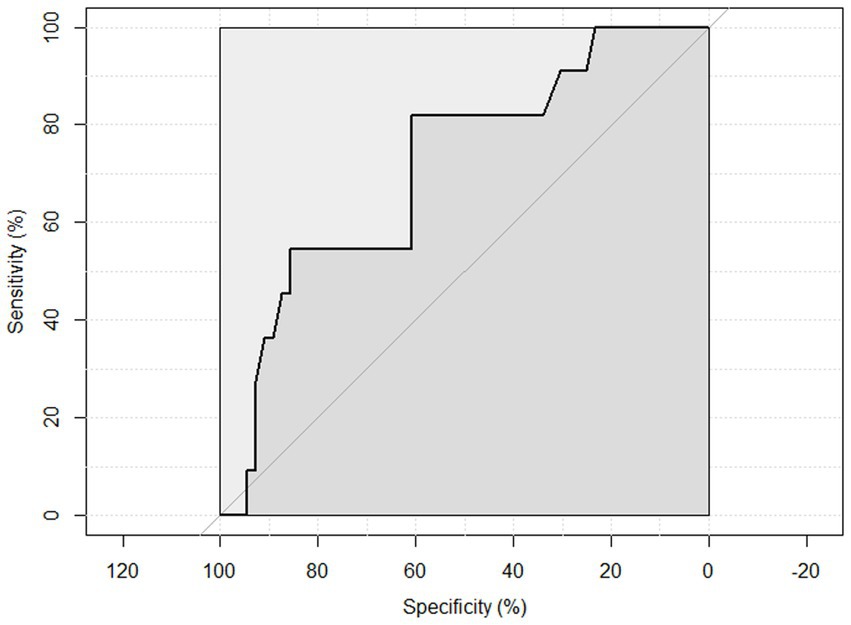
Figure 5. ROC curve of males to detect malnourished using Hand Grip Strength Kg score.
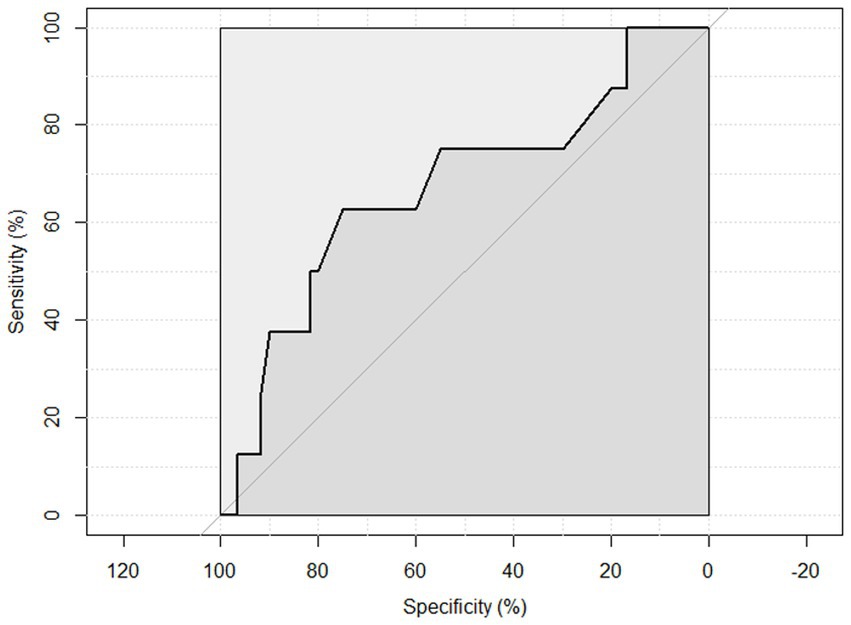
Figure 6. ROC curve of females to detect malnourished using Hand Grip Strength Kg score.
This study was conducted to estimate the correlation between HGS and nutritional status. Patients with low HGS on assessment had lower MNA-SF scores than those with normal HGS. This correlation has been confirmed in previous studies (12–14). Norman et al. also identified malnutrition as an independent risk factor for reduced muscle strength (7). Thus, there is a bidirectional relationship between HGS and nutritional status.
Our study identified lower HGS as a significant risk factor for both cardiac (p = 0.01) and kidney (p = 0.045) diseases. Low HGS has been found to increase the risk of cardiovascular mortality and cardiovascular events (15, 16). This link between HGS and cardiovascular outcomes can be attributed to a variety of possible explanations. People with a lower HGS may be generally less healthy than those with a higher HGS (17). Moreover, higher strength levels are often linked to engagement in resistance training, which, in turn, is associated with a reduced cardiovascular disease (CVD) risk score (18).
Our study also determined advancing age as an independent risk factor for low HGS in hospitalized older men and women (p = 0.006). This is in line with previous studies (19–21).
In addition, reduced HGS was strongly correlated with lower Hb levels (p < 0.05). According to Sutandyo et al. (21) and Gi et al. (22), a significant correlation between HGS and anemia was present in those over the age of 65 years. In the study by Hirani et al. (23), the decline in HGS in Australian older participants was directly related to the decline in Hb concentration. Pennix et al. (24) also reported that older participants with anemia had much lower HGS than those without anemia.
Furthermore, approximately 70% of our patients with low HGS had diabetes. Consequently, elevated levels of HbA1C were significantly correlated with low HGS. According to Mainous et al. (25) low HGS was associated with undiagnosed and diagnosed diabetes and hypertension, even among individuals with a healthy BMI. Similar findings were also reported by de Carvalho e Silva et al. (26), who identified incrementally lower grip strength in individuals with diabetes and osteoarthritis.
In our study, we observed a high sensitivity of HGS in detecting malnutrition among hospitalized older adults. However, its sensitivity was significantly low. This finding substantiates the hypothesis that HGS alone may not be sufficient for diagnosing malnutrition in this patient group.
The limited number of our participants diagnosed with malnutrition (n = 19) likely influenced this finding (19). Additionally, the cut-off points chosen for HGS measurement in this study may not have been optimized for our population and could have influenced the specificity of our results (19). White et al. (6) argued against the applicability of reduced HGS in cases of moderate malnutrition, highlighting potential limitations in its diagnostic utility. In addition, Norman et al. (7) suggested that in older individuals, muscle strength may serve as a marker of frailty rather than nutritional status. Moreover, factors such as the underlying causes of malnutrition and the duration of malnutrition could have influenced the variability in HGS measurements (19).
There were several limitations to our study. First, the relatively modest sample size could potentially reduce the generalizability of our findings. Second, the lack of consensus on HGS assessment protocols in the literature is likely associated with an increased probability of intra- and inter-test reliability. Third, the reliance on HGS cut-offs established by the European Working Group on Sarcopenia in Older People-2 (EWGSOP2), where low grip strength is defined as <16 kg for women and < 27 kg for men, may not be applicable to our population in Saudi Arabia and might have impacted the sensitivity and specificity results (27). Finally, several confounding factors, such as type of medications, socioeconomic status, and dietary habits, could influence both HGS and nutritional status, and these factors were not evaluated or analyzed in this study.
In our study, age above 75 years, low hemoglobin, and high HbA1C levels were independent risk factors for low HGS. Although low HGS showed high sensitivity in detecting malnourished individuals or those at risk of malnutrition, its specificity was low. Thus, relying solely on HGS may not suffice for assessing the nutritional status of hospitalized older adults. Replication of this study using locally reliable and validated HGS cut-off values for the Saudi population is warranted to confirm our findings.
The raw data supporting the conclusions of this article will be made available by the authors, without undue reservation.
The studies involving humans were approved by Research Ethics Committee (REC) of King Abdulaziz University. The studies were conducted in accordance with the local legislation and institutional requirements. The participants provided their written informed consent to participate in this study.
SA: Writing – review & editing, Supervision, Project administration, Methodology, Formal analysis, Conceptualization. MS: Writing – original draft, Validation, Resources, Formal analysis, Data curation.
The author(s) declare that no financial support was received for the research, authorship, and/or publication of this article.
The authors declare that the research was conducted in the absence of any commercial or financial relationships that could be construed as a potential conflict of interest.
All claims expressed in this article are solely those of the authors and do not necessarily represent those of their affiliated organizations, or those of the publisher, the editors and the reviewers. Any product that may be evaluated in this article, or claim that may be made by its manufacturer, is not guaranteed or endorsed by the publisher.
1. Cederholm, T, Barazzoni, R, Austin, P, Ballmer, P, Biolo, G, Bischoff, SC, et al. ESPEN guidelines on definitions and terminology of clinical nutrition. Clin Nutr. (2017) 36:49–64. doi: 10.1016/j.clnu.2016.09.004
2. Leij-Halfwerk, S, Verwijs, MH, van Houdt, S, Borkent, JW, Guaitoli, PR, Pelgrim, T, et al. Prevalence of protein-energy malnutrition risk in European older adults in community, residential and hospital settings, according to 22 malnutrition screening tools validated for use in adults ≥65 years: a systematic review and meta-analysis. Maturitas. (2019) 126:80–9. doi: 10.1016/j.maturitas.2019.05.006
3. Correia, MITD, and Waitzberg, DL. The impact of malnutrition on morbidity, mortality, length of hospital stay and costs evaluated through a multivariate model analysis. Clin Nutr. (2003) 22:235–9. doi: 10.1016/s0261-5614(02)00215-7
4. Bellanti, F, Lo Buglio, A, Quiete, S, and Vendemiale, G. Malnutrition in hospitalized old patients: screening and diagnosis, clinical outcomes, and management. Nutrients. (2022) 14:910. doi: 10.3390/nu14040910
5. Sánchez-Rodríguez, D, Marco, E, Ronquillo-Moreno, N, Maciel-Bravo, L, Gonzales-Carhuancho, A, Duran, X, et al. ASPEN-AND-ESPEN: a postacute-care comparison of the basic definition of malnutrition from the American Society of Parenteral and Enteral Nutrition and academy of nutrition and dietetics with the European Society for Clinical Nutrition and Metabolism definition. Clin Nutr. (2019) 38:297–302. doi: 10.1016/j.clnu.2018.01.017
6. White, JV, Guenter, P, Jensen, G, Malone, A, and Schofield, M. Consensus statement: academy of nutrition and dietetics and American Society for Parenteral and Enteral Nutrition: characteristics recommended for the identification and documentation of adult malnutrition (undernutrition). JPEN. (2012) 36:275–83. doi: 10.1177/0148607112440285
7. Norman, K, Stobäus, N, Gonzalez, MC, Schulzke, J, and Pirlich, M. Hand grip strength: outcome predictor and marker of nutritional status. Clin Nutr. (2011) 30:135–42. doi: 10.1016/j.clnu.2010.09.010
8. Rubenstein, LZ, Harker, JO, Salvà, A, Guigoz, Y, and Vellas, B. Screening for undernutrition in geriatric practice: developing the short-form mini-nutritional assessment (MNA-SF). J Gerontol A Biol Sci Med Sci. (2001) 56:M366–72. doi: 10.1093/gerona/56.6.m366
9. Kaiser, MJ, Bauer, JM, Ramsch, C, Uter, W, Guigoz, Y, Cederholm, T, et al. Validation of the Mini nutritional assessment short-form (MNA-SF): a practical tool for identification of nutritional status. J Nutr Health Aging. (2009) 13:782–8. doi: 10.1007/s12603-009-0214-7
10. Mac Dermid, J, Solomon, G, and Valdes, K. Clinical assessment recommendations. Mount Laurel, NJ: American Society of Hand Therapists (2015).
11. Cruz-Jentoft, AJ, Bahat, G, Bauer, J, Boirie, Y, Bruyère, O, Cederholm, T, et al. Sarcopenia: revised European consensus on definition and diagnosis. Age Ageing. (2019) 48:16–31. doi: 10.1093/ageing/afy169
12. Zhang, XS, Liu, YH, Zhang, Y, Xu, Q, Yu, XM, Yang, XY, et al. Handgrip strength as a predictor of nutritional status in Chinese elderly inpatients at hospital admission. Biomed Environ Sci. (2017) 30:802–10. doi: 10.3967/bes2017.108
13. Flood, A, Chung, A, Parker, H, Kearns, V, and O'Sullivan, TA. The use of hand grip strength as a predictor of nutrition status in hospital patients. Clin Nutr. (2014) 33:106–14. doi: 10.1016/j.clnu.2013.03.003
14. Akbar, F, and Setiati, S. Correlation between hand grip strength and nutritional status in elderly patients. J Phys Conf. (2018) 1073:042032. doi: 10.1088/1742-6596/1073/4/042032
15. Silventoinen, K, Magnusson, PK, Tynelius, P, Batty, GD, and Rasmussen, F. Association of body size and muscle strength with incidence of coronary heart disease and cerebrovascular diseases: a population-based cohort study of one million Swedish men. Int J Epidemiol. (2009) 38:110–8. doi: 10.1093/ije/dyn231
16. Lopez-Jaramillo, P, Cohen, DD, Gómez-Arbeláez, D, Bosch, J, Dyal, L, Yusuf, S, et al. Association of handgrip strength to cardiovascular mortality in pre-diabetic and diabetic patients: a subanalysis of the ORIGIN trial. Int J Cardiol. (2014) 174:458–61. doi: 10.1016/j.ijcard.2014.04.013
17. Cheung, C, Nguyen, UD, Au, E, Tan, KC, and Kung, AW. Association of handgrip strength with chronic diseases and multimorbidity: a cross-sectional study. Age. (2013) 35:929–41. doi: 10.1007/s11357-012-9385-y
18. Balducci, S, Zanuso, S, Cardelli, P, Salvi, L, Mazzitelli, G, Bazuro, A, et al. Changes in physical fitness predict improvements in modifiable cardiovascular risk factors independently of body weight loss in subjects with type 2 diabetes participating in the Italian diabetes and exercise study (IDES). Diabetes Care. (2012) 35:1347–54. doi: 10.2337/dc11-1859
19. Wearing, J, Konings, P, Stokes, M, and de Bruin, ED. Handgrip strength in old and oldest old Swiss adults–a cross-sectional study. BMC Geriatr. (2018) 18:1–9. doi: 10.1186/s12877-018-0959-0
20. Ranganathan, VK, Siemionow, V, Sahgal, V, and Yue, GH. Effects of aging on hand function. J Am Geriatr Soc. (2001) 49:1478–84. doi: 10.1046/j.1532-5415.2001.4911240.x
21. Sutandyo, N, Rinaldi, I, Sari, NK, and Winston, K. Prevalence of Anemia and Factors Associated With Handgrip Strength in Indonesian Elderly Population. Cureus. (2022) 14:e25290. doi: 10.7759/cureus.25290
22. Gi, Y, Jung, B, Kim, K, Cho, J, and Ha, I. Low handgrip strength is closely associated with anemia among adults: a cross-sectional study using Korea National Health and nutrition examination survey (KNHANES). PLoS One. (2020) 15:e0218058. doi: 10.1371/journal.pone.0218058
23. Hirani, V, Naganathan, V, Blyth, F, le Couteur, DG, Seibel, MJ, Waite, LM, et al. Low hemoglobin concentrations are associated with sarcopenia, physical performance, and disability in older Australian men in cross-sectional and longitudinal analysis: the Concord health and ageing in men project. J Gerontol A Biol Sci Med Sci. (2016) 71:1667–75. doi: 10.1093/gerona/glw055
24. Penninx, BW, Pahor, M, Cesari, M, Corsi, AM, Woodman, RC, Bandinelli, S, et al. Anemia is associated with disability and decreased physical performance and muscle strength in the elderly. J Am GeriatrSoc. (2004) 52:719–24. doi: 10.1111/j.1532-5415.2004.52208.x
25. Mainous, AG, Tanner, RJ, Anton, SD, and Jo, A. Grip strength as a marker of hypertension and diabetes in healthy weight adults. Am J Prev Med. (2015) 49:850–8. doi: 10.1016/j.amepre.2015.05.025
26. de Carvalho e Silva, F, Jakimiu, FO, and Skare, TL. Diabetic hands: a study on strength and function. Diabetes Metab Syndr. (2014) 8:162–5. doi: 10.1016/j.dsx.2014.04.020
Keywords: handgrip strength, nutritional status, older adults, geriatric, Saudi Arabia
Citation: Alamri SH and Simbawa MM (2024) The clinical utility of handgrip strength as a malnutrition screening tool in hospitalized older adults: a cross-sectional study in Saudi Arabia. Front. Med. 11:1436977. doi: 10.3389/fmed.2024.1436977
Edited by:
Olivia Di Vincenzo, University of Naples Federico II, ItalyReviewed by:
Rosa Sammarco, University of Naples Federico II, ItalyCopyright © 2024 Alamri and Simbawa. This is an open-access article distributed under the terms of the Creative Commons Attribution License (CC BY). The use, distribution or reproduction in other forums is permitted, provided the original author(s) and the copyright owner(s) are credited and that the original publication in this journal is cited, in accordance with accepted academic practice. No use, distribution or reproduction is permitted which does not comply with these terms.
*Correspondence: Sultan H. Alamri, c2hhbGFtcmkxQGthdS5lZHUuc2E=
Disclaimer: All claims expressed in this article are solely those of the authors and do not necessarily represent those of their affiliated organizations, or those of the publisher, the editors and the reviewers. Any product that may be evaluated in this article or claim that may be made by its manufacturer is not guaranteed or endorsed by the publisher.
Research integrity at Frontiers
Learn more about the work of our research integrity team to safeguard the quality of each article we publish.