
95% of researchers rate our articles as excellent or good
Learn more about the work of our research integrity team to safeguard the quality of each article we publish.
Find out more
CORRECTION article
Front. Med. , 18 June 2024
Sec. Hematology
Volume 11 - 2024 | https://doi.org/10.3389/fmed.2024.1432559
 Beatrice Vione1†
 Giuseppe Ramacieri2†
 Giacomo Zavaroni1Angela Piano1Giorgia La Rocca1
 Maria Caracausi1Lorenza Vitale1
 Allison Piovesan1Caterina Gori1Gian Luca Pirazzoli3
 Pierluigi Strippoli1Guido Cocchi4
 Luigi Corvaglia2,4Chiara Locatelli4*
 Maria Chiara Pelleri1*
 Francesca Antonaros1
A corrigendum on
One-carbon pathway metabolites are altered in the plasma of subjects with Down syndrome: relation to chromosomal dosage
by Vione, B., Ramacieri, G., Zavaroni, G., Piano, A., La Rocca, G., Caracausi, M., Vitale, L., Piovesan, A., Gori, C., Pirazzoli, G. L., Strippoli, P., Cocchi, G., Corvaglia, L., Locatelli, C., Pelleri, M. C., and Antonaros, F. (2022). Front. Med. 9:1006891. doi: 10.3389/fmed.2022.1006891
In the published article, as published in Table 1, the order of magnitude of the S-adenosyl-methionine (SAM) concentration was μg/mL, according to the ELISA kit specifications. After the publication of the manuscript, we conducted further analysis on the same type of samples using an ELISA kit of a different brand and a control chromatographic technique, suggesting that there was an error in the magnitude declared by the provider of the kit originally used in this paper and that the correct unit of measurement was ng/mL for SAM concentration. This has also been confirmed by the review of biomedical literature related to expected values of SAM in the human plasma (1). Based on the convergence of the literature review, the re-test by a different ELISA kit and a further independent test by liquid chromatography with tandem mass spectrometry (LC-MS/MS), which may be the better choice to analyze these small molecules (2), we believe that bona fide measurement unit for SAM has to be intended in our manuscript as ng/mL and not as μg/mL. Therefore, we have corrected this unit in the various sections of the paper to ensure the reproducibility of our data, while informing the reader about the discrepancy with the assay specifications provided with the kit, which is in any case no longer available for commercial reasons. The corrected Table 1 and its caption appear below.
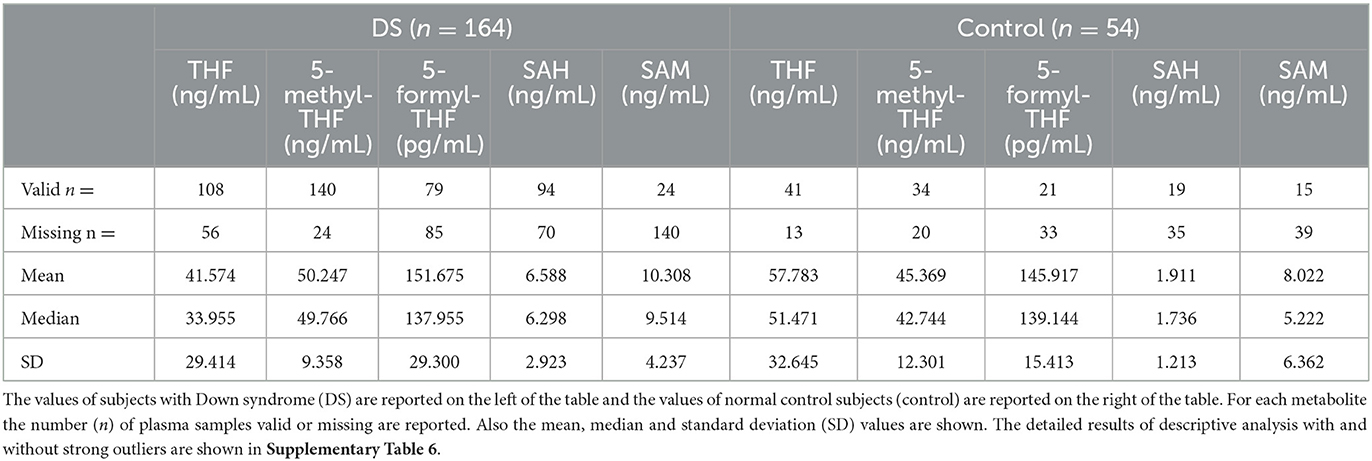
Table 1. Main results of descriptive analysis of DS and control group excluding strong outliers.
The authors apologize for this error and state that this does not change the scientific conclusions of the article in any way, due to the fact that we reported and discussed results based on Down syndrome to normal ratio, and the ratio between the values remains unchanged following the change of measurement unit.
In the published article, there was an error in Figure 2 as published. For the same reasons reported above, the order of magnitude of the SAM concentration has been changed from μg/mL to ng/mL. The corrected Figure 2 and its caption appear below.
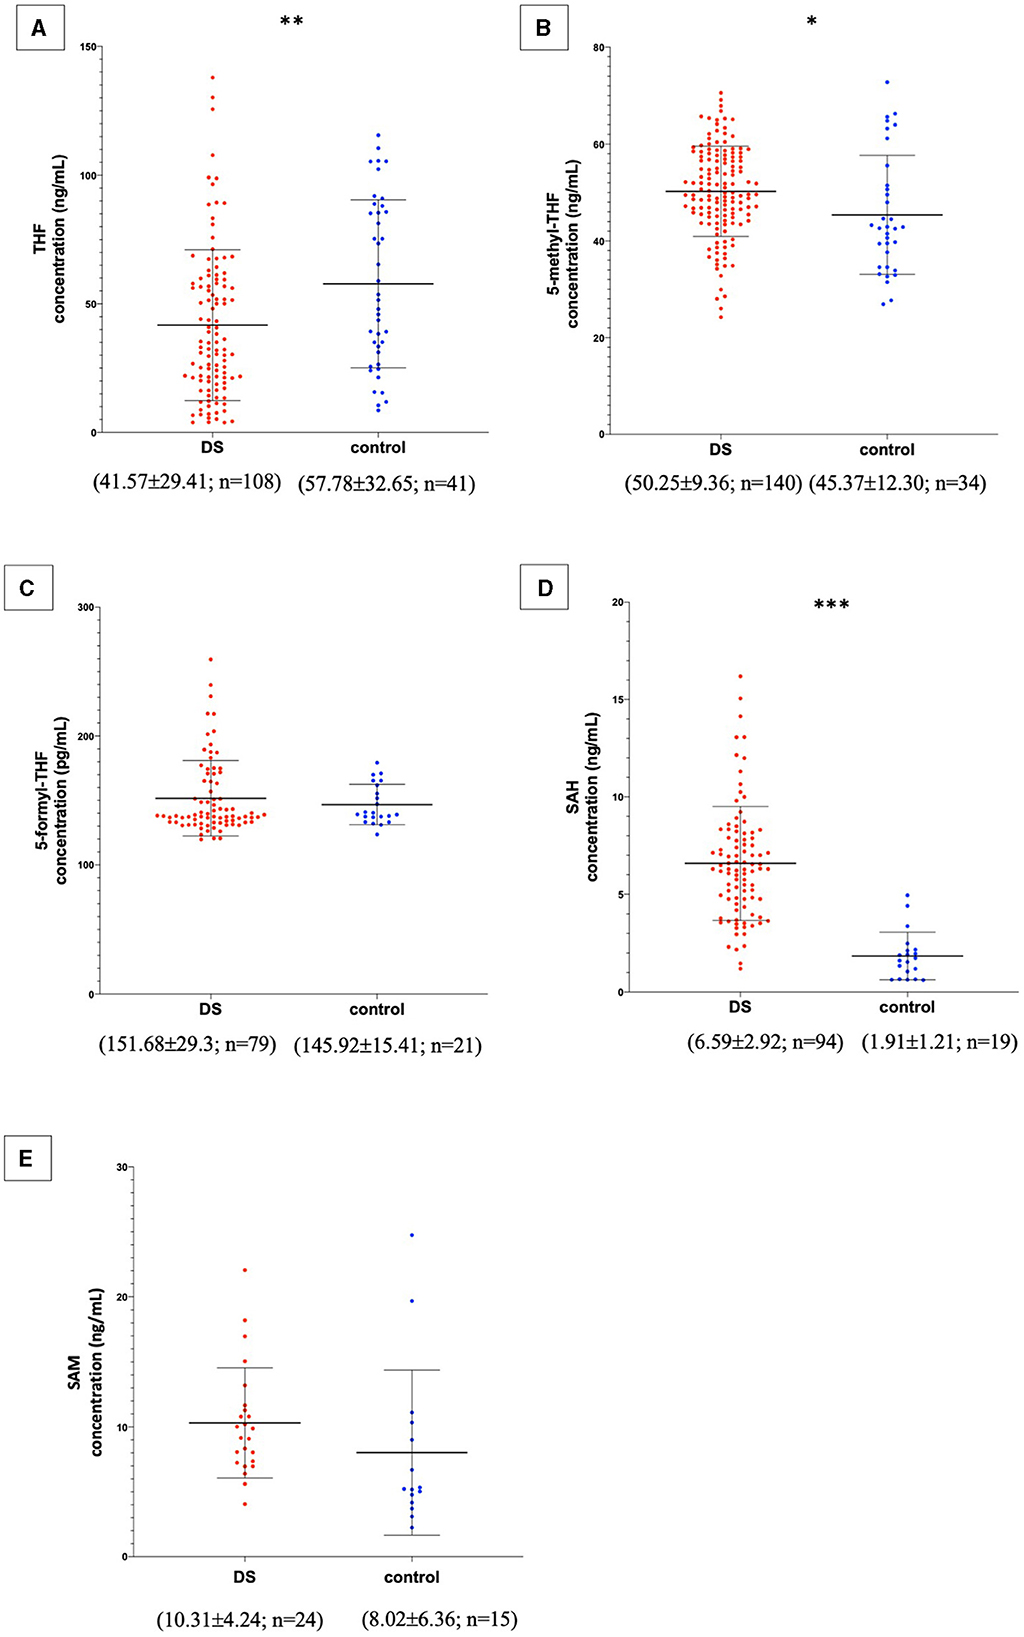
Figure 2. Metabolite concentrations in subjects with DS and normal control subjects. The graphs report metabolite plasma levels of each subject in the study. On the x-axis there is the subdivision of subjects in DS and control groups. Subjects with DS are represented like red dots and normal control subjects are represented like blue dots. On the y-axis the concentration of the metabolite in ng/mL or pg/mL is reported. The asterisks above the graph indicate the level of statistical significance (*p < 0.05; **p < 0.005; ***p < 0.0005). The middle black lines indicate the mean concentration values for each group and the external black lines indicate standard deviation (SD) values. The mean concentration, SD values and the number of subjects (n) are reported below each graph for DS and control groups. (A) shows THF concentrations; (B) shows 5-methyl-THF concentrations; (C) shows 5-formyl-THF concentrations excluding strong outliers; (D) shows SAH concentrations excluding strong outliers; (E) shows SAM concentrations. The graphs were created with GraphPad Prism software v.6.0 (San Diego, CA).
In the published article, in the Supplementary Tables 5, 6, 12, the order of magnitude of the SAM concentration has been changed from μg/mL to ng/mL, for the same reasons reported above. The corrected Supplementary Tables have been uploaded in the appropriate section of the online version of the paper, replacing the previous files.
The authors apologize for these errors and state that this does not change the scientific conclusions of the article in any way. The original article has been updated.
All claims expressed in this article are solely those of the authors and do not necessarily represent those of their affiliated organizations, or those of the publisher, the editors and the reviewers. Any product that may be evaluated in this article, or claim that may be made by its manufacturer, is not guaranteed or endorsed by the publisher.
1. Obeid R, Hartmuth K, Herrmann W, Gortner L, Rohrer TR, Geisel J, et al. Blood biomarkers of methylation in Down syndrome and metabolic simulations using a mathematical model. Mol Nutr Food Res. (2012) 56:1582–9. doi: 10.1002/mnfr.201200162
Keywords: trisomy 21, Down syndrome, one-carbon pathway, folates, chromosomal dosage
Citation: Vione B, Ramacieri G, Zavaroni G, Piano A, La Rocca G, Caracausi M, Vitale L, Piovesan A, Gori C, Pirazzoli GL, Strippoli P, Cocchi G, Corvaglia L, Locatelli C, Pelleri MC and Antonaros F (2024) Corrigendum: One-carbon pathway metabolites are altered in the plasma of subjects with Down syndrome: relation to chromosomal dosage. Front. Med. 11:1432559. doi: 10.3389/fmed.2024.1432559
Received: 16 May 2024; Accepted: 29 May 2024;
Published: 18 June 2024.
Edited and reviewed by: Sara Manti, University of Messina, Italy
Copyright © 2024 Vione, Ramacieri, Zavaroni, Piano, La Rocca, Caracausi, Vitale, Piovesan, Gori, Pirazzoli, Strippoli, Cocchi, Corvaglia, Locatelli, Pelleri and Antonaros. This is an open-access article distributed under the terms of the Creative Commons Attribution License (CC BY). The use, distribution or reproduction in other forums is permitted, provided the original author(s) and the copyright owner(s) are credited and that the original publication in this journal is cited, in accordance with accepted academic practice. No use, distribution or reproduction is permitted which does not comply with these terms.
*Correspondence: Chiara Locatelli, Y2hpYXJhLmxvY2F0ZWxsaUBhb3NwLmJvLml0; Maria Chiara Pelleri, bWFyaWFjaGlhcmEucGVsbGVyaTJAdW5pYm8uaXQ=
†These authors have contributed equally to this work and share first authorship
Disclaimer: All claims expressed in this article are solely those of the authors and do not necessarily represent those of their affiliated organizations, or those of the publisher, the editors and the reviewers. Any product that may be evaluated in this article or claim that may be made by its manufacturer is not guaranteed or endorsed by the publisher.
Research integrity at Frontiers
Learn more about the work of our research integrity team to safeguard the quality of each article we publish.