 Chaotian Luo1†
 Fei Peng1†
 Fengming Xu1†
 Cheng Tang1,2Yanyan Zhang1Chaojie Huang1Linlin Liang1Xiaojing Ning1Peng Peng1,2*
- 1Department of Radiology, The First Affiliated Hospital of Guangxi Medical University, Nanning, China
- 2NHC Key Laboratory of Thalassemia Medicine, Guangxi Medical University, Nanning, China
Background: CMRtools is a software package that can be used to measure T2* values to diagnose liver iron overload, however, its accuracy in terms is affected by multiple factors, including goodness-of-fit (R2 value), the number of echo time (TE) images, and the liver iron concentration (LIC). To investigate the effects of the R2 value, the number of TE images, and the LIC on the accuracy of CMRtools software for measuring T2* values to diagnose liver iron overload (LIO).
Materials and methods: CMRtools software was used to measure liver T2* values among 108 thalassemia patients via the truncation method, and the R2 values, the number of TE images, and T2* values were recorded. These values were subsequently converted into liver iron concentration (LICT) values. The LICF (derived from MRI-R2/FerriScan) was used as a reference, and the diagnostic accordance rate (DAR) was compared between R2 value subgroups, between TE image number subgroups, and between LIC subgroups.
Results: The greater the R2 value was, the greater the standardized DAR (SDAR) was (p < 0.05). The SDAR are not identical between each TE image number subgroup (p > 0.05). However, the relationship between TE image number subgroups and SDAR was analysed using Spearman’s correlation, and it was found to be positively correlated (rs = 0.729, p = 0.017). The SDAR are not identical between each LIC subgroup (p > 0.05), furthermore, the relationship between LIC subgroup and SDAR was found irrelevant (p = 0.747).
Conclusion: The accuracy of CMRtools software for diagnosing LIO in patients with thalassemia can be improved by artificially controlling the number of TE images to be fitted and selecting higher R2 values.
1 Introduction
Thalassemia is a group of inherited haemolytic anaemia disorders that are caused by deficiencies or insufficiencies in the synthesis of the globin chain (1). Iron overload of the organs—especially the liver—can occur due to increased intestinal absorption of iron in thalassemia patients due to ineffective haematopoiesis or due to the requirement for regular or irregular transfusion therapy (2, 3). Magnetic resonance imaging (MRI) is a sensitive and stable method for evaluating the liver iron concentration (LIC). Additionally, the use of relaxometry based on T2/R2 and T2*/R2* has been widely validated (4–6). A commercial method based on T2/R2 relaxometry (FerriScan. Resonance Health) was approved by the U.S. Food and Drug Administration (FDA) (7–9). However, T2*/R2* relaxometry is a more widely used method in clinical practice (10, 11), the reason for this phenomenon is that the T2*/R2* relaxometry has a shorter scanning time compared to T2/R2 relaxometry, the program is simple and inexpensive (12, 13).
CMRtools software (CMRtools/Thalassemia Tools, Cardiovascular Imaging Solutions, London, United Kingdom) is one of the most commonly used tools for measuring T2* in the clinic (14). This software used nonlinear least squares fitting to measure T2*. The measurement interface displays the goodness of fit (usually assessed using the R2 value) and the fit curve. The user can change the R2 value by the “truncation method” (15)—i.e., removing images with long TE (from large to small TE values), selecting the appropriate R2 value to determine the final T2* value, and converting the T2* value to the LICT according to the formula (16, 17). Nevertheless, when CMRtools are used to measure T2* values, factors such as the echo time, MR field strength, degree of LIC, image quality, and selection of the region of interest (ROI) may affect the accuracy of the measurements (18). The calculation of T2* value is based on the fitting of multiple TE signals, and the number of TEs affects the fitting (19). The decay rate of the T2* signal is positively correlated with the MR field strength and LIC (20), excessive signal decay could cause a large error in the calculated T2* value or even the inability to calculate (21). The poor quality of image may cause the ROI to contain non-hepatic tissue, thus affecting the judgment of the iron content of the liver parenchyma, etc. Thereby affecting the choice of clinical iron chelation treatment protocols, increasing the risk of organ function injury due to iron toxicity in patients with thalassemia, and potentially threatening the lives of these patients.
To date, few studies have comprehensively investigated the effect of CMRtools on the diagnosis of liver iron overload (LIO) in thalassemia patients. Thus, we used the CMRtools truncation method to obtain different R2 values, and we recorded the corresponding T2* values to further calculate the LICT, which was compared with the LICF (derived from MRI-R2/FerriScan) to explore the effects of R2 values, the number of TE images, and the LIC, so that assess the accuracy of CMRtools to diagnose LIO in thalassemia patients.
2 Materials and methods
2.1 Study participants
A retrospective cohort of 305 patients who underwent MRI to measure iron in the liver at our medical center between 1 January 2018 and 31 December 2022 was included. The inclusion criteria were as follows: (i) had a genetic diagnosis of thalassemia; (ii) had complete MRI-T2* sequence images; (iii) had MRI-R2/FerriScan LIC results; (iv) had a history of regular or irregular blood transfusion; and (v) had simultaneous MRI-T2* and MRI-R2/FerriScan scans performed using the same instrument. The exclusion criteria were as follows: (i) patients with chronic diseases of the liver, such as cirrhosis, hepatocellular carcinoma or liver-occupying lesions; and (ii) patients with significant artefacts on the image that affected the measurement. All patients (or their parents/guardians) provided written informed consent to participate in this study. The study was conducted in accordance with the principles of the Declaration of Helsinki and approved by the Ethics Committee (NO.2024-E196-01). Ultimately, 108 patients were included in this study (Table 1).
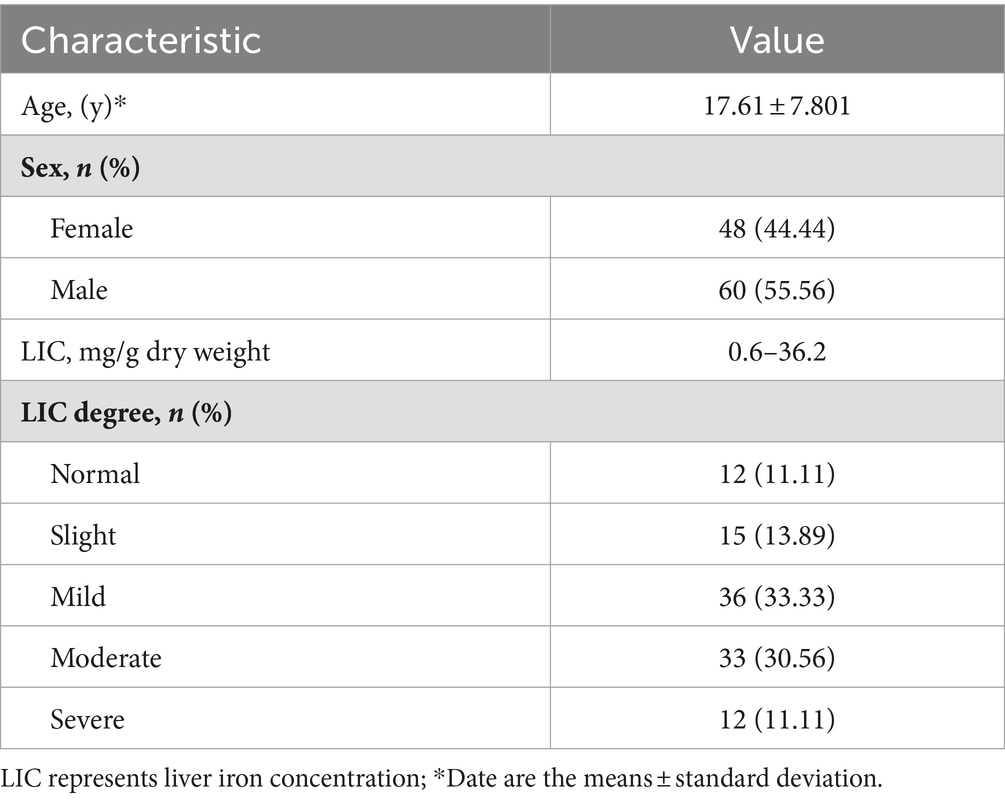
Table 1. Study participant characteristics of 108 patients.
2.2 MRI acquisition
Liver MRI was performed on a 1.5 T scanner (MAGNETOM Avanto Fit, Siemens Healthcare, Erlangen, Germany).
MRI-R2/FerriScan acquisition consisted of a free breathing 2D multi-slice spin-echo pulse sequence. The relevant pulse sequence parameters were as follows: flip angle = 90°; echo time (TE) = 6, 9, 12, 15, 18 ms; repetition time (TR) = 1,000 ms; FOV read = 400 mm × 400 mm; matrix = 256 mm × 256 mm; and 11 slices with a thickness of 5 mm. Each TE acquisition time was approximately 1 min 40 s or less, and if one of the TE image artefacts was too large, five TE were rescanned. A reference was placed within the scanning field of view, usually a bag of normal saline.
T2* data were acquired using a breath-hold multi-echo GRE scanning sequence at the same liver level as FerriScan acquisition with free breathing. The relevant pulse sequence parameters were as follows: flip angle = 20°; echo time (TE) = 1.29, 2.35, 3.43, 4.60, 5.68, 6.85, 7.93, 9.10, 10.18, 11.35, 12.43, 13.6 ms; repetition time (TR) = 200.00 ms; FOV read = 400 mm × 400 mm; matrix = 256 mm × 256 mm; slice thickness = 10 mm; and scan time about 15 s.
2.3 Data processing
The liver MRI-R2 images were subsequently sent to the Resonance Health Data Processing Centre for processing, after which a LICF report was obtained (Figure 1A). The T2* data were imported in DICOM format into a computer with CMRtools software installed, and a radiologist with more than 5 years of experience in using software features used the CMRtools/thalassemia tools function and referenced to the MRI-R2/FerriScan ROI to outline the T2* ROI while avoiding visible bile ducts and blood vessels. The number of TE images, the T2* value and the R2 value were measured and recorded using the truncation method (Figure 1B). Finally, the LICT was calculated by substituting the T2* value into Garbowski’s (16) formula. Garbowski’s formula is as follows:
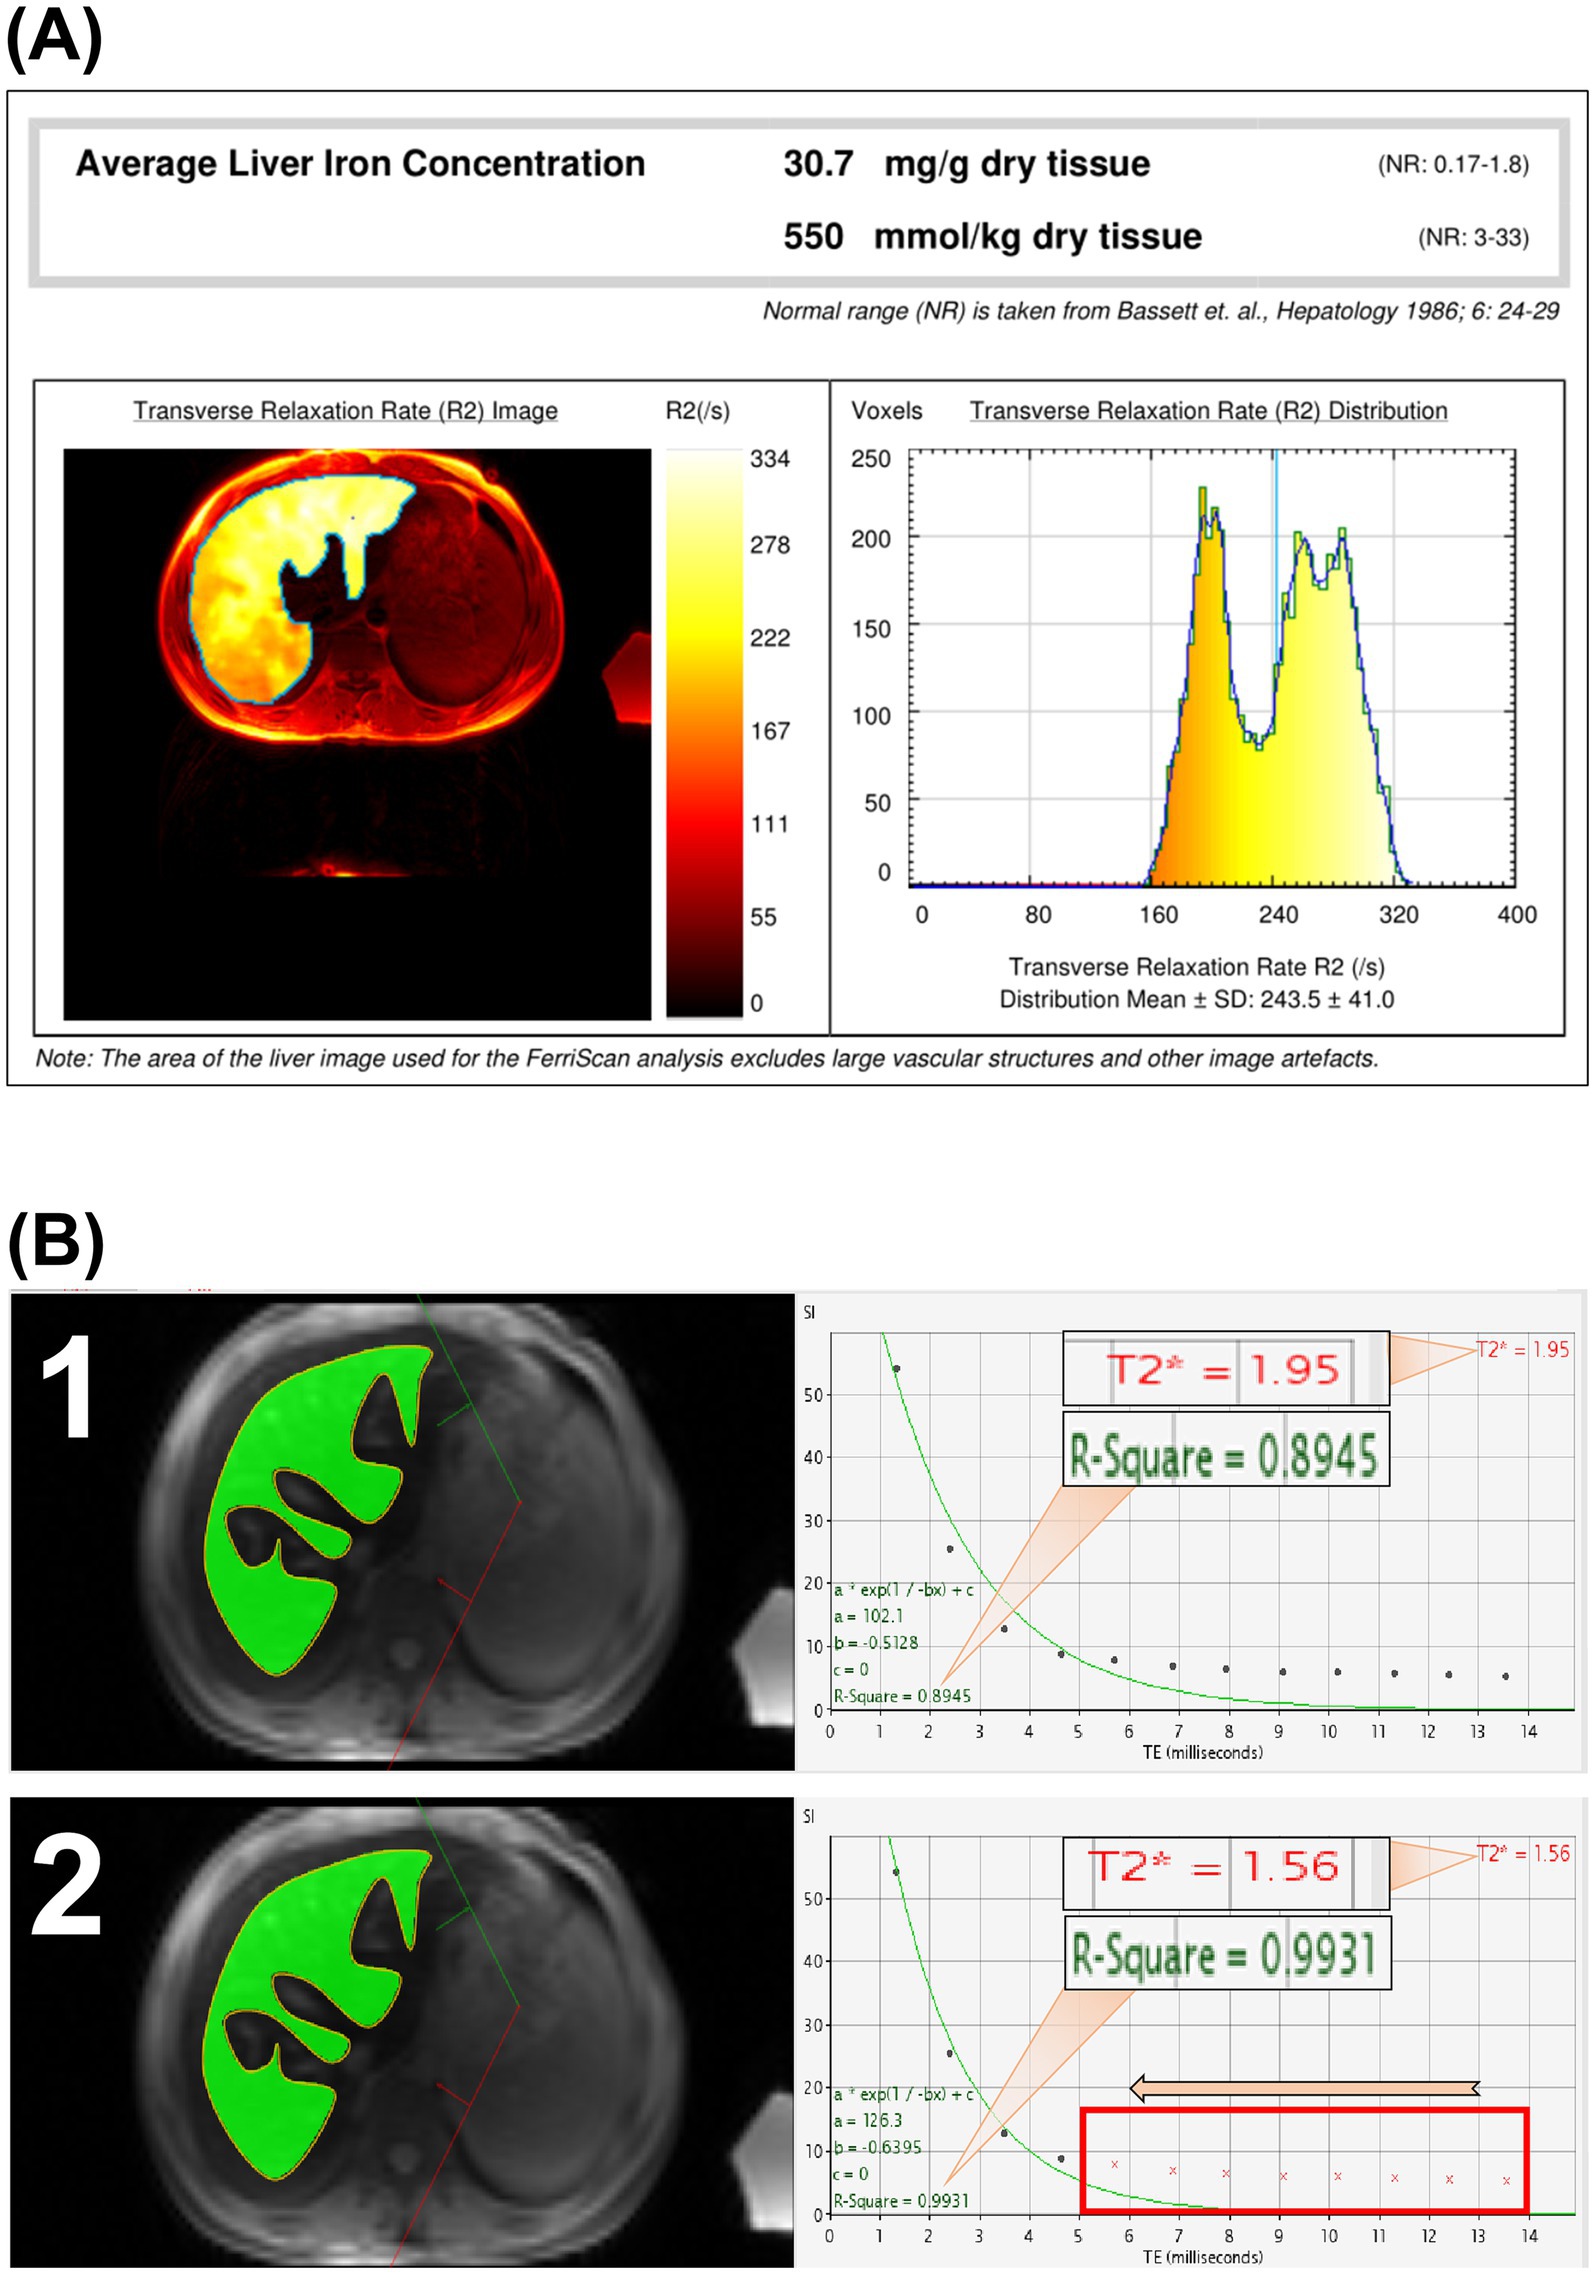
Figure 1. MRI-R2/FerriScan liver iron concentration report and schematic diagram of CMRtools measurements of liver iron concentration (LIC). Schematic diagram of LIC in an 18-year-old male patient with β-thalassemia major; the LICF was 30.7 mg/g dry weight (A). The number of TE images entering the measurement was 12, with a T2* of 1.95 ms and an R2 value of 0.8945 (B1), and the number of TE images with a large TE value of 6 was removed, resulting in the number of TE images entering the measurement being 4 (the red crosses in the box are the number of TE images removed), T2* is 1.56 ms, R2 value is 0.9931 (B2), and both the T2* values and R2 value changed.
where LIC is the liver iron concentration in mg/g dry weight, and the T2* value in ms. Groupings were made according to LIC (regardless of the method used to obtain LIC) and with reference to Reeder’s review (5) (Table 2). The R2 values from 0.9500 to 1.0000 were divided into 5 subgroups with a spacing of 0.01, and the number of TE images (ranging from 3 to 12) was divided into 10 subgroups.
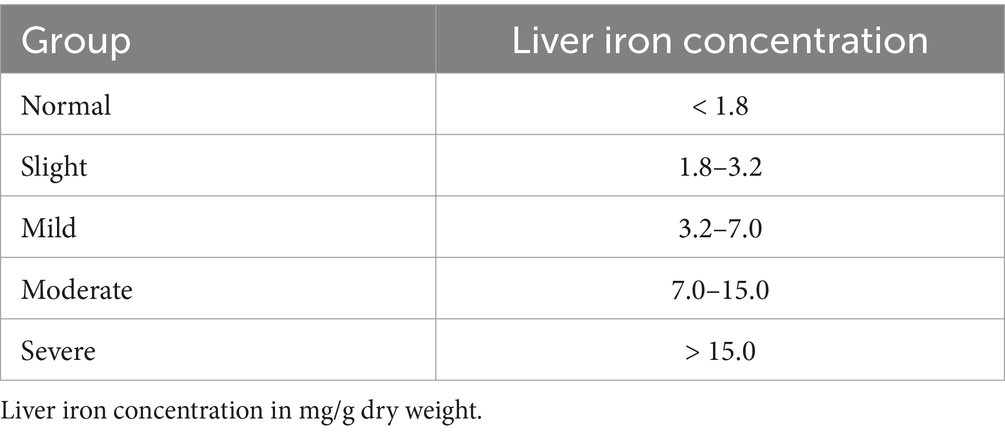
Table 2. The degree of liver iron concentration.
2.4 Statistics
Statistical analysis was performed using the SPSS 27.0 (IBM, Armonk, New York). The R2, T2*, and LICF values did not follow a normal distribution. The paired samples Wilcoxon signed rank test was used to explore the differences in these variables. A p value >0.05 indicated no statistically significant difference. The intraclass correlation coefficient (ICC) was used to evaluate the consistency level. An ICC > 0.75 and a p < 0.05 were considered to indicate a high degree of consistency. Spearman’s correlation analysis was used to examine correlations. Correlation coefficients were considered strong when |rs| > 0.75 and p < 0.05. LICT and LICF values were grouped and described using the number of patients, the percentage, and the constituent ratio.
The accuracy of the CMRtools software was assessed using the diagnostic accordance rate (DAR), which was calculated by comparing the LICF grade to the LICT grade, counting the number of correct patients with consistent grades, and then dividing the number of correct patients by the total number of analyses. This study focused on three variables; therefore, when analyzing the effect of one variable on the DAR, the other two variables were artificially fixed at the same level. When comparing the DARs of a subgroup, each subgroup contains two other variable subgroups with different constituent ratios. Therefore, the standardized diagnostic accordance rate (SDAR) was used for comparison. The SDAR was calculated via the direct method: (i) the patients in the same layer in each comparison subgroup were combined to determine the number of patients in the standard group; (ii) the original DAR for the same layer in each comparison subgroup was determined; and (iii) the values were inserted into Formula. The formula is as follows:
where p′ is the SDAR, N is the total number of cases in the standard group, Ni is the number of cases in a layer in the standard group, and pi is the original DAR in each layer in the comparison subgroup. Differences between the SDAR were assessed using the Wilcoxon test; for multiple independent SDAR, differences were assessed using the Kruskal Wallis H test, and p values were calibrated using Bonferroni’s method when making multiple two-by-two comparisons.
3 Results
3.1 Analysis of measurement data
A total of 108 patients were obtained using a truncation method of 1,080 R2 values and 1,080 T2* values, and 1,069 patients were obtained after excluding those whose R2 values were less than 0.95 (see Figure 2). Thirty-five percent of the data were randomly selected for reliability analyses between measurements by different measurers and between measurements by the same measurer at different times (2-week intervals) using the blinded method, resulting in Z = −0.047 (p = 0.963) and ICC = 0.991 (p < 0.001), indicating a high degree of consistency. The results of the analyses across different measurers were Z = −0.130 (p = 0.897) and ICC = 0.992 (p < 0.001), indicating a high degree of consistency.
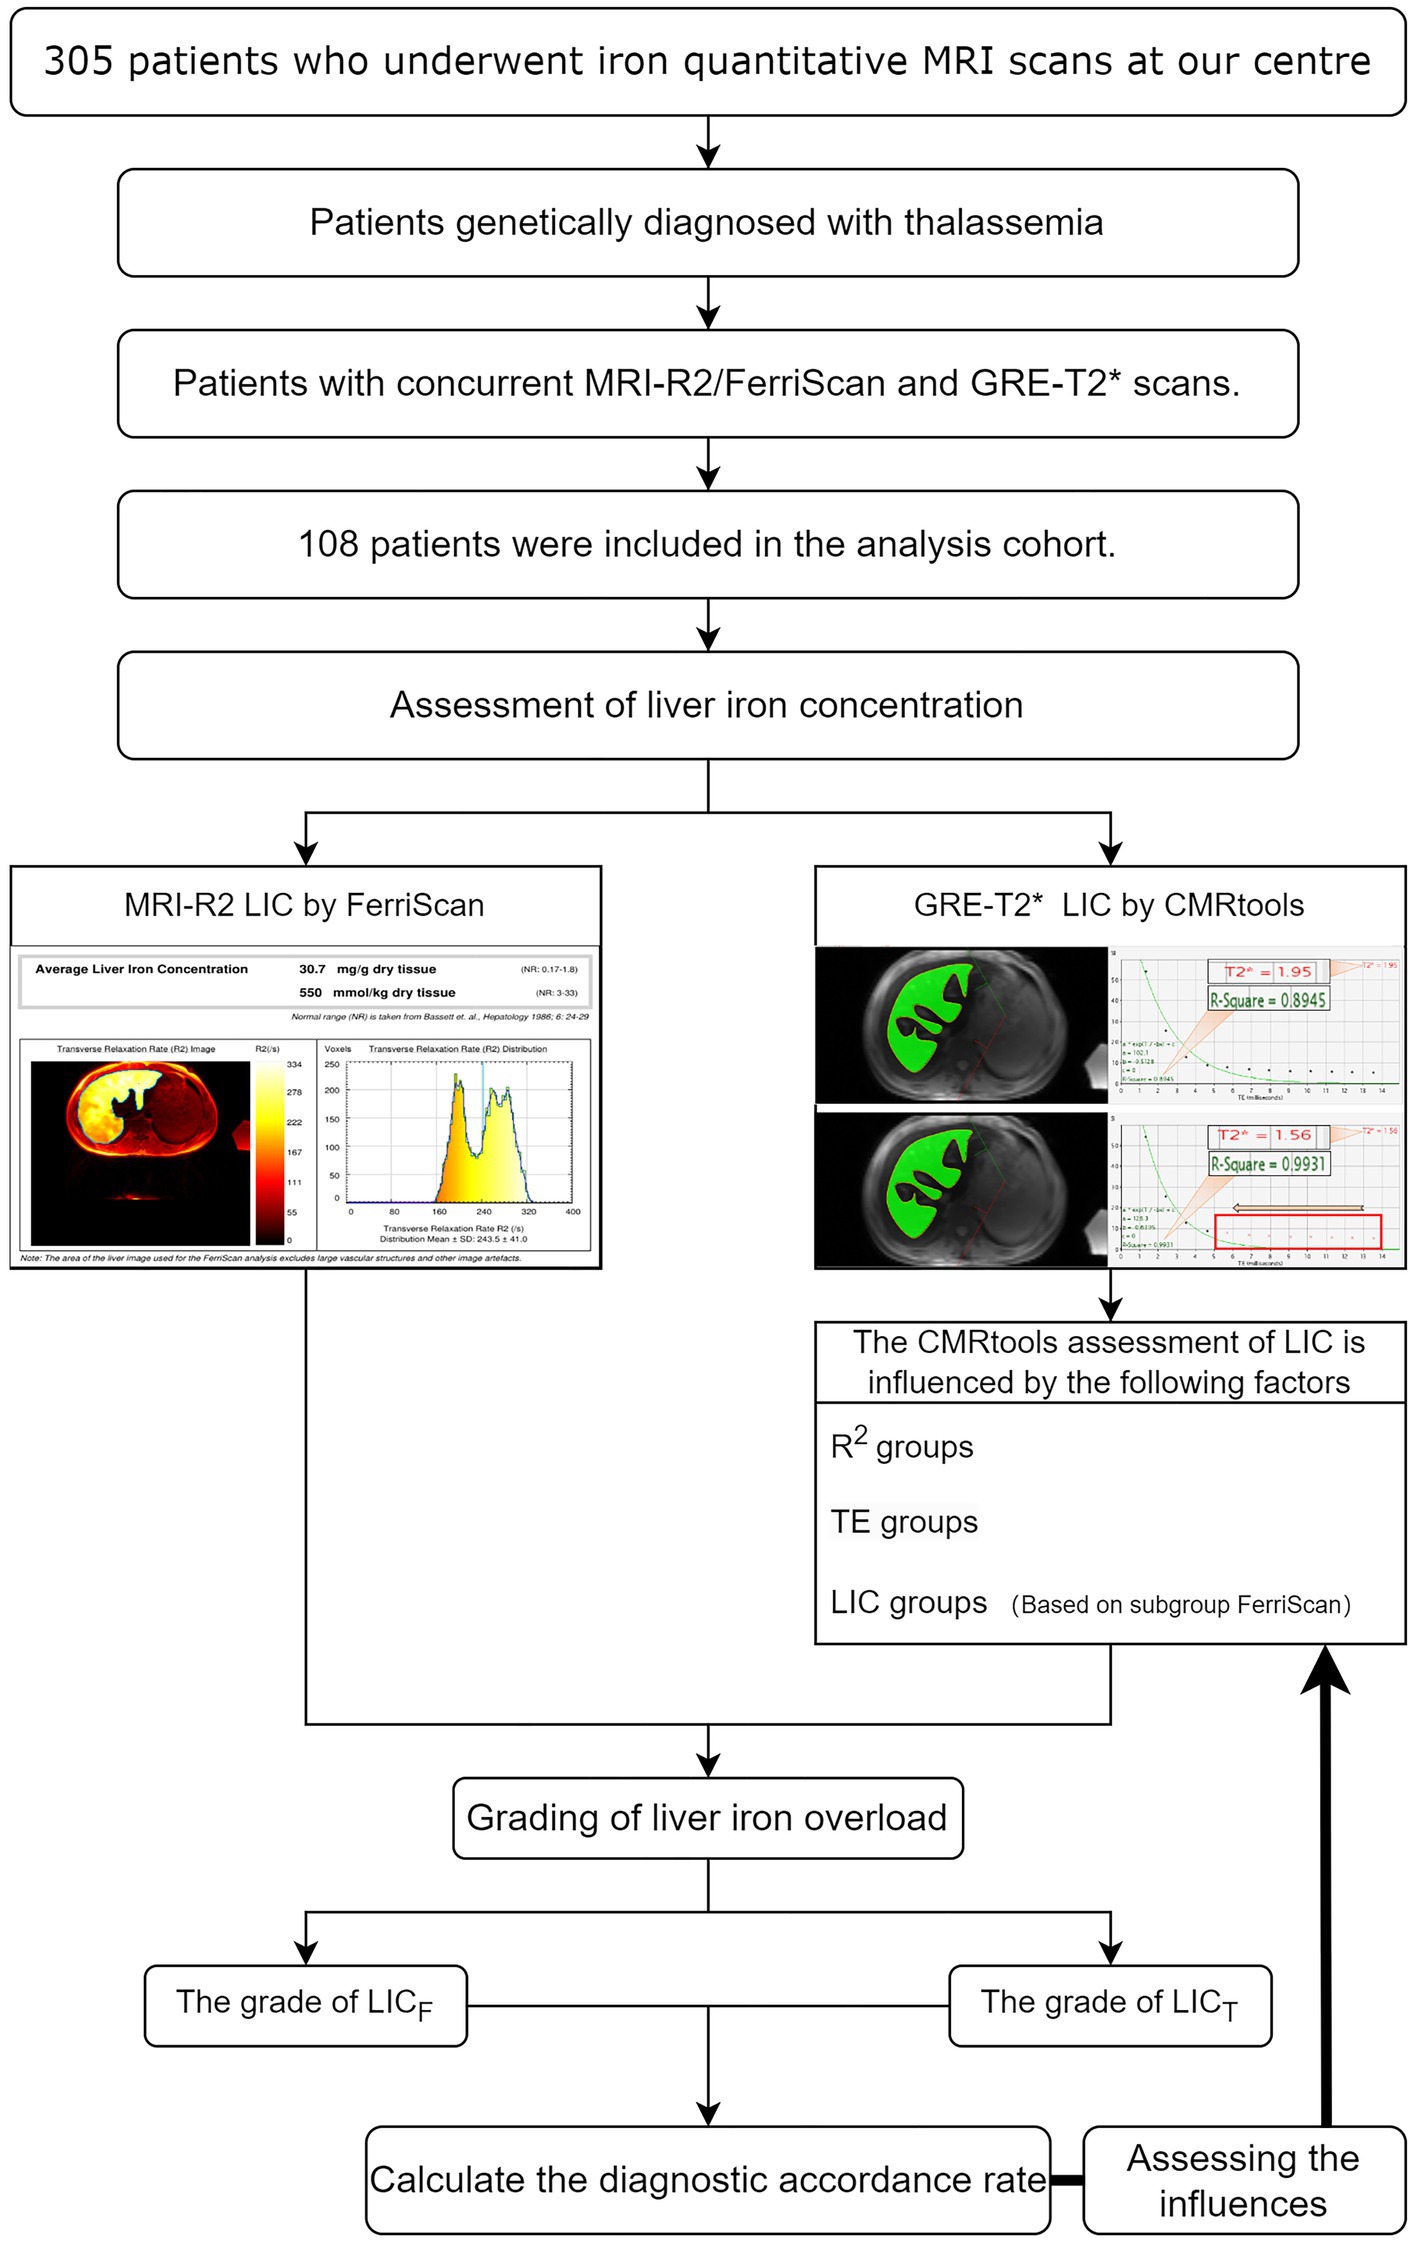
Figure 2. Schematic diagram of this study. MRI-R2 LICF data and T2* values were calculated using CMRtools software, the T2* value was converted to LICT for 108 thalassemia patients, and the accordance rate was calculated after grouping the LIC. The standardized diagnostic accordance rates among the R2 subgroups, among the TE duration subgroups, and among the LIC subgroups were analysed by using the controlled variable method.
3.2 SDAR analysis of the R2 value groups
A comparison of the SDAR of each R2 value subgroup showed that the highest SDAR was observed in the 0.9900–1.0000 subgroup, and the lowest SDAR was observed in the 0.9500–0.9600 subgroup. The R2 groups are not identical (p < 0.0001), and the 0.9900–1.0000 subgroup is not identical to the other groups (all p < 0.05). The SDAR for each TE image number subgroup increased with increasing R2 value, and the mean SDAR for each TE image number subgroup was positively correlated with the R2 value (rs = 0.900, p = 0.037) (Table 3, Figure 3A).
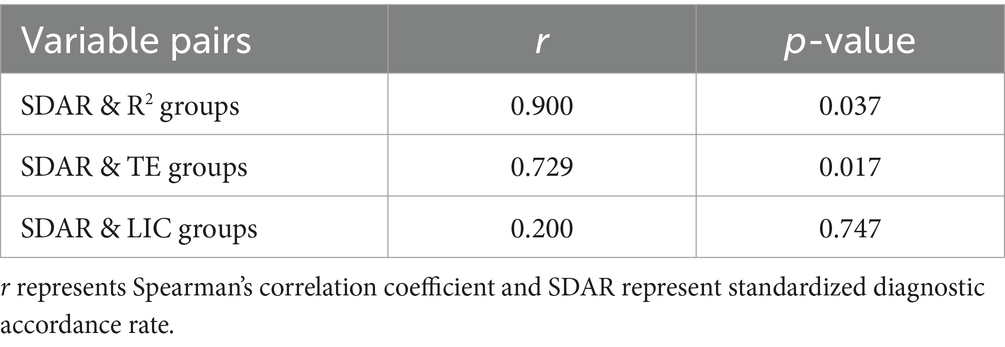
Table 3. The relationship between variable and SDAR.
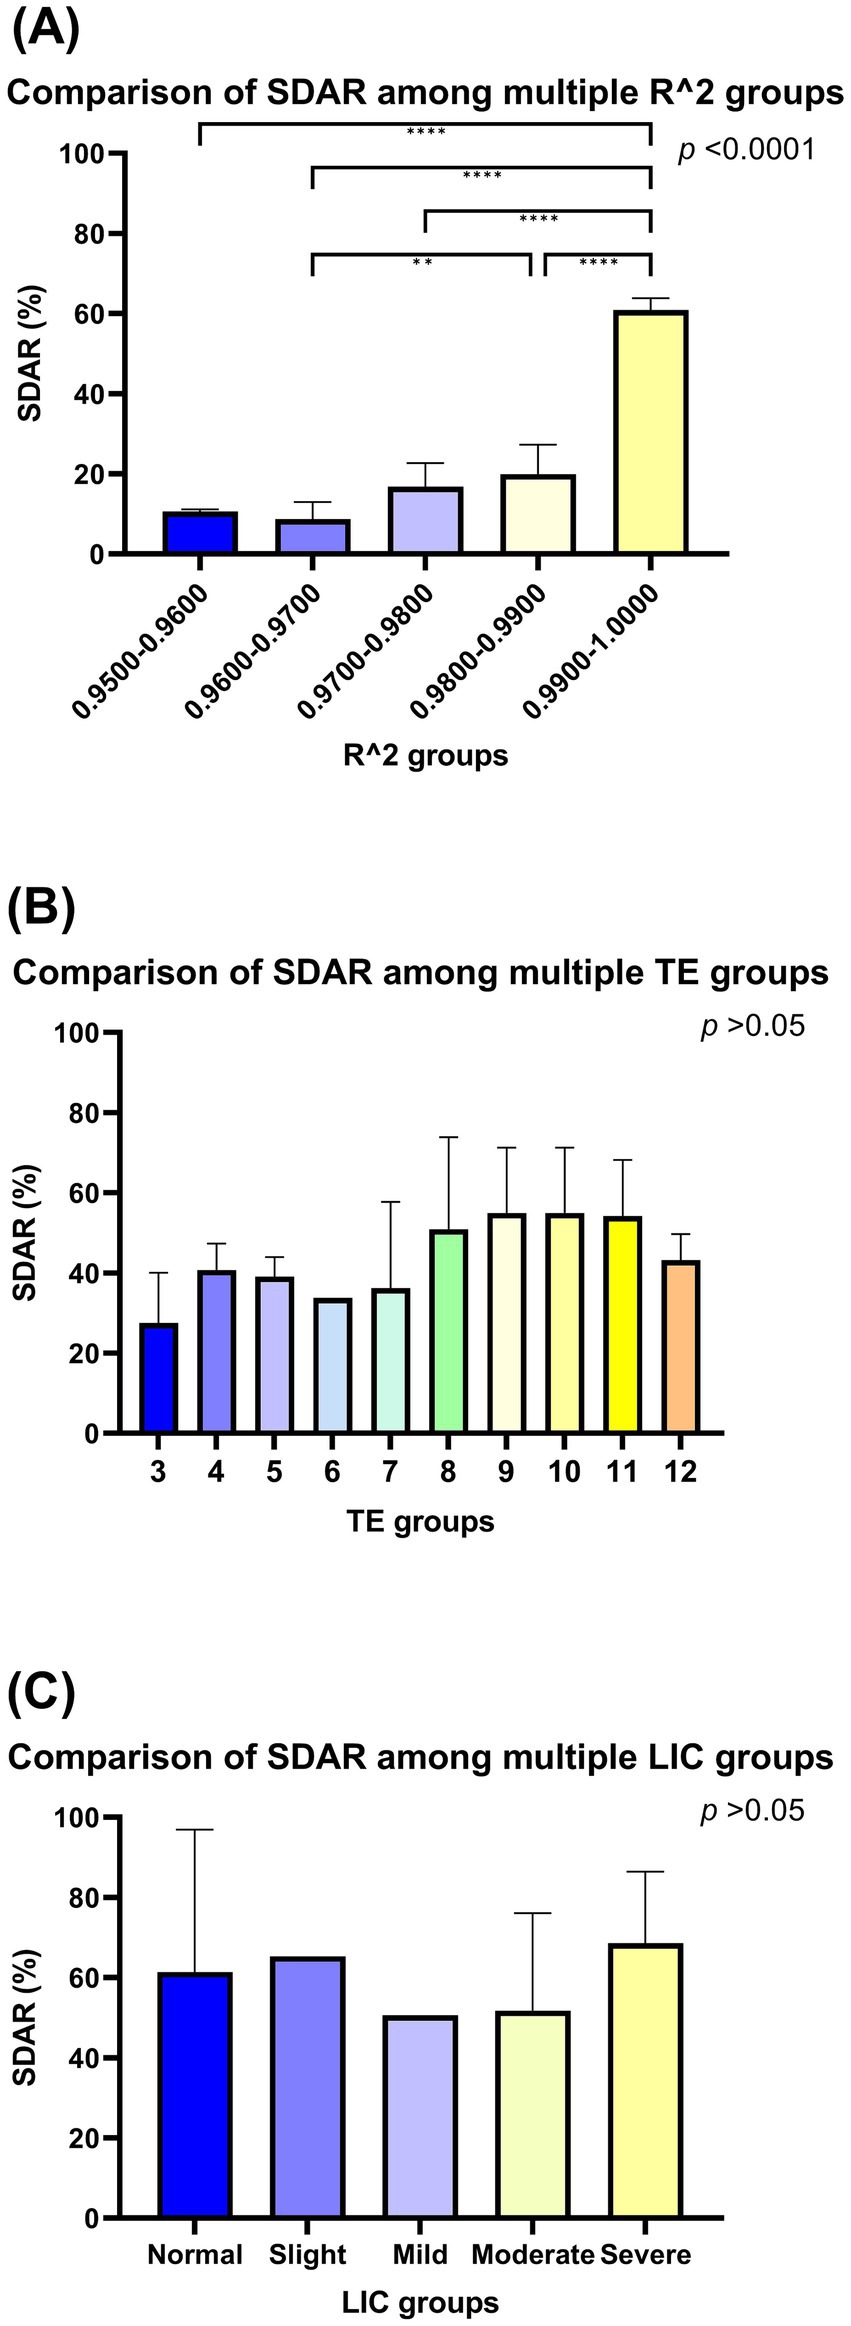
Figure 3. Comparison of standardized diagnostic accordance rate among groups. The p values in the upper right corner of the figure represent the original hypothesis, where H0 is the p value for all groups identical SDARs. Two-by-two comparisons between groups are linked by a horizontal line and labeled with “*,” with one or more “*” indicating that the corrected p value for two-by-two comparisons between groups using the Bonferroni’s method is less than 0.05. R2 is not identical between subgroups, and it is highest at 0.9900–1.0000, which is significantly different from all other groups (A). Among TE subgroups, it cannot yet be denied that all groups are not identical (B). Similarly, among LIC subgroups, it cannot yet be denied that all groups are not identical (C).
3.3 SDAR analysis of TE image number groups
The SDAR are not identical between each TE image number subgroup (p > 0.05). However, the relationship between TE image number subgroups and SDAR was analysed using Spearman’s correlation, and it was found to be positively correlated (rs = 0.729, p = 0.017) (Table 3, Figure 3B).
3.4 SDAR analysis of LIC groups
The SDAR are not identical between each LIC subgroup (p > 0.05), furthermore, the relationship between LIC subgroup and SDAR was analysed using Spearman’s correlation, and it was found irrelevant (p = 0.747) (Table 3, Figure 3C).
4 Discussion
For a better comparison, this study used SDAR for comparison, and SDAR effectively avoids the embarrassment of having different internal composition ratio between comparison groups and achieves the removal of non-analytical factors. For example, when analyzing the SDAR comparison between the R2 groups, the TE subgroup grades and LIC subgroup grades within each of the R2 groups were different, and the first step of the SDAR was to combine the TE subgroups and record them as the standardized group number, and recalculate the DAR by multiplying its original DAR by the standardized group number, which eliminated the influence of the composition ratio of the TE groups as much as possible, and then calculate the SDAR of each LIC subgroup after the SDAR of each group mean, further minimizing the effect of LIC, and finally in making a more reasonable comparison between the R2 groups, the utilization of SDAR was an ingenious use.
This study focused on the analysis of three factors affecting the diagnostic LIO of CMRtools. Although the only controllable variables are the TEs, both R2 and T2* vary depending on the chosen TEs. The R2 values may differ for the same TEs between patients; it is possible for R2 to be higher for a smaller number of TEs, or to fit well for a larger number of TEs. Consequently, with varying R2 values, T2* also varies. To standardize the measurement of T2*, we conducted the following analysis.
The first factor was the goodness-of-fit R2 value. CMRtools was used to measure T2* values obtained by nonlinear least squares fitting of multiple consecutive TE image signals, and R2 values are a statistical indicator used to reflect the degree of reliability of the regression model in describing changes in the dependent variable. Higher R2 values indicate that the independent variable can explain a greater proportion of variance in the dependent variable (22). Due to the different constituent ratios of different LIC subgroups and TE image number subgroups within each R2 value group (a similar situation exists in analyzing the LIC subgroups and the TE image number subgroups). In this study, the R2 value was positively correlated with the SDAR, the results suggest that the higher the R2 value is, the greater the diagnostic accuracy is.
The second factor is the number of TE images. For the different confounding factors affecting the accuracy of T2*, especially the noise substrate, background B0 field variations, and the presence of fat, the wide applied noise substrate correction techniques include the truncation method (23) and the bias fitting method (24). A comparison of these two methods was carried out by He et al. and they concluded that the mono-exponential-truncated method is more stable than the mono-exponential-biased method (15). Herein, we used the truncation method, which involves removing large images with low-signal-intensity TE values that may be hidden in the noise. After standardizing the DAR, each R2 groups’ SDAR not identical; however, the relationship between TE image number subgroups and SDAR was positively correlated, it suggests that the larger the number of TE image, the more stable the fit, making the diagnostic results more stable and accurate.
The third factor is the impact of the degree of LIC on diagnostic results. Severe LIO is a considerable challenge for MRI-T2* based diagnosis of LIO, mainly because the high LIC in severe LIO leads to rapid decay of the MR signal, and routine echo times may detect little or no signal (25). Nonetheless, in this study, we believe that LIC may not significantly affect the accuracy of diagnosis. This is because there is no statistical evidence to suggest that LIC influences the rate of correct diagnosis. Thus, it implies that the CMRtools remains applicable in clinical practice for diagnosing the degree of LIO, even in cases of severe LIO resulting in rapid signal attenuation. Summarizing the above three analyses, the accuracy of CMRtools can be improved by the truncation method—artificially control the number of TEs entering the fit, and thus increase the value of R2 as much as possible. However, a principle should be followed, in the same R2 value subgroup, maintain maximum number of TEs. In this study, the truncation method was able to improve the DAR, but the selection of ROIs still needs to be rigorously screened because the uneven distribution of iron deposition in the liver is objective (26).
The MRI-R2/FerriScan results indicated a strong correlation between the 1.5 T R2 data and the LIC when the LIC ranged from 0.3 to 42.7 mg/g (r = 0.98) (9). However, the ability of MRI-R2/FerriScan to measure iron levels may be affected by factors other than iron concentration, such as the micro-distribution of iron and the presence of fat; these effects have yet to be fully elucidated (5, 27). Since chemical shift artefacts caused by fat have been shown to affect R2* values (28), we adopted the strategy of fat suppression to minimize this effect. MRI-R2/FerriScan, which uses a spin-echo sequence, is not significantly affected by chemical shift artefacts (29). Doyle et al. (30) noted that the FDA-approved LICF was greater than the actual LIC at LIC > 16.5 mg/g dry weight. Moreover, the analysis of the data at LICF > 16.5 mg/g showed that 36.36% (4/11) of the data were classified as moderate LIO for LICT and severe LIO for LICF, respectively. At LICF > 16.5 mg/g, it is possible to overestimate the actual LIC, although we do not know what the rationale is at this time.
Healy et al. suggested that within a certain range of T2*/R2*, relaxometry can be a substitute for T2/R2 relaxometry for the quantification of LIC (31). However, when heavy iron deposition occurs, the T2* signal decays faster, and small changes in T2* values can lead to significant changes in estimated iron values, which is a dilemma based on the use of T2*/R2* to diagnose ultra-severe hepatic iron deposition (32). Recently, several scholars have used MR-based ultrashort echo (UTE-T2*, UTE-QSM) sequences to overcome the acquisition drawbacks of T2* in diagnosing severe LIO by drastically shortening the time of the first TE, thus capturing the rapidly decaying signals of severe LIO; these studies have been well validated in animal models and in patients with iron overload (21, 33–37).
This study had multiple limitations. The sample size was too small. In addition, a single-center design was used, therefore, additional software for measuring T2* values, such as CVI42, the Func Tool, and Quanta Hematology, were not used for comparison. Diagnostic efficacy was mainly evaluated based on the SDAR, which can reduce the effect of different proportions of each layer within each comparison group to a certain extent and facilitate comparison but does not represent the actual diagnostic accuracy. The method for selecting the optimal ROI was not explored, mainly because of the specificity of iron deposition in the liver tissues of individual patients and the difficulty in choosing ROI locations in a uniform manner. Moreover, most of the MRI-R2/FerriScan ROIs did not include the whole liver.
5 Conclusion
CMRtools is a well-classified software package for LIC. The degree of LIO does not affect the correctness of the diagnostic accordance rate. Improving the accuracy of CMRtools in diagnosing LIO can be achieved by increasing the R2 value using the truncation method. At the same level of R2, the higher the number of TE image number, the higher the diagnostic accordance rate.
Data availability statement
The original contributions presented in the study are included in the article/Supplementary material, further inquiries can be directed to the corresponding author.
Ethics statement
The studies involving humans were approved by Ethics Committee of the First Affiliated Hospital of Guangxi Medical University. The studies were conducted in accordance with the local legislation and institutional requirements. The ethics committee/institutional review board waived the requirement of written informed consent for participation from the participants or the participants’ legal guardians/next of kin because the data or specimens used were obtained from previous clinical consultations, disease surveillance, or clinical studies, and no new data or specimens were collected from the subjects. Written informed consent was not obtained from the minor(s)’ legal guardian/next of kin, for the publication of any potentially identifiable images or data included in this article because we collected clinical and imaging data on patients with thalassemia who had been seen at our medical center. We do not perform any interventions on the patients and do not disclose any information that may identify the patients.
Author contributions
CL: Conceptualization, Data curation, Formal analysis, Funding acquisition, Investigation, Methodology, Project administration, Resources, Software, Supervision, Validation, Visualization, Writing – original draft, Writing – review & editing. FP: Conceptualization, Data curation, Formal analysis, Funding acquisition, Investigation, Methodology, Project administration, Resources, Software, Supervision, Validation, Visualization, Writing – original draft, Writing – review & editing. FX: Conceptualization, Data curation, Formal analysis, Funding acquisition, Investigation, Methodology, Project administration, Resources, Software, Supervision, Validation, Visualization, Writing – original draft, Writing – review & editing. CT: Data curation, Writing – original draft, Writing – review & editing. YZ: Data curation, Writing – original draft, Writing – review & editing. CH: Writing – original draft, Writing – review & editing. LL: Data curation, Writing – original draft, Writing – review & editing. XN: Writing – original draft, Writing – review & editing. PP: Conceptualization, Data curation, Formal analysis, Funding acquisition, Investigation, Methodology, Project administration, Resources, Software, Supervision, Validation, Visualization, Writing – original draft, Writing – review & editing.
Funding
The author(s) declare that financial support was received for the research, authorship, and/or publication of this article. This work was supported by grants from the National Natural Science Foundation of China (Nos. 81760305 and 81641066), Open project of the NHC Key Laboratory of Thalassemia Medicine (No. GJWJWDP202306), Natural Science Foundation of Guangxi Zhuang Autonomous Region, China (Nos. 2023GXNSFAA026009 and 2023GXNSFBA026120), Guangxi Zhuang Autonomous Region Health Committee Scientific Research Project (No. Z20200519), The Key Laboratory of Children’s Disease Research in Guangxi’s Colleges and Universities (No. GXCDR2023001), Guangxi Medical and Health Appropriate Technology Development and Promotion Application Project (No.S2022072), and Advanced Innovation Teams and Xinghu Scholars Program of Guangxi Medical University.
Acknowledgments
We are particularly grateful to all the people who have given us help on our article.
Conflict of interest
The authors declare that the research was conducted in the absence of any commercial or financial relationships that could be construed as a potential conflict of interest.
Publisher’s note
All claims expressed in this article are solely those of the authors and do not necessarily represent those of their affiliated organizations, or those of the publisher, the editors and the reviewers. Any product that may be evaluated in this article, or claim that may be made by its manufacturer, is not guaranteed or endorsed by the publisher.
Supplementary material
The Supplementary material for this article can be found online at: https://www.frontiersin.org/articles/10.3389/fmed.2024.1424294/full#supplementary-material
References
1. Kattamis, A, Kwiatkowski, JL, and Aydinok, Y. Thalassaemia. Lancet. (2022) 399:2310–24. doi: 10.1016/S0140-6736(22)00536-0
2. Noureldine, M, Taher, AT, Haydar, AA, Berjawi, A, Khamashta, MA, and Uthman, I. Rheumatological COMPLICATIONS of beta-thalassaemia: an overview. Rheumatology (Oxford). (2018) 57:19–27. doi: 10.1093/rheumatology/kex058
3. Sikorska, K, Bernat, A, and Wroblewska, A. Molecular pathogenesis and clinical consequences of iron overload in liver cirrhosis. Hepatobiliary Pancreat Dis Int. (2016) 15:461–79. doi: 10.1016/s1499-3872(16)60135-2
4. Alexopoulou, E, Stripeli, F, Baras, P, Seimenis, I, Kattamis, A, Ladis, V, et al. R2 relaxometry with mri for the quantification of tissue iron overload in beta-thalassemic patients. J Magn Reson Imaging. (2006) 23:163–70. doi: 10.1002/jmri.20489
5. Reeder, SB, Yokoo, T, Franca, M, Hernando, D, Alberich-Bayarri, A, Alustiza, JM, et al. Quantification of liver iron overload with MRI: review and guidelines from the ESGAR and SAR. Radiology. (2023) 307:e221856. doi: 10.1148/radiol.221856
6. St, PT, Clark, PR, and Chua-Anusorn, W. Measurement and mapping of liver iron concentrations using magnetic resonance imaging. Ann N Y Acad Sci. (2005) 1054:379–85. doi: 10.1196/annals.1345.046
7. Brown, GC, Patton, WN, Tapp, HE, Taylor, DJ, and St, PT. Spin density projection-assisted r2 magnetic resonance imaging of the liver in the management of body iron stores in patients receiving multiple red blood cell transfusions: an audit and retrospective study in South Australia. Intern Med J. (2012) 42:990–6. doi: 10.1111/j.1445-5994.2012.02845.x
8. Calle-Toro, JS, Barrera, CA, Khrichenko, D, Otero, HJ, and Serai, SD. R2 relaxometry based MR imaging for estimation of liver iron content: a comparison between two methods. Abdom Radiol (NY). (2019) 44:3058–68. doi: 10.1007/s00261-019-02074-4
9. St, PT, Clark, PR, Chua-anusorn, W, Fleming, AJ, Jeffrey, GP, Olynyk, JK, et al. Noninvasive measurement and imaging of liver iron concentrations using proton magnetic resonance. Blood. (2005) 105:855–61. doi: 10.1182/blood-2004-01-0177
10. Craft, ML, Edwards, M, Jain, TP, and Choi, PY. R2 and R2* MRI assessment of liver iron content in an undifferentiated diagnostic population with hyperferritinaemia, and impact on clinical decision making. Eur J Radiol. (2021) 135:109473. doi: 10.1016/j.ejrad.2020.109473
11. Wunderlich, AP, Schmidt, SA, Mauro, V, Kneller, L, Kannengiesser, S, Beer, M, et al. Liver iron content determination using a volumetric breath-hold gradient-echo sequence with in-line R(2) * calculation. J Magn Reson Imaging. (2020) 52:1550–6. doi: 10.1002/jmri.27185
12. Padeniya, P, Siriwardana, S, Ediriweera, D, Samarasinghe, N, Silva, S, Silva, I, et al. Comparison of liver MRI R2(ferriscan(r)) vs liver MRI T2* as a measure of body iron load in a cohort of beta thalassaemia major patients. Orphanet J Rare Dis. (2020) 15:26. doi: 10.1186/s13023-020-1301-4
13. Hernando, D, Zhao, R, Yuan, Q, Aliyari, GM, Ruschke, S, Miao, X, et al. Multicenter reproducibility of liver iron quantification with 1.5-T and 3.0-T MRI. Radiology. (2023) 306:e213256. doi: 10.1148/radiol.213256
14. Bacigalupo, L, Paparo, F, Zefiro, D, Viberti, CM, Cevasco, L, Gianesin, B, et al. Comparison between different software programs and post-processing techniques for the MRI quantification of liver iron concentration in thalassemia patients. Radiol Med. (2016) 121:751–62. doi: 10.1007/s11547-016-0661-2
15. He, T, Gatehouse, PD, Smith, GC, Mohiaddin, RH, Pennell, DJ, and Firmin, DN. Myocardial T2* measurements in iron-overloaded thalassemia: an in vivo study to investigate optimal methods of quantification. Magn Reson Med. (2008) 60:1082–9. doi: 10.1002/mrm.21744
16. Garbowski, MW, Carpenter, JP, Smith, G, Roughton, M, Alam, MH, He, T, et al. Biopsy-based calibration of T2* magnetic resonance for estimation of liver iron concentration and comparison with R2 Ferriscan. J Cardiovasc Magn Reson. (2014) 16:40. doi: 10.1186/1532-429X-16-40
17. Henninger, B, Alustiza, J, Garbowski, M, and Gandon, Y. Practical guide to quantification of hepatic iron with MRI. Eur Radiol. (2020) 30:383–93. doi: 10.1007/s00330-019-06380-9
18. Wood, JC, and Ghugre, N. Magnetic resonance imaging assessment of excess iron in thalassemia, sickle cell disease and other iron overload diseases. Hemoglobin. (2008) 32:85–96. doi: 10.1080/03630260701699912
19. Anderson, LJ. Assessment of iron overload with T2* magnetic resonance imaging. Prog Cardiovasc Dis. (2011) 54:287–94. doi: 10.1016/j.pcad.2011.07.004
20. Hernando, D, Levin, YS, Sirlin, CB, and Reeder, SB. Quantification of liver iron with MRI: state of the art and remaining challenges. J Magn Reson Imaging. (2014) 40:1003–21. doi: 10.1002/jmri.24584
21. Kee, Y, Sandino, CM, Syed, AB, Cheng, JY, Shimakawa, A, Colgan, TJ, et al. Free-breathing R2 * mapping of hepatic iron overload in children using 3D multi-echo UTE cones MRI. Magn Reson Med. (2021) 85:2608–21. doi: 10.1002/mrm.28610
22. Sanchez, JM. The inadequate use of the determination coefficient in analytical calibrations: how other parameters can assess the goodness-of-fit more adequately. J Sep Sci. (2021) 44:4431–41. doi: 10.1002/jssc.202100555
23. Anderson, LJ, Holden, S, Davis, B, Prescott, E, Charrier, CC, Bunce, NH, et al. Cardiovascular T2-star (T2*) magnetic resonance for the early diagnosis of myocardial iron overload. Eur Heart J. (2001) 22:2171–9. doi: 10.1053/euhj.2001.2822
24. Wood, JC, Enriquez, C, Ghugre, N, Tyzka, JM, Carson, S, Nelson, MD, et al. MRI R2 and R2* mapping accurately estimates hepatic iron concentration in transfusion-dependent thalassemia and sickle cell disease patients. Blood. (2005) 106:1460–5. doi: 10.1182/blood-2004-10-3982
25. Yan, F, He, N, Lin, H, and Li, R. Iron deposition quantification: applications in the brain and liver. J Magn Reson Imaging. (2018) 48:301–17. doi: 10.1002/jmri.26161
26. Song, H, Zhang, S, Sun, X, Liu, J, Wu, Y, Guo, W, et al. Distinct iron deposition profiles of liver zones in various models with iron homeostasis disorders. Adv Sci (Weinh). (2018) 5:1800866. doi: 10.1002/advs.201800866
27. Ghugre, NR, and Wood, JC. Relaxivity-iron calibration in hepatic iron overload: probing underlying biophysical mechanisms using a Monte Carlo model. Magn Reson Med. (2011) 65:837–47. doi: 10.1002/mrm.22657
28. Bydder, M, Yokoo, T, Hamilton, G, Middleton, MS, Chavez, AD, Schwimmer, JB, et al. Relaxation effects in the quantification of fat using gradient echo imaging. Magn Reson Imaging. (2008) 26:347–59. doi: 10.1016/j.mri.2007.08.012
29. Chan, WC, Tejani, Z, Budhani, F, Massey, C, and Haider, MA. R2* as a surrogate measure of Ferriscan iron quantification in thalassemia. J Magn Reson Imaging. (2014) 39:1007–11. doi: 10.1002/jmri.24216
30. Doyle, E, Ghugre, N, Coates, TD, and Wood, JC. Fixing the mri r2-iron calibration in liver. Am J Hematol. (2020) 95:E120–2. doi: 10.1002/ajh.25754
31. Healy, GM, Kannengiesser, S, Espin-Garcia, O, Ward, R, Kuo, K, and Jhaveri, KS. Comparison of inline R2* MRI versus Ferriscan for liver iron quantification in patients on chelation therapy for iron overload: preliminary results. Eur Radiol. (2021) 31:9296–305. doi: 10.1007/s00330-021-08019-0
32. Sarigianni, M, Liakos, A, Vlachaki, E, Paschos, P, Athanasiadou, E, Montori, VM, et al. Accuracy of magnetic resonance imaging in diagnosis of liver iron overload: a systematic review and meta-analysis. Clin Gastroenterol Hepatol. (2015) 13:55–63.e5. doi: 10.1016/j.cgh.2014.05.027
33. Boss, A, Heeb, L, Vats, D, Starsich, F, Balfourier, A, Herrmann, IK, et al. Assessment of iron nanoparticle distribution in mouse models using ultrashort-echo-time MRI. NMR Biomed. (2022) 35:e4690. doi: 10.1002/nbm.4690
34. Doyle, EK, Toy, K, Valdez, B, Chia, JM, Coates, T, and Wood, JC. Ultra-short echo time images quantify high liver iron. Magn Reson Med. (2018) 79:1579–85. doi: 10.1002/mrm.26791
35. Jang, H, von Drygalski, A, Wong, J, Zhou, JY, Aguero, P, Lu, X, et al. Ultrashort echo time quantitative susceptibility mapping (UTE-QSM) for detection of hemosiderin deposition in hemophilic arthropathy: a feasibility study. Magn Reson Med. (2020) 84:3246–55. doi: 10.1002/mrm.28388
36. Tipirneni-Sajja, A, Loeffler, RB, Krafft, AJ, Sajewski, AN, Ogg, RJ, Hankins, JS, et al. Ultrashort echo time imaging for quantification of hepatic iron overload: comparison of acquisition and fitting methods via simulations, phantoms, and in vivo data. J Magn Reson Imaging. (2019) 49:1475–88. doi: 10.1002/jmri.26325
Keywords: liver, iron overload, magnetic resonance imaging, T2* relaxometry, CMRtools, thalassemia
Citation: Luo C, Peng F, Xu F, Tang C, Zhang Y, Huang C, Liang L, Ning X and Peng P (2024) Assessing the accuracy of CMRtools software for diagnosing liver iron overload in thalassemia patients: influencing factors and optimisation strategies. Front. Med. 11:1424294. doi: 10.3389/fmed.2024.1424294
Edited by:
Imen Moumni, Pasteur Institute of Tunis, TunisiaReviewed by:
Anil Pathare, Sultan Qaboos University Hospital, OmanVasilios Berdoukas, Lefkos Stavros – The Athens Clinic, Greece
Copyright © 2024 Luo, Peng, Xu, Tang, Zhang, Huang, Liang, Ning and Peng. This is an open-access article distributed under the terms of the Creative Commons Attribution License (CC BY). The use, distribution or reproduction in other forums is permitted, provided the original author(s) and the copyright owner(s) are credited and that the original publication in this journal is cited, in accordance with accepted academic practice. No use, distribution or reproduction is permitted which does not comply with these terms.
*Correspondence: Peng Peng, ZG91YmxlcEAxMjYuY29t
†These authors have contributed equally to this work and share first authorship