
95% of researchers rate our articles as excellent or good
Learn more about the work of our research integrity team to safeguard the quality of each article we publish.
Find out more
ORIGINAL RESEARCH article
Front. Med. , 12 June 2024
Sec. Infectious Diseases: Pathogenesis and Therapy
Volume 11 - 2024 | https://doi.org/10.3389/fmed.2024.1408290
This article is part of the Research Topic HTLV-1 and EBV-related disorders: pathogenesis and clinical advances View all 6 articles
 Leonn Mendes Soares Pereira1,2
 Eliane dos Santos França3,4Iran Barros Costa3,4Igor Tenório Lima3,4
 Erika Vanessa Oliveira Jorge5
 Patrícia Jeanne de Souza Mendonça Mattos5Amaury Bentes Cunha Freire6Francisco Lúzio de Paula Ramos6Talita Antonia Furtado Monteiro3Olinda Macedo7Rita Catarina Medeiros Sousa3,8
 Felipe Bonfim Freitas2,7
 Igor Brasil Costa3,4*†
 Antonio Carlos Rosário Vallinoto1,2*†
Background: Epstein–Barr virus (EBV) infection involves distinct clinical and serological profiles. We evaluated the frequency of alleles of locus DRB1 of HLA class II in different serological profiles of EBV infection among HIV-1 infected patients.
Methods: We recruited 19 patients with primary infection, 90 with serological transition and 467 with past infection by EBV, HIV-1 co-infection was 100% in primary infection and approximately 70% in other serological profiles. EBV viral load was quantified by real-time PCR, T lymphocyte quantification and cytokine level analysis were performed by flow cytometry, and HLA locus genotyping was performed by PCR-SSO.
Results: The DRB1*09 allele was associated with primary infection (p: 0.0477), and carriers of the allele showed changes in EBV viral load (p: 0.0485), CD8(+) T lymphocyte counts (p: 0.0206), double-positive T lymphocyte counts (p: 0.0093), IL-4 levels (p: 0.0464) and TNF levels (p: 0.0161). This allele was also frequent in HIV-coinfected individuals (p: 0.0023) and was related to the log10 HIV viral load (p: 0.0176) and CD8(+) T lymphocyte count (p: 0.0285). In primary infection, the log10 HIV viral load was high (p: 0.0060) and directly proportional to the EBV viral load (p: 0.0412). The DRB1*03 allele correlated with serological transition (p: 0.0477), EBV viral load (p: 0.0015), CD4(+) T lymphocyte count (p: 0.0112), CD8(+) T lymphocyte count (p: 0.0260), double-negative T lymphocyte count (p: 0.0540), IL-4 levels (p: 0.0478) and IL-6 levels (p: 0.0175). In the serological transition group, the log10 HIV viral load was high (p: 0.0060), but it was not associated with the EBV viral load (p: 0.1214). Past infection was related to the DRB1*16 allele (p: 0.0477), with carriers displaying IgG levels (p: 0.0020), CD4(+) T lymphocyte counts (p: 0.0116) and suggestive CD8(+) T count alterations (p: 0.0602). The DRB01*16 allele was also common in HIV-1 patients with past EBV infection (p: 0.0192); however, the allele was not associated with clinical markers of HIV-1 infection.
Conclusion: Our results suggest that HLA class II alleles may be associated with the modulation of the serological profiles of the immune response to Epstein-Barr virus infection in patients coinfected with HIV-1.
In the natural history of Epstein–Barr virus (EBV) infection, primary infection is predominantly asymptomatic when it occurs in childhood. However, EBV infection in adolescents and adults can result in infectious mononucleosis, which is characterized by significant clinical variation and can progress to atypical manifestations in approximately 15% of young adults (1, 2). Although the prevalence of primary infection varies between early childhood and early adulthood, it is assumed that on a global scale, approximately 90% of the population will come into contact with the virus before the age of 30 years (3, 4).
Serum levels of the IgM antiviral capsid antigen (VCA) antibody reach their serological peak within the first 5 days of disease onset, a period in which there is an increase in clinical severity and the EBV viral load in the oral mucosa and peripheral blood. Seroconversion to IgG anti-VCA antibodies occurs later, clinical symptoms are still present, and titers tend to remain high and persistent even with a decrease in viral load in the bloodstream (5, 6).
At the beginning of the active phase, the virus infects epithelial cells where it amplifies its viral load, which allows cell-to-cell spread. B cells are subsequently infected due to their expression of CD21, the main receptor for the virus (7). After the end of the active phase of EBV infection, the latent phase begins, in which the viral DNA remains as a closed circular plasmid in the memory B lymphocytes of the host. Coordinated expression of EBV proteins stimulates different patterns of latency that can either induce viral persistence without causing cellular transformation or favor specific lymphoproliferative disorders (8, 9).
The pathology of EBV infection tends to be influenced by coinfection with the HIV-1 virus since the presence of both potentiates the clinical manifestations expected for a monoinfection (10). In fact, the impairment of the immune system caused by HIV contributes to the escape of EBV-infected cells, allowing their proliferation and, eventually, the emergence of EBV-transformed clones (11). These observations are valid even at replication sites in the primary phase of EBV infection, where a relationship between HIV-1 and increased EBV viral load in the tonsils has already been observed (12).
In cases of more severe disease, the emergence of EBV-associated neoplasms correlates with the depletion of specific CD4(+) T lymphocytes induced by HIV-1, and this loss leads to an exhausted CD8(+) T lymphocyte population that can no longer control EBV-mediated lymphoproliferation (13). On the other hand, EBV can also make B lymphocytes susceptible to HIV-1 infection by inducing the expression of CXCR4 and CD4 in these cells (14).
A previous study by our group showed that, of a total of 282 patients from the Brazilian Amazon region with a history of HIV-1 infection evaluated, 19 patients, approximately 7%, were also coinfected with EBV. Coinfection was predominant in homosexual individuals with low education and low family income who used illicit drugs and did not use condoms during their sexual contacts (15).
It has been argued that a hereditary basis for the risk of EBV infection is as relevant as other known risk factors (16). For human leukocyte antigen [HLA], most of the associations observed are related to class I loci.
The genetic profiles of the class I A and B loci have been associated with a polyclonal T lymphocyte response in primary EBV infection, and the specificity of the response can differ slightly, even between similar allelic groups (17). In an ex vivo study, maintenance of a balanced anti-EBV response was associated with the HLA-B*08 allele, with restriction to the early BZLF1 protein (18). However, the restricted response of the HLA-A*02:01 allele to epitopes of lytic phase proteins appears to be unstable and associated with the expression of cell death markers (19). Other studies have shown that the microsatellite markers D6S510 and D6S265 and the polymorphisms rs2530388 and rs6457110 in HLA class I loci are associated with changes in viral load and immune cell counts in patients with mononucleosis (20). The strict relationship between EBV and HLA class I is proposed to be due to blockage of synthesis of the TAP transporter by the viral gene BNLF2a, leading to interference with antigen presentation (21).
One study showed that the viral protein EBNA2 downregulates HLA expression through a CIITA transcription factor-dependent pathway (22).
In a detailed search, we found no published studies that investigated the association of HLA locus alleles with HIV/EBV coinfection.
Taken together, the above results show that HLA variability is associated with the elaboration of relevant immunological responses that indicate specific outcomes in EBV infection. In the present study, we evaluated the allelic frequency of HLA class II DRB1 loci and their association with immunological and viral biomarkers in patients with primary EBV infection, in those undergoing serological class transition (interprofiles) and in those with past infection who were predominantly coinfected with HIV-1. Our objective was to identify immunogenetic markers associated with the complex natural history of EBV and/or EBV/HIV-1 coinfection.
This was a descriptive, cross-sectional, and analytical study. We recruited patients with symptoms of intermittent fever or episodes of recurrent fever from the Setor de Atendimento Médico Unificado do Instituto Evandro Chagas (Unified Medical Care Sector of Instituto Evandro Chagas; SOAMU-IEC); patients with a positive diagnosis of HIV in a subclinical state from the Centro de Atenção à Saúde nas Doenças Infecciosas Adquiridas (Health Care Center for Acquired Infectious Diseases; CASA DIA); and voluntary blood donors from the Fundação Centro de Hematologia e Hemoterapia do Estado do Pará (Pará State Hematology and Hemotherapy Center Foundation; HEMOPA). From January 2018 to January 2020, peripheral blood samples were collected weekly.
A total of 576 participants were included, of whom 19 had serology consistent with primary EBV infection (P.I.) (anti-VCA IgM (+), anti-VCA IgG (−)), 90 had a class serological transition profile (S.T.) (anti-VCA IgM (+), anti-VCA IgG (+)), and 467 had serology consistent with past EBV infection (Past I.) (anti-VCA IgM (−), anti-VCA IgG (+)).
Sociodemographic data (gender, age, education and family income), behavioral data (smoker, alcohol drinker, user of illicit drugs, sexual orientation, active sexual life, steady sexual partner, history of sexual relations with sex workers and use of sexual condoms) and clinical data (sleep quality, diagnosis or family history of cancer, symptoms and history of infections) were obtained through a project-specific questionnaire applied during the participant interview and from medical records databases accessed through authorization filed by the institutions where the study was carried out. All access and disclosure of participant data were included in the study’s ethical opinion.
EBV infection was screened by semiquantitative detection of anti-VCA IgM and IgG class antibodies by enzyme immunoassays (Dia. Pro Diagnostic Bioprobes EBV VCA, Italy). Identification of EBV genotypes was performed by nested PCR targeting the EBNA-3C gene using primers described by Sample et al. (23) and Lorenzetti et al. (24) following appropriate recommendations: (1° round) (F: 5′-AGATGGTGAGCCTGACGTG-3′/R: 5′-GCATCC TTCAAAACCTCAGC-3′) (2° round) (F: 5′-AGAAGGG GAGCGGTGTGTTGT-3′/R: 5′-GGCTGTTTTTGACGTCGGC-3′). The reaction mixture and program were as follows: 10 pmol/μL primers, MgCl2 (50 mM), dNTPs (10 mM), and Taq (5 U/μL); cycling 1° round–1 cycle at 95°C/3′; 20 cycles at 94°C/45, 56°C/45, 72°C/45; 1 cycle at 72°C/7; cycling 2° round–1 cycle at 95°C/3′; 35 cycles at 94°C/45, 56°C/45, and 72°C/45; and 1 cycle at 72°C/7. The presence of a 153-bp fragment was considered positive for EBV-1; a 246-bp fragment was considered positive for EBV-2.
To quantify the EBV load, we used blood plasma samples from patients with positive serology for anti-VCA IgM in a real-time PCR estimation matrix following the protocol of the XGEN MASTER EBV kit (Mobius Life Science, Pinhais, PR, Brazil).
Plasma concentrations of the cytokines IL-17A, IFN-γ, TNF, IL-10, IL-6, IL-4 and IL-2 were determined using a Cytometric Bead Array (CBA) with BD FACSCanto™ II and BDTMCBA Human Th1/Th2/Th17 Cytokine kits (BD Biosciences, San Jose, CA, USA). Quantification of CD4(+) T, CD8(+) T, CD4(+)/CD8(+) T (double-positive) and CD4(−)/CD8(−) T (double-negative) lymphocytes was performed by immunophenotyping and flow cytometry using BD FACSCalibur-4 colors and monitoring kits FACSCountTM Reagents and TriTEST™/TruCount (BD Biosciences, San Jose, CA, USA).
Peripheral blood samples were collected from the participants, and DNA was extracted using a QiaAmp DNA Mini Kit (Qiagen, Düsseldorf, Nordrhein-Westfalen, Germany) following the manufacturer’s recommendations. The extracted DNA samples were quantified by spectrofluorimetry using Qubit equipment (Invitrogen, USA) following the manufacturer’s recommendations. The degree of purity was evaluated using a NanoDrop™ 2000/2000c spectrophotometer (Waltham, Massachusetts, USA), in which the elution solution used for extraction of genetic material was used as a reference standard.
We standardized the following profiles as the ideal range for successful amplification: concentrations between 10 and 15 μg/ml. The degree of purity for the locus was represented by the ratios 260/280: 1.8–2.0 and 260/230: 1.8–2.2. Samples outside the established standard were diluted in ultrapure distilled water free of DNase/RNase (Invitrogen, USA) at concentrations above the expected concentrations. Samples with concentrations below the expected concentrations were re-extracted.
HLA genotyping was performed using low/medium resolution PCR-SSO methodology (polymerase chain reaction – sequence-specific oligonucleotide) with Luminex technology (Luminex Corporation, Austin, TX, USA) and a LABType® kit (One Lambda Inc., Canoga Park, USA). CA, USA).
The target DNA was amplified by conventional PCR using specific primers for each locus provided by the recombinant Taq kit (Invitrogen, USA) and D-mix solution following the supplier’s amplification protocol, in which, for each sample, 13.8 μL of D-mix, 4 μL of the supplied primer and 0.2 μL of TAQ polymerase, totaling 18 μL of preparation for 2 μL of extracted DNA. Sequence amplification followed the following cycles: 1 cycle at 96°C for 3 min; 5 cycles at 96°C for 20 s, 60°C for 20 s and 72°C for 20 s; 30 cycles at 96°C for 10 s, 60°C for 15 s and 72°C for 20 s; and 1 cycle at 72°C for 10 s. To confirm amplification, electrophoresis was performed on a 2.5% agarose gel.
The amplified DNA was denatured and subjected to hybridization with a set of specific fluorescently stained oligonucleotide probes immobilized on polystyrene microspheres. The reagents were standardized in the following proportions: 2.5 μL of denaturation buffer/sample, 5 μL of neutralization buffer/sample, 34 μL of hybridization buffer/sample, and 4 μL of bead mix/sample.
The microspheres were washed with wash buffer (480 μl/sample) and then reacted with 50 μL of streptavidin-phycoerythrin (SAPE) conjugate, which binds to biotinylated amplified DNA. The SAPE mixture was standardized in the following proportions: 0.5 μL of stock SAPE at 10 × /sample and 49.5 μL of SAPE buffer/sample.
In the analytical phase, the fluorescence intensity of phycoerythrin in each microsphere was evaluated using a Luminex analyzer, and the data were archived. Data analysis was performed with HLA Fusion software to determine the HLA gene alleles, and the reactivity pattern of each DNA sample in relation to the set of probes conjugated to the microspheres allowed the establishment of the genotype.
We applied multivariate analysis to determine the separation of the studied groups according to the values of their variables (lymphocyte quantification, cytokine dosage, anti-EBV antibody titer and EBV viral load). A scatterplot was generated to identify the groups and visualize the group separations and approximations.
We calculated the Spearman coefficient through a matrix of general correlations between the immunological and virological variables in each of the three groups.
The frequency of HLA alleles was calculated by direct counting and compared between groups using the G test. For groups with significantly different allelic profiles, the chi-square residual test was applied to determine the probabilistic importance of each of the alleles, followed by calculation of the odds ratio to determine the advantage or disadvantage of significant alleles. We calculated the false positive probability (FPRP) for significant associations, with a predefined threshold value of 0.5. The odds ratio for calculating the statistical power was 1.5. We adopted a range from 0.25 to 0.00001 as the prior probability of association of the alleles with the serological profiles of EBV infection, in accordance with the recommendations of Wacholder et al. (25).
We also applied the G test to compare sociodemographic and clinical data between the groups. To assess significance, logistic regression was performed, with the EBV serological profile used as the dependent variable and the analyzed data used as independent variables.
HWE was measured by selecting as an alternative hypothesis of interest an excess of heterozygotes in the groups; standard Markov chain parameters were adopted (26).
We applied the Mann–Whitney test for two-by-two comparisons of quantitative and semiquantitative data between the groups and between HLA alleles. We opted for nonparametric tests due to the degree of normality of the variables in question, which was estimated by the Lilliefors test.
We adopted a significance level (α) of 95% while considering a probability of significance (p) less than or equal to 0.05 as a criterion for rejecting the null hypotheses for the statistical analyses. The diagrams and graphs were assembled using GraphPad Prism 8.4.3 (San Diego, CA, USA), and statistical analyses were performed using BioEstat 5.3 software (27).
In compliance with resolutions 466/2012 and 347/05 of the National Health Council, which address guidelines and regulatory standards for research involving humans, the project was submitted for ethical consideration and approved by the Ethics Committee in Research with Human Beings of the IEC (Protocol: 3.121.265; CAAE: 73927717.3.0000.0019). All participants were informed about the research objectives, and those who agreed signed a consent form. Individuals under 18 years of age or who were using any specific therapy (antivirals, antiretrovirals or immunosuppressants) were excluded.
Among the sociodemographic and behavioral characteristics, the most common were male sex, age between 18 and 28 years, complete primary education and family income between 1 and 3 years. There were also higher rates of nonsmokers, those who consumed alcohol and those who had no history of using illicit drugs among the participants, as well as heterosexuals and those who had an active sexual life, who had a steady partner, and who had no relationship with sex workers. and who reported using condoms in their relationships (Table 1).
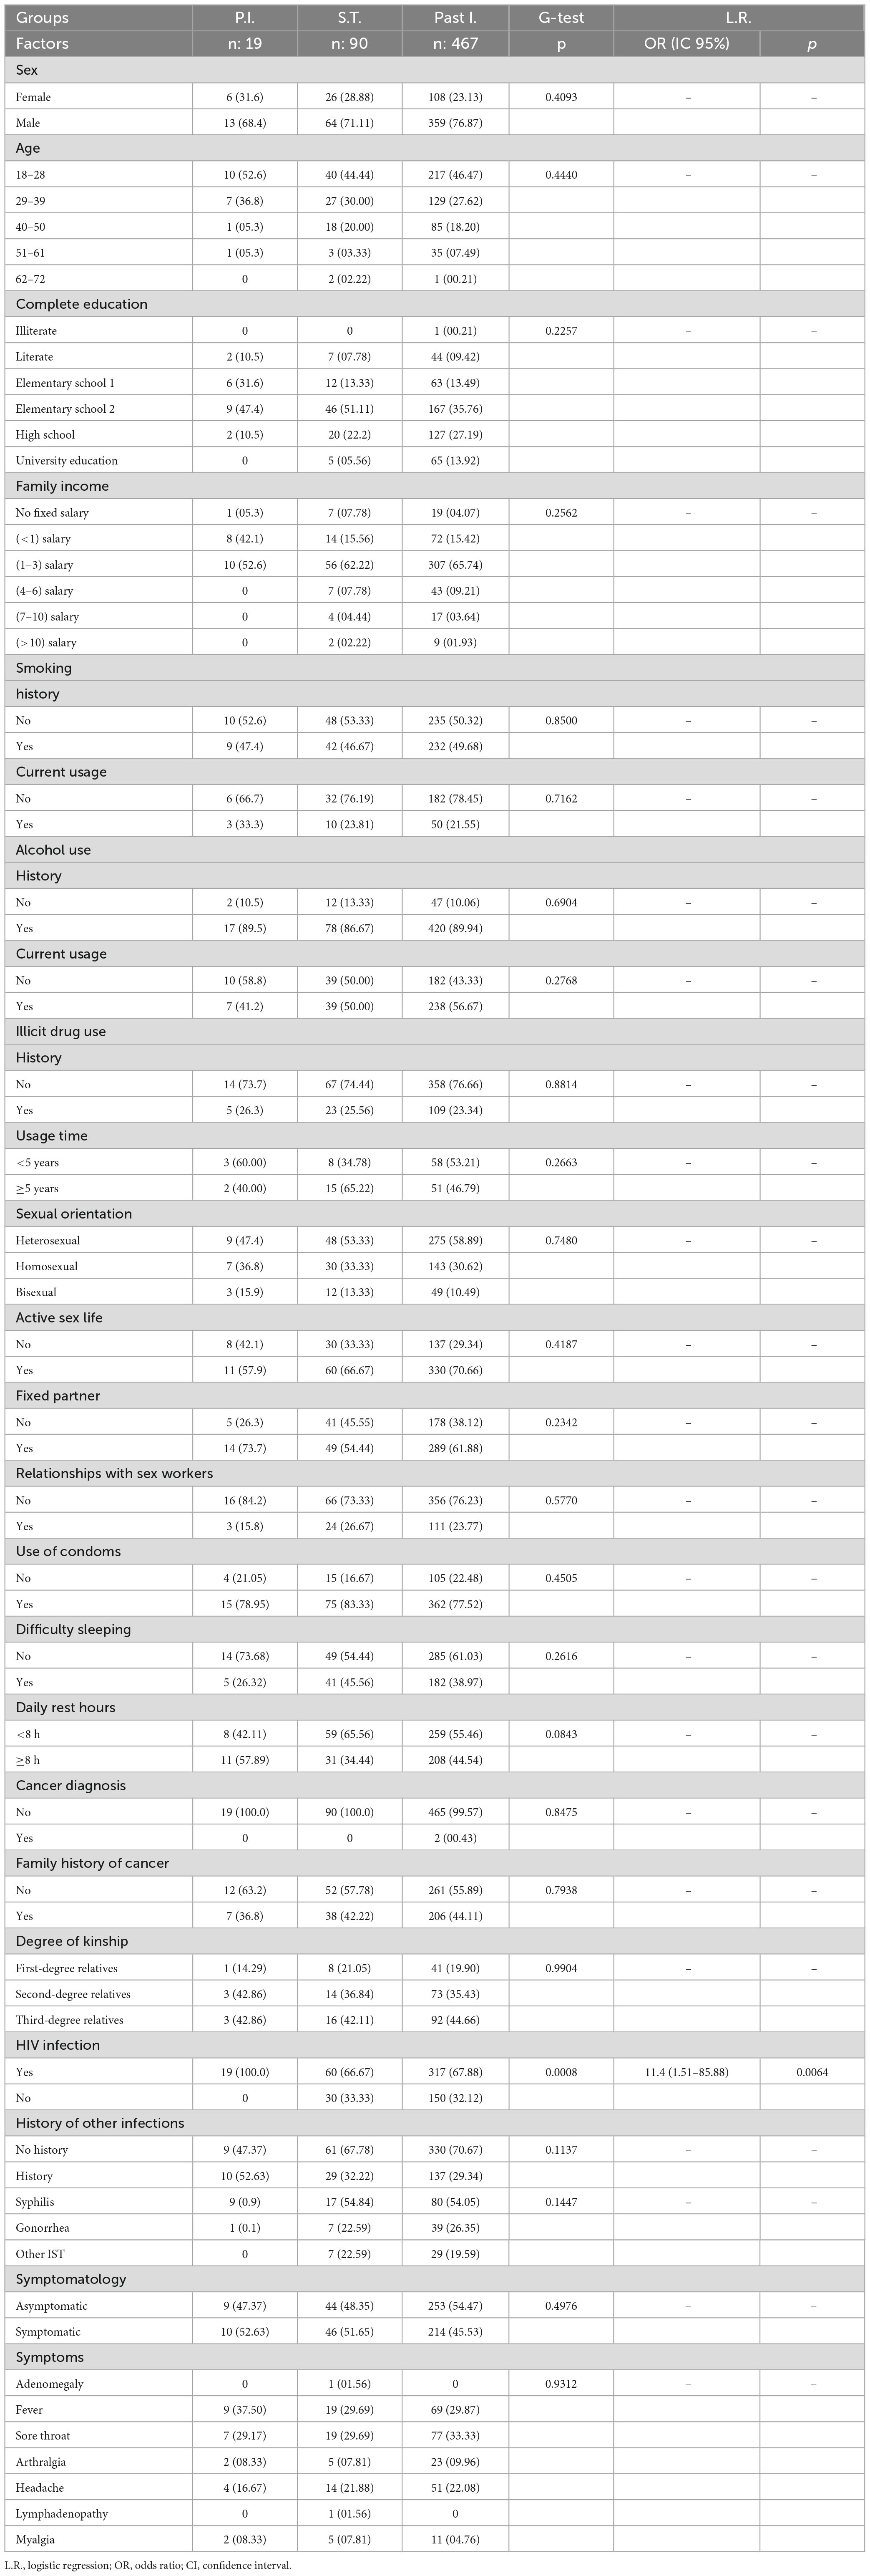
Table 1. Multifactorial comparison of sociodemographic, behavioral and clinical aspects between patients with primary EBV infection, patients with serological transition and patients with past EBV infection.
In relation to stress and history of cancer, individuals who did not have difficulty sleeping were more likely to experience stress, but with variable rest times and without a diagnosis of cancer or family history (Table 1).
Regarding the history of infections and clinical aspects, individuals with a history of coinfection with HIV and syphilis prevailed. Fever and sore throat were more common in symptomatic individuals (Table 1).
HIV coinfection varied between 70 and 100% in the serological groups, and it was significantly associated with the primary phase of EBV infection (100% of patients; p = 0.0008). In fact, patients with primary EBV infection were approximately 11 times more likely to be coinfected with HIV than patients in the other groups were (OR: 11.4; CI (95%): 1.51–85.88; p = 0.0064) (Table 1).
In multivariate analysis, we observed an overlap between the serological transition groups and the past EBV infection group; the primary infection group tended to cluster in coordinates further away from the others; the generated analysis represented approximately 47% of the total data variance (Figure 1A). The viral load and CD4(+) and CD8(+) T lymphocyte counts were the most relevant parameters. The primary infection group had a greater viral load than did the serological transition group (P.I. = median: 15.33; IIQ: 6.50–78.50); (S.T. = median: 0; IIQ: 0.0–2.0); p < 0.00001) (Figure 1B) and a lower CD4(+) T lymphocyte count (P.I. = median: 319.50; IIQ: 140.00–443.25); (S.T. = median: 475; IIQ: 245–764); (Past I. = median: 525.50; IIQ: 280.75–938.25); p: 0.0068) (Figure 1C) but a higher CD8(+) T lymphocyte count than did the other groups (P.I. = median: 1024.50; IIQ: 886.25–2136.75); (S.T. = median: 1140; IIQ: 582–1735); (Past I. = median:807; IIQ: 553–1235); p < 0.00001) (Figure 1D).
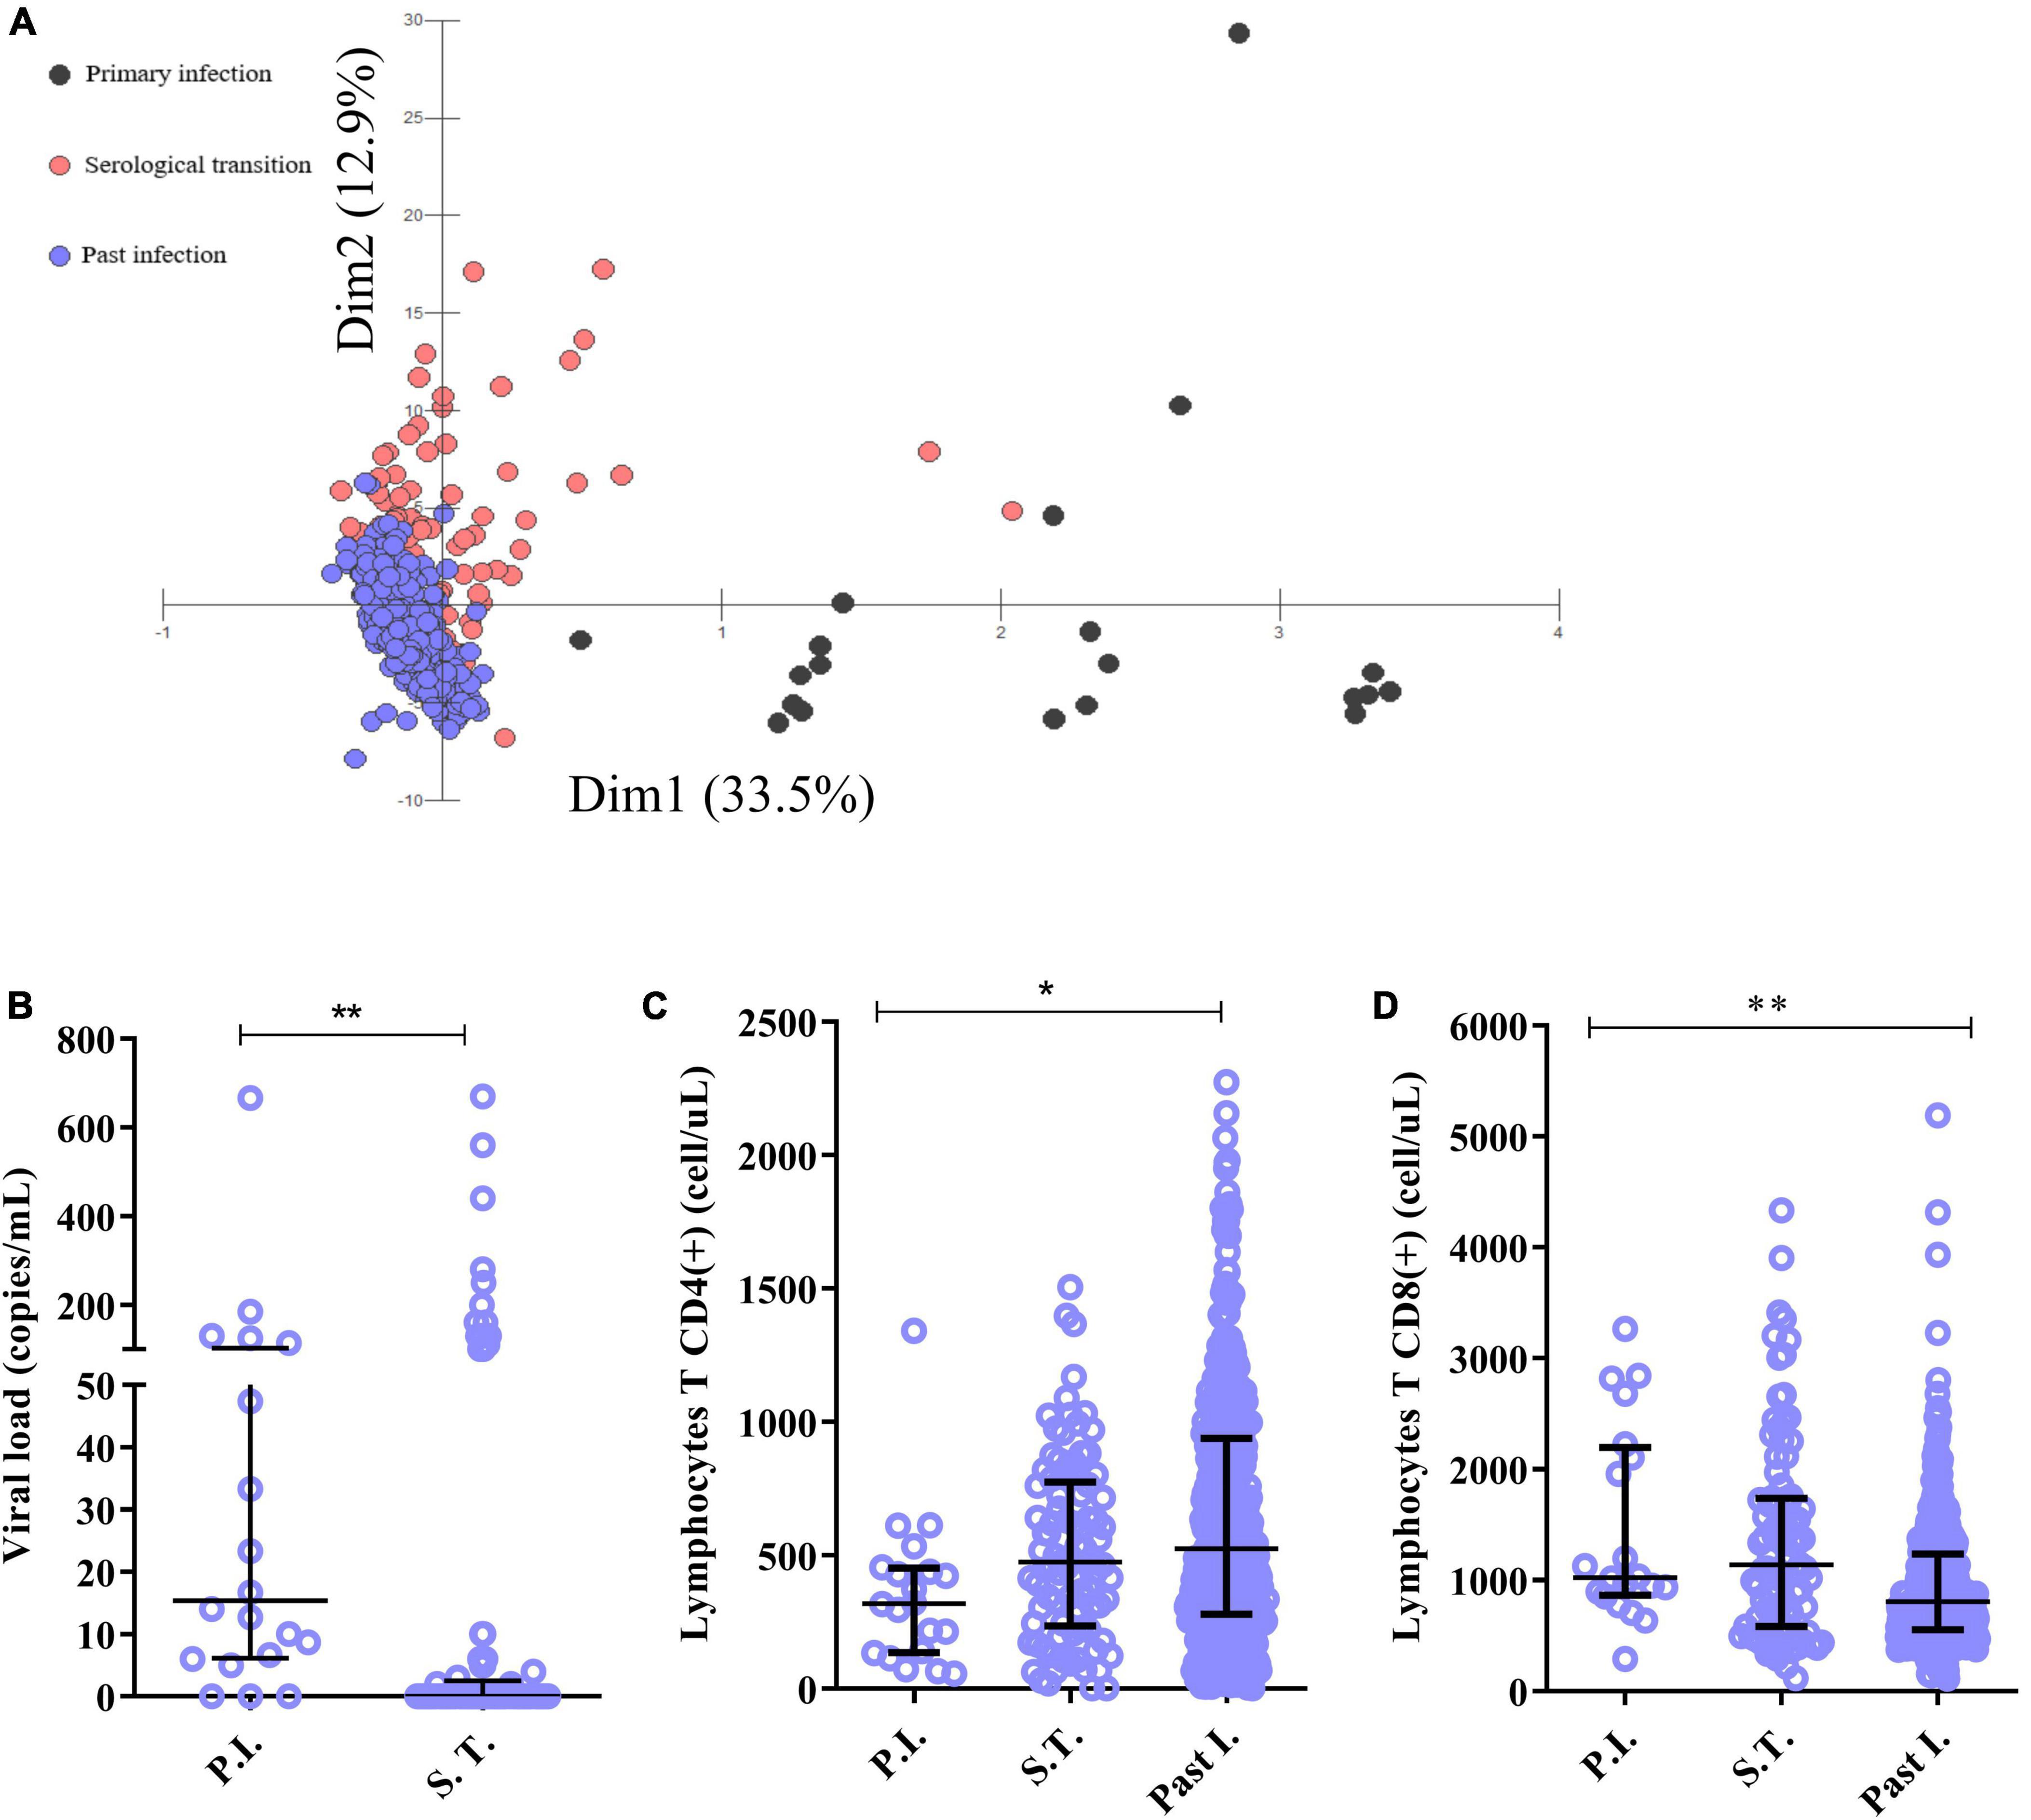
Figure 1. Immunological characterization of the studied groups. (A) Discriminant scatter plot of the groups based on immunological and virological aspects. Patients in serological transition and those with past infection tended to overlap; patients with primary infection grouped differently. (B–D) Dot plot graphs showing differences in the following predictive immunological and virological variables between the groups: (B) viral load, (C) CD4+ T lymphocyte count and (D) CD8+ T lymphocyte count. *p = 0.005–0.0001; **p < 0.0001.
In the group with primary infection (Figure 2A), the IgM concentration correlated negatively with the viral load (r: −0.568; p: 0.0334) and positively with the CD4(+) T lymphocyte count (r: 0.7004; p: 0.0006), IL-6 level (r: 0.1767; p: 0.0457), TNF level (r: 0.2019; p: 0.0522) and IL-4 level (r: 0.1860; p: 0.0517). The EBV viral load correlated negatively with the CD4(+) T lymphocyte count (r: −0.1874; p: 0.0526) and IL-6 level (r: −0.1915; p: 0.0525) but positively with the IL-4 level (r: 0.6976; p: 0.0427). In addition, the CD4(+) T lymphocyte count correlated positively with the IL-17A (r = 0.1250; p = 0.0494) and TNF (r = 0.1367; p = 0.0513) levels. The CD8(+) T lymphocyte count correlated negatively with the CD4(+) T lymphocyte count (r: −0.1612; p: 0.0497) and IL-4 level (r: −0.1748; p: 0.0475) and positively with the double-negative T lymphocyte count (r: 0.7431; p: 0.0002). The double-positive T lymphocyte count also correlated positively with the IL-17A level (r: 0.6584; p: 0.0016), and cytokine levels correlated positively with each other (r: 0.1051–0.8297).
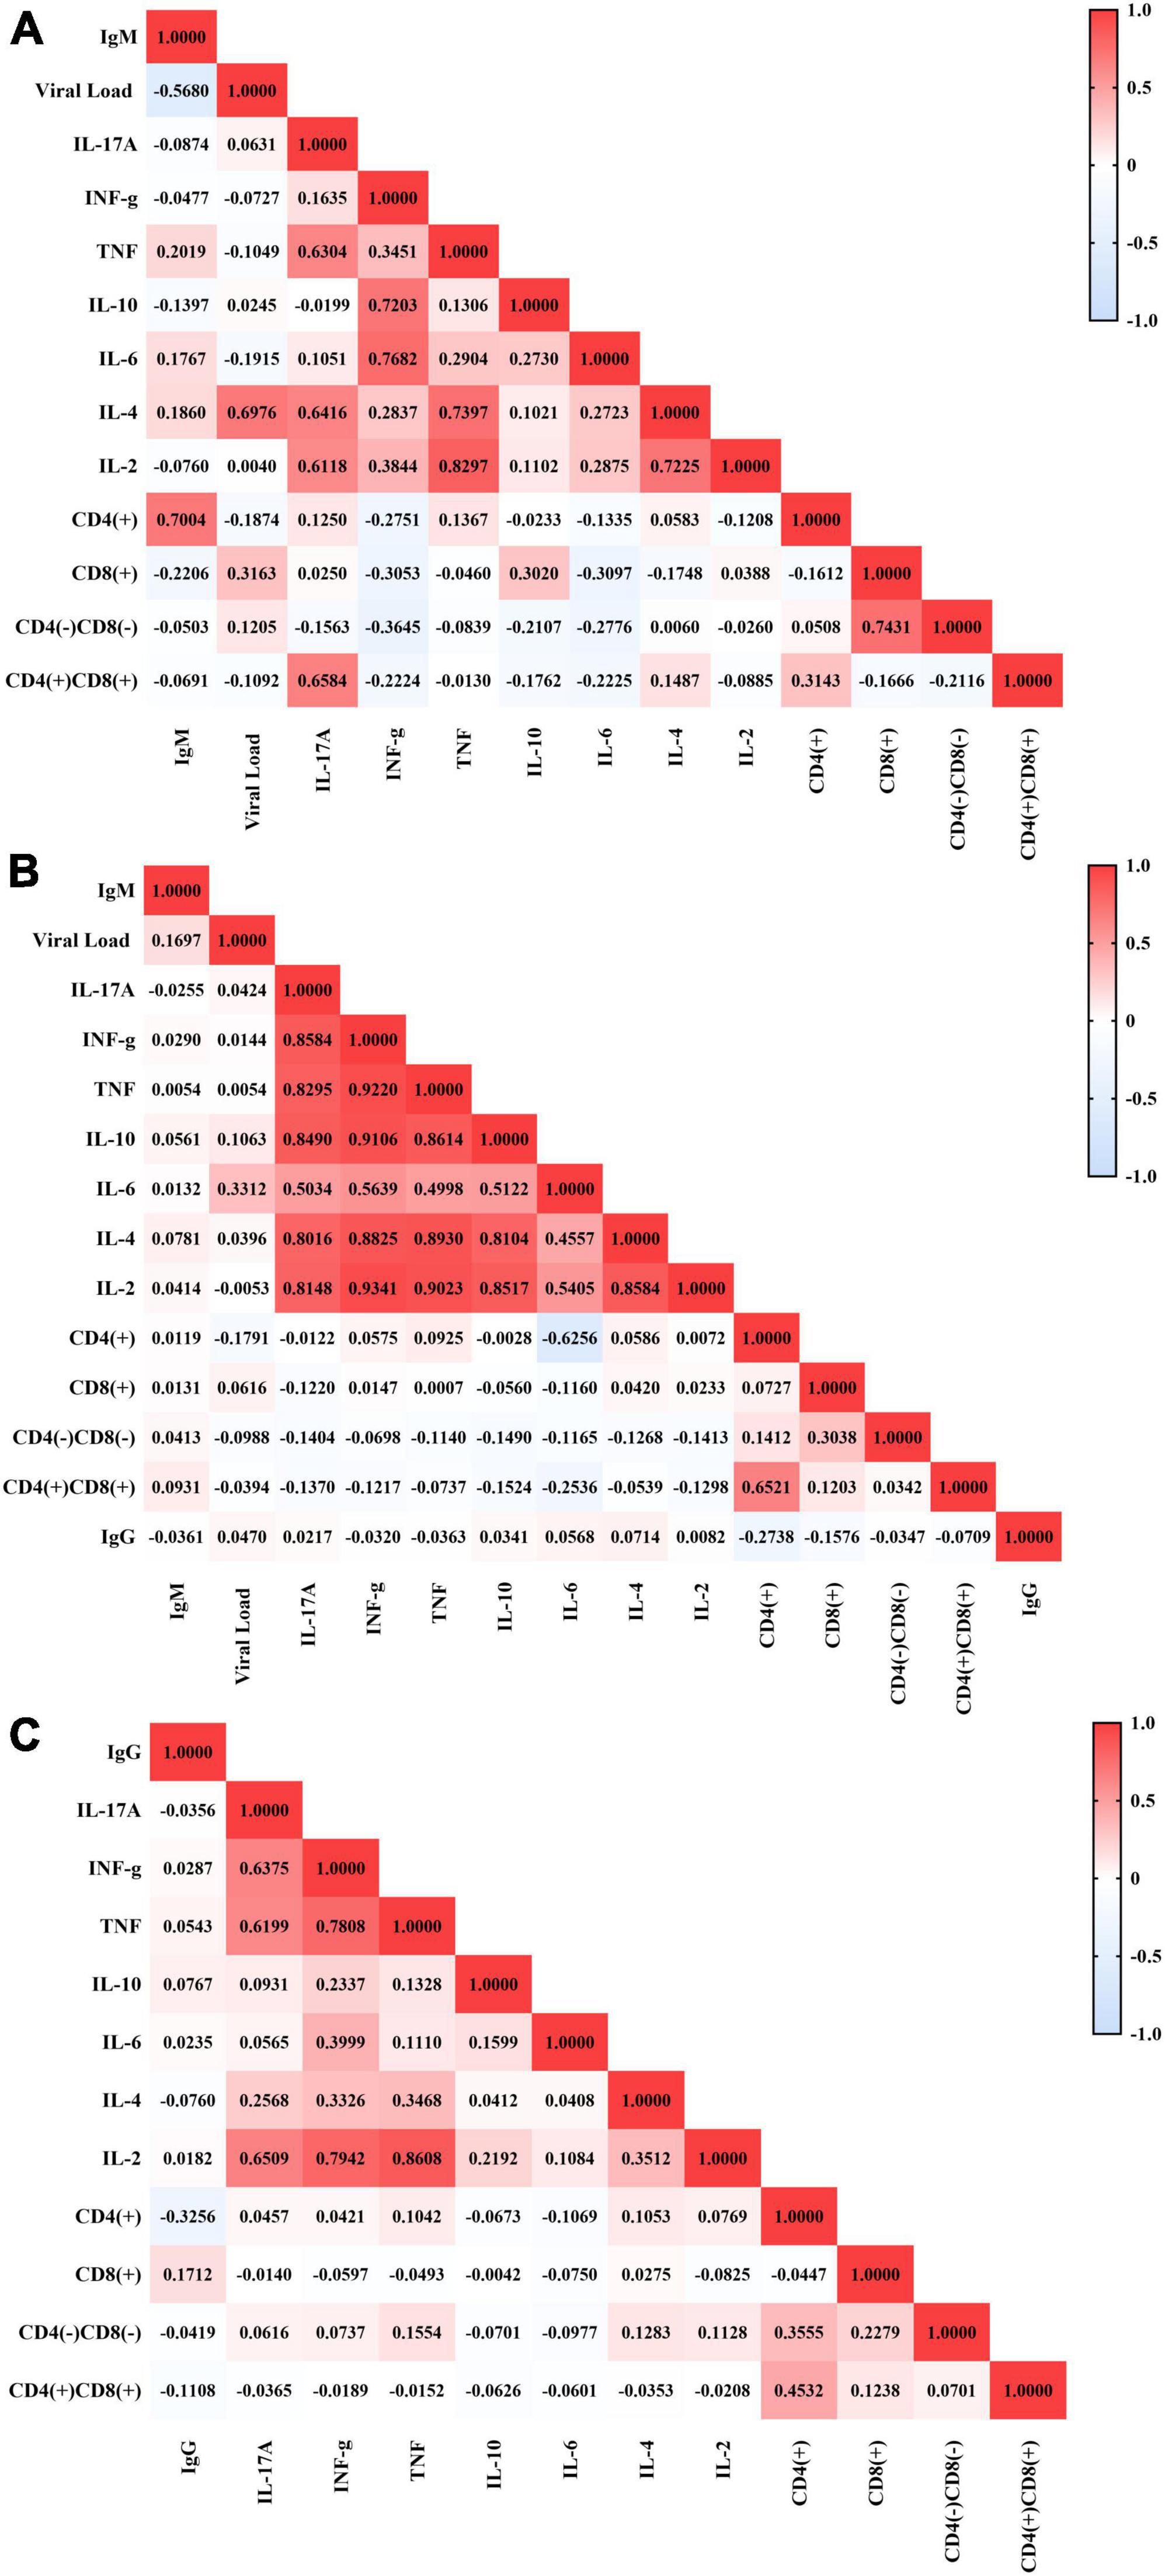
Figure 2. Correlations between immunological and virological factors in the studied groups. Heatmap graphs showing correlation matrices between immunological and virological factors in patients with active infection (A), patients in serological transition (B) and patients with past EBV infection (C).
In the serological transition group (Figure 2B), the viral load correlated negatively with the CD4(+) T lymphocyte count (r = −0.1791; p = 0.0569) and positively with the IL-6 level (r = 0.3312; p = 0.0017). The CD4(+) T lymphocyte count correlated negatively with the IL-6 level (r: −0.6256; p: 0.0021), though the double-positive T lymphocyte count correlated positively with the CD4(+) T lymphocyte count (r: 0.6521; p < 0.0001) and negatively with the IL-6 level (r: −0.2536; p: 0.0177). Additionally, cytokine levels correlated positively (r = 0.4998–0.9343).
In the group with past EBV infection (Figure 2C), the IgG level correlated negatively with the CD4(+) T lymphocyte (r: −0.3256; p < 0.0001) and double-positive T lymphocyte (r: −0.1108; p: 0.0401) counts and positively with the CD8(+) T lymphocyte count (r: 0.1712; p: 0.0016). However, the CD4(+) T lymphocyte count correlated negatively with the IL-6 level (r: −0.1069; p: 0.0476) and positively with TNF (r: 0.1042; p: 0.0535) and IL-4 (r: 0.1053; p: 0.0510) levels and with double-negative T lymphocyte (r: 0.3555; p < 0.0001) and double-positive T lymphocyte (r: 0.4532; p < 0.0001) counts. The CD8(+) T lymphocyte count correlated positively with the double-positive T lymphocyte (r: 0.1238; p: 0.0219) and double-negative T lymphocyte (r: 0.2279; p < 0.0001) counts, and the double-negative T lymphocyte count correlated positively with the IL-2 (r: 0.1128; p: 0.0368), TNF (r: 0.1554; p: 0.0041) and IL-4 (r: 0.1283; p: 0.0175) levels. For the other groups, cytokine levels correlated positively with each other (r = 0.0913–0.8608).
The DRB1 locus was in Hardy–Weinberg equilibrium in all groups studied (P.I.: p = 0.9158; S.T.: p = 0.7626; Past I.: p = 0.8574). We observed relevant differences in the frequency of DRB1 locus alleles between the groups studied (p = 0.0477), with the DRB1*09 allele showing greater probabilistic relevance in the group with primary EBV infection (residues x2: 2.4538), the DRB1*03 allele being more relevant in the serological transition group (residues x2: 2.8528) and the DRB1*16 allele being more relevant in the group with past EBV infection (residues x2: 2.6223) (Figure 3A and Table 2). The rate of heterozygosity was high in the three groups, with no significant differences among them (p = 0.1817) (Table 2).
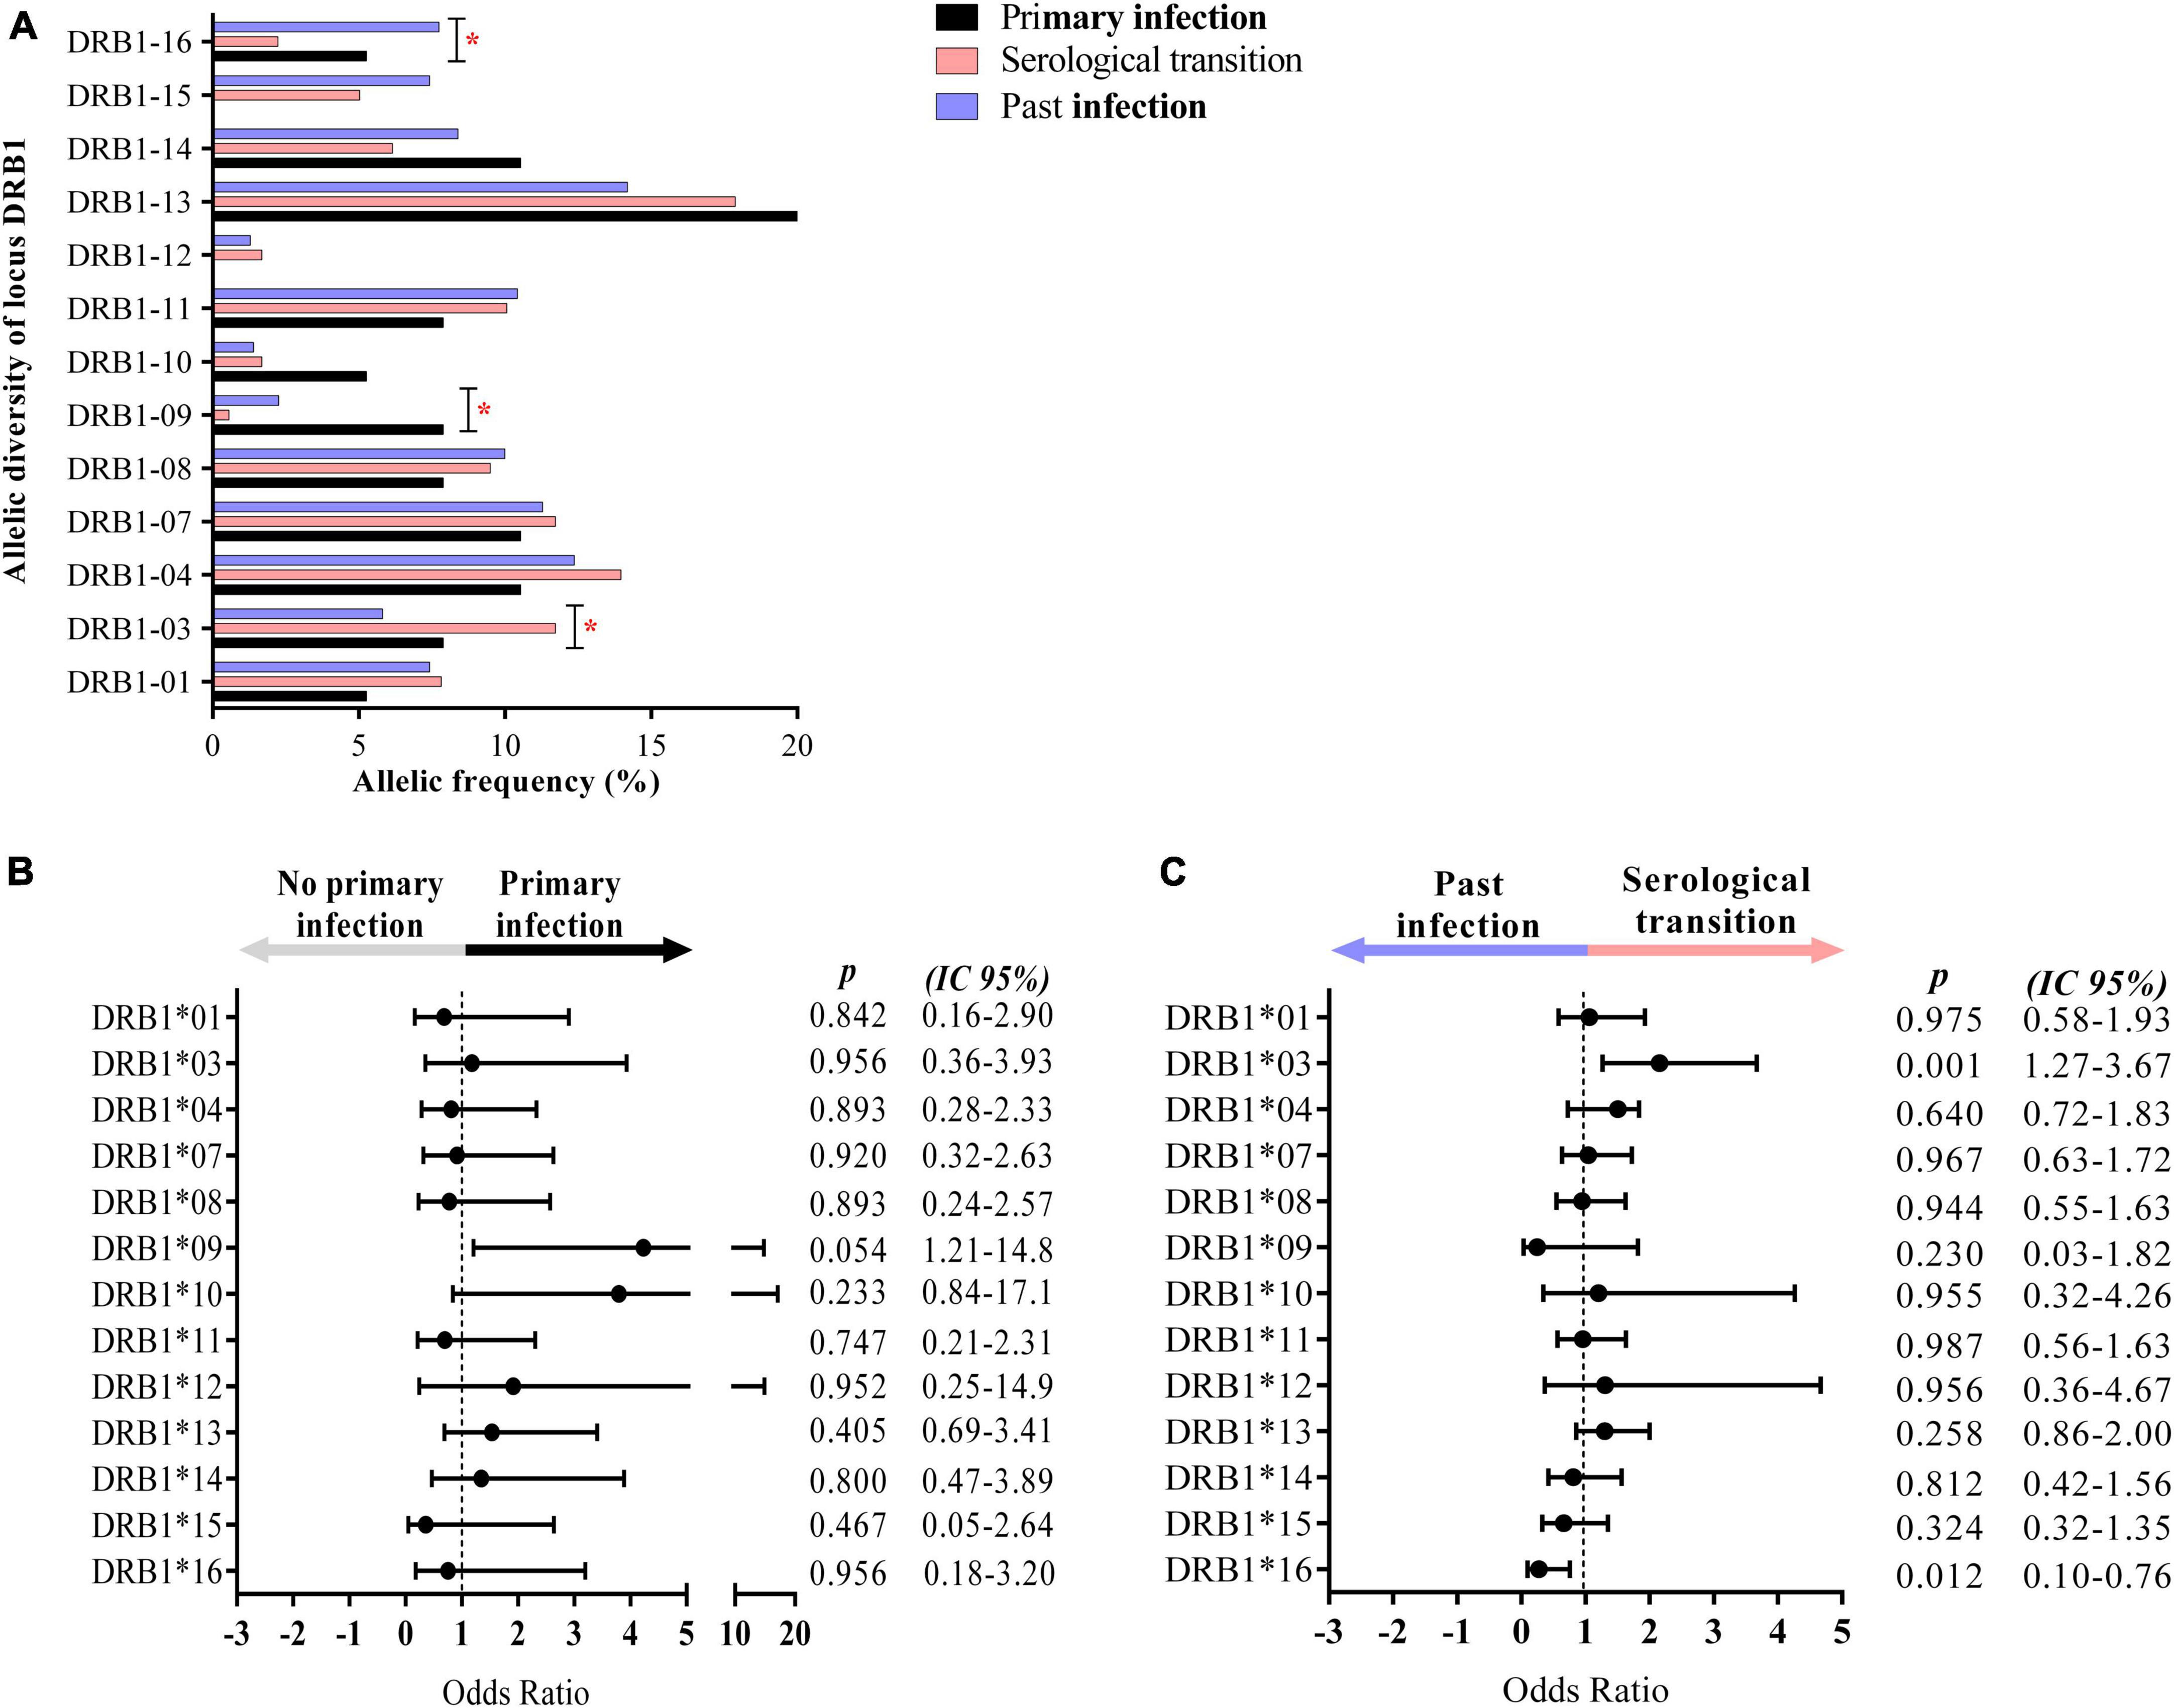
Figure 3. Alleles associated with EBV infection profiles. (A) Column graph showing the frequency of alleles at the HLA class II DRB1 locus. The DRB1*09, *03, and *16 alleles were associated with primary infection, serological transition and past EBV infection, respectively. *p = 0.005–0.0001. (B) Dot plot graph showing the odds ratio and confidence interval (CI 95%) of DRB1 alleles in primary EBV infection, with the DRB1*09 allele being approximately 4-fold more frequent in the group. (C) Dot plot graph showing the odds ratio and confidence interval (CI 95%) of DRB1 alleles at serologic transition and past EBV infection. The DRB1*03 allele was approximately 2-fold more frequent in the serological transition group. The DRB1*16 allele was less frequent in the serological transition group (OR: 0.2724) and approximately 7-fold more frequent in the group with past infection.
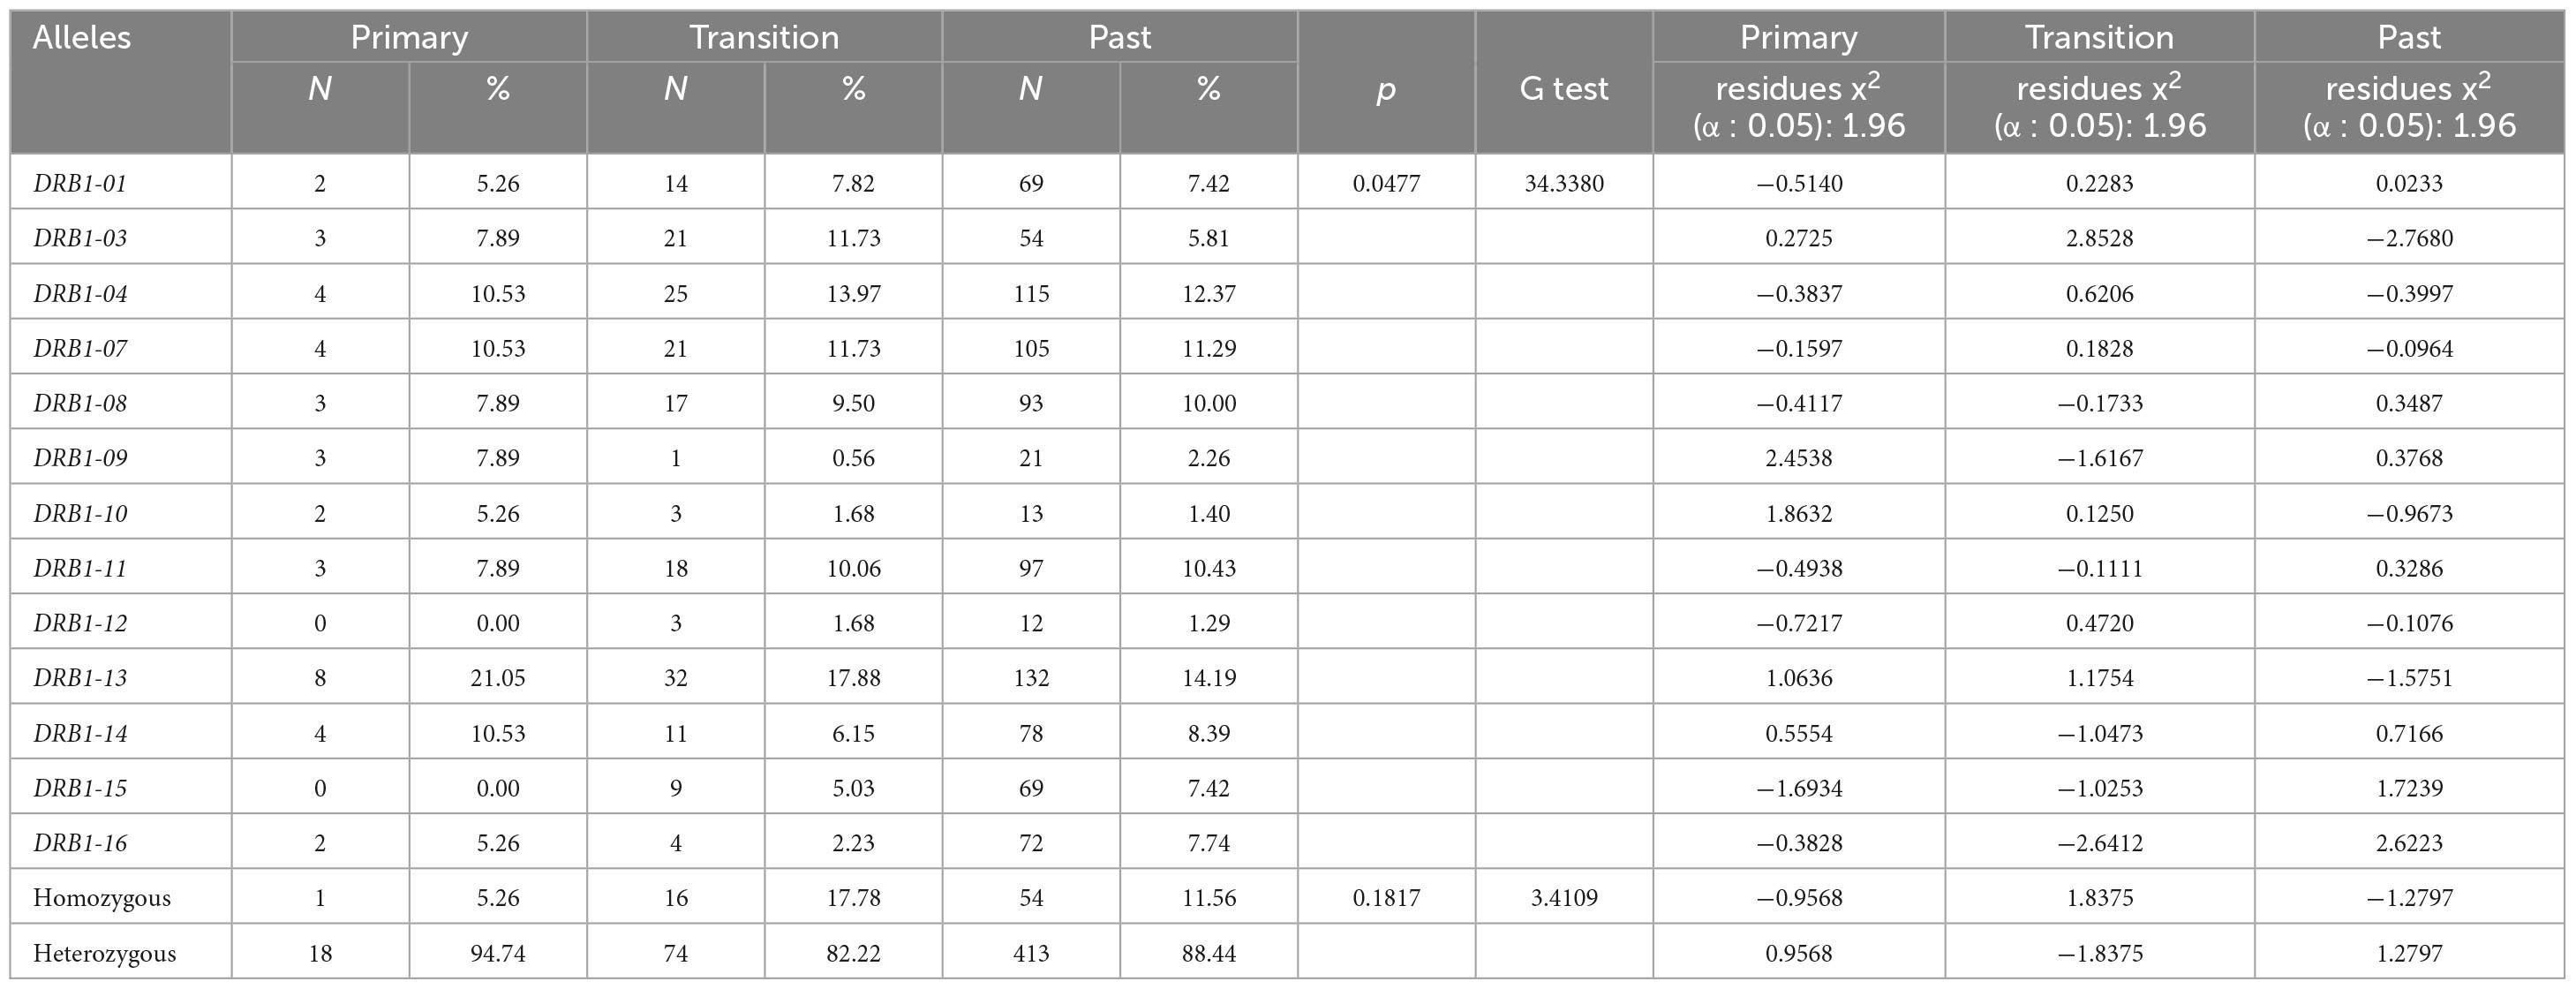
Table 2. Allelic frequency of the DRB1 locus of HLA class II in groups with primary infection, in serological transition and with past infection with EBV.
The DRB1*09 allele was approximately 4-fold more frequent in the group with primary EBV infection than in the other groups (OR: 4.235; CI (95%): 1.21–14.80; p: 0.054) (Figure 3B).
The median EBV viral load was greater in carriers of this allele (DRB1*09 = 47.33; IIQ = 40.33–80.67) (others = median: 9.33; IIQ = 3.75–18.33); p = 0.0485) (Figure 4A). However, the anti-VCA IgM titer was not associated with DRB1*09 (Figure 4B).
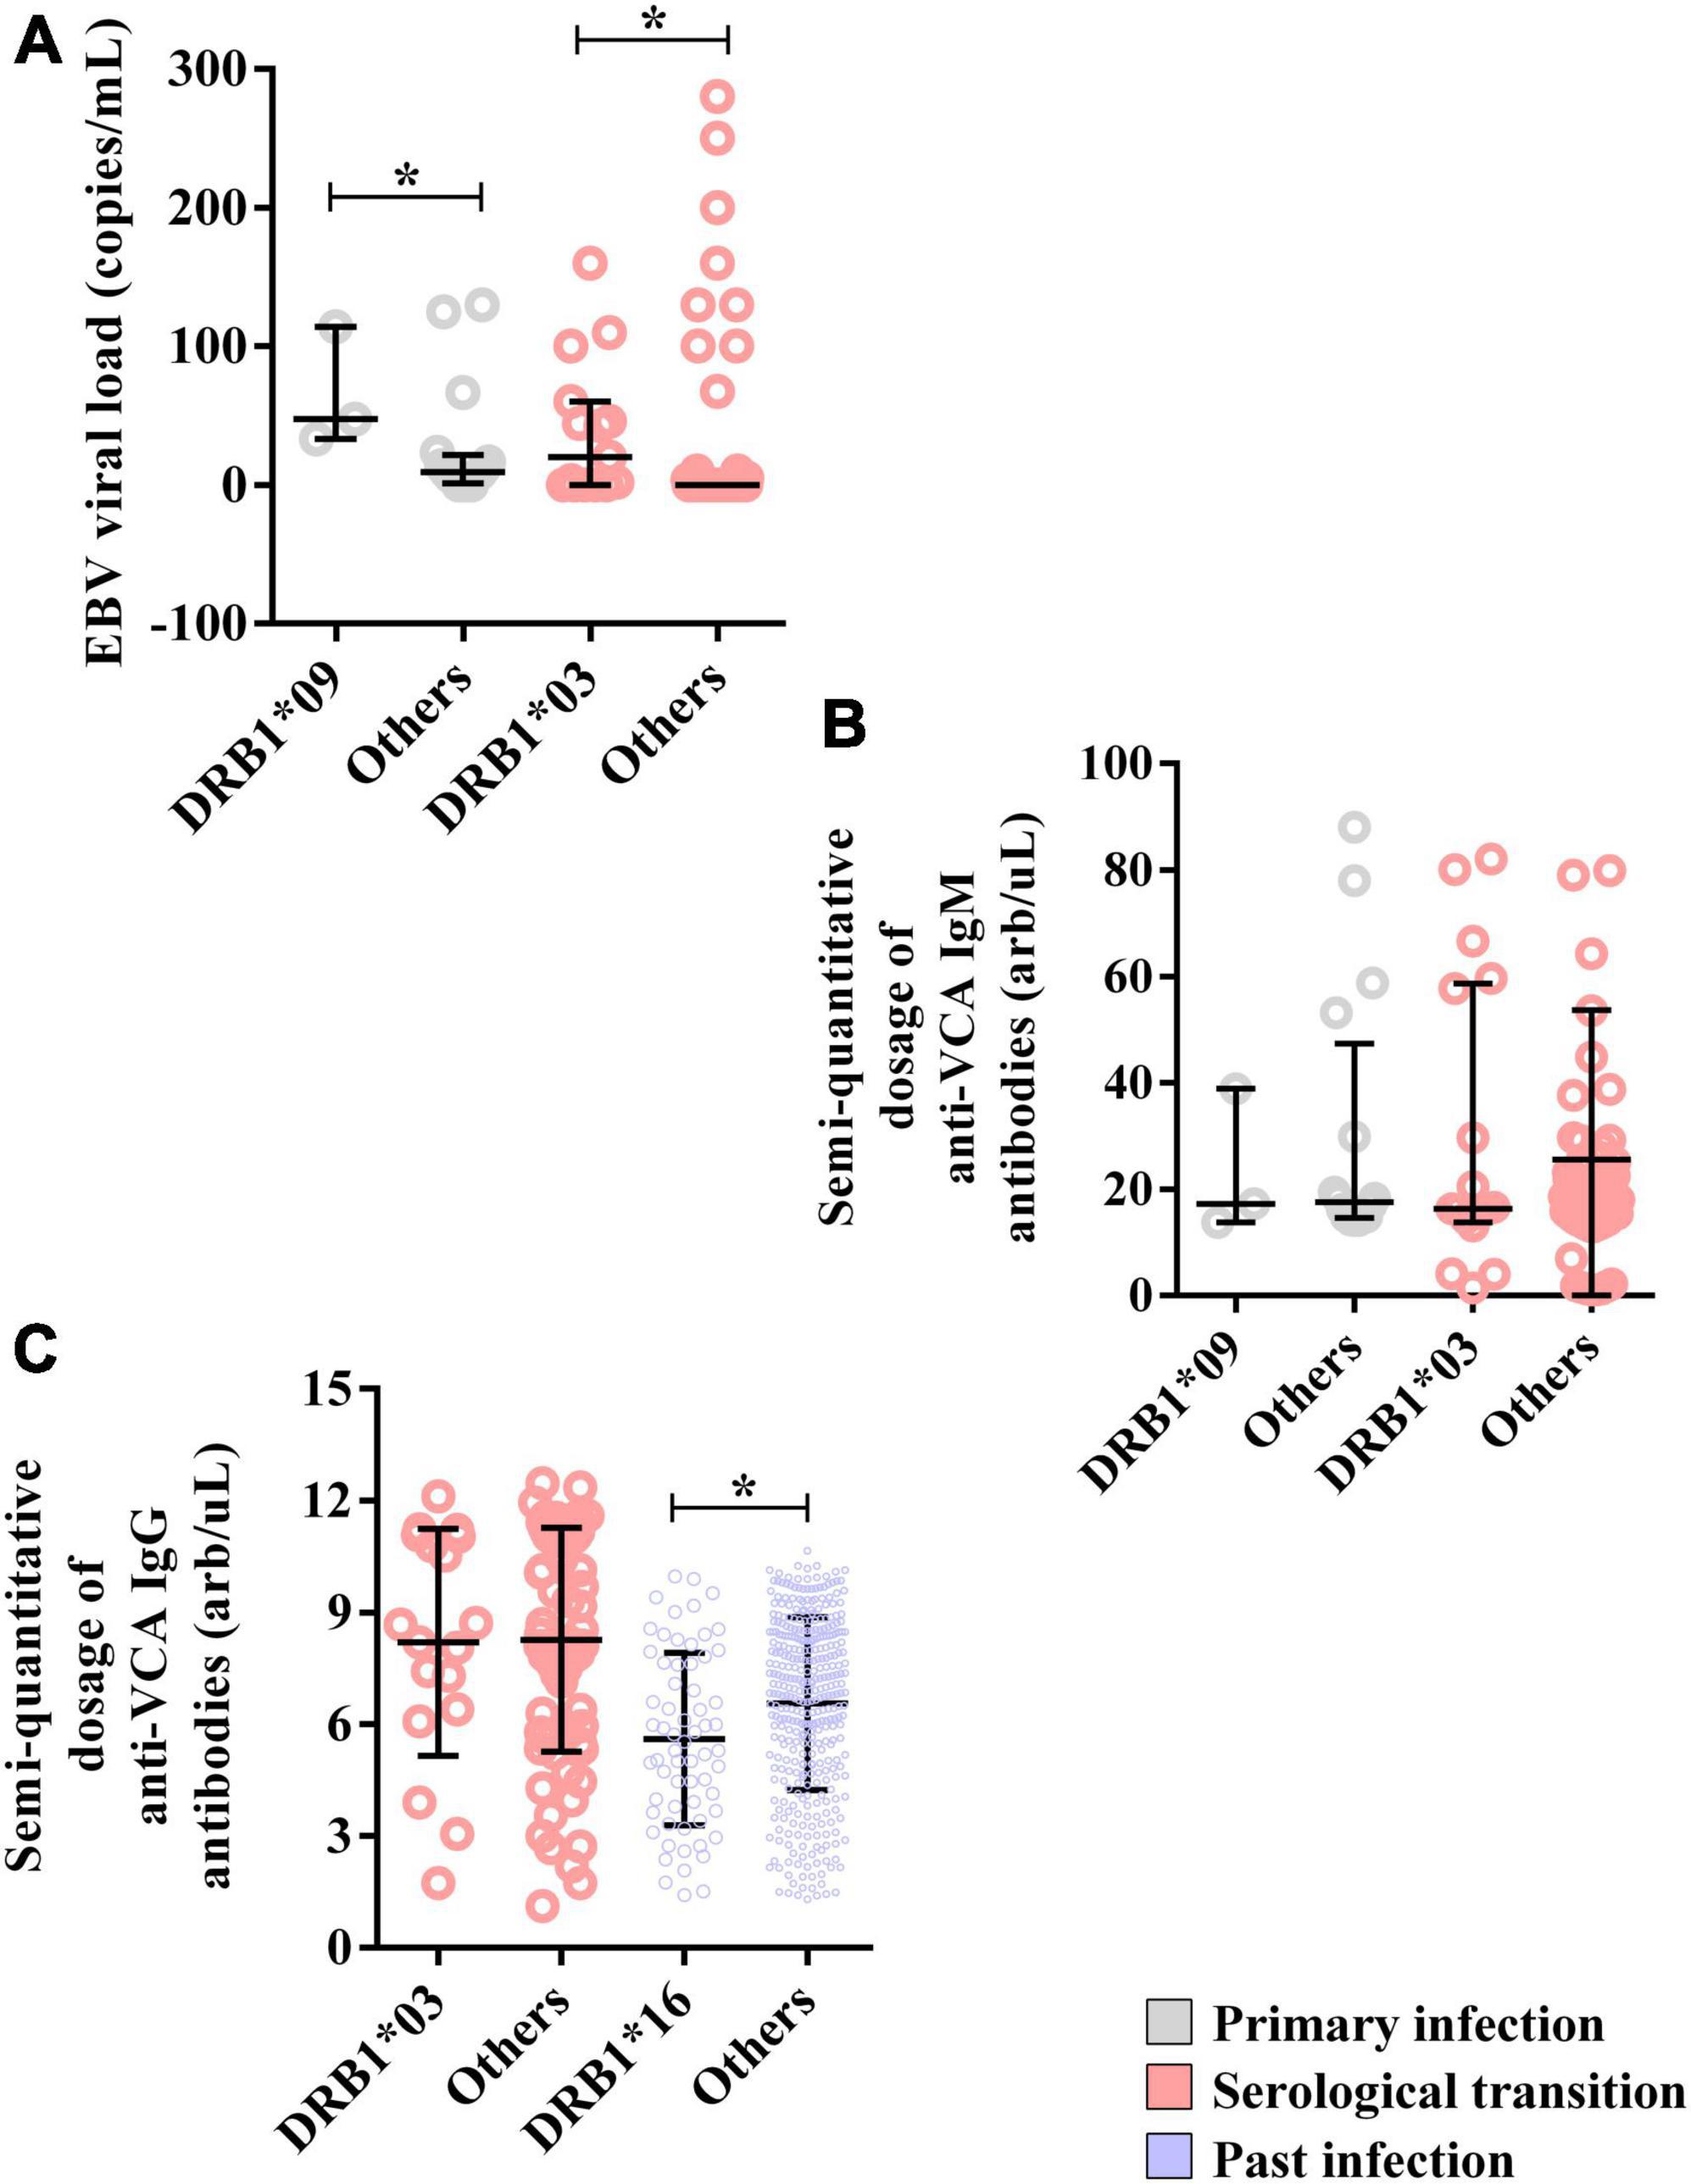
Figure 4. Alleles associated with EBV viral load and anti-VCA IgM and IgG antibody levels. (A) Dot plot graph showing the associations of the DRB1*03 and DRB1*09 alleles with the EBV load. (B) Dot plot graph showing the lack of association of the DRB1*03 and DRB1*09 alleles with semiquantitative IgM antibody titers. (C) Dot plot showing the association of the DRB1*16 allele with the semiquantitative IgG antibody titer. *p = 0.005–0.0001.
The CD8(+) T lymphocyte count was greater (DRB1*09 = median: 2844; IIQ: 2401.5–3054.0) (others = median: 975.5; IIQ: 795.5–1179.5); p = 0.0206) (Figure 5B), as was the double-positive T lymphocyte count (DRB1*09 = median: 27; IIQ: 21–29) (others = median: 3.5; IIQ: 2.75–7.00); p = 0.0093) (Figure 5D).
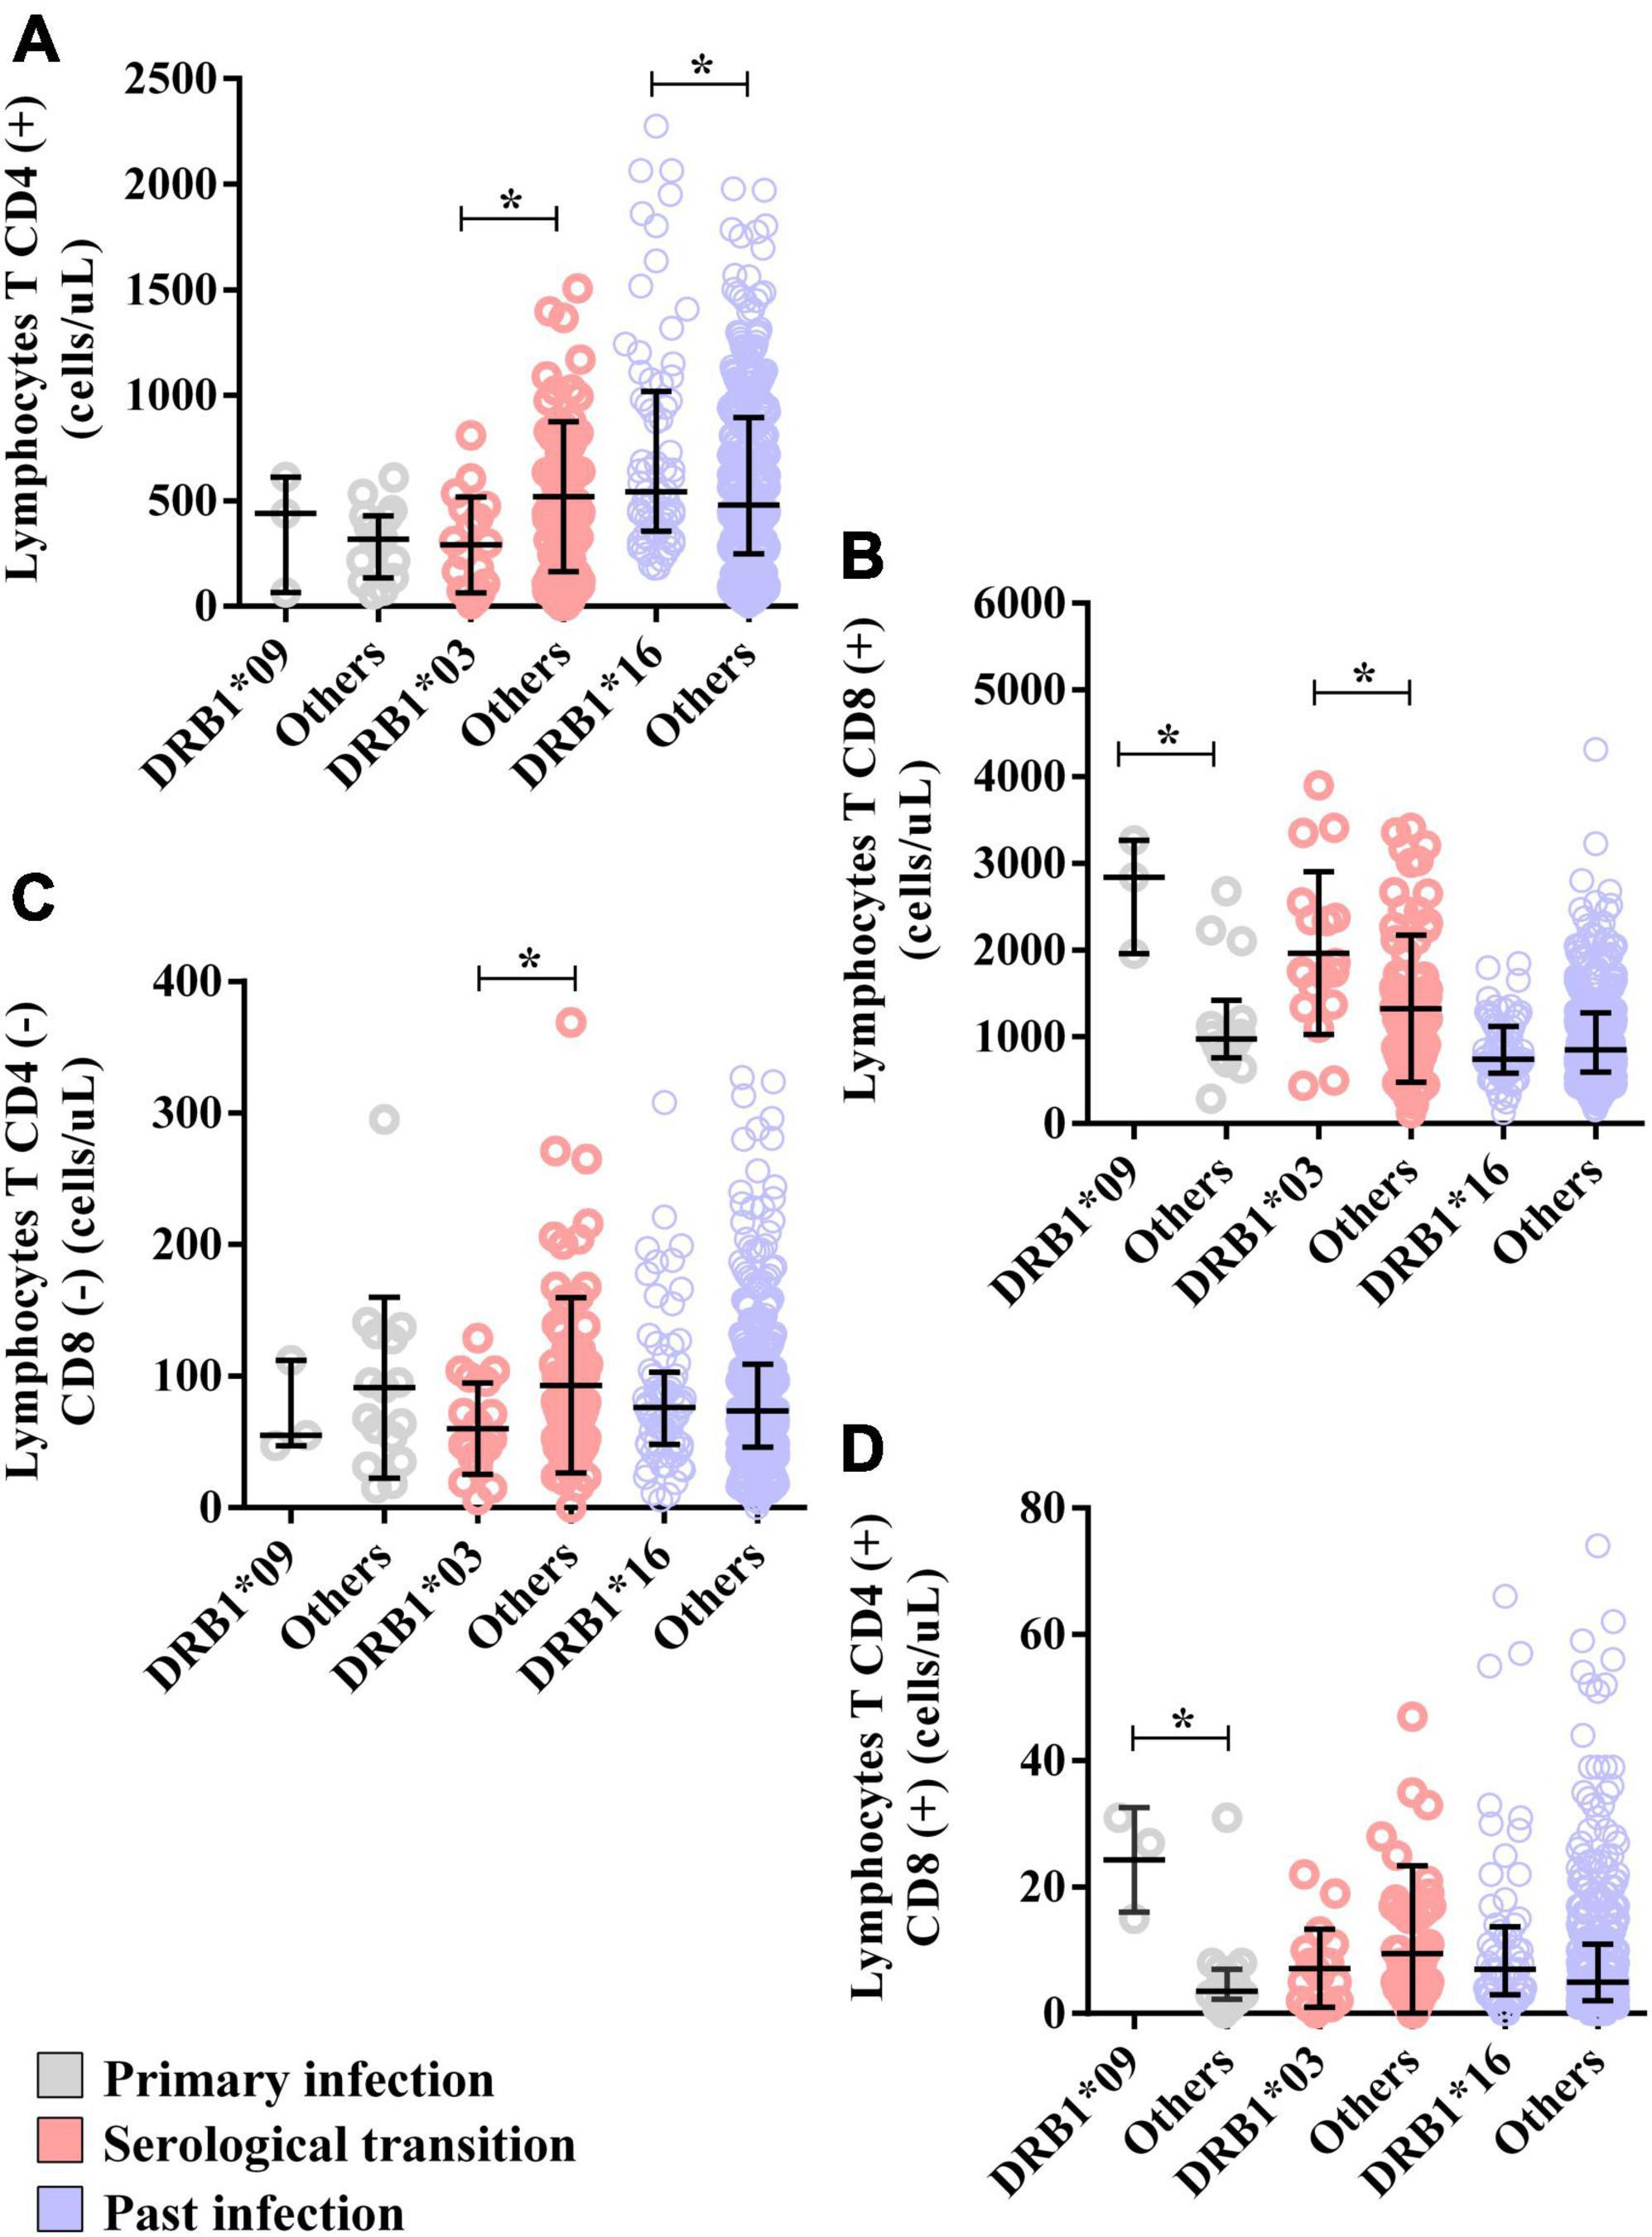
Figure 5. Alleles associated with the T lymphocyte count. (A) Dot plot showing the associations of the DRB1*03 and DRB1*16 alleles with the CD4(+) T lymphocyte count. (B) Dot plot graph showing the associations of the DRB1*03 and DRB1*09 alleles with the CD8(+) T lymphocyte count. (C) Dot plot showing the association of the DRB1*03 allele with the double-negative T lymphocyte count (CD8-CD4-). (D) Dot plot graph showing the association of the DRB1*09 allele with the double-positive T lymphocyte count (CD8+CD4+). *p = 0.005–0.0001.
The levels of TNF (DRB1*09 = median: 11.64; IIQ: 11.07–12.38); (others = median: 9.52; IIQ: 8.72–10.24); p = 0.0161) and IL-4 (DRB1*09 = median: 11.78; IIQ: 10.30–12.04); (others = median: 8.52; IIQ: 6.67–8.85); p = 0.0464) were also higher in the DRB1*09 allele carriers (Figure 6C). Other cytokines were not associated with the allele (Supplementary Data 1).
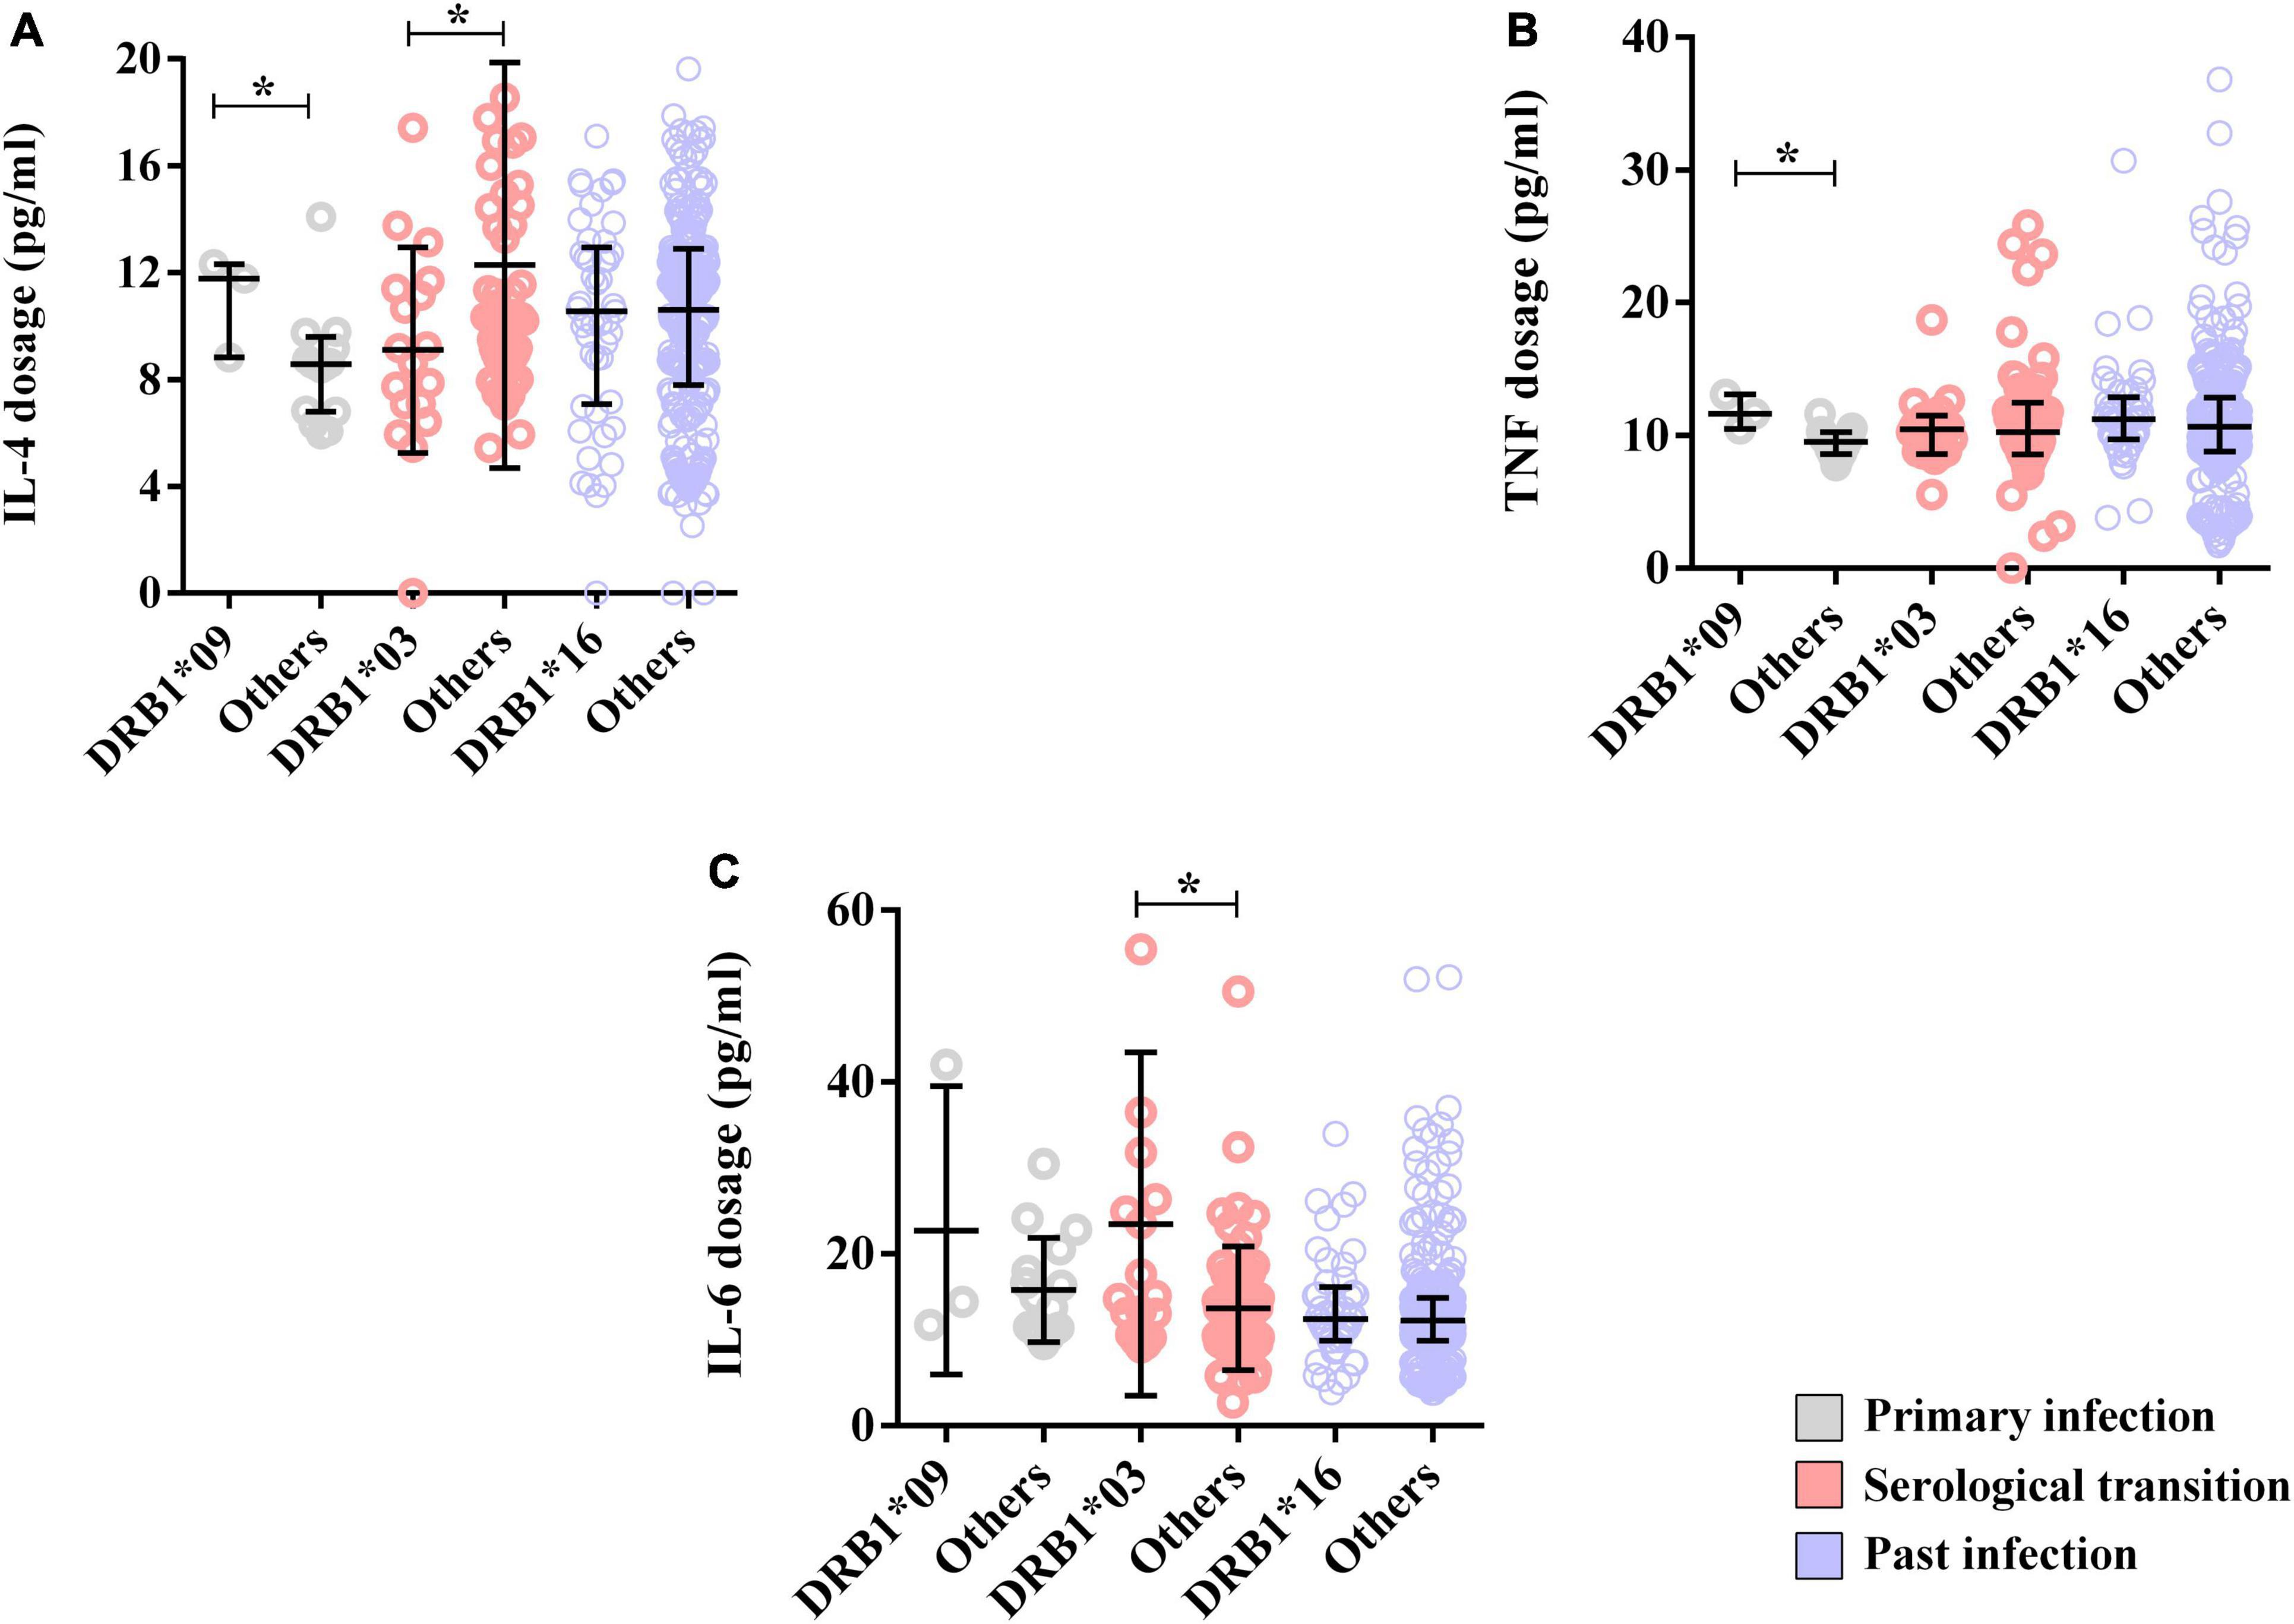
Figure 6. Alleles associated with cytokine dosage. (A) Dot plot showing the associations of the DRB1*03 and DRB1*09 alleles with the IL-4 concentration. (B) Dot plot showing the association of the DRB1*09 allele with the TNF-α level. (C) Dot plot showing the association of the DRB1*03 allele with the IL-6 level. *p = 0.005–0.0001.
The DRB1*03 allele was approximately 2-fold more frequent in patients who underwent a serological transition (OR: 2.1560; CI (95%): 1.27–3.67; p: 0.001) (Figure 3C).
Moreover, the EBV viral load was greater in DRB1*03 allele carriers (DRB1*03 = median: 20; IIQ: 0.00–52.98) (others = median: 0; IIQ: 0–0); p: 0.0015) (Figure 4A). In contrast, anti-VCA IgM and IgG titers were not associated with this allele (Figures 4B, C).
The CD4(+) T lymphocyte counts (DRB1*03 = median: 272; IIQ: 83.25–450.25); (others = median: 477; IIQ: 223.0–743.5); p: 0.0112) (Figure 5A) and double-negative T lymphocyte counts (DRB1*03 = median: 50; IIQ: 39.25–90.00); (others = median: 75; IIQ: 45.5–116.5); p: 0.0540) (Figure 5C) were lower in carriers of the DRB1*03 allele, but the CD8(+) T lymphocyte count was greater (DRB1*03 = median: 1749; IIQ: 1426.00–2367.25); (others = median: 1111; IIQ: 620.0–1687.5); p: 0.0260) (Figure 5B).
Additionally, IL-4 dosage levels were lower in carriers of this allele (DRB1*03 = median: 8.89; IIQ: 7.09–11.34); (others = median: 10.10; IIQ: 8.45–14.10); p: 0.0478) (Figure 6A), but the IL-6 level was greater (DRB1*03 = median: 14.96; IIQ: 11.22–26.00); (others = median: 12.46; IIQ: 9.44–16.62); p: 0.0175) (Figure 6B). Other cytokines were not associated with the allele (Supplementary Data 1).
In this study, the DRB1*16 allele was significantly associated with past EBV infection (OR: 0.2724; CI (95%): 0.10–0.76; p: 0.012) (Figure 3C), being up to 7-fold more frequent in this group.
The anti-VCA IgG titer was lower in DRB1*16 allele carriers (DRB1*16 = median: 5.41; IIQ: 3.76–7.63) (others = median: 6.9; IIQ: 4.93–8.39); p = 0.0020) (Figure 4C).
The CD4(+) T lymphocyte count was greater in carriers of this allele (DRB1*16 = median: 541; IIQ: 361–980) (others = median: 480; IIQ: 250.75–891.25); p = 0.0116) (Figure 5A). The counts of other cells were not associated with the allele; however, CD8(+) T lymphocytes tended toward lower counts in carriers of the allele (DRB1*16 = median: 744; IIQ: 595–1106; (others = median: 853; IIQ: 595–1273); p: 0.0602) (Figure 5B).
Our data showed that HIV infection was associated with serological profiles of EBV infection, which was more frequent in the group with primary infection (Table 1). We subsequently evaluated whether this aspect was also associated with alleles of the DRB1 locus. We found that the frequency of the DRB1*09 allele was significantly greater in individuals with HIV who were in the primary phase of EBV infection, at approximately 6 times greater in this group (OR: 6.15; CI (95%): 1.79–21.16; p: 0.0067). In contrast, the frequency of the DRB1*16 allele was greater in individuals with HIV who were in the past phase of EBV infection, at approximately 4 times greater in this group (OR: 4.19; CI (95%): 1.27–13.86; p: 0.0192) (Table 3).
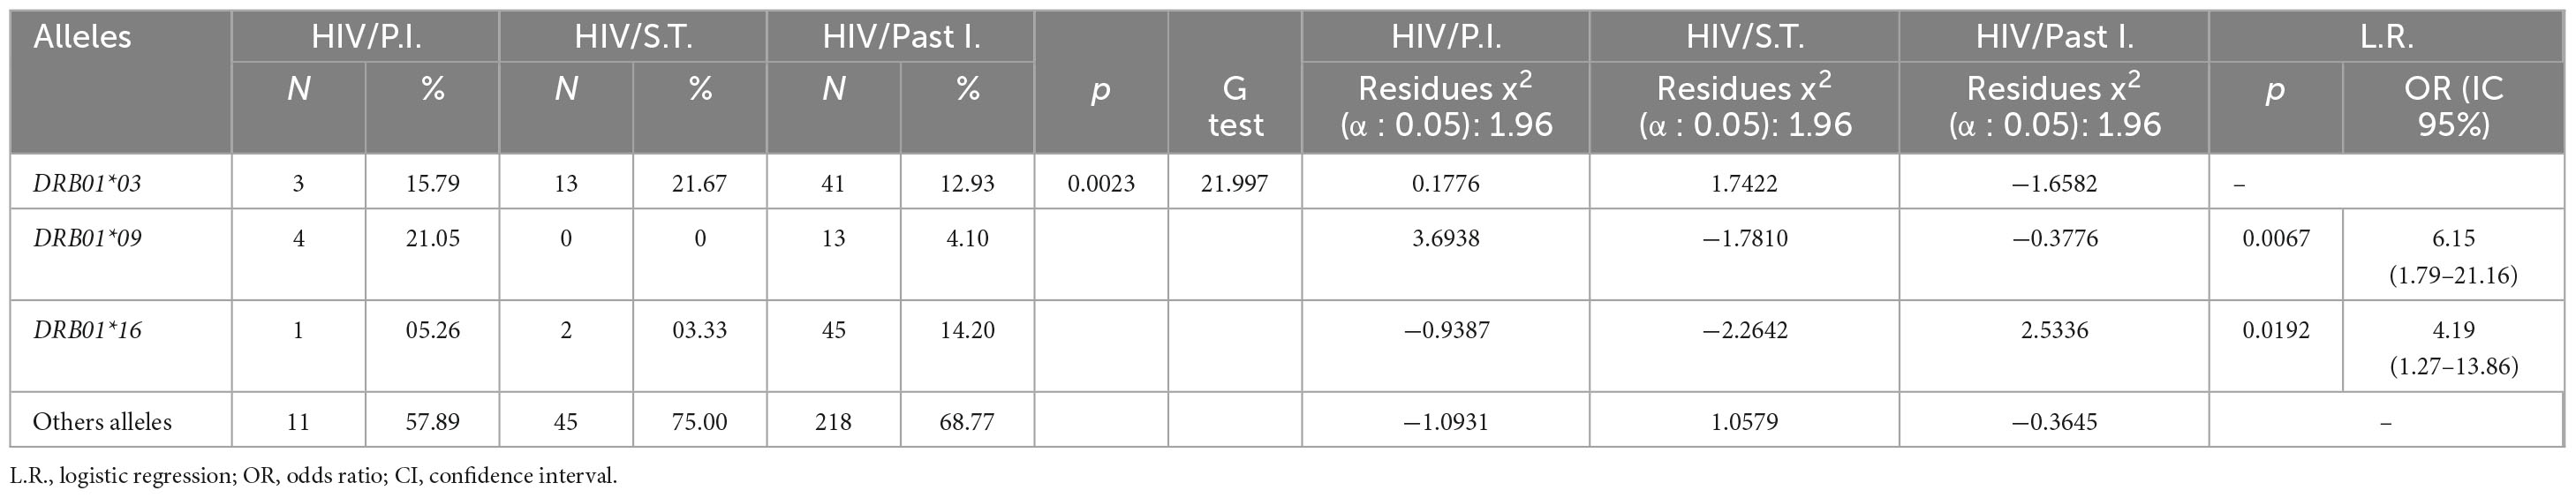
Table 3. Association of the frequency of HLA-DRB1 alleles with HIV infection in different phases of EBV infection.
We also evaluated whether these alleles are associated with several pathological markers of HIV infection (viral load, CD4+ T-cell count and CD8+ T lymphocyte count) (Figures 7A–H). We observed that carriers of the DRB1*09 allele in the primary phase of EBV infection had both higher log10 HIV viral loads (DRB1*09 = median: 5.67; IIQ: 5.56–5.76); (others = median: 4.45; IIQ: 3.85–5.33); p: 0.0176) (Figure 7A) and CD8(+) T lymphocyte counts (DRB1*09 = median: 2766.5; IIQ: 2506.5–2949.0); (others = median: 1024.5; IIQ: 834.5–2136.8); p: 0.0285) (Figure 7C) than carriers of other alleles. For individuals with past EBV infection and carriers of the DRB1*16 allele, no significant differences were observed in the quantification of these markers (Figures 7D–F).
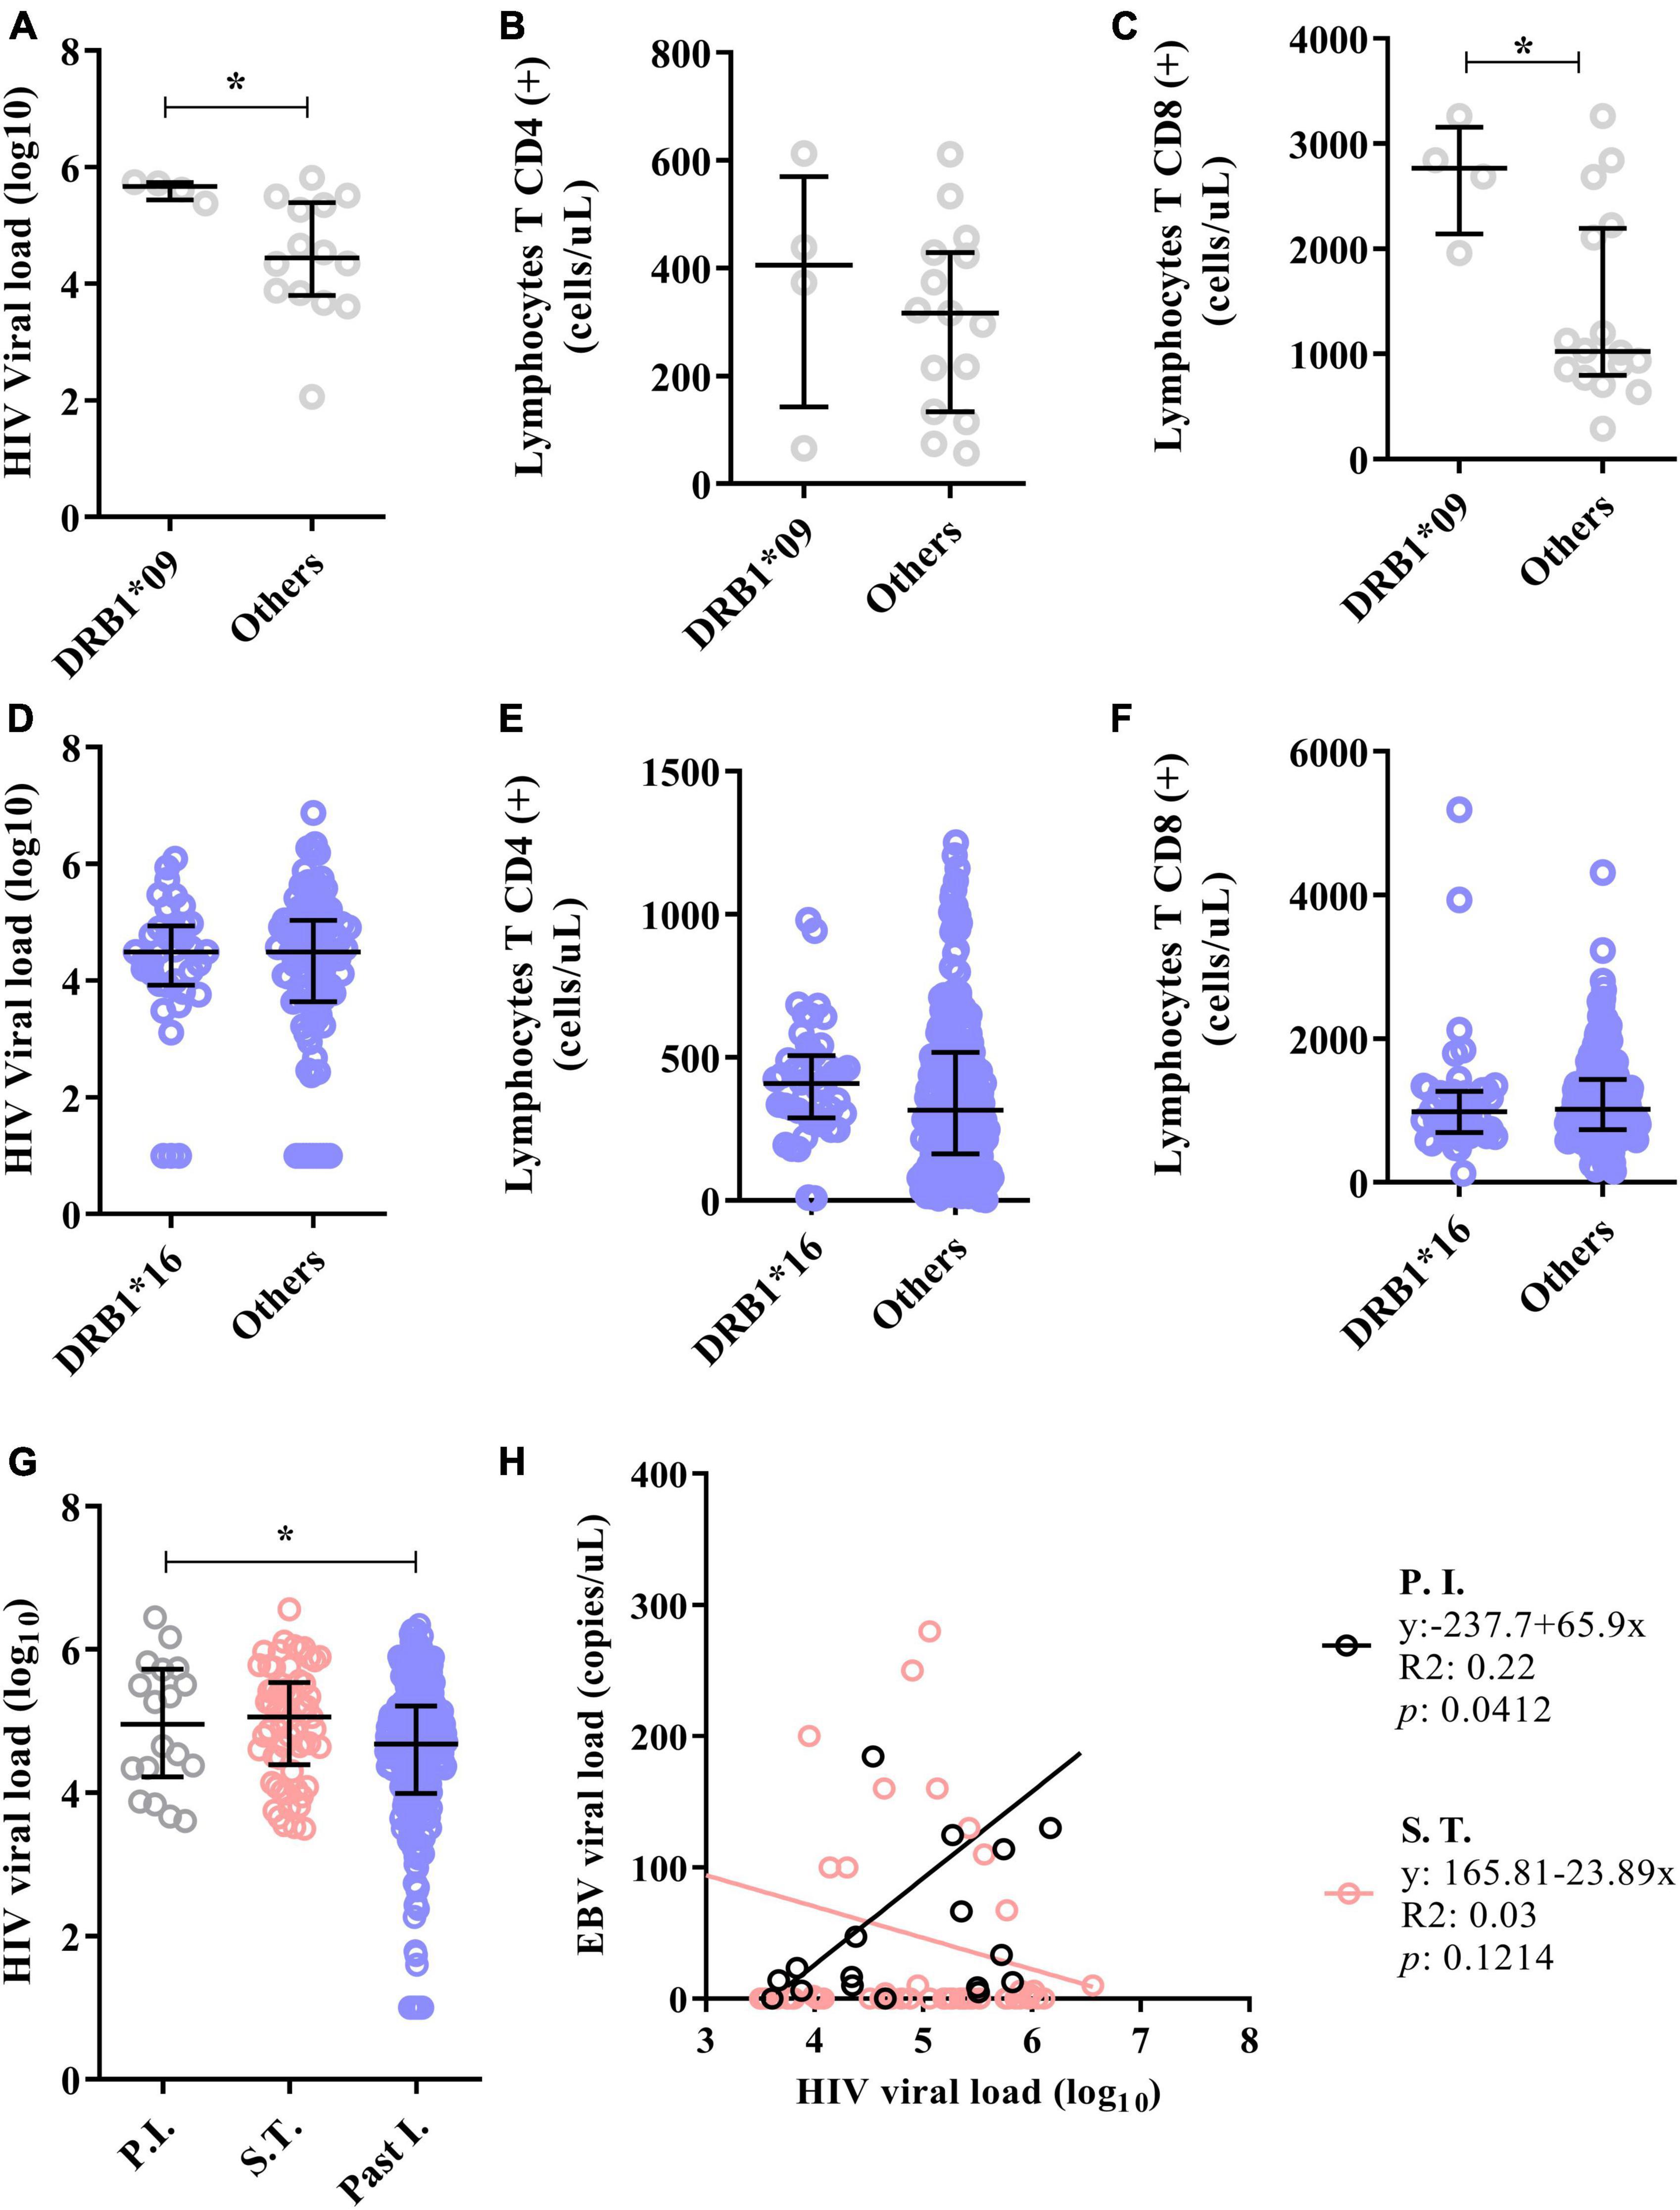
Figure 7. The DRB1*09 allele was associated with HIV/EBV coinfection. (A) Dot plot showing the association of the DRB1*09 allele with HIV viral load. (B) Dot plot graph showing the lack of association of the DRB1*09 allele with the CD4(+) T lymphocyte count. (C) Dot plot showing the association of the DRB1*09 allele with the CD8(+) T lymphocyte count. *p = 0.005–0.0001. (D–F) Dot plot graphs showing that the DRB1*16 allele was not associated with markers of HIV infection in individuals with past EBV infection. (G) Dot plot showing that the HIV viral load was elevated in the groups with primary EBV infection and in the serologic transition group. *p = 0.005–0.0001. (H) Linear regression between the viral loads of both viruses. The HIV viral load correlated positively with the EBV load in patients with primary EBV infection.
Our next step was to assess whether the HIV load is associated with the serological profile of EBV infection and the viral load. We found that the log10 HIV viral load was lower in patients with past EBV infection (P.I. = median: 4.96; IIQ: 4.34–5.67); (S.T. = median: 5.06; IIQ: 4.49–5.52); (Past I. = median: 4.68; IIQ: 3.99–5.21); p = 0.0060) (Figure 7G).
Furthermore, positive linear regression was inferred between viral load in patients with primary EBV infection (R2: 0.22; p: 0.0412). There was also a negative trend in the viral load in patients who underwent serological transition, although the difference was not statistically significant (R2: 0.03; p = 0.1214) (Figure 7H).
The FPRP values for significant findings at different probability levels are shown in Table 4. In most findings, FPRP was notable in the range between 10 and 25% probability of association between alleles with serological profiles of EBV infection, which seems adequate for studies of genetic associations in general (25).
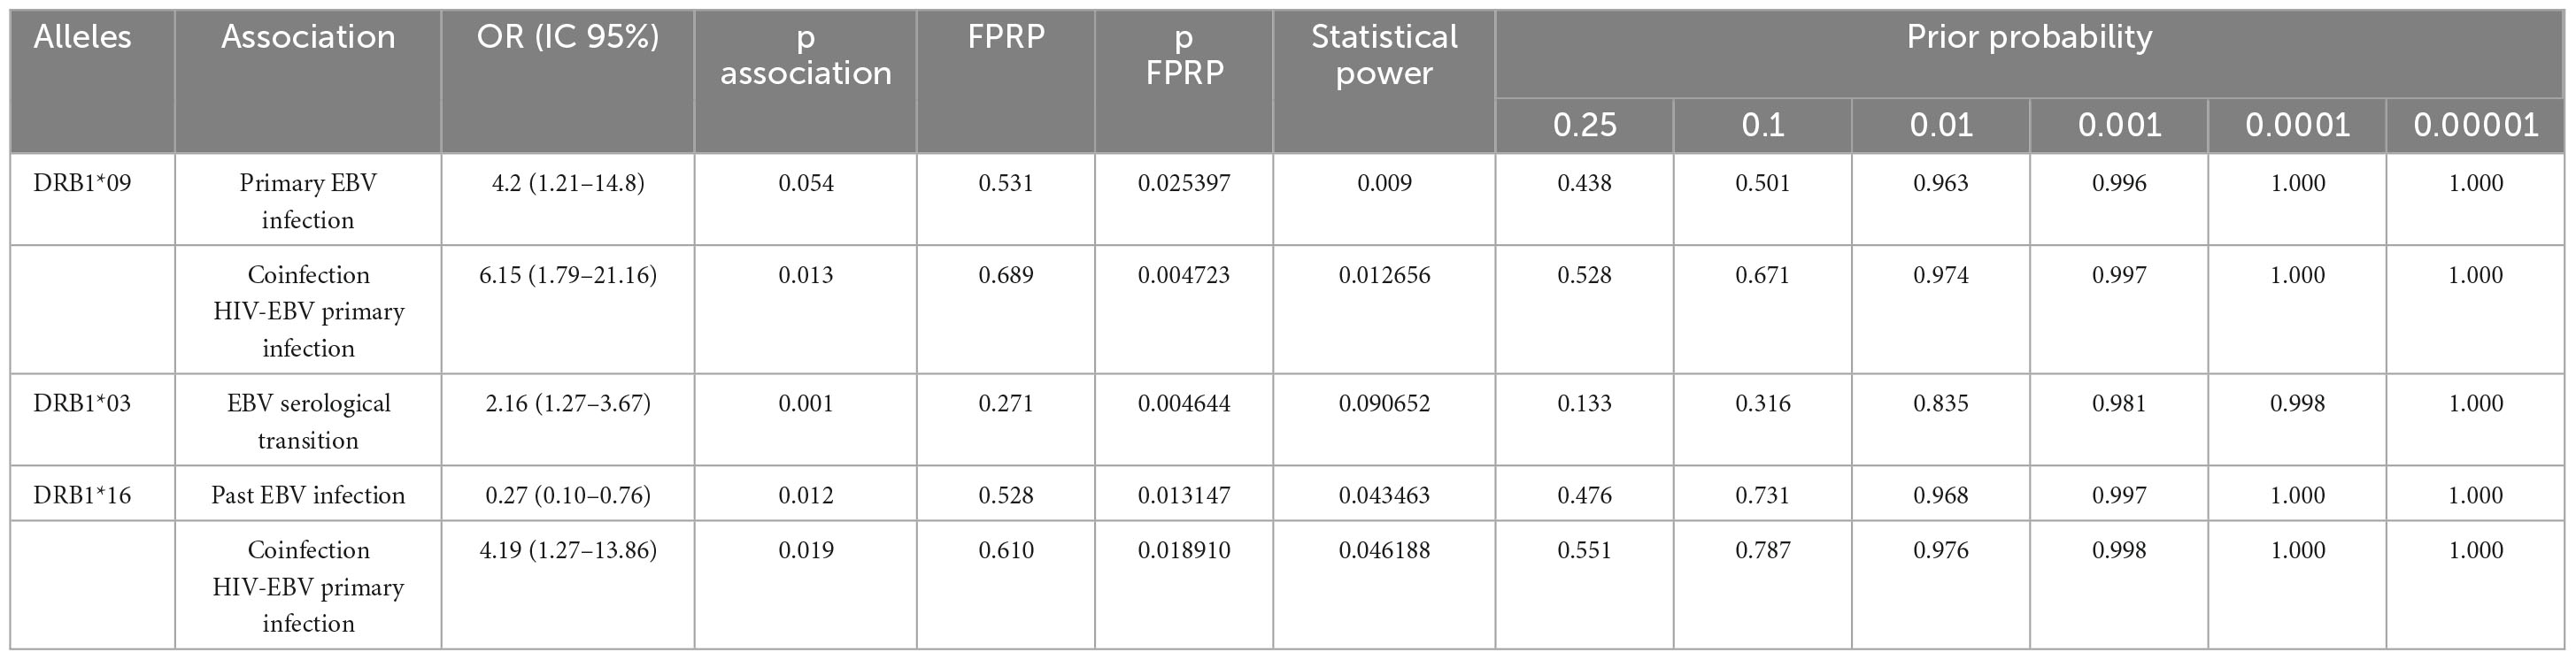
Table 4. Calculation of the false-positive report probability (FPRP) for risk associations of HLA-DRB1 alleles with serological profiles of EBV infection.
The low power of the statistical test is challenging if we consider the sampling obtained, suggesting additional validations using larger samples. However, the epidemiological aspects of control studies can lead to bias in the intended analyses.
We stratified the study population into three serological profiles, which were also immunologically distinguished in terms of EBV viral load and CD4(+) and CD8(+) T lymphocyte counts. In patients with primary infection, viral biosynthesis was more active and statistically significant, as we observed CD8(+) T lymphocyte count maintenance and CD4(+) T lymphocyte depletion. This seems to agree with studies showing differential kinetics of T lymphocytes in primary EBV infection, in which the CD4(+) T lymphocyte response appears early, with a rapid decrease, although the CD8(+) T lymphocyte response tends to be more robust and durable (28, 29). This complex response reflects the immunodominance of the proinflammatory cytokine profile in primary infection (30); nevertheless, the presence of anti-inflammatory cytokines suggests the immunomodulation of EBV (31), which could also explain our findings regarding the correlation matrix between immunological factors and cytokines in different profiles.
In this context, we observed that the HLA class II DRB1*09 allele frequency was associated with primary EBV infection. In fact, the association of this allele with the incidence of infection and, mainly, autoimmune diseases in populations with different ethnic profiles has been discussed, and it has been suggested that the allele favors inflammation related to the establishment of pathological conditions (32–36). Recently, a study carried out in Japanese individuals revealed an association between the DRB1*09 allele and severe cases of COVID-19 (37), which, from an immunological point of view, is characterized by a systemic inflammatory state (38). Our results appear to agree with this hypothesis, as carriers of the DRB1*09 allele had high CD8(+) and double-positive T lymphocyte counts and TNF levels, which may be indicative of an attempt to maintain a proinflammatory antiviral response to active EBV infection (39), as represented by the high viral load in carriers. On the other hand, high IL-4 levels in the same group may be associated with viral persistence (40, 41), which is also in line with our results showing a positive correlation between cytokine levels and the EBV load.
However, the negative correlation between the EBV load and CD4(+) T lymphocyte count conflicts with the findings in the literature. This suggests that the observed lymphopenia may, in part, not be specific to EBV infection (42). Interestingly, all patients with primary infection had a history of coinfection, with HIV being the most frequent, and the HIV viral load was high and directly proportional to that of EBV. We believe that the presence of HIV might be closely related to changes in lymphocyte counts, as expected in a typical infection (43), favoring the expansion of EBV (44). In fact, in a recent study involving patients with primary infection and a history of coinfection, we showed that in HIV/EBV coinfection, retroviral pathology benefits at the expense of host immune response maintenance (45).
Here, we highlight that the DRB1*09 allele frequency is associated with HIV-1/EBV coinfection, specifically primary EBV infection, and that both the HIV viral load and CD8(+) T lymphocyte count are elevated in these patients. Again, probable immunological modulation by this allele is related to an attempt to maintain the response to viral coinfection. Our hypothesis is that the overstimulation of active EBV/HIV coinfection highlights the inflammatory response naturally favored by carriers of the DRB1*09 allele in an attempt to modulate a more effective immunological profile in defense against pathogens. Although we did not assess the predominance of response specificity, a consistent response against HIV can trigger immune activation against EBV (46) and may differ in terms of magnitude and polyfunctionality (47). Regardless, there is a strong relationship between the viral loads of the viruses (48).
Patients in serological transition were characterized by a low EBV viral load and maintenance of CD4(+) and CD8(+) T lymphocyte counts; cytokines correlated strongly with each other but without a clear immunodominance profile. This scenario likely reflects sustainable immunological control of the active phase of the infection and consequent management of the homeostatic balance of an expected response in the latent phase (49). In this case, the establishment of a viral memory pool with qualitatively different responses to lytic and latent virus antigens is also observed (50).
In general, patients in serological transition who were coinfected with HIV maintained a high HIV viral load, even though there was no association with an EBV viral load. Hence, the attempt at immune reboot observed in the transition group, which is expected due to the characteristics of EBV in the latent phase (10, 51), may assist in the response to HIV. This is due, among other factors, to the production of CD40 receptor binding protein (CD40L) in CD4(+) T lymphocytes cocultured with EBV-infected B lymphocytes. CD40L can disfavor both the maintenance of EBV replication (51) and HIV replication (52) through the modulation of a consistent immune response. The fact that the HIV viral load was lower in the group with past infection than in the other groups may indicate that this process of immunological control occurs in the long term. Nonetheless, we cannot ignore the close relationship between these viruses and the stimulation of carcinogenic conditions (53), which requires a detailed assessment of long-term aspects of the pathogenesis of coinfection. Most patients in the present study had no cancer diagnosis or family history of cancer.
The DRB1*03 allele was associated with serological transition; however, contrary to the immunological tendency observed in the group, carriers of this allele had a high viral load and a suggestive proinflammatory profile, as represented by an increase in CD8(+) T lymphocytes and IL-6 and low IL-4. Such immune modulation has been associated with the DRB1*03 allele in the context of autoimmune diseases and therapy-induced platelet disorders in different populations (54–59). In addition, a Brazilian ecological study showed the association of haplotypes containing the DRB1*03 allele with the rate of deaths from COVID-19 (60). We propose that the persistence of viral activation specifically in carriers of the DRB1*03 allele can induce an effective immune counterresponse for controlling infection. A longitudinal study evaluating whether this immunological and virological profile of DRB1*03 allele carriers is maintained in the long term, even after complete seroconversion, would be enlightening, especially in cases of active chronic EBV infection (CAEBV) (61).
Patients with past EBV infection had high counts of CD4(+) T lymphocytes but low counts of CD8(+) T lymphocytes. Nonetheless, a certain degree of immunological activity was observed, mainly by the correlation of CD4(+) and double-negative T lymphocytes with proinflammatory cytokines, which may be a reflection of the immune response to HIV infection that was present in approximately 53% of this group. Our results suggest that in the absence of active EBV infection, patients with HIV appear to have a good prognosis, which is in line with studies that reinforce the association of EBV with HIV progression (62, 63).
The DRB1*16 allele was associated with past infection, anti-VCA IgG titer regulation and a high CD4(+) T lymphocyte count but was suggestive of a low CD8(+) T-cell count. Our findings appear to contradict studies that relate this allele to proinflammatory profiles in autoimmune diseases in different ethnic groups, some of which were acquired after viral infections (64, 65). For example, a study associated the DRB1*16 allele with susceptibility to chronic hepatitis B (66). However, we showed that DRB1*16 allele carriers tended to exhibit control of the immune response, consistent with the profile of patients with past EBV infection.
We conclude that the DRB1*09, *03 and *16 alleles seem to be associated with immunological modulation in different serological profiles of EBV infection in young adult patients from the Brazilian Amazon region who, in the majority, were coinfected with HIV-1. A limiting factor of this proposal is that we were unable to sample patients with only primary EBV monoinfection within the universe studied, so we could actually distinguish whether the frequency of the alleles was more strongly associated with EBV or EBV/HIV-1 coinfection; however, we highlight that, to our knowledge, this is the first report that links these alleles to viral infections.
The datasets presented in this study can be found in online repositories. The names of the repository/repositories and accession number(s) can be found in the article/Supplementary material.
The studies involving humans were approved by the Ethics Committee in Research with Human Beings of the IEC (Protocol: 3.121.265; CAAE: 73927717.3.0000.0019). The studies were conducted in accordance with the local legislation and institutional requirements. The participants provided their written informed consent to participate in this study. Written informed consent was obtained from the individual(s) for the publication of any potentially identifiable images or data included in this article.
LP: Data curation, Formal analysis, Investigation, Methodology, Writing – original draft. ESF: Investigation, Methodology, Writing – review and editing. IC: Investigation, Methodology, Resources, Writing – review and editing. IL: Investigation, Methodology, Writing – review and editing. EJ: Investigation, Methodology, Writing – review and editing. PM: Investigation, Methodology, Writing – review and editing. AF: Investigation, Methodology, Writing – review and editing. FR: Investigation, Methodology, Writing – review and editing. TM: Investigation, Methodology, Writing – review and editing. OM: Investigation, Methodology, Resources, Writing – review and editing. RS: Investigation, Methodology, Supervision, Writing – review and editing. FF: Data curation, Investigation, Methodology, Supervision, Writing – review and editing. IC: Funding acquisition, Project administration, Supervision, Writing – review and editing. AV: Conceptualization, Funding acquisition, Project administration, Supervision, Writing – review and editing.
The author(s) declare that financial support was received for the research, authorship, and/or publication of this article. This study was funded by the specific incentives from Secretaria de Vigilância em Saúde do Ministério da Saúde, Conselho Nacional de Desenvolvimento Científico e Tecnológico - CNPQ (n° 301869/2017-0; 302935/2021-5), and the Instituto Nacional de Ciência e Tecnologia em Viroses Emergentes e Reemergentes - INCT-VER (#406360/2022-7). We thank Coordenação de Aperfeiçoamento de Pessoal de Nível Superior (CAPES) for providing a scholarship (process number: 88882.183970/2018-01).
We thank the entire technical and administrative staff of the participating institutions for their help in recruiting patients for the study, as well as all the participants for their trust and ability to participate in the study.
The authors declare that the research was conducted in the absence of any commercial or financial relationships that could be construed as a potential conflict of interest.
All claims expressed in this article are solely those of the authors and do not necessarily represent those of their affiliated organizations, or those of the publisher, the editors and the reviewers. Any product that may be evaluated in this article, or claim that may be made by its manufacturer, is not guaranteed or endorsed by the publisher.
The Supplementary Material for this article can be found online at: https://www.frontiersin.org/articles/10.3389/fmed.2024.1408290/full#supplementary-material
1. Son K, Shin M. Clinical features of Epstein-Barr virus-associated infectious mononucleosis in hospitalized Korean children. Korean J Pediatr. (2011) 54:409–13. doi: 10.3345/kjp.2011.54.10.409
2. Bolis V, Karadedos C, Chiotis I, Chaliasos N, Tsabouri S. Atypical manifestations of Epstein-Barr virus in children: a diagnostic challenge. J Pediatr. (2016) 92:113–21. doi: 10.1016/j.jped.2015.06.007
3. Dunmire S, Hogquist K, Balfour H. Infectious mononucleosis. Curr Top Microbiol Immunol. (2015) 390:211–40. doi: 10.1007/978-3-319-22822-8_9
4. Dunmire S, Verghese P, Balfour H. Primary Epstein-Barr vírus infection. J Clin Virol. (2018) 102:84–92. doi: 10.1016/j.jcv.2018.03.001
5. De Paschale M, Clerici P. Serological diagnosis of Epstein-Barr virus infection: problems and solutions. World J Virol. (2012) 1:31–43. doi: 10.5501/wjv.v1.i1.31
6. Grimm J, Schmeling D, Dunmire S, Knight J, Mullan B, Ed J, et al. Prospective studies of infectious mononucleosis in university students. Clin Transl Immunol. (2016) 5:e94. doi: 10.1038/cti.2016.48
7. Hatton O, Harris-Arnold A, Schaffert S, Krams S, Martinez O. The interplay between Epstein-Barr virus and B lymphocytes: implications for infection, immunity, and disease. Immunol Res. (2014) 58:268–76. doi: 10.1007/s12026-014-8496-1
8. Münz C. Latency and lytic replication in Epstein-Barr virus-associated oncogenesis. Nat Rev Microbiol. (2019) 17:691–700. doi: 10.1038/s41579-019-0249-7
9. Kerr J. Epstein-Barr virus (EBV) reactivation and therapeutic inhibitors. J Clin Pathol. (2019) 72:651–8. doi: 10.1136/jclinpath-2019-205822
10. Shindiapina P, Ahmed E, Mozhenkova A, Abebe T, Baiocchi R. Immunology of EBV-related Lymphoproliferative disease in HIV-positive individuals. Front Oncol. (2020) 10:1723. doi: 10.3389/fonc.2020.01723
11. Legoff J, Amiel C, Calisonni O, Fromentin D, Rajoely B, Abuaf N, et al. Early impairment of CD8+ T cells immune response against Epstein-Barr virus (EBV) antigens associated with high level of circulating mononuclear EBV DNA load in HIV infection. J Clin Immunol. (2004) 24(2):125–34. doi: 10.1023/B:JOCI.0000019777.75784.6f
12. Byrne C, Johnston C, Orem J, Okuku F, Huang M, Rahman H, et al. Examining the dynamics of Epstein-Barr virus shedding in the tonsils and the impact of HIV-1 coinfection on daily saliva viral loads. PLoS Comput Biol. (2021) 17(6):e1009072. doi: 10.1371/journal.pcbi.1009072
13. Gasser O, Bihl F, Wolbers M, Loggi E, Steffen I, Hirsch H, et al. Cohort Study. HIV patients developing primary CNS lymphoma lack EBV-specific CD4+ T cell function irrespective of absolute CD4+ T cell counts. PLoS Med. (2007) 4(3):e96. doi: 10.1371/journal.pmed.0040096
14. McHugh D, Myburgh R, Caduff N, Spohn M, Kok Y, Keller CW. EBV renders B cells susceptible to HIV-1 in humanized mice. Life Sci Alliance. (2020) 3(8):e202000640. doi: 10.26508/lsa.202000640
15. Pereira L, Dos Santos França E, Costa I, Lima I, Freire A, de Paula Ramos F. Epidemiological risk factors associated with primary infection by Epstein-Barr virus in HIV-1-positive subjects in the Brazilian Amazon region. Sci Rep. (2021) 11(1):18476. doi: 10.1038/s41598-021-97707-4
16. Balfour H, Sifakis F, Sliman J, Knight J, Schmeling D, Thomas W. Age-specific prevalence of Epstein-Barr virus infection among individuals aged 6-19 years in the United States and factors affecting its acquisition. J Infect Dis. (2013) 208:1286–93. doi: 10.1093/infdis/jit321
17. Khanna R, Burrows S, Neisig A, Neefjes J, Moss D, Silins S. Hierarchy of Epstein-Barr virus-specific cytotoxic T-cell responses in individuals carrying different subtypes of an HLA allele: implications for epitope-based antiviral vaccines. J Virol. (1997) 71:7429–35. doi: 10.1128/JVI.71.10.7429-7435
18. Silins S, Cross S, Elliott S, Pye S, Burrows J, Moss D, et al. Selection of a diverse TCR repertoire in response to an Epstein-Barr virus-encoded transactivator protein BZLF1 by CD8+ cytotoxic T lymphocytes during primary and persistent infection. Int Immunol. (1997) 11:1745–55. doi: 10.1093/intimm/9.11.1745
19. Sauce D, Larsen M, Abbott R, Hislop A, Leese A, Khan N, et al. Upregulation of interleukin 7 receptor alpha and programmed death 1 marks an epitope-specific CD8+ T-cell response that disappears following primary Epstein-Barr virus infection. J Virol. (2009) 83:9068–78. doi: 10.1128/JVI.00141-09
20. McAulay K, Higgins C, Macsween K, Lake A, Jarrett R, Robertson F, et al. HLA class I polymorphisms are associated with development of infectious mononucleosis upon primary EBV infection. J Clin Invest. (2007) 117:3042–8. doi: 10.1172/JCI32377
21. Horst D, van Leeuwen D, Croft N, Garstka M, Hislop A, Kremmer E, et al. Specific targeting of the EBV lytic phase protein BNLF2a to the transporter associated with antigen processing results in impairment of HLA class I-restricted antigen presentation. J Immunol. (2009) 182:2313–24. doi: 10.4049/jimmunol.0803218
22. Su C, Lu F, Soldan S, Lamontagne R, Tang H, Napoletani G, et al. EBNA2 driven enhancer switching at the CIITA-DEXI locus suppresses HLA class II gene expression during EBV infection of B-lymphocytes. PLoS Pathog. (2021) 17:e1009834. doi: 10.1371/journal.ppat.1009834
23. Sample J, Young L, Martin B, Chatman T, Kieff E, Rickinson A, et al. Epstein-Barr virus types 1 and 2 differ in their EBNA-3A, EBNA-3B, and EBNA-3C genes. J Virol. (1990) 64:4084–92. doi: 10.1128/JVI.64.9.4084-4092.1990
24. Lorenzetti M, Altcheh J, Moroni S, Moscatelli G, Chabay P, Preciado M. EBNA1 sequences in Argentinean pediatric acute and latent Epstein-Barr virus infection reflect circulation of novel South American variants. J Med Virol. (2010) 82:1730–8. doi: 10.1002/jmv.21871
25. Wacholder S, Chanock S, Garcia-Closas M, El Ghormli L, Rothman N. Assessing the probability that a positive report is false: an approach for molecular epidemiology studies. J. Natl Cancer Inst. (2004) 96:434–42. doi: 10.1093/jnci/djh075
26. Raymond M, Rousset FGENEPOP. (versão 1.2): population genetics software for accurate testing and ecumenism. J Heredity (1995) 86:248–9.
27. Ayres M, Ayres M, Ayres D, Santos A. BioEstat 5.0: Aplicações Estatísticas nas Áreas de Ciências Biológicas e Médicas. Belém: Sociedade Civil Mamirauá (2008).
28. Precopio M, Sullivan J, Willard C, Somasundaran M, Luzuriaga K. Differential kinetics and specificity of EBV-specific CD4+ and CD8+ T cells during primary infection. J Immunol. (2003) 170:2590–8. doi: 10.4049/jimmunol.170.5.2590
29. Piriou E, van Dort K, Weel J, Bemelman F, Gamadia L, van Oers M, et al. Detailed kinetics of EBV-specific CD4+ and CD8+ T cells during primary EBV infection in a kidney transplant patient. Clin Immunol. (2006) 119:16–20. doi: 10.1016/j.clim.2005.11.009
30. Wada T, Muraoka M, Yokoyama T, Toma T, Kanegane H, Yachie A. Cytokine profiles in children with primary Epstein-Barr virus infection. Pediatr Blood Cancer. (2013) 60:E46–8. doi: 10.1002/pbc.24480
31. Jabs W, Wagner H, Schlenke P, Kirchner H. The primary and memory immune response to Epstein-Barr virus infection in vitro is characterized by a divergent production of IL-1beta/IL-6 and IL-10. Scand. J Immunol. (2000) 52:304–8. doi: 10.1046/j.1365-3083.2000.00776.x
32. Du J, Liu J, Gu J, Zhu PH. LA-DRB1*09 is associated with increased incidence of cytomegalovirus infection and disease after allogeneic hematopoietic stem cell transplantation. Biol. Blood Marrow Transplant. (2007) 13:1417–21. doi: 10.1016/j.bbmt.2007.09.003
33. Williams A, Aitken R, Chandler M, Gillespie K, Lampasona V, Bingley P. Autoantibodies to islet antigen-2 are associated with HLA-DRB1*07 and DRB1*09 haplotypes as well as DRB1*04 at onset of type 1 diabetes: the possible role of HLA-DQA in autoimmunity to IA-2. Diabetologia. (2008) 51:1444–8. doi: 10.1007/s00125-008-1047-3
34. Mackie S, Taylor J, Martin S, Wordsworth P, Steer S, Wilson A, et al. A spectrum of susceptibility to rheumatoid arthritis within HLA-DRB1: stratification by autoantibody status in a large UK population. Genes Immun. (2012) 13:120–8. doi: 10.1038/gene.2011.60
35. Tian L, Hou L, Wang L, Xu H, Xiao J, Ying BH. LA-DRB1*09:01 allele is associated with anti-E immunization in a Chinese population. Transfusion. (2018) 58:1536–9. doi: 10.1111/trf.14568
36. Zhang M, Lin S, Yuan X, Lin Z, Huang ZHLA-. DQB1 and HLA-DRB1 variants confer susceptibility to latent autoimmune diabetes in adults: relative predispositional effects among allele groups. Genes. (2019) 10:710. doi: 10.3390/genes10090710
37. Anzurez A, Naka I, Miki S, Nakayama-Hosoya K, Isshiki M, Watanabe Y. Association of HLA-DRB1*09:01 with severe COVID-19. HLA. (2021) 98:37–42. doi: 10.1111/tan.14256
38. Anka A, Tahir M, Abubakar S, Alsabbagh M, Zian Z, Hamedifar H, et al. Coronavirus disease 2019 (COVID-19): an overview of the immunopathology, serological diagnosis and management. Scand. J Immunol. (2021) 93:e12998. doi: 10.1111/sji.12998
39. Pereira L, França E, Costa I, Lima I, Freire A, Ramos F, et al. Epstein–Barr virus (EBV) genotypes associated with the immunopathological profile of people living with HIV-1: immunological aspects of primary EBV infection. Viruses. (2022) 14:168. doi: 10.3390/v14020168
40. Malizia A, Egan J, Doran PP. IL-4 increases CD21-dependent infection of pulmonary alveolar epithelial type II cells by EBV. Mol Immunol. (2009) 46:1905–10. doi: 10.1016/j.molimm.2009.01.002
41. Kis L, Gerasimcik N, Salamon D, Persson E, Nagy N, Klein G, et al. STAT6 signaling pathway activated by the cytokines IL-4 and IL-13 induces expression of the Epstein-Barr virus-encoded protein LMP-1 in absence of EBNA-2: implications for the type II EBV latent gene expression in Hodgkin lymphoma. Blood. (2011) 117:165–74. doi: 10.1182/blood-2010-01-265272
42. Sutkowski N, Conrad B, Thorley-Lawson D, Huber B. Epstein-Barr virus transactivates the human endogenous retrovirus HERV-K18 that encodes a superantigen. Immunity. (2001) 5:579–89. doi: 10.1016/s1074-7613(01)00210-2
43. Margolick J, Gange S, Detels R, O’Gorman M, Rinaldo CR, Lai S. Impact of inversion of the CD4/CD8 ratio on the natural history of HIV-1 infection. Acquir Immune Defic Syndr. (2006) 42:620–6. doi: 10.1097/01.qai.0000223028.55080.9d
44. Sánchez-Ponce Y, Fuentes-Pananá E. The Role of Coinfections in the EBV-Host Broken Equilibrium. Viruses. (2021) 13:1399. doi: 10.3390/v13071399
45. Doisne J, Urrutia A, Lacabaratz-Porret C, Goujard C, Meyer L, Chaix M, et al. CD8+ T cells specific for EBV, cytomegalovirus, and influenza virus are activated during primary HIV infection. J Immunol. (2004) 173:2410–8. doi: 10.4049/jimmunol.173.4.2410
46. Figueiredo S, Charmeteau B, Surenaud M, Salmon D, Launay O, Guillet J, et al. Memory CD8(+) T cells elicited by HIV-1 lipopeptide vaccines display similar phenotypic profiles but differences in term of magnitude and multifunctionality compared with FLU- or EBV-specific memory T cells in humans. Vaccine. (2014) 32:492–501. doi: 10.1016/j.vaccine.2013.11.052
47. Petrara M, Cattelan A, Zanchetta M, Sasset L, Freguja R, Gianesin K, et al. Epstein-Barr virus load and immune activation in human immunodeficiency virus type 1-infected patients. J Clin Virol. (2012) 53:195–200. doi: 10.1016/j.jcv.2011.12.013
48. Eligio P, Delia R, Valeria GEBV. Chronic infections. Mediter J Hematol Infect Dis. (2010) 2:e2010022. doi: 10.4084/MJHID.2010.022
49. Taylor G, Long H, Brooks J, Rickinson A, Hislop A. The immunology of Epstein-Barr virus-induced disease. Annu Rev Immunol. (2015) 33:787–821. doi: 10.1146/annurev-immunol-032414-112326
50. Ressing M, Horst D, Griffin B, Tellam J, Zuo J, Khanna R, et al. Epstein-Barr virus evasion of CD8(+) and CD4(+) T cell immunity via concerted actions of multiple gene products. Semin Cancer Biol. (2008) 18:397–408. doi: 10.1016/j.semcancer.2008.10.008
51. Nagy N, Adori M, Rasul A, Heuts F, Salamon D, Ujvári D, et al. Soluble factors produced by activated CD4+ T cells modulate EBV latency. Proc Natl Acad Sci USA. (2012) 109:1512–7. doi: 10.1073/pnas.1120587109
52. Heidarnejad F, Bolhassani A, Ajdary S, Milani A, Sadeghi S. Investigation of immunostimulatory effects of IFN-γ Cytokine and CD40 ligand costimulatory molecule for development of HIV-1 therapeutic vaccine candidate. Adv Biol. (2023) 15:e2300402. doi: 10.1002/adbi.202300402
53. Shankarkumar U, Ghosh K, Badakere S, Mohanty DHLA-. DRB1*03 and DQB1*0302 associations in a subset of patients severely affected with systemic lupus erythematosus from western India. Ann Rheum Dis. (2003) 62:92–3. doi: 10.1136/ard.62.1.92
54. Liphaus B, Kiss M, Goldberg ACHLA-. DRB1 alleles in juvenile-onset systemic lupus erythematosus: renal histologic class correlations. Braz J Med Biol Res. (2007) 40:591–7. doi: 10.1590/s0100-879x2007000400019
55. Dittmar M, Ide M, Wurm M, Kahalyn G. Early onset of polyglandular failure is associated with HLA-DRB1*03. Eur J Endocrinol. (2008) 159:55–60. doi: 10.1530/EJE-08-0082
56. van Gerven N, de Boer Y, Zwiers A, Verwer B, Drenth J, van Hoek B. Dutch autoimmune hepatitis study group. HLA-DRB1*03:01 and HLA-DRB1*04:01 modify the presentation and outcome in autoimmune hepatitis type-1. Genes Immun. (2015) 16:247–52. doi: 10.1038/gene.2014.82
57. Sayeh A, Ben Cheikh C, Mardessi A, Mrad M, Nsiri B, Oumaya A, et al. DRB1*03 as a possible common etiology of schizophrenia, Graves’ disease, and type 2 diabetes. Ann Gen Psychiatry. (2017) 16:7. doi: 10.1186/s12991-017-0128-4
58. Zhang R, Duffy B, Lange V, Eby C, Liu C. Association between the HLA-DRB1*03:01-DQB1*02:01 haplotype and PF4/heparin antibodies. Blood Adv. (2019) 3:3136–42. doi: 10.1182/bloodadvances.2019000311
59. Fujiwara S, Nakamura H. Chronic active epstein-barr virus infection: is it immunodeficiency, malignancy, or both? Cancers. (2020) 12:3202. doi: 10.3390/cancers12113202
60. Boquett J, Vianna F, Fagundes N, Schroeder L, Barbian M, Zagonel-Oliveira M, et al. haplotypes and differential regional mortality caused by COVID-19 in Brazil: an ecological study based on a large bone marrow donor bank dataset. An Acad Bras Cienc. (2023) 95:e20220801. doi: 10.1590/0001-3765202320220801
61. Sepúlveda-Delgado J, Danis-Lozano R, Ocaa-Sibilla MJ, Ramirez-Valdespino JC, Cetina-Díaz JH, Bulos-Rodriguez P. Role of HLA DRB1*15 and HLA DRB1*16 alleles in the genetic susceptibility to develop systemic lupus erythematosus (SLE) after Chikungunya and Zika viruses infection in México. Asia Pac J. Blood Types Genes. (2018) 2:233–6. doi: 10.46701/APJBG.2018042018127
62. Lucht E, Biberfeld P, Linde A. Epstein-Barr virus (EBV) DNA in saliva and EBV serology of HIV-1-infected persons with and without hairy leukoplakia. J Infect. (1995) 31(3):189–94. doi: 10.1016/s0163-4453(95)80025-5
63. Montgomery N, Randall C, Painschab M, Seguin R, Kaimila B, Kasonkanji E. High pretreatment plasma Epstein-Barr virus (EBV) DNA level is a poor prognostic marker in HIV-associated, EBV-negative diffuse large B-cell lymphoma in Malawi. Cancer Med. (2020) 9(2):552–61. doi: 10.1002/cam4.2710
64. Shu Y, Qiu W, Zheng J, Sun X, Yin J, Yang X, et al. HLA class II allele DRB1*16:02 is associated with anti-NMDAR encephalitis. J Neurol Neurosurg Psychiatry. (2019) 90:652–8. doi: 10.1136/jnnp-2018-319714
65. Doherty P, Zinkernagel R. Enhanced immunological surveillance in mice heterozygous at the H-2 gene complex. Nature. (1975) 256:50–2. doi: 10.1038/256050a0
Keywords: EBV, HIV-1, coinfection, immune response, HLA class II, DRB1 locus
Citation: Pereira LMS, dos Santos França E, Costa IB, Lima IT, Jorge EVO, de Souza Mendonça Mattos PJ, Freire ABC, de Paula Ramos FL, Monteiro TAF, Macedo O, Sousa RCM, Freitas FB, Costa IB and Vallinoto ACR (2024) DRB1 locus alleles of HLA class II are associated with modulation of the immune response in different serological profiles of HIV-1/Epstein-Barr virus coinfection in the Brazilian Amazon region. Front. Med. 11:1408290. doi: 10.3389/fmed.2024.1408290
Received: 28 March 2024; Accepted: 22 May 2024;
Published: 12 June 2024.
Edited by:
Makoto Sugaya, International University of Health and Welfare, Narita, JapanReviewed by:
Arshi Munawwar, University of Maryland, United StatesCopyright © 2024 Pereira, dos Santos França, Costa, Lima, Jorge, de Souza Mendonça Mattos, Freire, de Paula Ramos, Monteiro, Macedo, Sousa, Freitas, Costa and Vallinoto. This is an open-access article distributed under the terms of the Creative Commons Attribution License (CC BY). The use, distribution or reproduction in other forums is permitted, provided the original author(s) and the copyright owner(s) are credited and that the original publication in this journal is cited, in accordance with accepted academic practice. No use, distribution or reproduction is permitted which does not comply with these terms.
*Correspondence: Igor Brasil Costa, aWdvcmNvc3RhQGllYy5nb3YuYnI=; Antonio Carlos Rosário Vallinoto, dmFsbGlub3RvQHVmcGEuYnI=
†These authors have contributed equally to this work and share last authorship
Disclaimer: All claims expressed in this article are solely those of the authors and do not necessarily represent those of their affiliated organizations, or those of the publisher, the editors and the reviewers. Any product that may be evaluated in this article or claim that may be made by its manufacturer is not guaranteed or endorsed by the publisher.
Research integrity at Frontiers
Learn more about the work of our research integrity team to safeguard the quality of each article we publish.