 Jing Li1,2†
 Qin Jiang
 Zhenhua Wang
 Biao Yan
95% of researchers rate our articles as excellent or good
Learn more about the work of our research integrity team to safeguard the quality of each article we publish.
Find out more
ORIGINAL RESEARCH article
Front. Med. , 19 June 2024
Sec. Ophthalmology
Volume 11 - 2024 | https://doi.org/10.3389/fmed.2024.1372091
This article is part of the Research Topic Efficient Artificial Intelligence (AI) in Ophthalmic Imaging View all 10 articles
Introduction: Microaneurysms serve as early signs of diabetic retinopathy, and their accurate detection is critical for effective treatment. Due to their low contrast and similarity to retinal vessels, distinguishing microaneurysms from background noise and retinal vessels in fluorescein fundus angiography (FFA) images poses a significant challenge.
Methods: We present a model for automatic detection of microaneurysms. FFA images were pre-processed using Top-hat transformation, Gray-stretching, and Gaussian filter techniques to eliminate noise. The candidate microaneurysms were coarsely segmented using an improved matched filter algorithm. Real microaneurysms were segmented by a morphological strategy. To evaluate the segmentation performance, our proposed model was compared against other models, including Otsu's method, Region Growing, Global Threshold, Matched Filter, Fuzzy c-means, and K-means, using both self-constructed and publicly available datasets. Performance metrics such as accuracy, sensitivity, specificity, positive predictive value, and intersection-over-union were calculated.
Results: The proposed model outperforms other models in terms of accuracy, sensitivity, specificity, positive predictive value, and intersection-over-union. The segmentation results obtained with our model closely align with benchmark standard. Our model demonstrates significant advantages for microaneurysm segmentation in FFA images and holds promise for clinical application in the diagnosis of diabetic retinopathy.
Conclusion: The proposed model offers a robust and accurate approach to microaneurysm detection, outperforming existing methods and demonstrating potential for clinical application in the effective treatment of diabetic retinopathy.
Diabetic retinopathy (DR) is known as a blinding eye disease in the working population. Most of the patients with type 1 diabetes mellitus and nearly 60% of the patients with type 2 diabetes mellitus will develop retinopathy following a long duration of diabetes (≥20 years). However, it is difficult to detect DR until it develops into the advanced vision-threatening stage (1). DR is often divided into two stages: non-proliferative DR (NPDR) and proliferative DR (PDR). In the NPDR stage, hyperglycemia can cause serious injuries to retinal capillaries, which can weaken the capillary walls and lead to the occurrence of microaneurysms (MAs). MAs are the small outpouchings of retinal capillaries and the early signs of NPDR, as well as the indicators for DR progression (2, 3). MAs appear as small, reddish, and circular shapes in color fundus images. They can be clinically identified by ophthalmoscopy as the deep-red dots varying from 10 to 100 μm in diameter (4, 5). Thus, automatic detection of MAs is important for DR diagnosis, which can help in controlling and retarding visual loss.
Previous studies have reported that several imaging modalities have been developed for MA detection, including color fundus images (6), optical coherence tomography angiography (OCTA) (7), and fluorescein fundus angiography (FFA) (8). Colored fundus photography has often been used due to its low cost compared with Optical coherence tomography machines. Walter et al. proposed a method for the automatic detection of MAs based on diameter closure and kernel density estimation (6). Melo et al. proposed a method for MA detection using the sliding band filter algorithm in color fundus images (9). MAs are situated on retinal capillaries and are not often visible, which makes them difficult to distinguish from the noises and pigmentation variations in color fundus images. An OCTA can provide detailed visualization of vascular perfusions. However, optical coherence tomography (OCT) machines are very expensive, and the interpretation of OCTA data is still challenging due to the complicated image artifacts and elusive algorithmic details of OCTA data (10, 11). FFA can be used for the detection of small changes in retinal vessels. The small and leaky MAs are easily ignored without the aid of FFA. FFA is highly effective in detecting MAs, especially when MAs are close to the vessels or too small to distinguish (12, 13). However, objective segmentation of MAs in FFA images is still challenging because MA segmentation requires laborious manual segmentation by experienced graders. Therefore, it is necessary to develop a model for automatic detection of MAs in FFA images for DR diagnosis.
Computer-assisted MA detection is important for DR diagnosis. Baudoin et al. used a mathematical morphology method to remove vessels and applied a top-hat transformation with the linear structuring elements to detect MAs (14). Spencer et al. proposed an image correction procedure for MA segmentation by calculating the true- and false-positive rates (15). Mendonca et al. further improved this method by altering the pre-filtering and classification procedures. However, shade corrections may produce false positives caused by the darkening of regions close to the bright patterns (16). Walter applied mathematical morphology to segment the vascular trees of retinal angiograms. This algorithm can extract patterns if vein width is constant, but it cannot extract them from narrower/wider veins (17). Zhang et al. proposed a model based on the dynamic thresholding and correlation coefficients of a multi-scale Gaussian template (18). Antal and Hajdu proposed an ensemble-based method for MA detection by selecting an optimal combination of pre-processing methods and candidate extractors (19). Saleh et al. developed a DR detection system based on the Gaussian filter, a multi-layered dark object filtering method, and a singular spectrum analysis (20). Despite their clinical significance, MAs pose challenges for accurate detection due to their low-contrast and close resemblance to blood vessels. Thus, further study is necessary to refine MA detection algorithms and enhance accuracy, particularly in FFA images. In this study, we present a novel model for the automatic detection of MA lesions in FFA images. Our proposed model comprises pre-processing of FFA images, followed by coarse segmentation of candidate MA regions and fine segmentation of MA regions. Subsequently, comparative studies were conducted to assess the MA detection performance of the proposed model.
The flowchart of the proposed MA detection model is shown in Figure 1, including pre-processing of FFA images, coarse segmentation of candidate MA regions by the matched filter (MF) algorithm, and fine segmentation of MA regions by the morphological strategy.
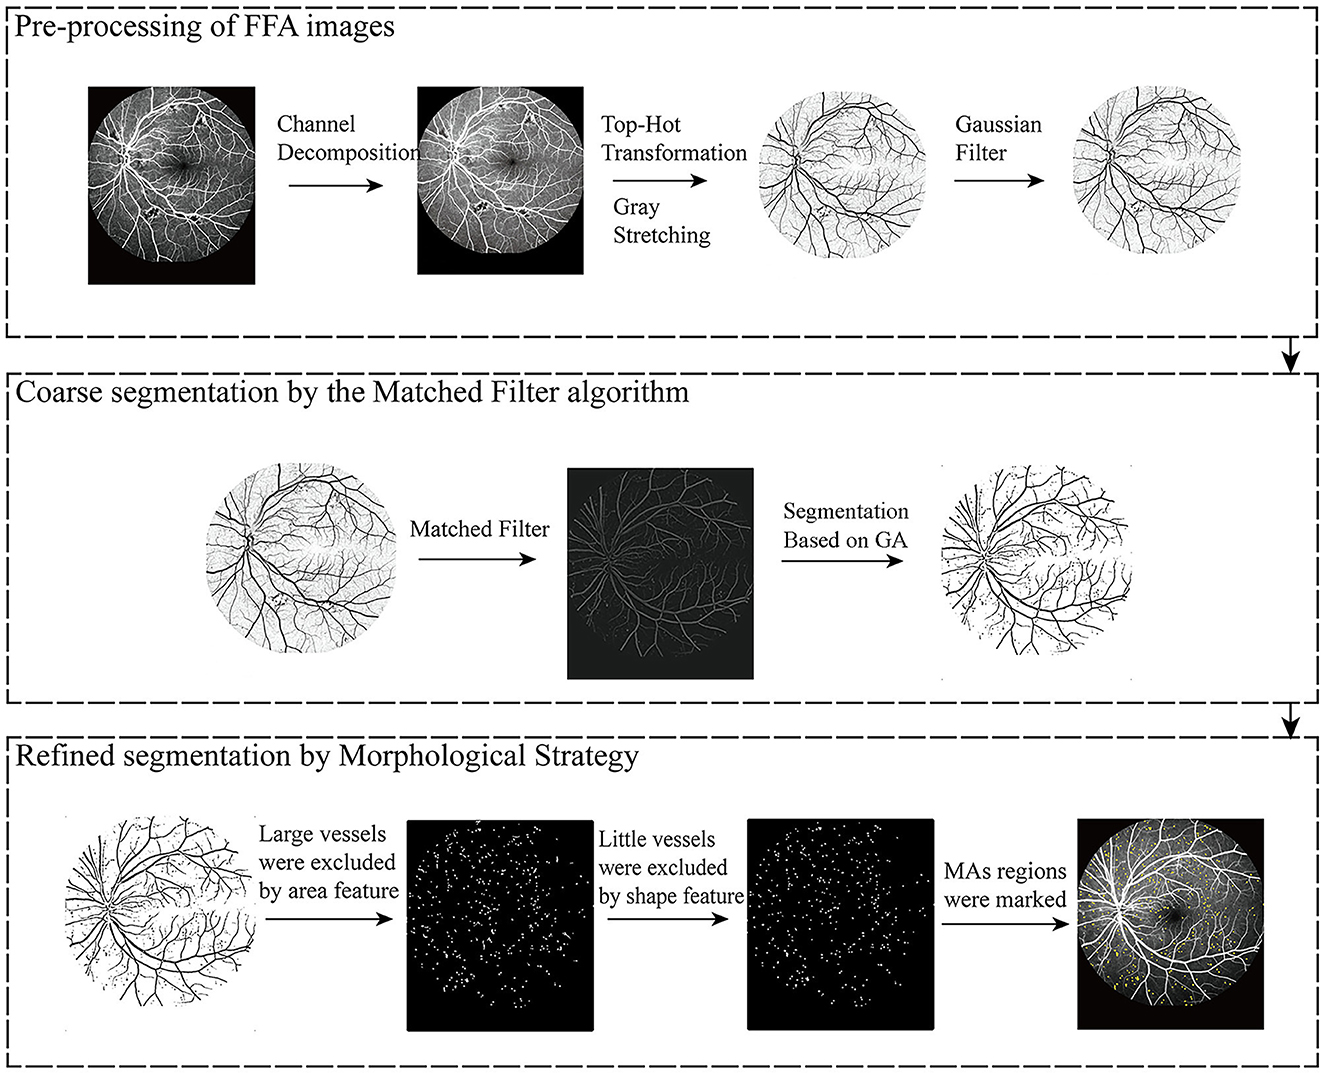
Figure 1. Flow chart of the proposed model for microaneurysm (MA) segmentation.
High-noise and low-contrast can pose great difficulties for the identification of MAs in FFA images. In the pre-processing step, the FFA images underwent decomposition into individual channels to alleviate computational demands, given that the pixel values across each channel were identical. Subsequently, each single channel underwent processing, employing top-hat transformation and gray-stretching (21) to enhance the contrasts between MAs and the background. Following this processing, the processed result underwent further refinement via a Gaussian filter to reduce noise.
The top-hat transformation was defined according to Equation (1) (22):
where I(x, y) refers to the grayscale image, B(u, v) refers to the structural element constructed as a circle with a radius of 45 pixels, and ° refers to the open operation. Opening of I(x, y) by B(u, v) was defined according to Equation (2):
where Θ and ⊕ refer to the erosion and dilation operations, respectively. The erosion and dilation of I(x, y) by B(u, v) were defined according to Equations (3) and (4):
Gray-stretching was defined according to Equation (5) (23):
where Imax and Imin refer to the largest and smallest gray values in the original images, respectively. Gmax and Gmin refer to the largest and smallest gray values in the transformed images.
The Gaussian filter was defined according to Equation (6) (24):
where σ2 refers to the variance of the Gaussian filter.
In the pre-processing step, top-hat transformation, gray-stretching, and a Gaussian filter were employed for MA extraction by strengthening, enhancing, and denoising. A top-hat transformation was used to highlight the object edges and remove distracting information such as background noises. Gray-stretching mapped the grayscale ranges of FFA images. The Gaussian filter smoothed FFA images and removed irregular details such as noise points and burrs in the FFA images.
The candidate MA regions in the FFA images were detected using the MF algorithm. MF was initially proposed by Chaudhuri et al. (25) for blood vessel extraction. Analogous to the matching filter concept in signal processing, a blood vessel image can be interpreted as a signal. Blood vessels exhibit characteristics such as a narrow range of width variation and parallel inner walls. Based on the prior knowledge, MF can construct a template to match the cross-sectional structure of blood vessels. Consequently, when the blood vessel component is input, a higher value is yielded, whereas a lower value is produced for the background, facilitating the separation of blood vessels. Hence, MF effectively enhances blood vessels and suppresses background noises.
MF was defined according to Equation (7) (26):
where s refers to the filter scale, m is used for normalizing the mean value of the filter to 0, which is defined as Equation (8), L refers to the neighborhood length along the y-axis and is used to smooth the noises. L was deduced by s. When s was small, L was set relatively small, and vice versa. The criterion t is a constant and was set to 3 (27).
The performance of the MF algorithm is heavily reliant on the design of the template. Poorly designed templates or significant deviations from the actual blood vessel structure can result in inaccurate extraction or an abundance of noise. Genetic algorithms (GA), an optimization technique introduced by John Holland, offer a solution to this challenge. GA mimics natural selection and genetic mechanisms to search for optimal solutions within the solution space. By using GA, one can efficiently explore and identify template configurations that yield improved accuracy and robustness in vessel extraction.
Hence, GA can be utilized to automatically adjust the threshold value of MF to accommodate the morphological features of blood vessels in various images. The GA process comprises five key steps: population initialization, fitness assessment, selection, crossover, and mutation. In the population initialization step, chromosome length was set to 8 and population size was set to 10. In the fitness assessment step, the efficacy of a solution was determined using a fitness function, where solutions with higher fitness were deemed superior. In our study, the fitness function of the GA is defined as in Equation (9) (28). In the selection step, the elitism strategy was adopted. In the crossover step, the crossover probability was set to 0.7. In the mutation step, the mutation probability was set to 0.4. In the later stages of the genetic algorithm's evolution, adjustments were made to both the crossover and mutation probabilities, setting them to 0.3 each.
Through iterative optimization via GA, the MF template that most accurately aligns with blood vessels can be gradually identified, enabling the identification of all candidate MAs.
where p1 and p2 refer to the number of the target pixels and background pixels, respectively, μ1 and μ2 refer to the average gray values of the target pixels and background pixels, respectively. f is the fitness value.
Real MA regions were determined by the morphological strategy, including removing vessels, hemorrhages, and exudates from the candidate MA regions based on area features and shape features, respectively. Previous studies have developed multiple image processing and machine learning algorithms for the automatic detection of MAs and recognized that the area size of MAs was typically between 5 and 100 pixels. In addition, real MAs were often localized next to the capillaries, appearing as dotted or rounded structures (29–31). The vessels, hemorrhages, and exudates were removed from the candidate MA regions according to Equation (10). Hemorrhages and exudates caused by the injured vessels were removed from the candidate MA regions according to Equation (11) and the threshold for roundness was set to 0.51.
where S refers to the pixels of the candidate MA regions and C refers to the circumference of the contour.
The FFA dataset comprises 1,010 FFA images, each with dimensions of 768 × 868 pixels, obtained from 65 eyes of 60 DR patients aged between 31 and 81 years. These patients underwent FFA examinations at the Eye Hospital affiliated with Nanjing Medical University between 2015 and 2019. The FFA images were captured using Heidelberg Retina Angiography (Heidelberg Engineering, Germany) by experienced clinicians. Notably, the FFA dataset did not include blurry or overexposed images. For labeling MAs in FFA images, three retinal clinicians with over 10 years of experience independently annotated MAs, serving as the benchmark standard. Patients with FFAs indicating mild or moderate DR were eligible for inclusion. The following exclusion criteria were used: (1) presence of other ocular diseases unrelated to diabetes, such as retinal arteriovenous obstruction, age-related macular degeneration, glaucoma, and uveitis; (2) any condition causing poor image quality or inability to visualize the optic disc and vessels, such as dense cataracts or corneal opacity; and (3) history of previous ophthalmological interventions, such as laser photocoagulation, vitrectomy, or anti-vascular endothelial growth factor injection. To ensure the reliability and validity of segmentation results, FFA images were independently divided into three sets: 830 images for training, 90 images for testing, and 90 images for validation. Figure 2 shows the original FFA images and MA detection results by the proposed model and benchmark standard.
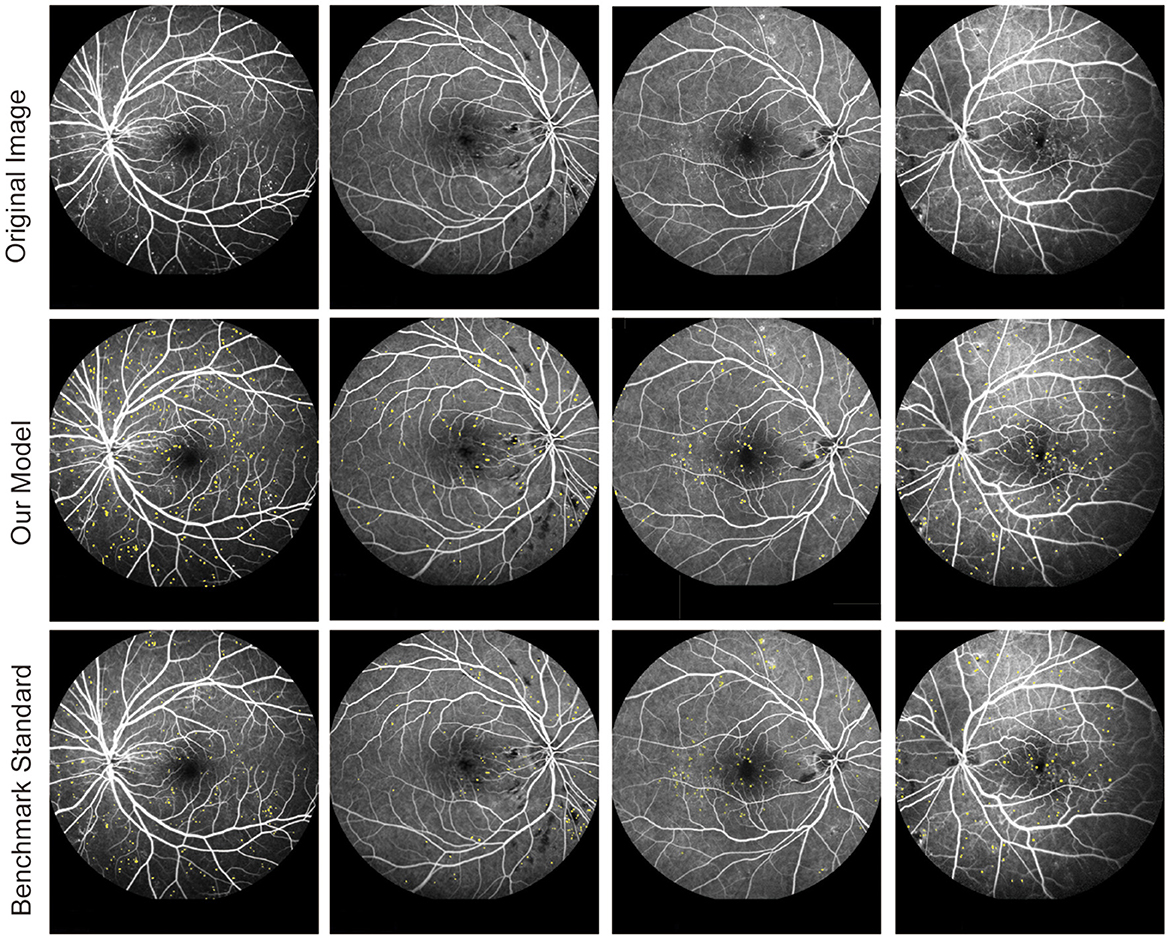
Figure 2. Original fluorescein fundus angiography (FFA) images and segmentation results of MAs by the proposed model and retinal clinicians.
Another publicly available dataset was utilized to assess the performance of MA detection. This dataset consisted of FFA images obtained from diabetic patients. The images were captured as part of a study conducted at the Persian Eye Clinic (Feiz Hospital), affiliated with the Isfahan University of Medical Sciences. The dataset comprised retinal images from 70 patients, with 30 samples categorized as normal and 40 samples representing various stages of DR.
Five different metrics, including accuracy (Acc) (30), sensitivity (Se) (30), specificity (Sp) (30), positive predictive value (PPV) (31), and intersection-over-union (IOU) (32), were employed to evaluate the detection performance of MAs according to Equations (12–16):
where TP denotes the region that was predicted as MAs and was real MAs; FP denotes the region that was predicted as MAs but was background; TN denotes the region that was predicted as background and was real background; and FN denotes the region that was predicted as background but was MAs. Accuracy (Acc) is defined as the measure providing the ratio of total well-segmented pixels based on the gold standard for hand-labeled detection. Sensitivity (Se) and specificity (Sp) measures the ability of the model to detect well-segmented MAs and background pixels, respectively. PPV represents the correct proportion of the sample with a positive prediction. The IOU reflects the degree of coincidence between the MA detection result of the proposed model and the benchmark standard.
All experiments were conducted on a PC with an Intel Core processor running at 2.50 GHz and equipped with 8 GB of RAM, using the MATLAB 2013a software.
Our proposed model encompassed the pre-processing of FFA images, followed by coarse segmentation of candidate MA regions and fine segmentation of MA regions. To assess the MA detection performance of our proposed model, two distinct experiments were conducted. In Experiment 1, our proposed model was juxtaposed against the MF model optimized by the GA algorithm (referred to as MAs-MF). In Experiment 2, our proposed model was compared against previous MA detection models. To maintain the integrity of our experiments, the outcomes presented for the clinician in Table 1 were segmented by a skilled clinician who did not participate in the dataset labeling process.
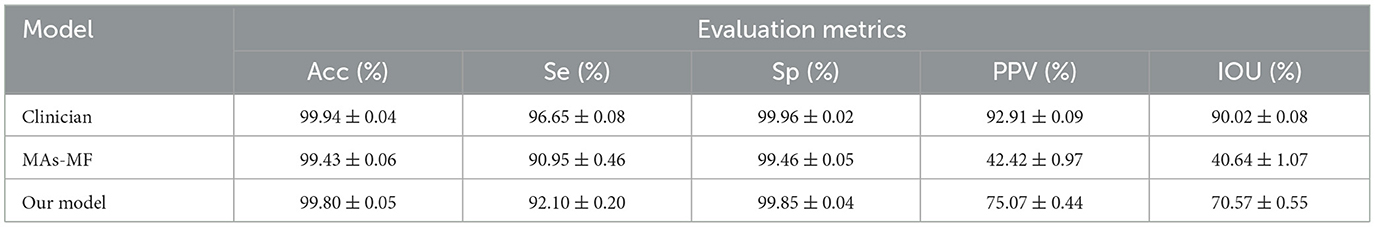
Table 1. Performance comparison between our proposed model and the microaneurysms-matched filter (MAs-MF) model.
We compared our proposed model against the MAs-MF model to evaluate MA detection performance. The results of MA detection are shown in Figure 3. The metrics of MA detection are shown in Table 1.

Figure 3. Detection results of MAs by microaneurysms-matched filter (MAs-MF).
From Figure 3 and Table 1, we can observe that there were several label errors of small blood vessels for MA detection results in the MAs-MF model, as shown in the red squares in Figure 3. Compared with the MAs-MF model, the MA detection performance of the proposed model was close to the MA detection results of the clinicians. Compared with the MAs-MF model, the proposed model had greater values of accuracy (Acc), sensitivity (Se), specificity (Sp), PPV, and IOU, which were 99.80 (0.37↑), 92.10 (1.15↑), 99.85 (0.39↑), 75.07 (32.65↑), and 75.57 (29.93↑), respectively.
We further compared our proposed model against other MA detection models, such as Otsu's method (33), Region Growing (34), MF (25), Global Threshold (35), K-means, (36) and Fuzzy c-means, (37) to evaluate MA detection performance. The results of MA detection are shown in Figure 4, and the metrics of MA evaluation are shown in Table 2.
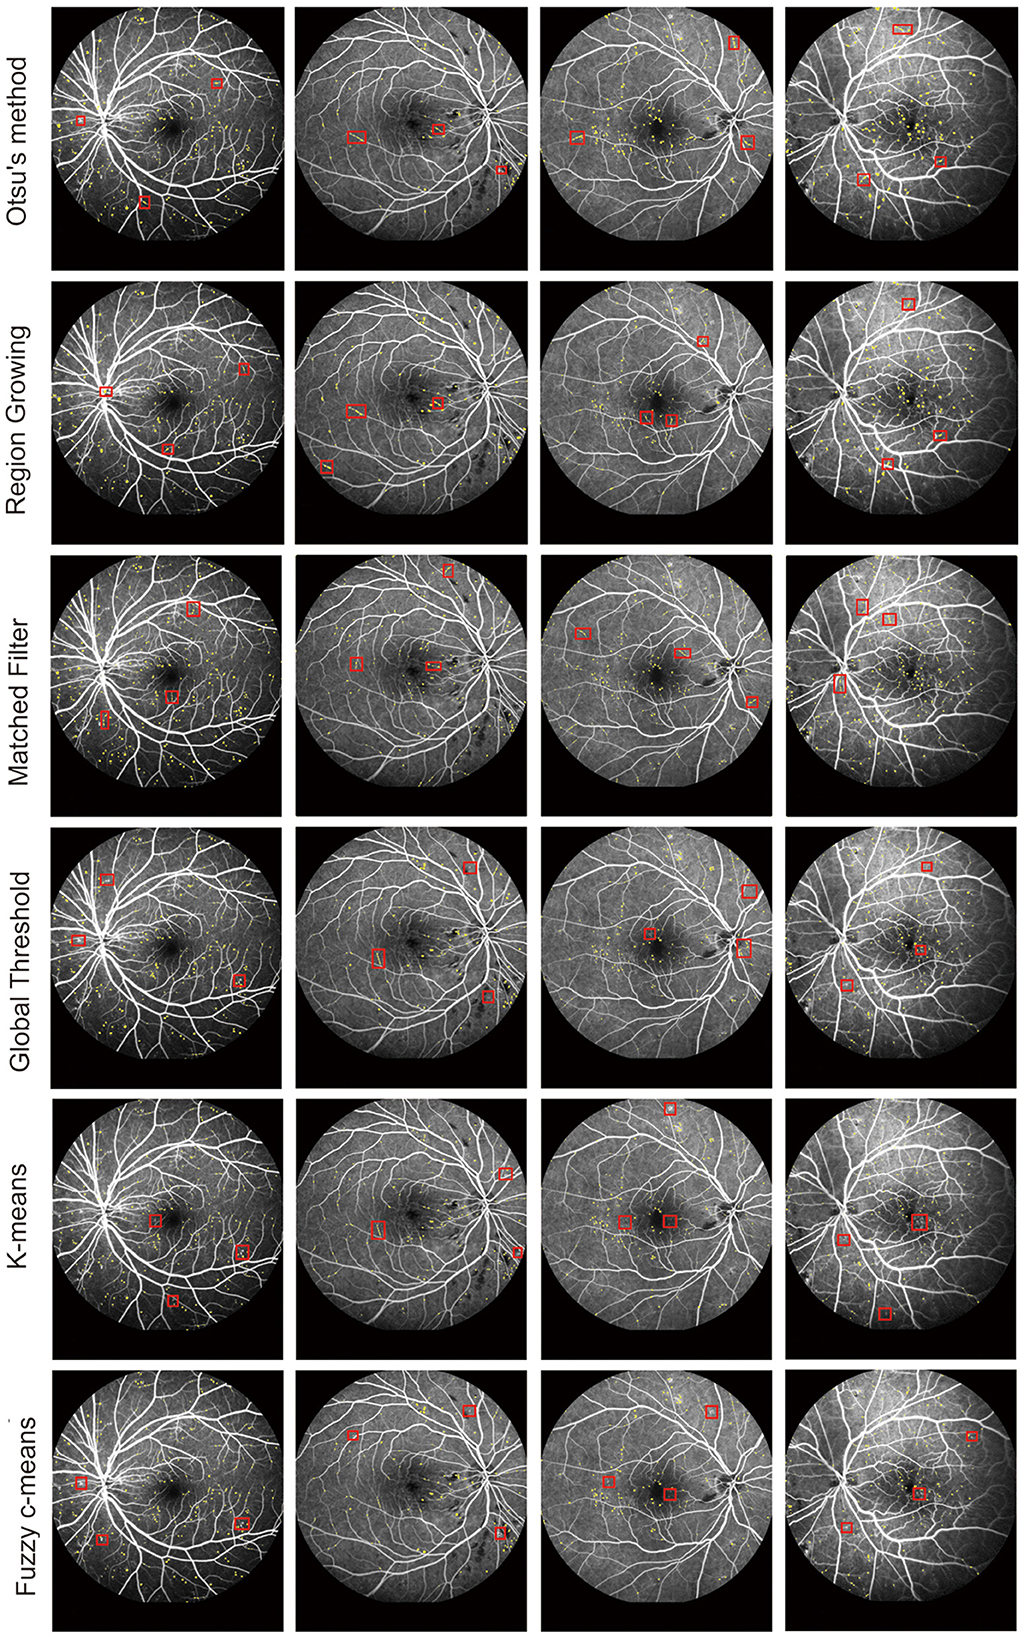
Figure 4. MA segmentation results from different models.
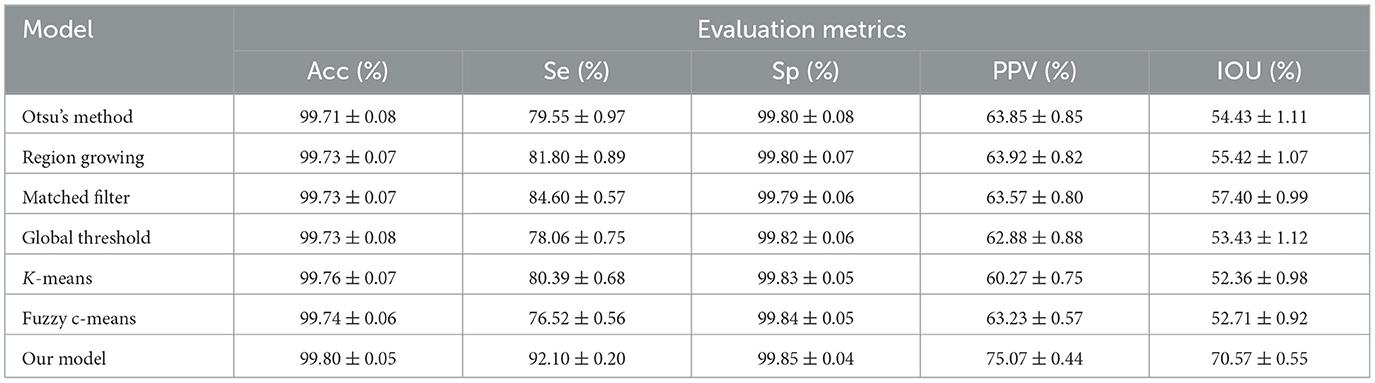
Table 2. Comparison of microaneurysm (MA) segmentation performance between our proposed model and other previously reported models.
As shown in Figure 3 and Table 2, Otsu's method, Region Growing, MF, Global Threshold, K-means, and Fuzzy c-means models could not accurately detect the boundaries of MA regions and normal regions. Additionally, there were some omissions and false detections, which are marked by red squares in Figure 4. The proposed model had greater values of PPV and IOU than other models. Furthermore, our proposed model demonstrated performance in MA detection that closely aligned with the benchmark standard, surpassing the performance of other MA detection models.
To further evaluate MA detection performance, we used a publicly available dataset, which was obtained during a study conducted at the Persian Eye Clinic (Feiz Hospital) in Isfahan University of Medical Sciences (32), including retinal images from 70 patients, with 30 samples classified as normal and 40 samples representing different stages of DR. As shown in Table 3, MA detection using our proposed model had an average accuracy of 99.42%, a sensitivity of 90.21%, a specificity of 98.86%, a PPV of 71.93%, and an IOU of 64.89%, showing an obvious advantage over other MA detection models.
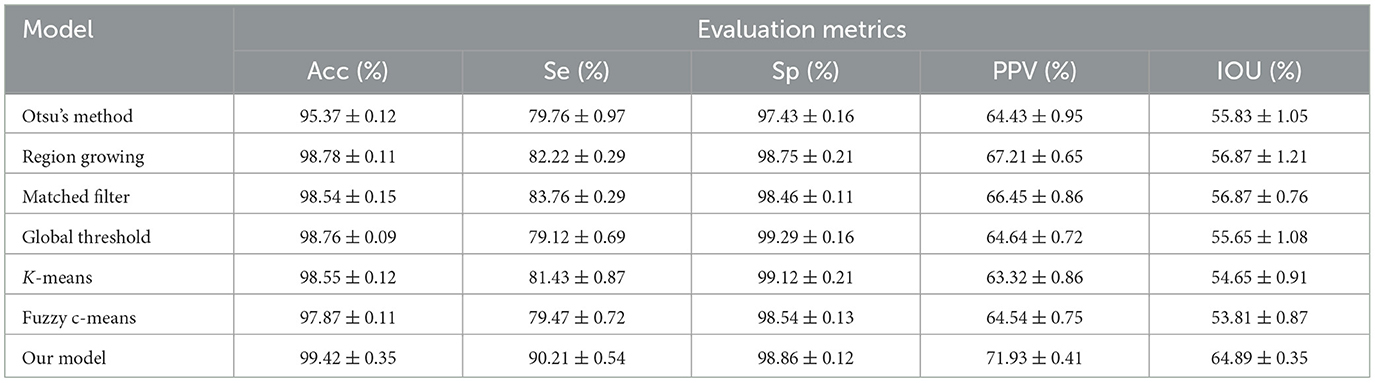
Table 3. Comparison of MA detection performance between our proposed model and previous detection models using the publicly available dataset.
MA detection is highly important for the diagnosis of DR (5). FFA is a technique used for the evaluation of retinal and choroidal circulation. MAs are immediately visible following the arterial phase of FFA (33). In this study, we propose a three-step model for MA detection in FFA images. Initially, FFA image pre-processing is conducted to enhance the contrasts of FFA images. Subsequently, candidate MA regions are coarsely segmented using an improved MF algorithm. Finally, real MA regions are identified through a morphological strategy. This proposed model aims to enhance the accuracy and efficiency of MA detection in FFA images, thus aiding in the early diagnosis and management of DR.
Automatic segmentation of MAs is still a tricky problem due to their tiny sizes, low contrasts, and high similarities to retinal vessels. The high-noise and low-contrast of FFA images can also affect the quality of FFA images and reduce the accuracy of MA detection (33). The goal of image enhancement is to decrease image noise and enhance the contrasts of the targets and backgrounds. In this study, top-hat transformation, gray-stretching, and a Gaussian filter were used for the improvement of FFA image quality. Top-hat transformation and gray-stretching can efficiently solve the problem of uneven illumination, while a Gaussian filter can efficiently reduce the potential impacts of retinal noises on FFA images.
We also evaluated the MA detection performance of the proposed model by comparing it with other MA detection methods. Compared with Otsu's method, Region Growing, MF, K-means, Global Threshold, and Fuzzy c-means (3, 25, 34–37), the proposed model has the greatest accuracy and efficiency for MA detection in FFA images. The evaluation metrics of the proposed model, including accuracy, sensitivity, specificity, PPV, and IOU, have the highest value. Moreover, the proposed model has a similar MA detection performance as the clinicians.
Recently, deep learning-based algorithms have gained popularity for medical image analysis. However, these algorithms typically demand high-performance computing resources, such as central processing units (CPUs) and graphics processing units (GPUs), as well as a substantial amount of labeled data for training. Unfortunately, many hospitals lack access to such resources and specialized personnel (38). Given this context, there is a pressing need for simpler methods for analyzing FFA images. In contrast to deep learning-based approaches, the proposed model does not necessitate a large number of labeled images or high-performance computing resources. Moreover, it offers comparable accuracy to manual labeling by clinicians but with faster detection speed. This feature makes it a practical and efficient solution for MA detection in clinical settings where resources and expertise may be limited.
This study provides a new model for the detection of MAs in FFA images, which consists of three steps. First, the quality of FFA images was improved by the image enhancement methods, including top-hat transformation, gray-stretching, and the Gaussian filter. Then, the candidate MAs were coarsely segmented by the MF algorithm. Finally, real MA regions were determined by the morphological strategy. Compared with manual MA labeling or other existing MA detection algorithms, the proposed model shows promising performance for the early diagnosis of DR by detecting MA lesions. This model is expected to assist ophthalmologists in efficiently detecting MA lesions, thereby enhancing the overall efficiency of DR diagnosis.
The number of MAs tends to increase as the severity of DR worsens. While the proposed model effectively detects the presence of MA lesions in FFA images, there are limitations to its clinical application. Indeed, MA formation is associated with various pathological changes such as basement membrane thickening, pericyte degeneration, and endothelial injury, which can lead to retinal vessel leakage, edema, and even hemorrhage. Given that vessel leakage, edema, and hemorrhage are closely linked to the size and volume of MAs, accurately detecting these parameters can provide additional valuable information for DR screening and monitoring. To achieve broader clinical applicability, the proposed model should be integrated with algorithms for detecting the size and volume of MAs, as well as for identifying edema and hemorrhages. This enhanced model would significantly improve the accuracy of assessing DR severity and estimating DR risk. Due to the high variability in pathological features and the quality of FFA images, deep learning techniques could play a crucial role in detecting and quantifying these features more accurately and efficiently. Therefore, in the future, we plan to incorporate deep learning approaches to further enhance the efficiency of MA detection in FFA images and improve the overall diagnostic capabilities for DR.
The original contributions presented in the study are included in the article/supplementary material, further inquiries can be directed to the corresponding authors.
Ethical review and approval was not required for the study on human participants in accordance with the local legislation and institutional requirements. Written informed consent from the (patients/participants OR patients/participants legal guardian/next of kin) was not required to participate in this study in accordance with the national legislation and the institutional requirements.
QJ: Data curation, Writing – original draft, Writing – review & editing. JL: Conceptualization, Data curation, Writing – original draft. QM: Data curation, Formal analysis, Writing – original draft. MY: Conceptualization, Formal analysis, Writing – original draft. ZW: Conceptualization, Software, Writing – original draft. BY: Conceptualization, Writing – review & editing.
The author(s) declare financial support was received for the research, authorship, and/or publication of this article. This research was supported by the grants from the National Natural Science Foundation of China (Grant No. 82171074).
The authors declare that the research was conducted in the absence of any commercial or financial relationships that could be construed as a potential conflict of interest.
The reviewer SY declared a shared parent affiliation with the author QJ to the handling editor at the time of review.
All claims expressed in this article are solely those of the authors and do not necessarily represent those of their affiliated organizations, or those of the publisher, the editors and the reviewers. Any product that may be evaluated in this article, or claim that may be made by its manufacturer, is not guaranteed or endorsed by the publisher.
1. Jin K, Pan X, You K, Wu J, Liu Z, Cao J, et al. Automatic detection of non-perfusion areas in diabetic macular edema from fundus fluorescein angiography for decision making using deep learning. Sci Rep. (2020) 10:1–7. doi: 10.1038/s41598-020-71622-6
2. Saleh MD, Eswaran C. An automated decision-support system for non-proliferative diabetic retinopathy disease based on MAs and HAs detection. Comput Methods Progr Biomed. (2012) 108:186–96. doi: 10.1016/j.cmpb.2012.03.004
3. Chudzik P, Majumdar S, Calivá F, Al-Diri B, Hunter A. Microaneurysm detection using fully convolutional neural networks. Comput. Methods Progr. Biomed. (2018) 158:185–92. doi: 10.1016/j.cmpb.2018.02.016
4. Sehirli E, Turan MK, Dietzel A. Automatic detection of microaneurysms in rgb retinal fundus images. Int J Sci Technol Res. (2015) 1:1–7.
5. Ganjee R, Azmi R, Ebrahimi Moghadam M. A novel microaneurysms detection method based on local applying of Markov random field. J Med Syst. (2016) 40:1–9. doi: 10.1007/s10916-016-0434-4
6. Walter T, Massin P, Erginay A, Ordonez R, Jeulin C, Klein JC. Automatic detection of microaneurysms in color fundus images. Med Image Anal. (2007) 11:555–66. doi: 10.1016/j.media.2007.05.001
7. Schreur V, Domanian A, Liefers B, Venhuizen FG, Klevering BJ, Hoyng CB, et al. Morphological and topographical appearance of microaneurysms on optical coherence tomography angiography. Br J Ophthalmol. (2019) 103:630–5. doi: 10.1136/bjophthalmol-2018-312258
8. Tavakoli M, Shahri RP, Pourreza H, Mehdizadeh A, Banaee T, Toosi MHB. A complementary method for automated detection of microaneurysms in fluorescein angiography fundus images to assess diabetic retinopathy. Pattern Recognit. (2013) 46:2740–53. doi: 10.1016/j.patcog.2013.03.011
9. Melo T, Mendonça AM, Campilho A. Microaneurysm detection in color eye fundus images for diabetic retinopathy screening. Comput Biol Med. (2020) 126:103995. doi: 10.1016/j.compbiomed.2020.103995
10. Xu J, Song S, Li Y, Wang RK. Complex-based OCT angiography algorithm recovers microvascular information better than amplitude-or phase-based algorithms in phase-stable systems. Phys Med Biol. (2017) 63:015023. doi: 10.1088/1361-6560/aa94bc
11. De Carlo TE, Romano A, Waheed NK, Duker JS. A review of optical coherence tomography angiography (OCTA). Int J Retina Vitreous. (2015) 1:1–15. doi: 10.1186/s40942-015-0005-8
12. Cheung CMG, Yanagi Y, Mohla A, Lee SY, Mathur R, Chan CM, et al. Characterization and differentiation of polypoidal choroidal vasculopathy using swept source optical coherence tomography angiography. Retina. (2017) 37:1464–74. doi: 10.1097/IAE.0000000000001391
13. Kwan CC, Fawzi AA. Imaging and biomarkers in diabetic macular edema and diabetic retinopathy. Curr Diabetes Rep. (2019) 19:1–10. doi: 10.1007/s11892-019-1226-2
14. Baudoin CE, Lay BJ, Klein JC. Klein, Automatic detection of microaneurysms in diabetic fluorescein angiography. Rev Epidemiol Sante Publique. (1984) 32:254–61.
15. Spencer T, Olson JA, McHardy KC, Sharp PF, Forrester JV. An image-processing strategy for the segmentation and quantification of microaneurysms in fluorescein angiograms of the ocular fundus. Comput Biomed Res. (1996) 29:284–302. doi: 10.1006/cbmr.1996.0021
16. Mendonca AM, Campilho A, Nunes J. Automatic segmentation of microaneurysms in retinal angiograms of diabetic patients. In: Proceedings 10th International Conference on Image Analysis and Processing. Venice: IEEE (1999). p. 728–33.
17. Walter T. Automatic segmentation and registration of retinal fluorescein angiographies-application to diabetic retinopathy. In: First International Workshop on Computer Assisted Fundus Image Analysis. Copenhagen (2000). p. 15–20.
18. Zhang B, Wu X, You J, Li Q, Karray F. Detection of microaneurysms using multi-scale correlation coefficients. Pattern Recognit. (2010) 43:2237–48. doi: 10.1016/j.patcog.2009.12.017
19. Antal B, Hajdu A. An ensemble-based system for microaneurysm detection and diabetic retinopathy grading. IEEE Trans Biomed Eng. (2012) 59:1720–6. doi: 10.1109/TBME.2012.2193126
20. Saleh GM, Wawrzynski J, Caputo S, Peto T, Al Turk LI, Wang S, et al. An automated detection system for microaneurysms that is effective across different racial groups. J Ophthalmol. (2016) 2016:4176547. doi: 10.1155/2016/4176547
21. Li K, Qi X, Luo Y, Yao Z, Zhou X, Sun M. Accurate retinal vessel segmentation in color fundus images via fully attention-based networks. IEEE J Biomed Health Inform. (2020) 25:2071–81. doi: 10.1109/JBHI.2020.3028180
22. Román JCM, Escobar R, Martínez F, Noguera JLV, Legal-Ayala H, Pinto-Roa DP. Medical image enhancement with brightness and detail preserving using multiscale top-hat transform by reconstruction. Electron Notes Theor Comput. (2020) 349:69–80. doi: 10.1016/j.entcs.2020.02.013
23. Liu L, Yang N, Lan J, Li J. Image segmentation based on gray stretch and threshold algorithm. Optik. (2015) 126:626–9. doi: 10.1016/j.ijleo.2015.01.033
24. Nasor M, Obaid W. Segmentation of osteosarcoma in MRI images by K-means clustering, Chan-Vese segmentation, and iterative Gaussian filtering. IET Image Proc. (2021) 15:1310–8. doi: 10.1049/ipr2.12106
25. Chaudhuri S, Chatterjee S, Katz N, Nelson M, Goldbaum M. Detection of blood vessels in retinal images using two-dimensional matched filters. IEEE Trans Med Imag. (1989) 8:263–9. doi: 10.1109/42.34715
26. Saroj SK, Kumar R, Singh NP. Frechet PDF based matched filter approach for retinal blood vessels segmentation. Comput Methods Progr Biomed. (2020) 194:105490. doi: 10.1016/j.cmpb.2020.105490
27. Zhang B, Zhang L, Zhang L, Karray F. Retinal vessel extraction by matched filter with first-order derivative of Gaussian. Comput Biol Med. (2010) 40:438–45. doi: 10.1016/j.compbiomed.2010.02.008
28. Wang H, Zhang L, Yao L. Application of genetic algorithm based support vector machine in selection of new EEG rhythms for drowsiness detection. Expert Syst Appl. (2021) 171:114634. doi: 10.1016/j.eswa.2021.114634
29. Li X, Xie J, Zhang L, Cui Y, Zhang G, Wang J, et al. Differential distribution of manifest lesions in diabetic retinopathy by fundus fluorescein angiography and fundus photography. BMC Ophthalmol. (2020) 20:1–8. doi: 10.1186/s12886-020-01740-2
30. Wu B, Zhu W, Shi F, Zhu S, Chen X. Automatic detection of microaneurysms in retinal fundus images. Comput Med Imag Graph. (2017) 55:106–12. doi: 10.1016/j.compmedimag.2016.08.001
31. Dashtbozorg B, Zhang J, Huang F, ter Haar Romeny BM. Retinal microaneurysms detection using local convergence index features. IEEE Trans Image Process. (2018) 27:3300–15. doi: 10.1109/TIP.2018.2815345
32. Hajeb Mohammad Alipour S, Rabbani H, Akhlaghi M. A new combined method based on curvelet transform and morphological operators for automatic detection of foveal avascular zone. SIViP. (2014) 8:205–22. doi: 10.1007/s11760-013-0530-6
34. Sinthanayothin C, Boyce JF, Williamson TH, Cook HL, Mensah E, Lal S, et al. Automated detection of diabetic retinopathy on digital fundus images. Diabetic Med. (2002) 19:105–12. doi: 10.1046/j.1464-5491.2002.00613.x
35. Jang JW, Lee S, Hwang HJ, Baek KR. Global thresholding algorithm based on boundary selection. In: Proceedings 13th International Conference on Control, Automation and Systems. Gwangju: IEEE (2013). p. 704–6.
36. Zheng X, Lei Q, Yao R, Gong Y, Yin Q. Image segmentation based on adaptive K-means algorithm. EURASIP J Imag Video Process. (2018) 2018:1–10. doi: 10.1186/s13640-018-0309-3
37. Ghosh S, Dubey SK. Comparative analysis of k-means and fuzzy c-means algorithms. Int J Adv Comput Sci Appl. (2013) 4:35–39. doi: 10.14569/IJACSA.2013.040406
Keywords: diabetic retinopathy, segmentation model, microaneurysms, fluorescein fundus angiography, computer-aided diagnosis
Citation: Li J, Ma Q, Yao M, Jiang Q, Wang Z and Yan B (2024) Segmentation of retinal microaneurysms in fluorescein fundus angiography images by a novel three-step model. Front. Med. 11:1372091. doi: 10.3389/fmed.2024.1372091
Received: 17 January 2024; Accepted: 21 May 2024;
Published: 19 June 2024.
Edited by:
Haoyu Chen, The Chinese University of Hong Kong, ChinaCopyright © 2024 Li, Ma, Yao, Jiang, Wang and Yan. This is an open-access article distributed under the terms of the Creative Commons Attribution License (CC BY). The use, distribution or reproduction in other forums is permitted, provided the original author(s) and the copyright owner(s) are credited and that the original publication in this journal is cited, in accordance with accepted academic practice. No use, distribution or reproduction is permitted which does not comply with these terms.
*Correspondence: Biao Yan, Ymlhby55YW5AZmRlZW50Lm9yZw==; Zhenhua Wang, emgtd2FuZ0BzaG91LmVkdS5jbg==; Qin Jiang, amlhbmdxaW43MTBAMTI2LmNvbQ==
†These authors have contributed equally to this work
Disclaimer: All claims expressed in this article are solely those of the authors and do not necessarily represent those of their affiliated organizations, or those of the publisher, the editors and the reviewers. Any product that may be evaluated in this article or claim that may be made by its manufacturer is not guaranteed or endorsed by the publisher.
Research integrity at Frontiers
Learn more about the work of our research integrity team to safeguard the quality of each article we publish.