 Ji Wu
Ji Wu Yao Lu2†
 Xiping Shen
- 1Department of General Surgery, Suzhou Ninth Hospital Affiliated to Soochow University, Suzhou, China
- 2Department of Anesthesia, Fifth People's Hospital of Wujiang District, Suzhou, China
- 3Department of General Medicine, Municipal Hospital, Suzhou, China
Purpose: Quantitative computed tomography (CT) analysis is an important method for diagnosis and severity evaluation of lung diseases. However, the association between CT-derived biomarkers and chronic obstructive pulmonary disease (COPD) exacerbations remains unclear. We aimed to investigate its potential in predicting COPD exacerbations.
Methods: Patients with COPD were consecutively enrolled, and their data were analyzed in this retrospective study. Body composition and thoracic abnormalities were analyzed from chest CT scans. Logistic regression analysis was performed to identify independent risk factors of exacerbation. Based on 2-year follow-up data, the deep learning system (DLS) was developed to predict future exacerbations. Receiver operating characteristic (ROC) curve analysis was conducted to assess the diagnostic performance. Finally, the survival analysis was performed to further evaluate the potential of the DLS in risk stratification.
Results: A total of 1,150 eligible patients were included and followed up for 2 years. Multivariate analysis revealed that CT-derived high affected lung volume/total lung capacity (ALV/TLC) ratio, high visceral adipose tissue area (VAT), and low pectoralis muscle cross-sectional area (CSA) were independent risk factors causing COPD exacerbations. The DLS outperformed exacerbation history and the BMI, airflow obstruction, dyspnea, and exercise capacity (BODE) index, with an area under the ROC (AUC) value of 0.88 (95%CI, 0.82–0.92) in the internal cohort and 0.86 (95%CI, 0.81–0.89) in the external cohort. The DeLong test revealed significance between this system and conventional scores in the test cohorts (p < 0.05). In the survival analysis, patients with higher risk were susceptible to exacerbation events.
Conclusion: The DLS could allow accurate prediction of COPD exacerbations. The newly identified CT biomarkers (ALV/TLC ratio, VAT, and pectoralis muscle CSA) could potentially enable investigation into underlying mechanisms responsible for exacerbations.
Introduction
Chronic obstructive pulmonary disease (COPD) is a global health problem. Acute exacerbations were defined as acute worsening of respiratory symptoms associated with lung function decline and long-term outcomes (1, 2). COPD exacerbations are characterized by an acute deterioration in respiratory symptoms. This event requires additional therapy and further increases the economic burden on patients (3). COPD exacerbations may be attributed to many risk factors, such as respiratory viral infections, the exacerbation of other respiratory diseases, and non-respiratory diseases (4). Some individuals can progress to respiratory failure, requiring intensive care and eventually death, for example, patients with certain comorbidities (5). To the best of our knowledge, early-risk stratification of COPD patients and taking supportive care measures are central to avoiding the worst progression and fatal outcomes (6). Some risk stratification scores, such as the BMI, airflow obstruction, dyspnea, and exercise capacity (BODE) index, have been proposed to predict COPD exacerbations in COPD patients (7–10). However, these scores have several limitations, such as low AUC values (11).
Deep learning (DL) methods are being increasingly integrated into scientific discovery (12–14). Nowadays, the DL algorithm plays a pivotal role in data mining and analysis of medical imaging. Reportedly, the DL algorithm can be used to evaluate the severity of emphysema using sequential CT scans (15). Additionally, the DL algorithm also performed well in the prediction of hospital readmissions and long-term prognosis for COPD (16, 17). Notably, these algorithms also showed excellent performance in auxiliary diagnosis of infectious diseases, such as sepsis (18). However, studies evaluating the capacity of DL techniques in risk stratification of COPD patients are limited.
Relevant information on body composition and thoracic abnormalities can be obtained by quantitative computed tomography (CT) analysis (19–21). CT imaging features have been used to identify individuals at risk of progressing to COPD (22). Reportedly, Moll et al. developed a tool for predicting all-cause mortality based on quantitative CT imaging features in patients with COPD (23). Shimizu et al. (24) devised a model for predicting a decline in lung function and mortality in COPD using the chest inspiratory CT scan. Although the clinical potential of CT biomarkers has been explored, the role of CT scan-derived indicators in predicting COPD exacerbations remained unclear.
Hence, we aimed to assess the added potential of CT biomarkers in predicting COPD exacerbations and thus develop and externally validate a DL model.
Methods and materials
Study design
In this retrospective study, hospitalized patients with COPD were consecutively recruited at Suzhou Ninth People’s Hospital of Soochow University between January 2013 and March 2021. The inclusion criteria were as follows: (1) age ≥ 18 years old, (2) confirmed by pulmonary function tests at the baseline visit (post-bronchodilator FEV1/FVC ratio less than 0.7), (3) receiving chest CT scanning on admission, and (4) no malignant tumors or autoimmune diseases simultaneously existed. Patients with incomplete clinical information, tuberculosis, asthma, and a previous history of lung surgery were excluded. The whole study cohort was assigned into two groups at random with a ratio of 6:4 (i.e., derivation and internal test cohorts for model development and validation, respectively). Data from an external cohort were obtained from the Suzhou Municipal Hospital. These eligible individuals met the same inclusion criteria as the derivation cohort.
We recorded demographics and laboratory tests from the electronic medical record, and chest CT scans were obtained from a picture archiving and communication system. Patients were regularly followed up every 3 months for 2 years.
The ethical guidelines of the 1975 Declaration of Helsinki were strictly followed. The review board of both institutions approved our study, and informed consent was waived.
Potential predictors
The BODE index is a simple multidimensional grading system for assessing the life quality of patients with COPD. This score consists of body mass index, airflow obstruction, dyspnea defined by the mMRC questionnaire, and exercise capacity index (25, 26). Previous exacerbation history was defined that patients had at least one COPD exacerbation since the initial diagnosis of COPD (27).
Outcomes
The clinical outcome of this study is a moderate (requiring antibiotics and/or glucocorticoids) or severe (hospitalization, ICU admission, or death) exacerbation (10).
CT images acquisition
CT scans were performed using a 64-slice spiral CT (SIEMENS CT scanner, Erlangen, Germany; Philips CT scanner, Cleveland, USA). On admission, all subjects underwent chest CT scans at 120 kVp tube voltage and 200 mA tube current. Volumetric inspiratory and expiratory CT was performed according to a standardized study protocol (28). CT images were reconstructed with a 1-mm section thickness and were standardized before review and evaluation. More information was provided in Supplementary material S1.
Chest CT image analysis
The function status of the whole lung was quantitatively evaluated by 3D slicer software (version 5.2.2) (29). Quantitative volumetric analysis was conducted based on built-in modules, and individual volumes were calculated, including emphysema [low-attenuation areas (voxels with ≤ −950HU)] (30). Functional lung volume (FLV) is defined as the total volume of ventilated lung tissue. Affected lung volume (ALV) is calculated as the sum of the volume of infiltrated and collapsed lung tissue.
Next, the body composition of all subjects was evaluated using Slice-O-Matic (TomoVision, Magog, Canada, version 5.0) software (31). An axial CT slice at the level of the T4 was selected to measure the total cross-sectional area (CSA) of the pectoralis major and minor muscles. According to the predefined HU threshold, at the level of L1, visceral adipose tissue area (VATA, −150 to −50 HU), subcutaneous adipose tissue area (SATA, −190 to −30 HU), and skeletal muscle area (SM, −29 to 150 HU) were calculated (32, 33). Two clinicians (5- and 8-years of experience in radiology, respectively) independently reviewed and measured all CT indicators when blind to clinical information.
Model construction and evaluation
This model for predicting COPD exacerbations was developed using the entire derivation dataset. Artificial neural network (ANN), as one of the deep learning algorithms, was introduced for predicting exacerbations in this study. For optimizing the architecture and parameters of models, we got the best parameter combinations of each model using the cross-validated grid-search (5-fold) method with software (Python, version 3.6.2; scikit-learn package, version 0.24). The final models were determined for further evaluation based on the best parameters and selected variables. Internal and external test datasets were used to evaluate the predictive performance of this system. According to the first quartile (25%) and the third quartile (75%) of probabilities from this system, the cohort was divided into low-, medium-, and high-risk groups. More information was provided in Supplementary material S2.
Statistical analysis
Continuous data were shown as the median ± interquartile range (IQR) and compared using the Mann–Whitney U-test or Student’s t-test as appropriate. Categorical data were compared using the chi-squared test.
Parameters with a possibility threshold of <0.05 based on univariate logistic regression analysis were included in the multivariate logistic regression model for identifying independent predictors associated with COPD exacerbations. We adopted the Spearman correlation coefficient (Rho) to evaluate correlations between independent predictors.
The ROC analysis was performed to evaluate the predictive performance. We compared the differences between ROC curves using the DeLong test. The Kaplan–Meier method and the log-rank test were used to estimate survival without exacerbations.
IBM SPSS version 26.0 was used for data analysis. p < 0.05 were considered statistically significant.
Results
Patient characteristics
A total of 1,150 eligible patients were enrolled, and the flowchart of the study design is shown in Figure 1. The derivation cohort for model development consisted of 519 patients, and the remaining patients were assigned to internal (n = 346) and external test cohorts (n = 285).
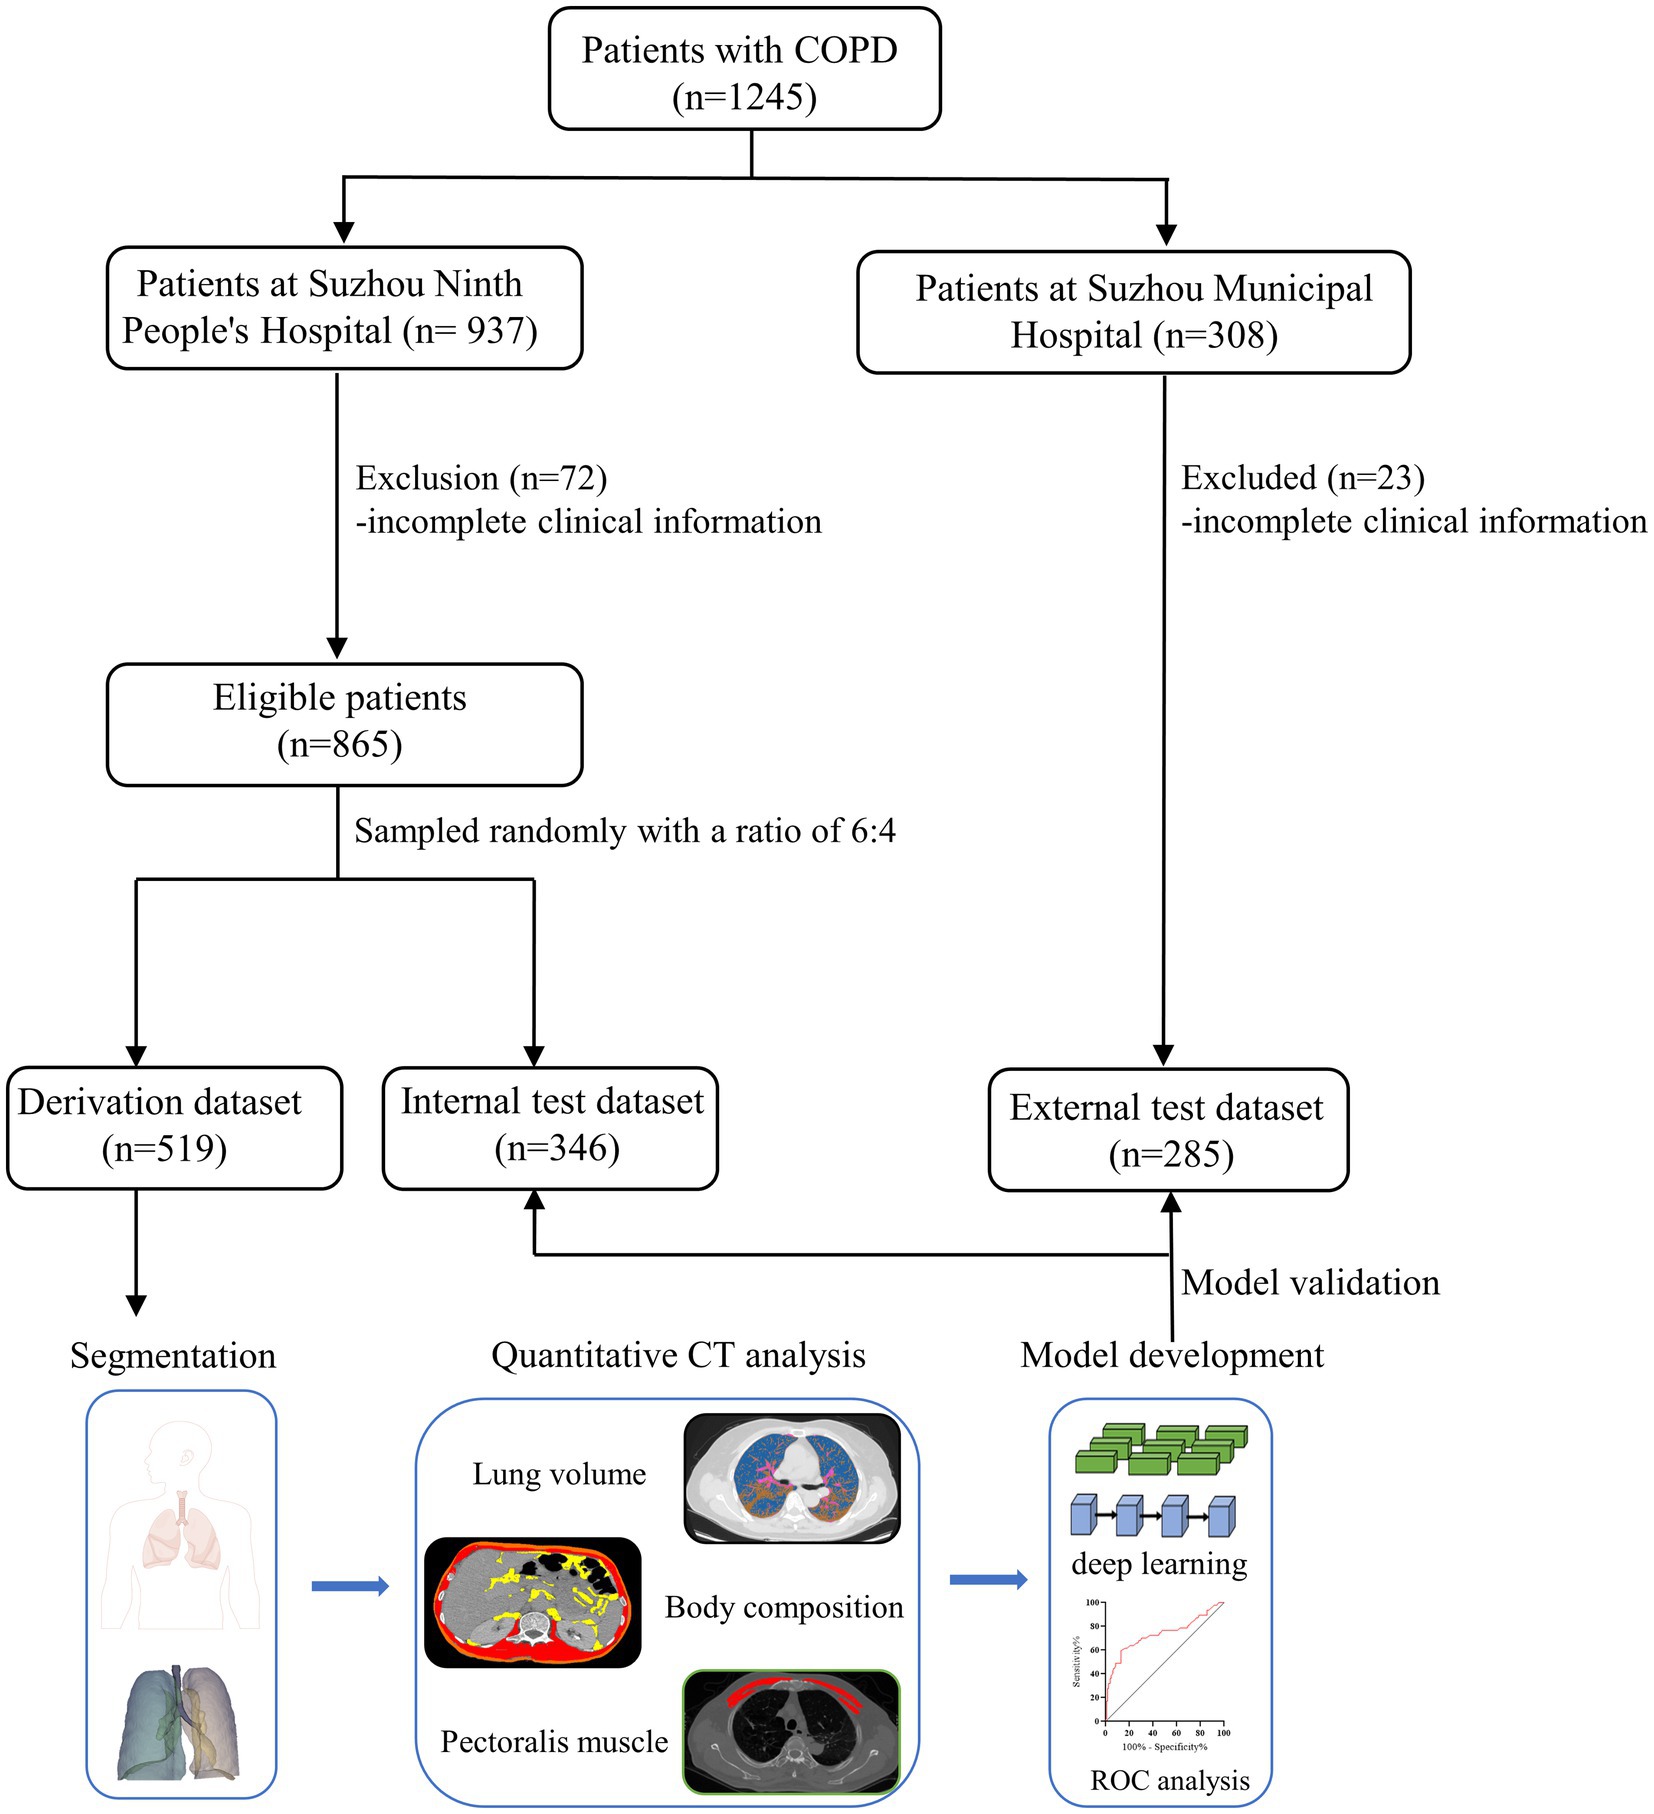
Figure 1. Flow diagram of the study population and model development.
In the derivation cohort, the median age and body mass index (BMI) were 62 (IQR, 10.5) years and 23.6 (IQR, 4.8), respectively. Patients with ≥2 comorbidities accounted for 71.8%. During a 2-year follow-up, 90 patients (17.3%) suffered from ≥1 exacerbation. Furthermore, we retrospectively enrolled 50 sex- and age-matched healthy controls in this study. The baseline clinical characteristics are summarized in Table 1 and Supplementary Table S1.
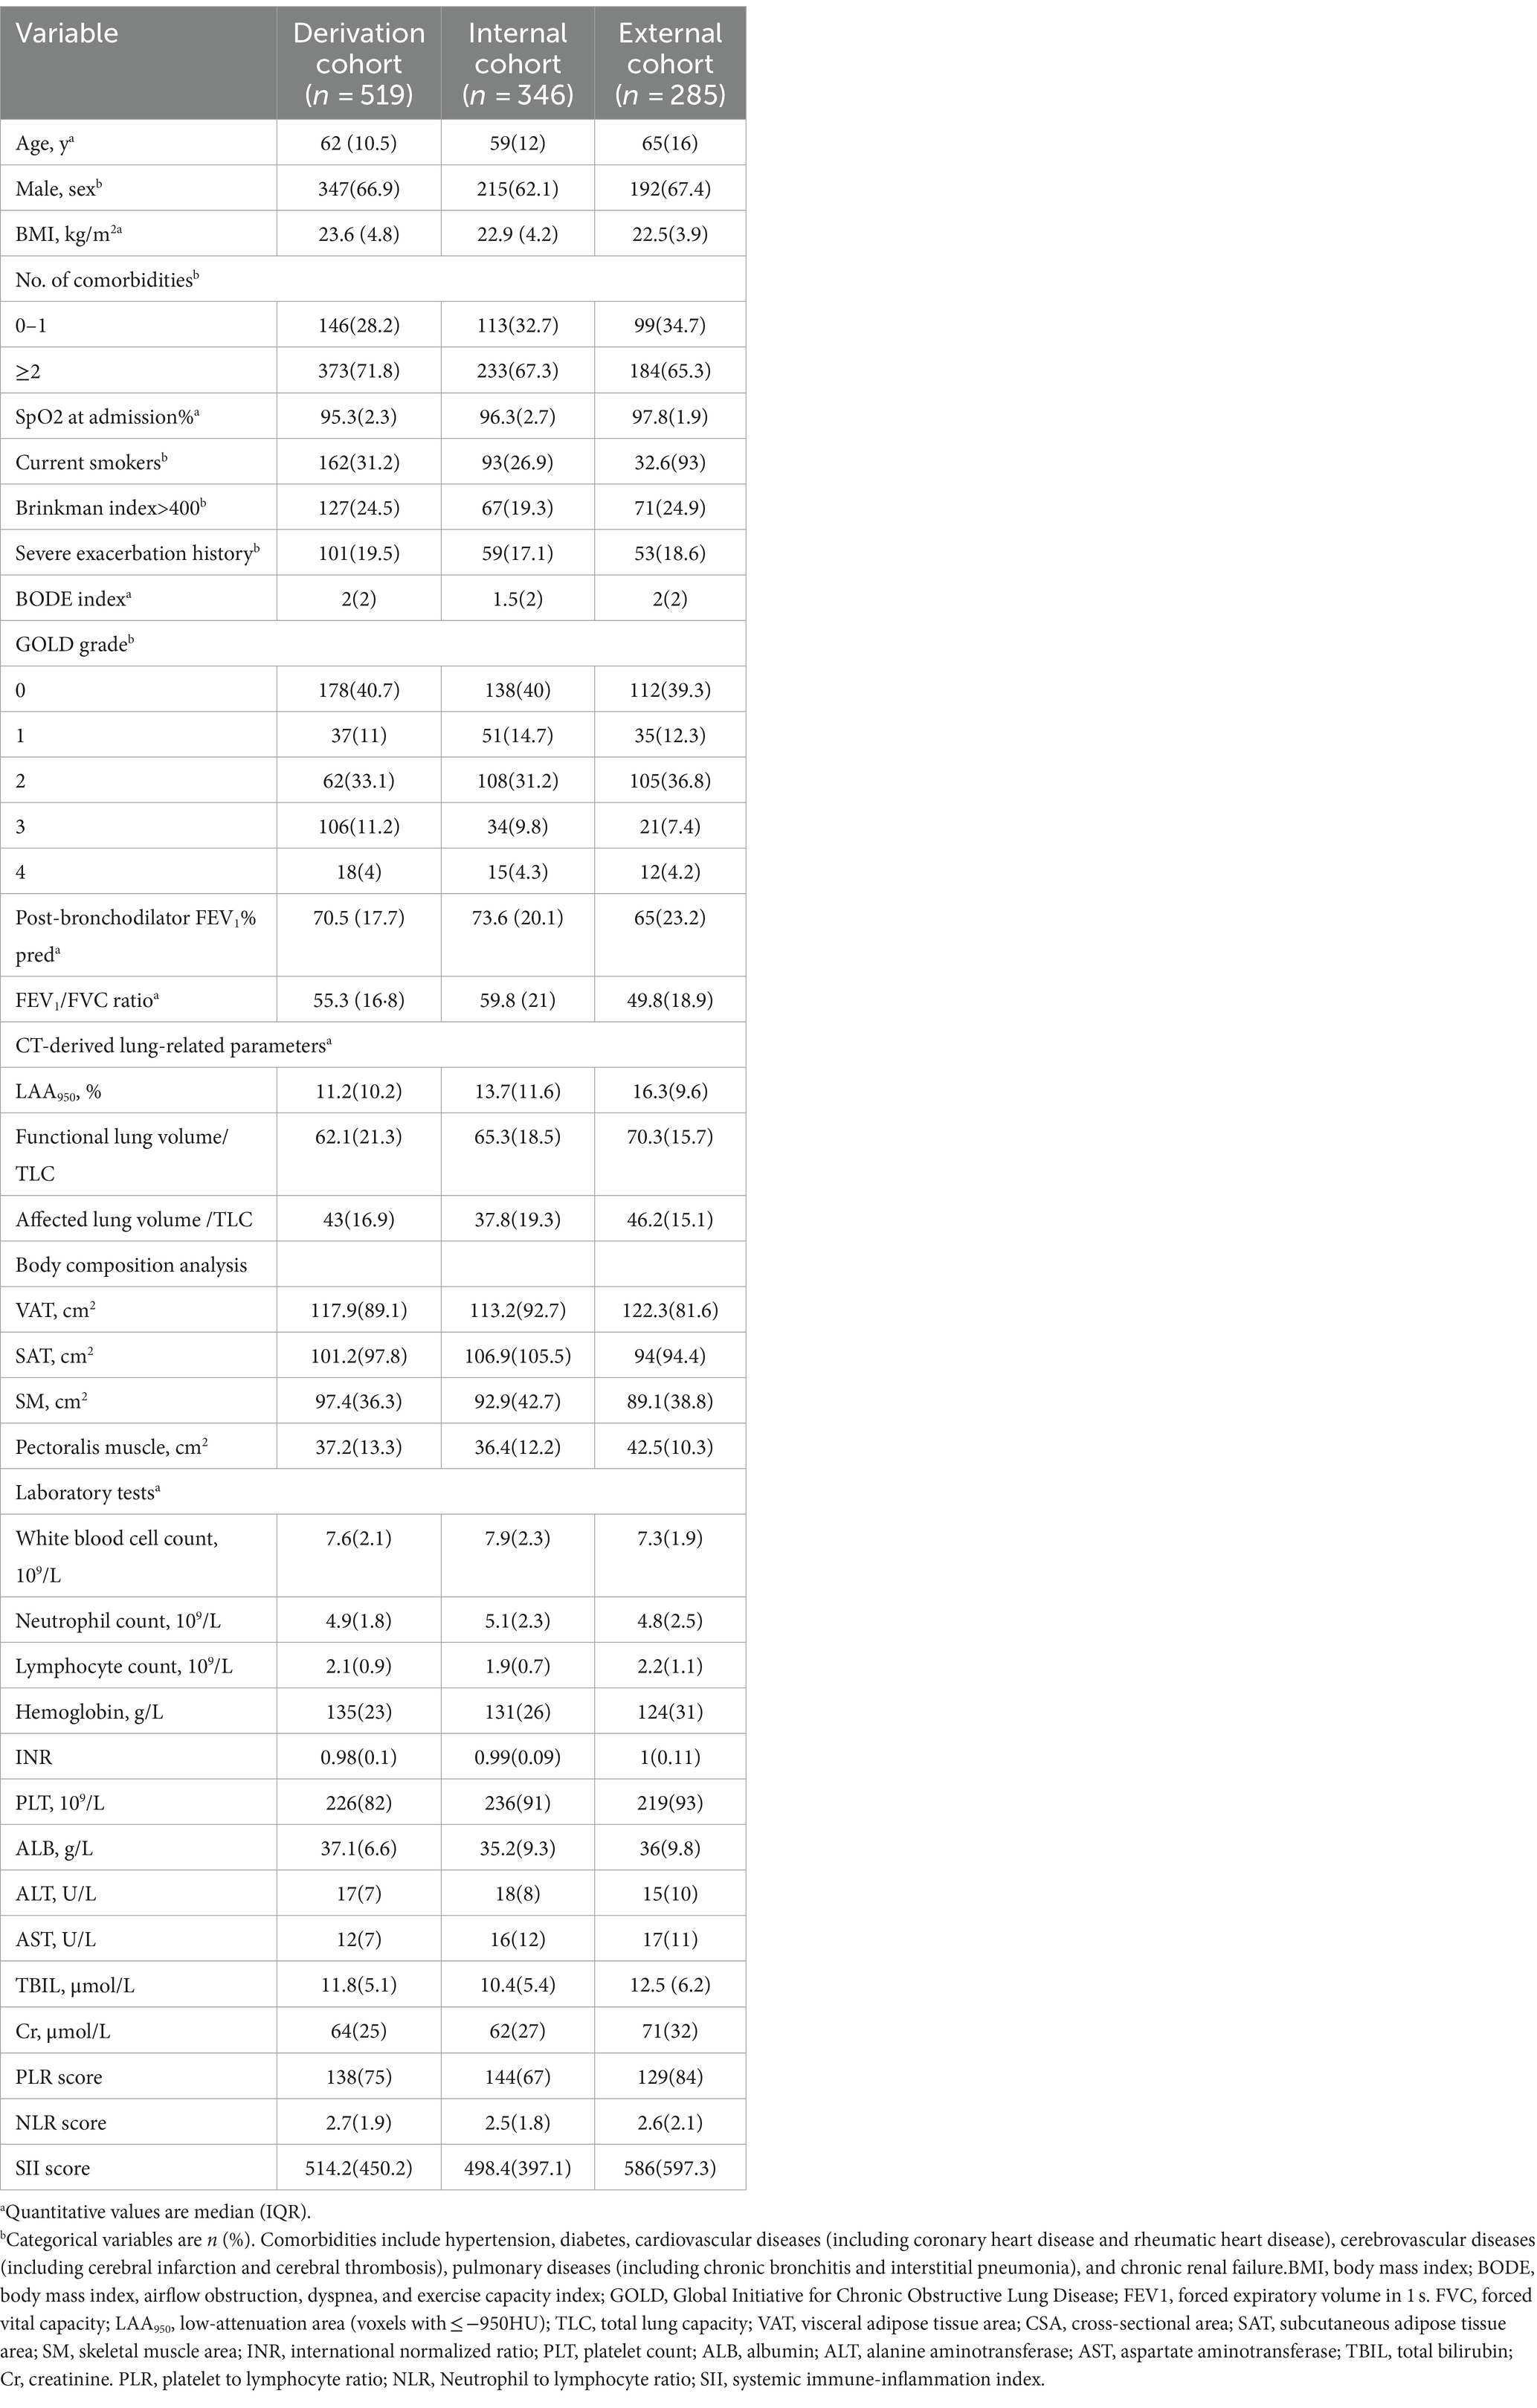
Table 1. Baseline characteristics.
Identification of independent risk factors
In the derivation cohort, the univariate logistic regression analysis revealed that ≥2 comorbidities, history of exacerbation, BODE index, post-bronchodilator FEV1% pred, and several CT-derived parameters were associated with exacerbation events (Table 2). In the multivariate analysis, history of exacerbation (OR, 1.32), BODE index (OR, 1.17), ALV/TLC ratio (OR, 1.61), VAT (OR, 1.18), and pectoralis muscle CSA (OR, 0.95) were associated significantly with exacerbation events (Table 2). A correlation map among different predictors is shown in Supplementary Figure S1 (see Table 3).
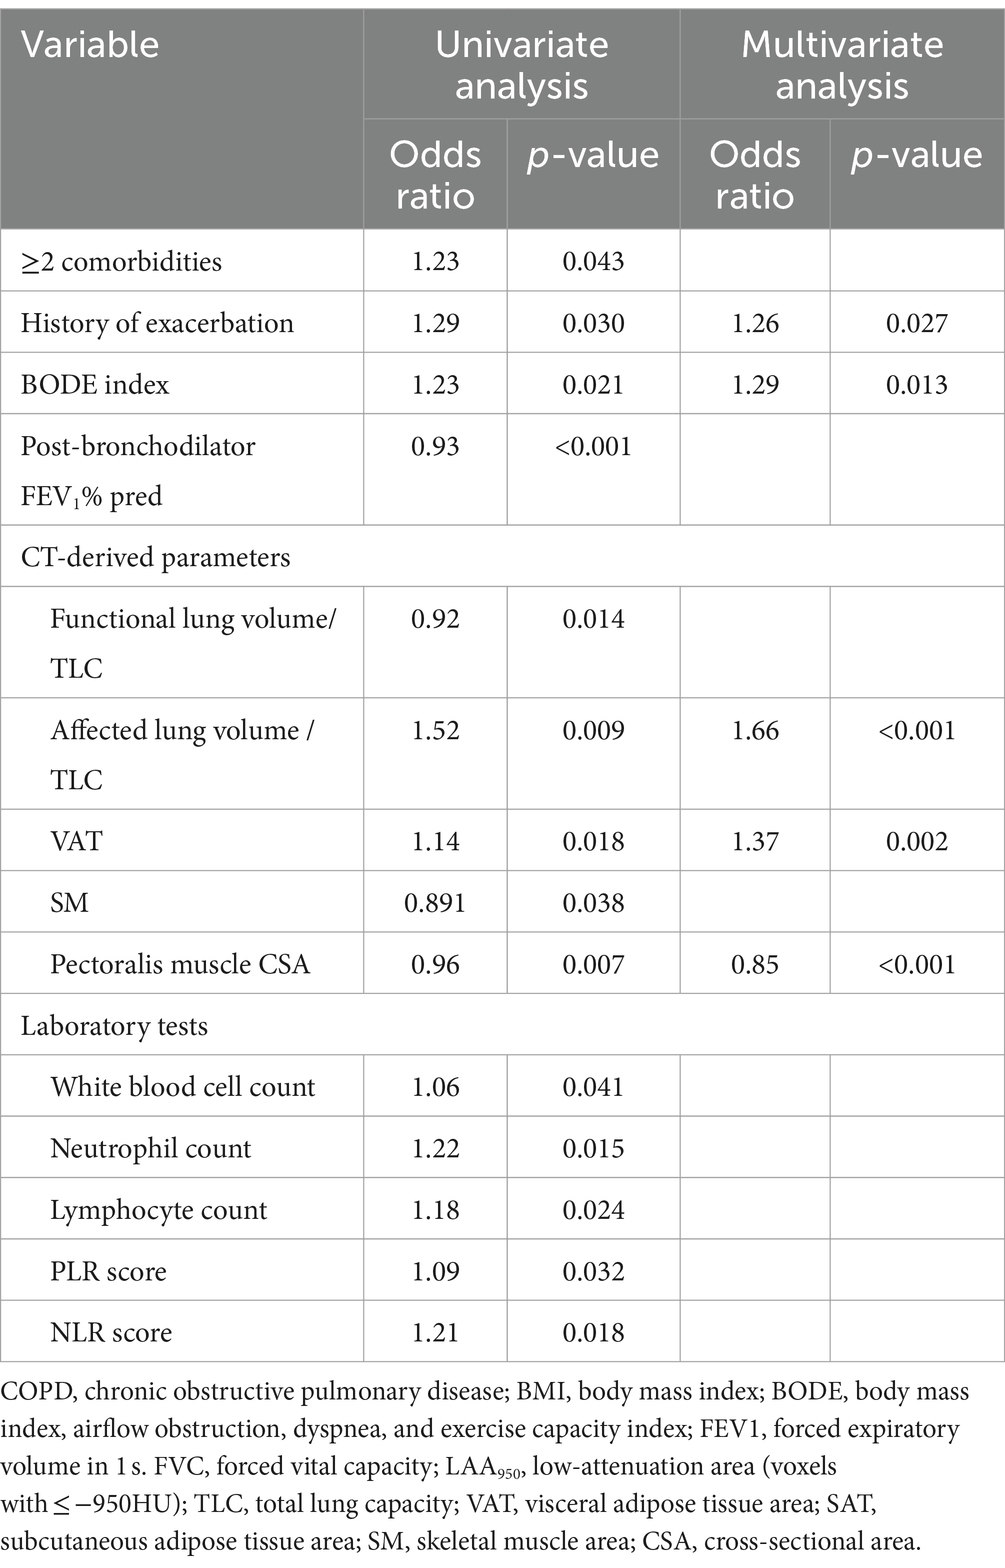
Table 2. Univariate and multivariate logistic analyses to identify predictors of COPD exacerbations in the derivation cohort.
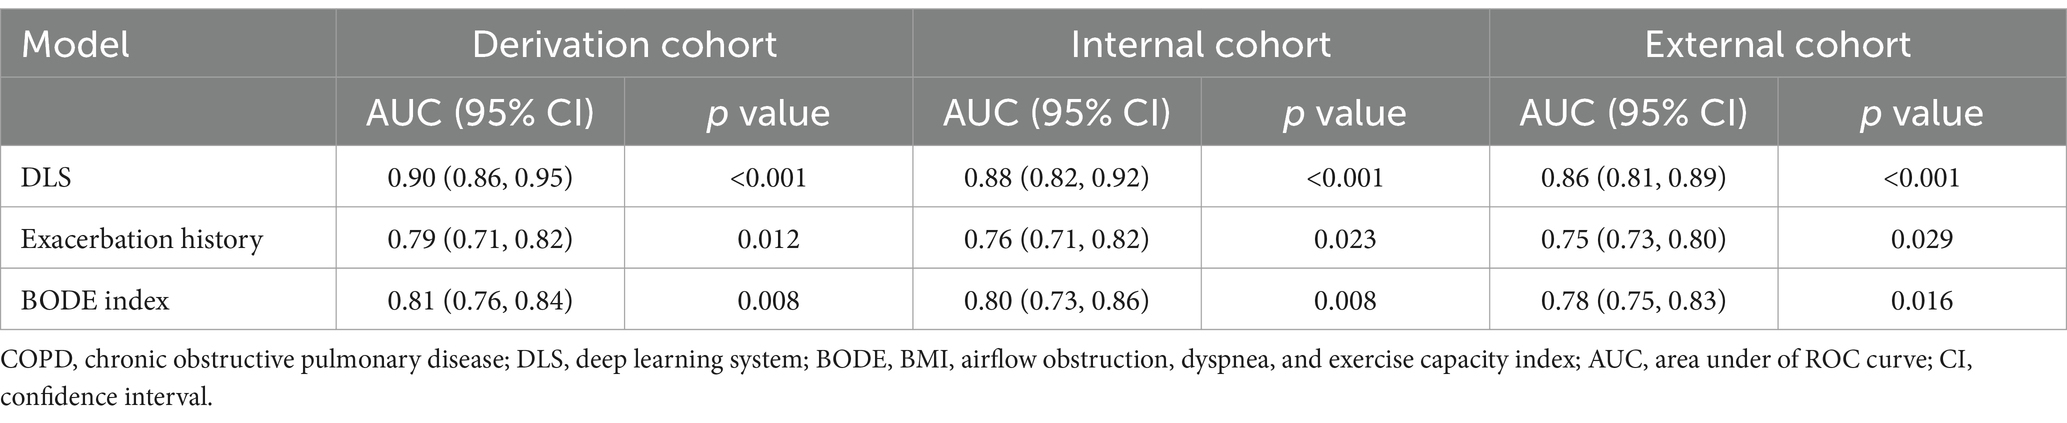
Table 3. Predictive performance of the DLS for prediction of COPD exacerbations in all cohorts.
Predictive performance of the DLS
The DLS was developed for predicting at least one exacerbation episode in 2 years, based on clinical data (history of exacerbation and BODE index) and CT-derived radiomic parameters (ALV/TLC ratio, VAT, and pectoralis muscle CSA). Compared with the history of exacerbations and BODE index, this system showed the best predictive performance with an AUC of 0.90 (95% CI, 0.86–0.94) in the derivation cohort, 0.88 (95%CI, 0.82–0.92) in the internal cohort, and 0.86 (95%CI, 0.81–0.89) in the external cohort (Figures 2A–C, Table 3). The AUC values of the DLS in derivation and test cohorts were significantly higher than the history of exacerbations and BODE index using the DeLong test (p < 0.05).
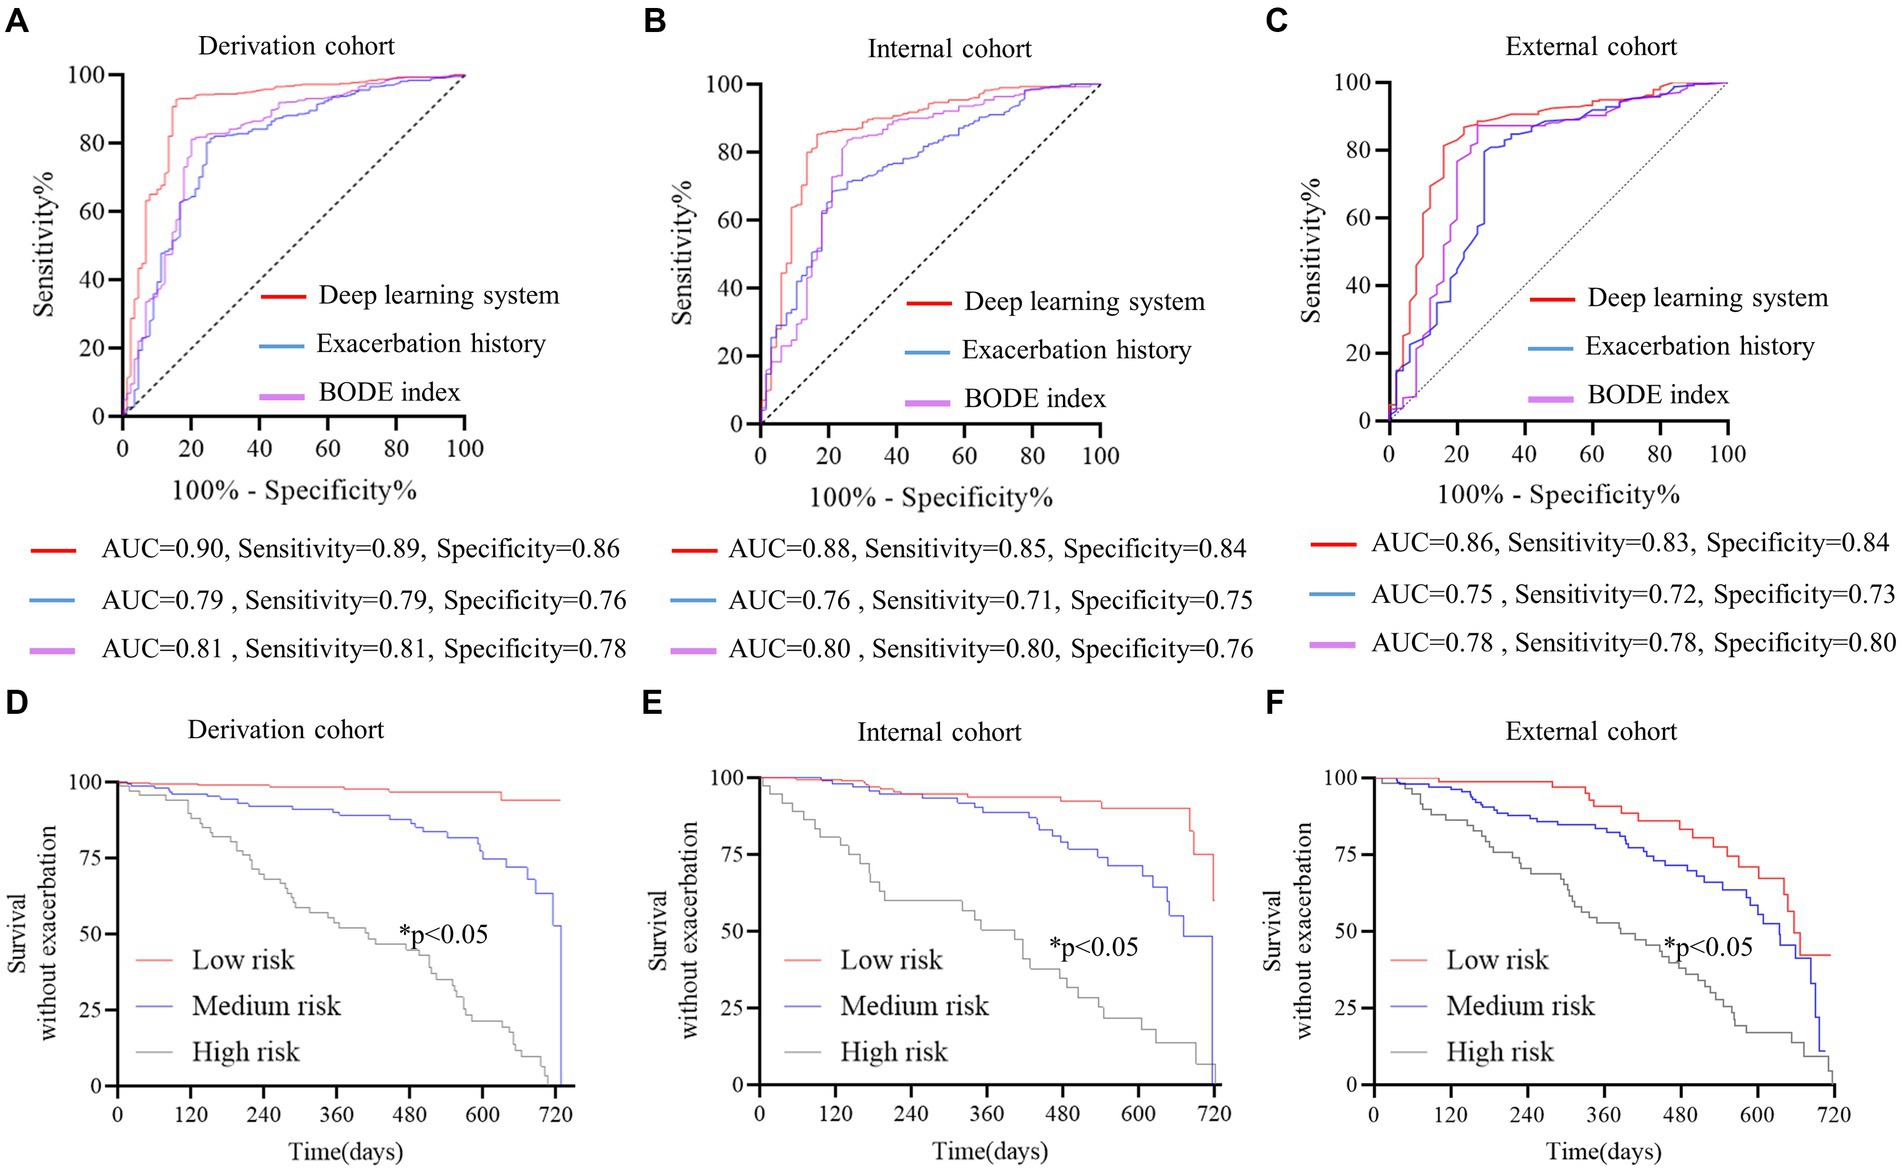
Figure 2. Discriminative performance of the deep learning system (DLS) for predicting future severe acute COPD exacerbations. (A–C) The red curve represents DLS, the blue curve represents exacerbation history, and the purple curve represents the BODE index. The DeLong test was used to compare ROC curves, and AUCs were higher for the DLS than exacerbation history and the BODE index (DeLong test p < 0.05 for all). Survival analysis without exacerbation (D–F) all patients were stratified according to prediction possibility from the DLS. The Kaplan–Meier method and log-rank test were used to estimate the survival without exacerbations. Patients at high risk were prone to exacerbation (p < 0.05 for all). The red curve represents patients at low risk, the blue curve represents patients at medium risk, and the gray curve represents patients at high risk.
Patients were stratified by probabilities from the DLS in the derivation cohort. In the survival analysis, patients with a higher risk were prone to pulmonary exacerbations (p < 0.05) (Figures 2D–F).
Risk stratification of subgroups
To evaluate the ability of the DLS to reclassify the risk of COPD patients, the survival analysis was performed in certain patient subgroups (Figure 3). Additional discrimination of the DLS for COPD exacerbations was determined, such as in patients with a BODE index of ≥5.
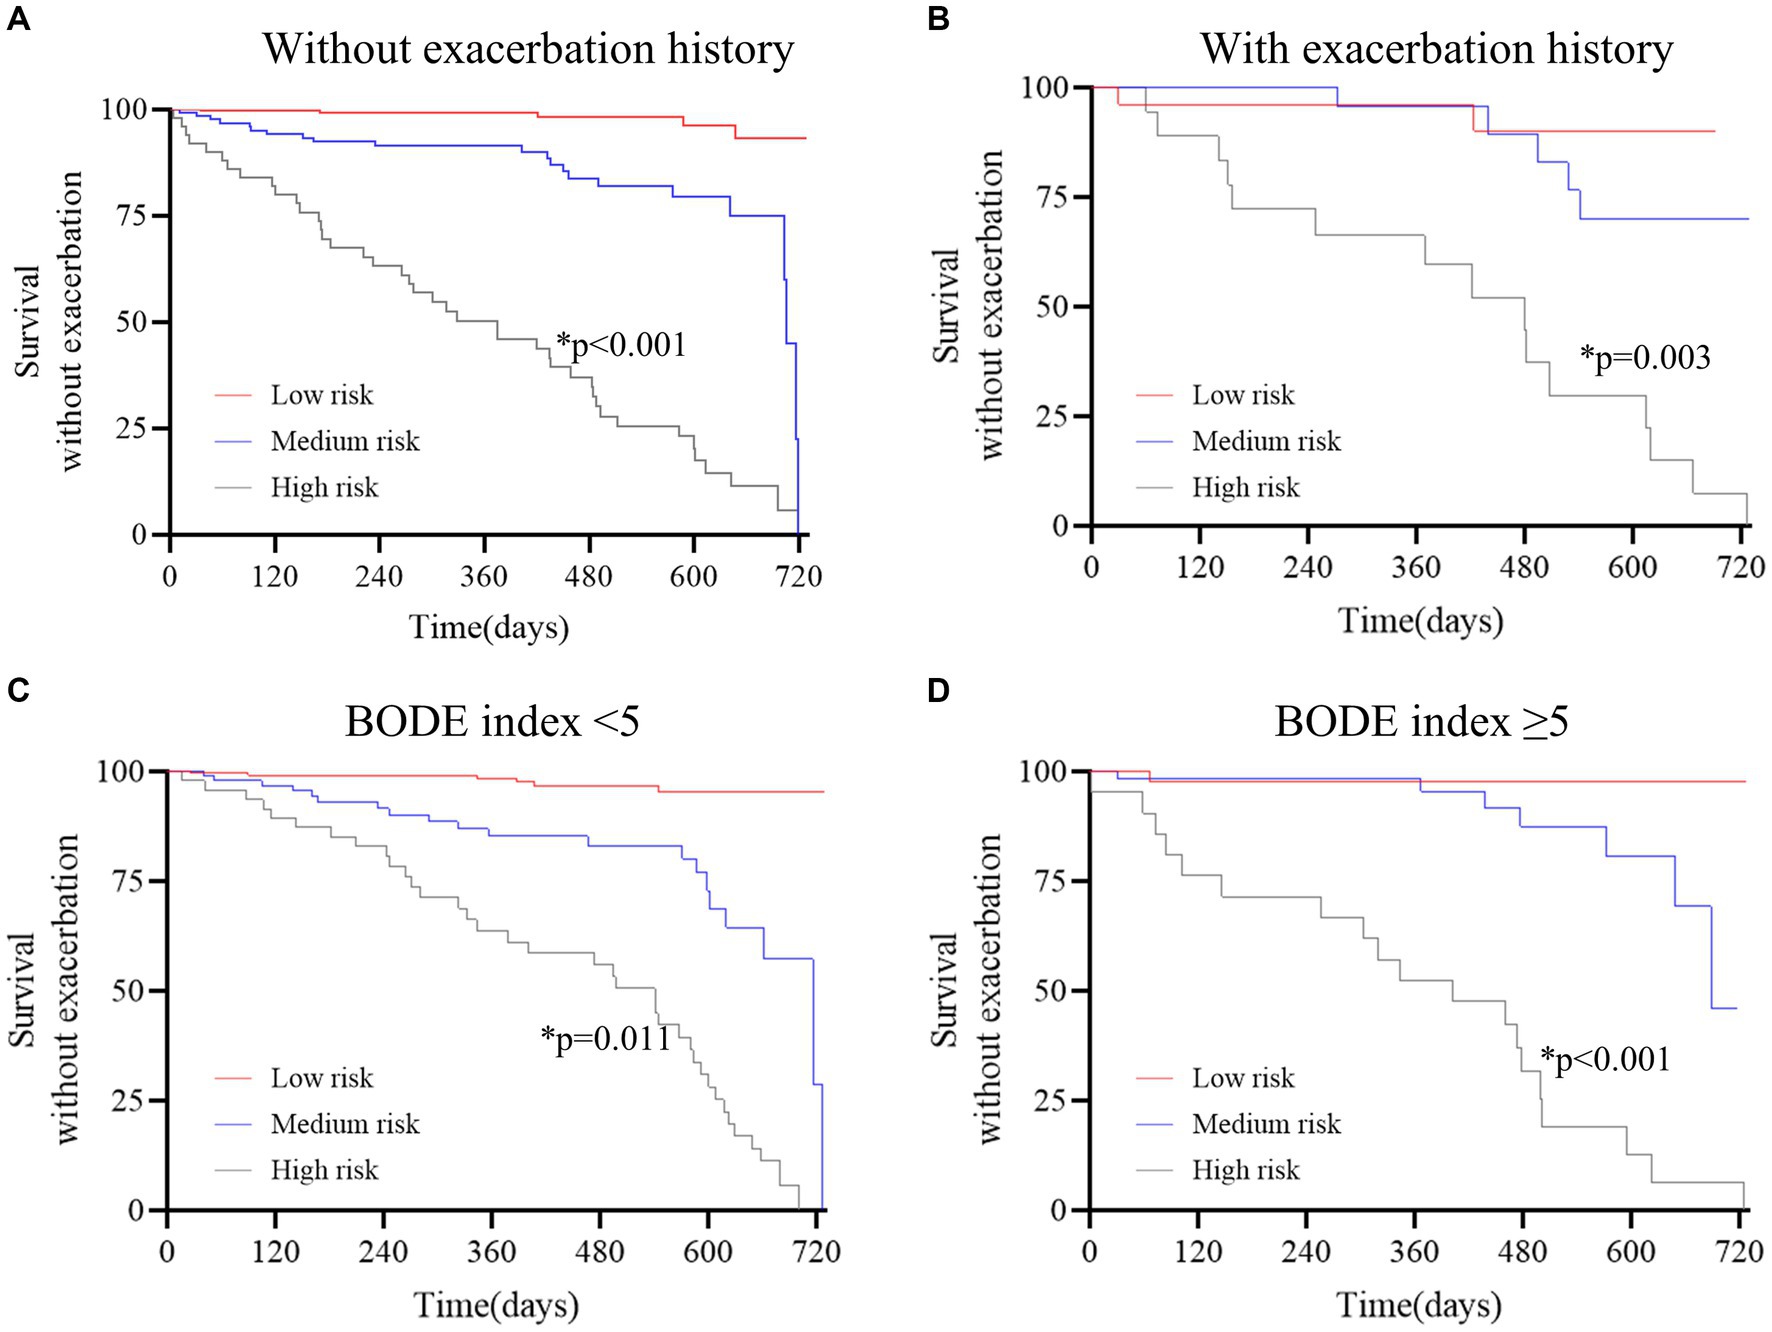
Figure 3. Survival curves stratified by the deep learning system in the derivation cohort. (A) without exacerbation history; (B) with exacerbation history; (C) BODE index<5; D, BODE index≥5. The red curve represents patients at low risk, the blue curve represents patients at medium risk, and the gray curve represents patients at high risk. The Kaplan–Meier method and the log-rank test were used to estimate survival without exacerbations. The results revealed that patients at high risk were prone to exacerbation in all subgroups (p < 0.05 for all).
Discussion
In the present study, the multivariate analysis revealed that CT-derived high ALV/TLC, high VAT CSA, and low pectoralis muscle CSA were independent risk factors causing COPD exacerbations. Remarkably, the DLS was developed and validated to identify individuals at risk of COPD exacerbations during 2-year follow-ups based on clinical data and CT-derived biomarkers. This system significantly outperformed conventional scores (exacerbation history and BODE index), with an AUC value of 0.88. Furthermore, this tool showed potential for stratifying patients by the probability of exacerbations and offered evidence to make individual care plans.
Recently, multiple studies reported that CT scan-derived body composition parameters (muscle and adipose tissue mass and distribution) were correlated with adverse clinical outcomes such as lung cancer death, adverse cardiovascular events, and fragility fractures (34, 35). Our study showed a close correlation between high VAT and future COPD exacerbations. Obesity, and abdominal VAT, in particular, is an important and distinguishing characteristic in COPD patients, and that may be due to adipose tissue function alteration (36–38). In addition, pectoralis muscle CSA could be used to evaluate the clinically relevant muscle mass (39). Generally, low muscle mass represents a decrease in the reserve of multiple physiological systems (40). This could lead to worst outcomes, including COPD exacerbations. Moreover, high ALV/TLC was found to be significantly linked to COPD exacerbations. This may be attributed to inflammatory cell infiltration and the collapse of lung tissue structure (41).
To the best of our knowledge, a history of exacerbation and the BODE index were widely used indicators for predicting COPD (10, 42, 43). However, exacerbation history has some limitations, such as inherent recall bias and unexplained underlying mechanisms. These affect the application of this predictor in patients without exacerbation history. Similarly, the BODE index consists of four variables, including the variable exercise capacity, and its predictive performance is unsatisfactory. The DLS in our study might serve a pivotal role in overcoming these limitations.
Furthermore, our data demonstrated that patients with higher risk stratified by the DLS were susceptible to the exacerbations of COPD. Clinicians can identify high-risk patients using the DLS, thereby making adequate antimicrobial therapy. Low-risk individuals only receive a standard of care. This might guard against the over-medicalization. In addition, certain patient subgroups may benefit from this risk assessment tool, such as those with no exacerbation history/BODE<5, yet high risk identified by the DLS.
However, our study has some limitations. First, this study is a retrospective study, and the generalizability should be validated in a large external dataset. Second, the analysis of CT scan-derived parameters requires experienced clinicians, and it might affect the practical use of the DLS in the clinic. A fully automated tool should be devised for image analysis. Third, the underlying relationship between these CT biomarkers and future exacerbations requires further investigation. Finally, although respiratory questionnaires for clinical symptom evaluation have some limitations, the potential value of these scores in predicting COPD exacerbations should be investigated in future studies.
Conclusion
High VAT, low pectoralis muscle CSA, and high ALV/TLC were independent risk factors of COPD exacerbations. We developed and externally validated the DLS to identify individuals at risk for future exacerbations. This system is expected to improve healthcare quality and reduce medical costs.
Data availability statement
The raw data supporting the conclusions of this article will be made available by the authors, without undue reservation.
Ethics statement
The studies involving humans were approved by the ethics committee of Suzhou Ninth Hospital Affiliated to Soochow University. The studies were conducted in accordance with the local legislation and institutional requirements. The ethics committee/institutional review board waived the requirement of written informed consent for participation from the participants or the participants’ legal guardians/next of kin because the nature of the retrospective study.
Author contributions
JW: Validation, Supervision, Resources, Writing – review & editing, Writing – original draft, Visualization, Methodology, Investigation, Conceptualization. YL: Software, Project administration, Writing – review & editing, Writing – original draft, Visualization, Investigation, Conceptualization. SD: Methodology, Funding acquisition, Formal analysis, Data curation, Writing – review & editing, Software, Project administration, Investigation. LW: Supervision, Resources, Conceptualization, Writing – review & editing, Software, Project administration, Investigation, Data curation. XS: Writing – original draft, Visualization, Methodology, Funding acquisition, Writing – review & editing, Investigation, Conceptualization.
Funding
The author(s) declare financial support was received for the research, authorship, and/or publication of this article. This work was supported by grants from the Scientific Research Foundation of Suzhou Ninth Hospital Affiliated to Soochow University (no. YK202330).
Conflict of interest
The authors declare that the research was conducted in the absence of any commercial or financial relationships that could be construed as a potential conflict of interest.
Publisher’s note
All claims expressed in this article are solely those of the authors and do not necessarily represent those of their affiliated organizations, or those of the publisher, the editors and the reviewers. Any product that may be evaluated in this article, or claim that may be made by its manufacturer, is not guaranteed or endorsed by the publisher.
Supplementary material
The Supplementary material for this article can be found online at: https://www.frontiersin.org/articles/10.3389/fmed.2024.1370917/full#supplementary-material
Abbreviations
COPD, chronic obstructive pulmonary disease; DLS, deep learning system; CT, computed tomography; FEV1, forced expiratory volume in 1s; FVC, forced vital capacity; FLV, functional lung volume; ALV/TLC, affected lung volume /total lung capacity; CSA, cross-sectional area; VAT, visceral adipose tissue area; SAT, subcutaneous adipose tissue area; SM, skeletal muscle area; BODE, body mass index, airflow obstruction, dyspnea, and exercise capacity index; ROC, receiver operating characteristic; AUC, area under of ROC; CI, confidence interval; IQR, interquartile range; BMI, body mass index
References
1. Oelsner, EC, Balte, PP, Bhatt, SP, Cassano, PA, Couper, D, Folsom, AR, et al. Lung function decline in former smokers and low-intensity current smokers: a secondary data analysis of the NHLBI pooled cohorts study. Lancet Respir Med. (2020) 8:34–44. doi: 10.1016/S2213-2600(19)30276-0
2. Christenson, SA, Smith, BM, Bafadhel, M, and Putcha, N. Chronic obstructive pulmonary disease. Lancet. (2022) 399:2227–42. doi: 10.1016/S0140-6736(22)00470-6
3. Mathioudakis, AG, Janssens, W, Sivapalan, P, Singanayagam, A, Dransfield, MT, Jensen, JUS, et al. Acute exacerbations of chronic obstructive pulmonary disease: in search of diagnostic biomarkers and treatable traits. Thorax. (2020) 75:520–7. doi: 10.1136/thoraxjnl-2019-214484
4. MacLeod, M, Papi, A, Contoli, M, Beghé, B, Celli, BR, Wedzicha, JA, et al. Chronic obstructive pulmonary disease exacerbation fundamentals: diagnosis, treatment, prevention and disease impact. Respirology (Carlton, Vic). (2021) 26:532–51. doi: 10.1111/resp.14041
5. DMG, H, Criner, GJ, Papi, A, Singh, D, Anzueto, A, Martinez, FJ, et al. Global initiative for the diagnosis, management, and prevention of chronic obstructive lung disease. The 2020 GOLD science committee report on COVID-19 and chronic obstructive pulmonary disease. Am J Respir Crit Care Med. (2021) 203:24–36. doi: 10.1164/rccm.202009-3533SO
6. Nagata, K, Horie, T, Chohnabayashi, N, Jinta, T, Tsugitomi, R, Shiraki, A, et al. Home high-flow nasal cannula oxygen therapy for stable Hypercapnic COPD: a randomized clinical trial. Am J Respir Crit Care Med. (2022) 206:1326–35. doi: 10.1164/rccm.202201-0199OC
7. Criner, GJ, Sue, R, Wright, S, Dransfield, M, Rivas-Perez, H, Wiese, T, et al. A multicenter randomized controlled trial of Zephyr endobronchial valve treatment in heterogeneous emphysema (LIBERATE). Am J Respir Crit Care Med. (2018) 198:1151–64. doi: 10.1164/rccm.201803-0590OC
8. Doers, ME, Zafar, MA, Stolz, U, Eckman, MH, Panos, RJ, and Loftus, TM. Predicting adverse events among patients with COPD exacerbations in the emergency department. Respir Care. (2022) 67:56–65. doi: 10.4187/respcare.09013
9. Esther, CR, O'Neal, WK, Anderson, WH, Kesimer, M, Ceppe, A, Doerschuk, CM, et al. Identification of sputum biomarkers predictive of pulmonary exacerbations in COPD. Chest. (2022) 161:1239–49. doi: 10.1016/j.chest.2021.10.049
10. Papakonstantinou, E, Bonovolias, I, Roth, M, Tamm, M, Schumann, D, Baty, F, et al. Serum levels of hyaluronic acid are associated with COPD severity and predict survival. Eur Respir J. (2019) 53:1801183. doi: 10.1183/13993003.01183-2018
11. Chen, K, Pleasants, KA, Pleasants, RA, Beiko, T, Washburn, RG, Yu, Z, et al. A systematic review and Meta-analysis of sputum purulence to predict bacterial infection in COPD exacerbations. COPD. (2020) 17:311–7. doi: 10.1080/15412555.2020.1766433
12. Lu, MT, Raghu, VK, Mayrhofer, T, Aerts, HJWL, and Hoffmann, U. Deep learning using chest radiographs to identify high-risk smokers for lung Cancer screening computed tomography: development and validation of a prediction model. Ann Intern Med. (2020) 173:704–13. doi: 10.7326/M20-1868
13. Walsh, SLF, Mackintosh, JA, Calandriello, L, Silva, M, Sverzellati, N, Larici, AR, et al. Deep learning-based outcome prediction in progressive fibrotic lung disease using high-resolution computed tomography. Am J Respir Crit Care Med. (2022) 206:883–91. doi: 10.1164/rccm.202112-2684OC
14. Ash, SY, Choi, B, Oh, A, Lynch, DA, and Humphries, SM. Deep learning assessment of progression of emphysema and fibrotic interstitial lung abnormality. Am J Respir Crit Care Med. (2023) 208:666–75. doi: 10.1164/rccm.202211-2098OC
15. Oh, AS, Baraghoshi, D, Lynch, DA, Ash, SY, Crapo, JD, Humphries, SM, et al. Emphysema progression at CT by deep learning predicts functional impairment and mortality: results from the COPDGene study. Radiology. (2022) 304:672–9. doi: 10.1148/radiol.213054
16. Lopez, K, Li, H, Lipkin-Moore, Z, Kay, S, Rajeevan, H, Davis, JL, et al. Deep learning prediction of hospital readmissions for asthma and COPD. Respir Res. (2023) 24:311. doi: 10.1186/s12931-023-02628-7
17. Smith, LA, Oakden-Rayner, L, Bird, A, Zeng, M, To, MS, Mukherjee, S, et al. Machine learning and deep learning predictive models for long-term prognosis in patients with chronic obstructive pulmonary disease: a systematic review and meta-analysis. Lancet Digit Health. (2023) 5:e872–81. doi: 10.1016/S2589-7500(23)00177-2
18. Moor, M, Bennett, N, Plečko, D, Horn, M, Rieck, B, Meinshausen, N, et al. Predicting sepsis using deep learning across international sites: a retrospective development and validation study. EClinicalMedicine. (2023) 62:102124. doi: 10.1016/j.eclinm.2023.102124
19. Ohliger, MA . Body composition at CT and risk of future disease. Radiology. (2023) 306:e222162. doi: 10.1148/radiol.222162
20. Keyl, J, Hosch, R, Berger, A, Ester, O, Greiner, T, Bogner, S, et al. Deep learning-based assessment of body composition and liver tumour burden for survival modelling in advanced colorectal cancer. J Cachexia Sarcopenia Muscle. (2023) 14:545–52. doi: 10.1002/jcsm.13158
21. Salman, R, Sammer, MB, Serrallach, BL, Sangi-Haghpeykar, H, Annapragada, AV, and Paul Guillerman, R. Lower skeletal muscle mass on CT body composition analysis is associated with adverse clinical course and outcome in children with COVID-19. Radiol Med. (2022) 127:440–8. doi: 10.1007/s11547-022-01462-z
22. Makimoto, K, Hogg, JC, Bourbeau, J, Tan, WC, and Kirby, M. CT imaging with machine learning for predicting progression to COPD in individuals at risk. Chest. (2023) 164:1139–49. doi: 10.1016/j.chest.2023.06.008
23. Moll, M, Qiao, D, Regan, EA, Hunninghake, GM, Make, BJ, Tal-Singer, R, et al. Machine learning and prediction of all-cause mortality in COPD. Chest. (2020) 158:952–64. doi: 10.1016/j.chest.2020.02.079
24. Shimizu, K, Tanabe, N, Tho, NV, Suzuki, M, Makita, H, Sato, S, et al. Per cent low attenuation volume and fractal dimension of low attenuation clusters on CT predict different long-term outcomes in COPD. Thorax. (2020) 75:116–22. doi: 10.1136/thoraxjnl-2019-213525
25. Celli, BR, Cote, CG, Marin, JM, Casanova, C, Montes de Oca, M, Mendez, RA, et al. The body-mass index, airflow obstruction, dyspnea, and exercise capacity index in chronic obstructive pulmonary disease. N Engl J Med. (2004) 350:1005–12. doi: 10.1056/NEJMoa021322
26. Sanchez-Salcedo, P, and de Torres, JP. BODE index: a good quality of life marker in chronic obstructive pulmonary disease patients. Archivos de bronconeumologia. (2015) 51:311–2. doi: 10.1016/j.arbres.2015.03.003
27. Ko, FW, Chan, KP, Hui, DS, Goddard, JR, Shaw, JG, Reid, DW, et al. Acute exacerbation of COPD. Respirology (Carlton, Vic). (2016) 21:1152–65. doi: 10.1111/resp.12780
28. Schroeder, JD, McKenzie, AS, Zach, JA, Wilson, CG, Curran-Everett, D, Stinson, DS, et al. Relationships between airflow obstruction and quantitative CT measurements of emphysema, air trapping, and airways in subjects with and without chronic obstructive pulmonary disease. AJR Am J Roentgenol. (2013) 201:W460–70. doi: 10.2214/AJR.12.10102
29. Negroni, D, Zagaria, D, Paladini, A, Falaschi, Z, Arcoraci, A, Barini, M, et al. COVID-19 CT scan lung segmentation: how we do it. J Digit Imaging. (2022) 35:424–31. doi: 10.1007/s10278-022-00593-z
30. Hofmanninger, J, Prayer, F, Pan, J, Röhrich, S, Prosch, H, and Langs, G. Automatic lung segmentation in routine imaging is primarily a data diversity problem, not a methodology problem. Eur Radiol Exp. (2020) 4:50. doi: 10.1186/s41747-020-00173-2
31. Viertel, M, Bock, C, Reich, M, Löser, S, and Plauth, M. Performance of CT-based low skeletal muscle index, low mean muscle attenuation, and bioelectric impedance derived low phase angle in the detection of an increased risk of nutrition related mortality. Clin Nutr. (2019) 38:2375–80. doi: 10.1016/j.clnu.2018.10.018
32. Huang, Y, Lu, Y, Huang, Y-M, Wang, M, Ling, W, Sui, Y, et al. Obesity in patients with COVID-19: a systematic review and meta-analysis. Metabolism. (2020) 113:154378. doi: 10.1016/j.metabol.2020.154378
33. Bear, DE, MacGowan, L, Elstad, M, Puthucheary, Z, Connolly, B, Wright, R, et al. Relationship between skeletal muscle area and density and clinical outcome in adults receiving Venovenous extracorporeal membrane oxygenation. Crit Care Med. (2021) 49:e350–9. doi: 10.1097/CCM.0000000000004827
34. Lee, MH, Zea, R, Garrett, JW, Graffy, PM, Summers, RM, and Pickhardt, PJ. Abdominal CT body composition thresholds using automated AI tools for predicting 10-year adverse outcomes. Radiology. (2023) 306:e220574. doi: 10.1148/radiol.220574
35. Xu, K, Khan, MS, Li, TZ, Gao, R, Terry, JG, Huo, Y, et al. AI body composition in lung Cancer screening: added value beyond lung Cancer detection. Radiology. (2023) 308:e222937. doi: 10.1148/radiol.222937
36. Franssen, FME, O'Donnell, DE, Goossens, GH, Blaak, EE, and Schols, AMWJ. Obesity and the lung: 5. Obesity COPD Thorax. (2008) 63:1110–7. doi: 10.1136/thx.2007.086827
37. Wouters, EFM . Obesity and metabolic abnormalities in chronic obstructive pulmonary disease. Ann Am Thorac Soc. (2017) 14:S389–94. doi: 10.1513/AnnalsATS.201705-371AW
38. Kisiel, MA, Arnfelt, O, Lindberg, E, Jogi, O, Malinovschi, A, Johannessen, A, et al. Association between abdominal and general obesity and respiratory symptoms, asthma and COPD. Results from the RHINE study. Respir Med. (2023) 211:107213. doi: 10.1016/j.rmed.2023.107213
39. Tolonen, A, Pakarinen, T, Sassi, A, Kyttä, J, Cancino, W, Rinta-Kiikka, I, et al. Methodology, clinical applications, and future directions of body composition analysis using computed tomography (CT) images: a review. Eur J Radiol. (2021) 145:109943. doi: 10.1016/j.ejrad.2021.109943
40. van Bakel, SIJ, Gietema, HA, Stassen, PM, Gosker, HR, Gach, D, van den Bergh, JP, et al. CT scan-derived muscle, but not fat, area independently predicts mortality in COVID-19. Chest. (2023) 164:314–22. doi: 10.1016/j.chest.2023.02.048
41. Celli, BR, Anderson, JA, Cowans, NJ, Crim, C, Hartley, BF, Martinez, FJ, et al. Pharmacotherapy and lung function decline in patients with chronic obstructive pulmonary disease. A systematic review. Am J Respir Crit Care Med. (2021) 203:689–98. doi: 10.1164/rccm.202005-1854OC
42. Marin, JM, Carrizo, SJ, Casanova, C, Martinez-Camblor, P, Soriano, JB, Agusti, AG, et al. Prediction of risk of COPD exacerbations by the BODE index. Respir Med. (2009) 103:373–8. doi: 10.1016/j.rmed.2008.10.004
Keywords: chronic obstructive pulmonary disease, image analysis, deep learning system, body composition, skeletal muscle
Citation: Wu J, Lu Y, Dong S, Wu L and Shen X (2024) Predicting COPD exacerbations based on quantitative CT analysis: an external validation study. Front. Med. 11:1370917. doi: 10.3389/fmed.2024.1370917
Edited by:
Dawei Yang, Fudan University, ChinaReviewed by:
Zhenzhen Xing, Peking University Third Hospital, ChinaLiyan Cui, Peking University Third Hospital, China
Copyright © 2024 Wu, Lu, Dong, Wu and Shen. This is an open-access article distributed under the terms of the Creative Commons Attribution License (CC BY). The use, distribution or reproduction in other forums is permitted, provided the original author(s) and the copyright owner(s) are credited and that the original publication in this journal is cited, in accordance with accepted academic practice. No use, distribution or reproduction is permitted which does not comply with these terms.
*Correspondence: Xiping Shen, c2hlbnhpcGluZzIwMjJAMTYzLmNvbQ==
†These authors have contributed equally to this work and share first authorship