 Tianyun Zheng
 Huaibin Sun2†
 Lei Yan
- 1Department of Urology, Qilu Hospital of Shandong University, Jinan, China
- 2Department of Organ Transplantation, Qilu Hospital of Shandong University, Jinan, China
Background: Despite previous literature exploring the factors influencing lower urinary tract symptoms (LUTS), few studies have examined the relationship between nutritional status and LUTS.
Objectives: The objective of this research was to evaluate the relationship between LUTS and Geriatric Nutritional Risk Index (GNRI) in middle-aged and older men.
Methods: We included 2,607 men in the NHANES 2005–2006 and 2007–2008 cycles for cross-sectional analysis. We screened for LUTS based on four specific questions on the relevant questionnaire. We calculated GNRI according to the relevant calculation formula and included other covariates. Multivariate logistic analysis using GNRI as the principal independent variable and adjusting for other covariates were used to determine the association with LUTS, nocturia, and daytime LUTS.
Results: According to the responses to the questionnaire, out of 2,607 eligible participants, 471 had LUTS, 906 had nocturia, and 819 had daytime LUTS. In the unadjusted regression model, LUTS (OR = 0.93, 95% CI = 0.91–0.96, p < 0.001), nocturia (OR = 0.90, 95% CI = 0.88–0.93, p < 0.001), and daytime LUTS (OR = 0.96, 95% CI = 0.94–0.99, p = 0.002) were significantly negatively associated with GNRI. After adjustment by adding covariates, LUTS (OR = 0.97,95% CI =0.94–0.99, p = 0.026) and nocturia (OR = 0.94, 95% CI =0.91–0.93, p < 0.001) were significantly negatively associated with GNRI.
Conclusion: Low GNRI was associated with the development of LUTS. In the prevention and treatment of LUTS, urologists should consider the impact of nutritional status on LUTS, and interventions for nutritional status may prevent and improve LUTS.
Introduction
Lower urinary tract symptoms (LUTS), as a common series of symptoms in men, are statistically 40 percent prevalent in men over 50, and even more than 60 percent prevalent in men over 60 (1). LUTS can seriously affect men’s physical and mental health (2, 3). Many studies have shown that LUTS are no less of a threat to men’s health than diabetes, cardiovascular disease, and other common chronic diseases (4, 5). In addition, previous research indicated a close association between LUTS and depression (6). LUTS not only affect patients’ daily life, but also places a heavy burden on health insurance systems throughout the country. In the United States, billions of dollars are spent annually on the treatment of LUTS (7, 8). Therefore, effective prevention and reasonable management of LUTS is a serious challenge for urologists.
Currently, it is widely accepted that LUTS are a series of symptoms caused by functional disorders such as benign prostatic hyperplasia (BPH), including dysuria, urgency, and frequency of urination (3). Although mechanical obstruction caused by BPH is the main cause of LUTS, many studies have also shown that obesity, diabetes, sleep disorders, and poor bowel habits also worsen LUTS (9–12). However, there is little literature discussing the relationship between LUTS and nutritional status.
Malnutrition is a principal problem for many middle-aged and older men, and poor nutritional status is strongly associated with numerous diseases (13, 14). In recent years, to evaluate nutritional status, many nutritional indicators have been invented to estimate. The Geriatric Nutritional Risk Index (GNRI) has become one of the mainstream indicators for identifying malnutrition in middle-aged and older people due to its simple calculation and easy availability of the required indicators (15). Numerous research confirmed that the GNRI is not only a good assessment of nutritional status, but also displays good performance in disease diagnosis and prognosis assessment, providing a reliable reference for urinary system disease diagnosis and treatment (16, 17). Recently, frailty has begun to be explored in various diseases. Frailty is often accompanied by malnutrition, which, in turn, can lead to symptoms of frailty such as muscle atrophy and decreased bone density (18). Bauer et al. noted that frailty exacerbates LUTS in a multicenter study (19). This suggests that nutritional status may have some effect on LUTS. Therefore, our research seeks to explore the potential association between LUTS and GRNI, providing nutritional insights for the prevention and management of LUTS.
Materials and methods
Study population origin and screening
The National Health and Nutrition Examination Survey (NHANES) is a comprehensive representative survey that collects multidimensional health information on children and adults. We included data from two cycles (2005–2006 and 2007–2008) because only these two cycles had detailed questionnaire data to assess LUTS. Since the age of the relevant questionnaire was defined as men over 40 years old, men over 40 years old who received the questionnaire were the group of our study. The detailed exclusion requirements were as follows: (1) Participants who did not answer all the questions in the questionnaire or refused to answer the questionnaire; (2) Participants whose height, weight, or albumin were not measured; (3) Participants with incomplete covariate data.
Evaluation of LUTS
The assessment of LUTS in this study was based on two questionnaires: “Kidney Conditions—Urology” and “Prostate Conditions.” We assessed symptoms based on the following four questions: (1) urinary hesitancy, “Have trouble starting to urinate?” (2) difficult to empty urine completely, “After urinating does bladder feel empty?” (3) nocturia, “How many times urinate in night.” (4) urinary frequency, “How often have urinary leakage.” Daytime LUTS was defined as participants answering yes to the first or second question, or leaking urine more than or equal to one. Nocturia was defined as participants urinating twice or more during the night. The full definition of LUTS is that a participant has two or more of the above four symptoms.
Definition of GNRI
According to the Lorentz formula, the ideal weight for men is calculated as follows: height (cm) – 100 – [(height – 150)/4]. The detailed GNRI calculation formula is as follows: GNRI = [41.7 × present weight (Kg)/ideal weight (Kg)] + [1.489 × serum albumin (g/L)]. When [present weight (Kg)/ideal weight (Kg)] ≥ 1, the ratio is considered equal to 1.
Collection and definition of other data
The relevant baseline information collected in this study is as follows: age, ethnicity, poverty income ratio (PIR), insurance, drinking status, smoking status, educational level, sleep disorder, comorbidity index, and diabetes. The comorbidity index is the sum of common chronic diseases, which includes cancer, congestive heart failure, hypertension, emphysema, congestive heart failure, and chronic bronchitis. We analyzed diabetes separately and did not include it in the comorbidity index. The comorbidity index was divided into four grades including 0, 1, 2, and more than 3. Smoking status was categorized as current, former, and never. Drinking status was categorized as current, former, and never. PIR less than 1 was considered poor and greater than or equal to 1 was considered non-poor. Smoking status was the categorical variable, and the full definition of smoking status was as follows: those who had smoked less than 100 cigarettes in their lifetime were defined as never, those who had smoked more than 100 cigarettes in their lifetime but were not current smokers were defined as former, and those who were still current smokers were defined as current. Drinking status was the categorical variable, and the full definition of drinking status was as follows: those who had fewer than 12 drinks in their lifetime were defined as never, those who had more than 12 drinks in their lifetime but had not consumed alcohol in the past 12 months were defined as former, and those who had consumed alcohol in the past 12 months were defined as current.
Statistical analysis strategy
In order to make the sample of the database nationally representative, NHANES uses a complex four-level probability sampling, including: counties, segments, households, and individuals. Specific subgroups were oversampled to ensure that sufficient population subgroups were included in the study and that estimates of health status indicators for specific subgroups were reliable and accurate. The NHANES uses sample weights and complex sampling methods to make the data of the participants more representative. Therefore, this study selects appropriate sample weights and uses an R package named “survey” to deal with complex sample design and weighted data. Quantitative data with normal distribution were displayed as mean (SD) and analyzed by t-test. The skew distribution data were represented by the median (IQR) and analyzed by the Mann–Whitney test. The classified data were represented by a percentage and analyzed by the Chi-square test. Unadjusted logistic regression analysis was performed first, and then adjusted logistic regression analysis with relevant covariates was performed to determine the relationship between the main variables and the outcome variables. When p < 0.05 was considered statistically significant, all statistical results were bilateral.
Results
Distribution of baseline data
Of the 2,607 participants included who met the screening requirements (Figure 1), 471 (18.07%) were found to have LUTS, 819 (31.42%) participants were found to have daytime LUTS, and 906 (34.75%) participants were found to have nocturia. GNRI (p < 0.001), age (p < 0.001), education level (p = 0.002), insurance status (p = 0.012), smoking status (p < 0.001), drinking status (p < 0.001), sleep disorders (p = 0.006), diabetes (p < 0.001), and comorbidity index (p < 0.001) were statistically different in both subgroups in the baseline data (Table 1).
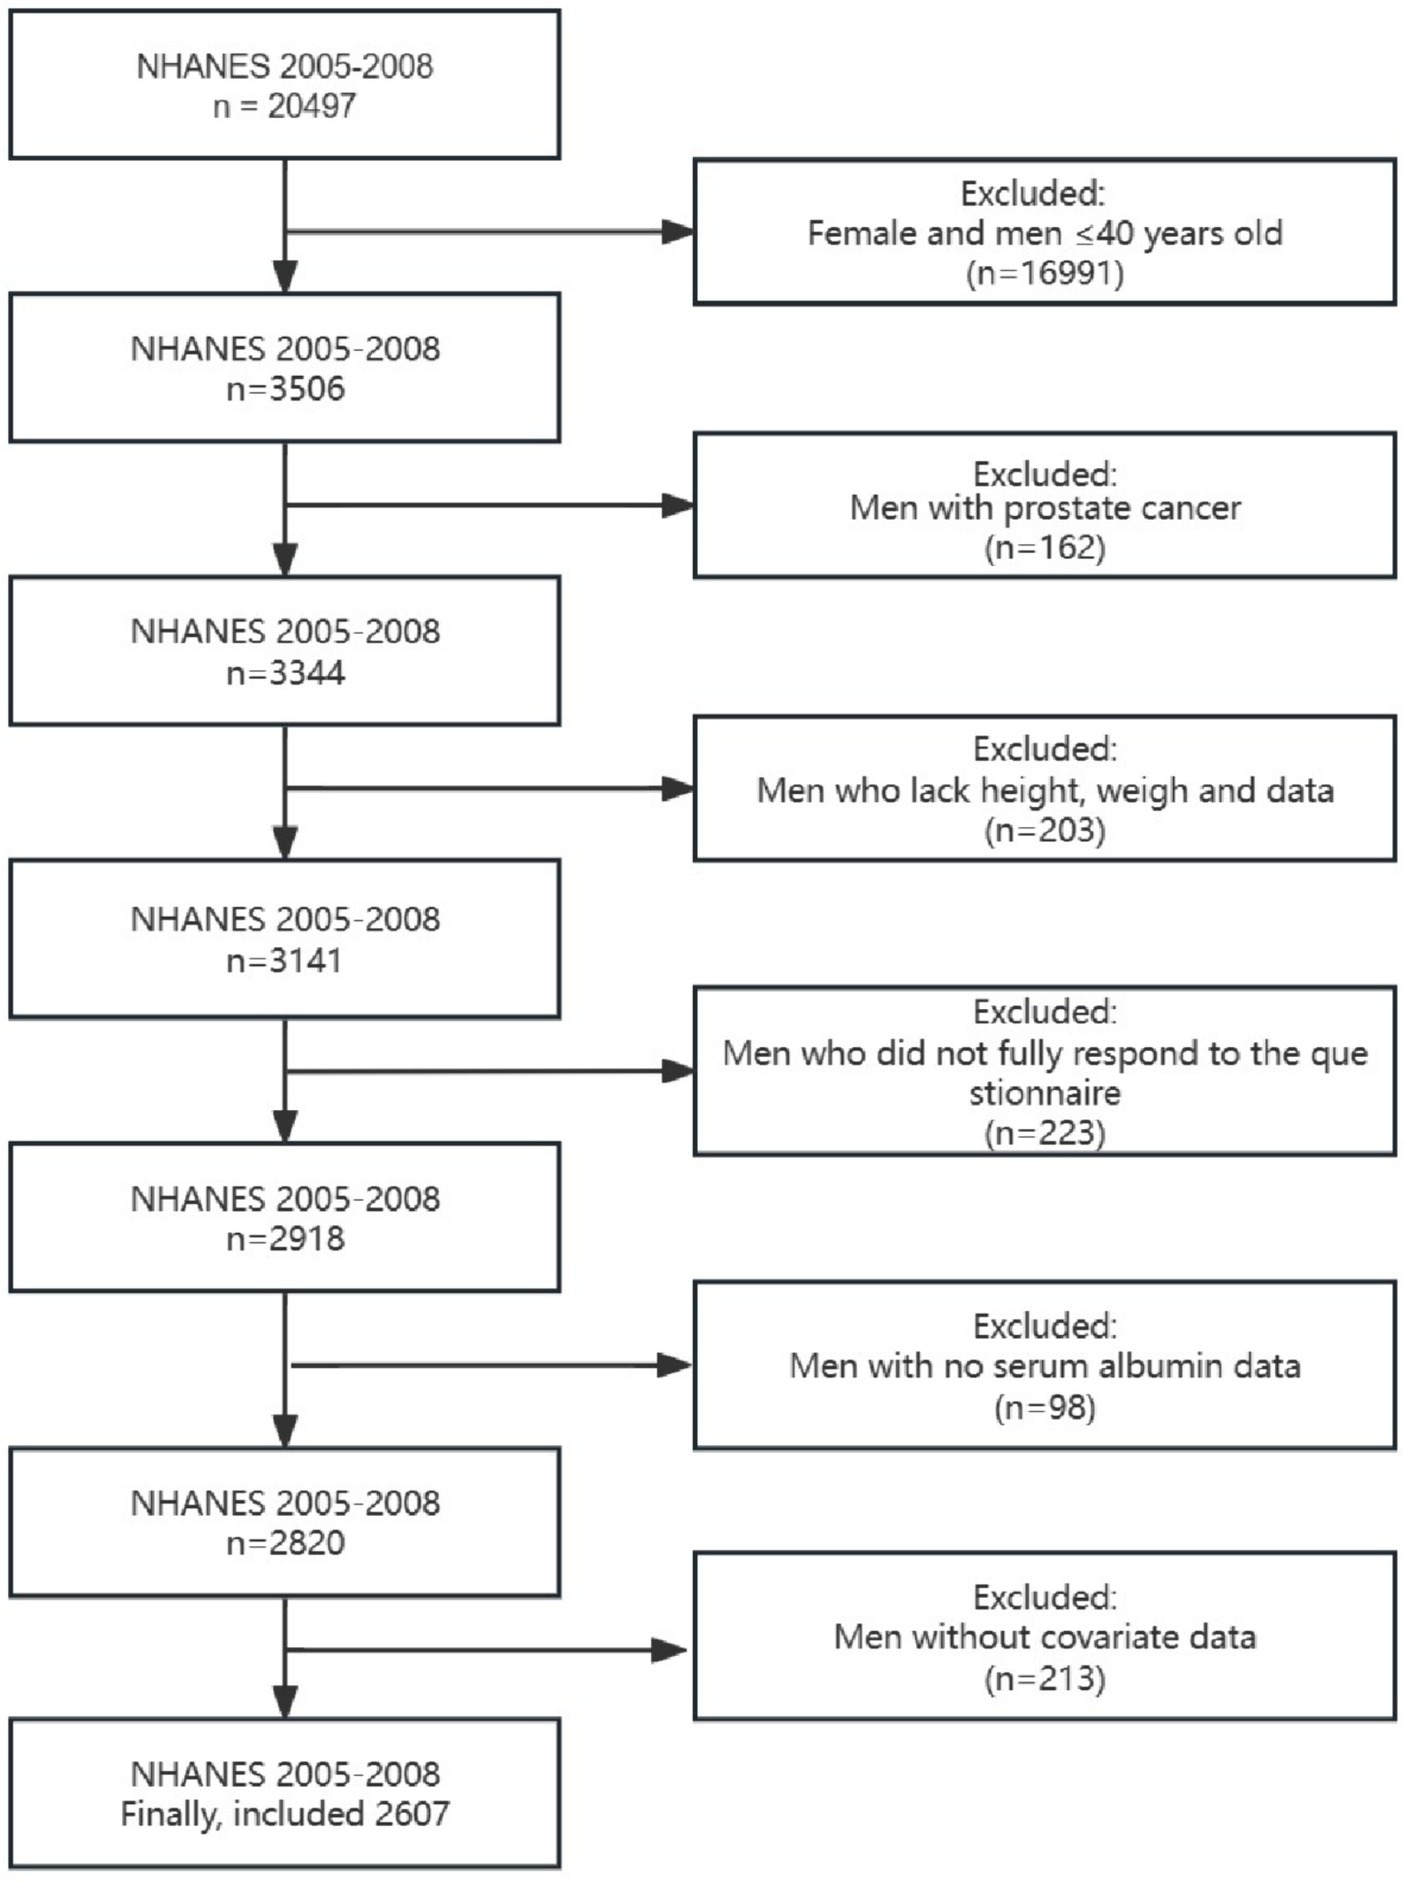
Figure 1. Flow chart for screening the final study population.
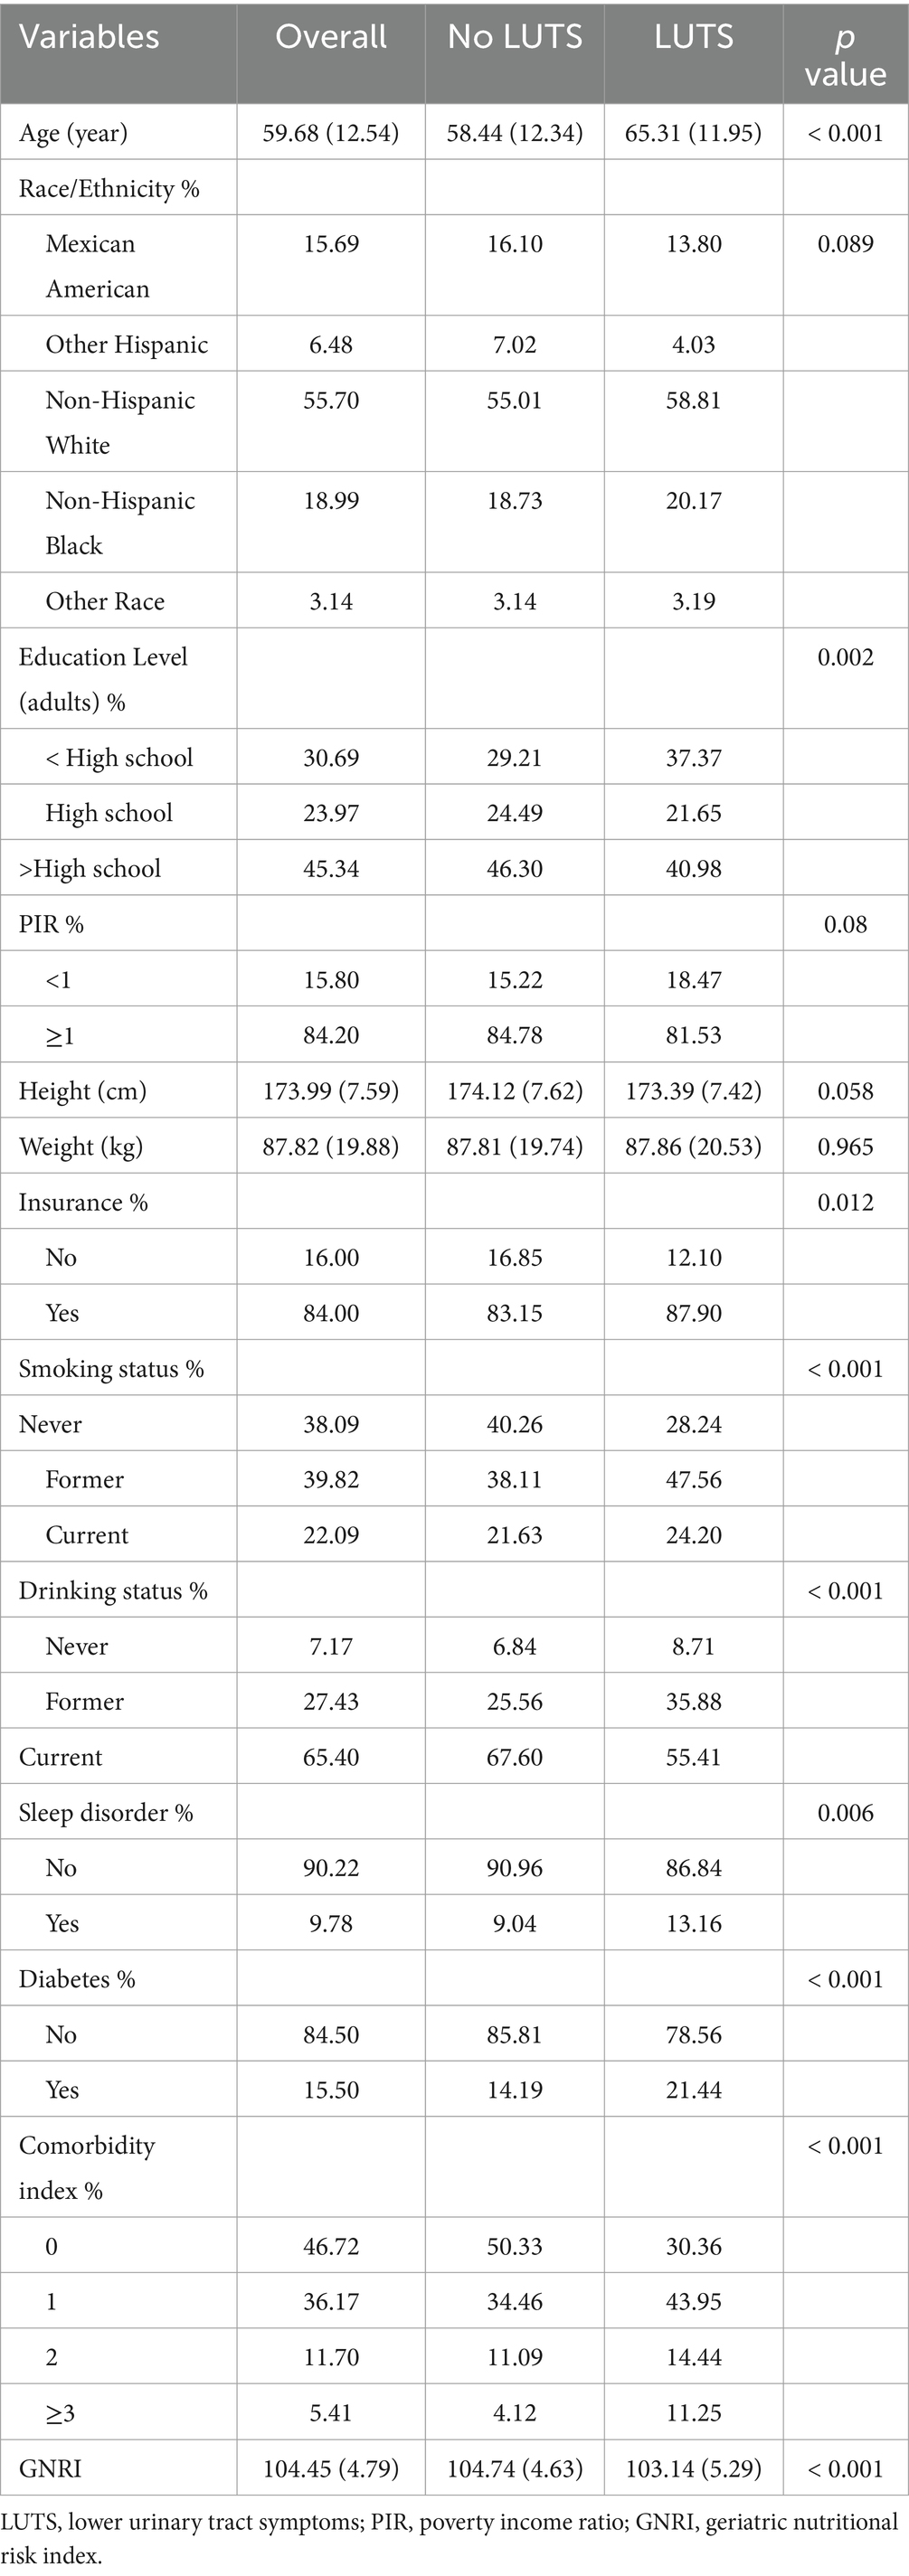
Table 1. Baseline data between participants with and without LUTS.
Association of GNRI with LUTS, nocturia, and daytime LUTS
GNRI was shown by unadjusted weighted logistic regression analysis to be significantly associated with LUTS (OR = 0.93, 95% CI = 0.91–0.96, p < 0.001), nocturia (OR = 0.90, 95% CI = 0.88–0.93, p < 0.001) and daytime LUTS (OR = 0.96, 95% CI = 0.94–0.99, p = 0.002). Weighted multivariate logistic analyses adjusted to control for the covariates of age, race, poverty index, education, insurance status, co-morbidity index, diabetes, drinking status, and smoking status found that the GNRI was significantly associated with LUTS (OR = 0.97,95% CI =0.94–0.99, p = 0.026) and nocturia (OR = 0.94, 95% CI =0.91–0.93, p < 0.001), and not significantly associated with daytime LUTS (p = 0.5) (Table 2). Among the covariates age, smoking status and comorbidity index were correlated with LUTS. And age, PIR, comorbidity index, smoking status and diabetes were correlated with nocturia (Table 3).
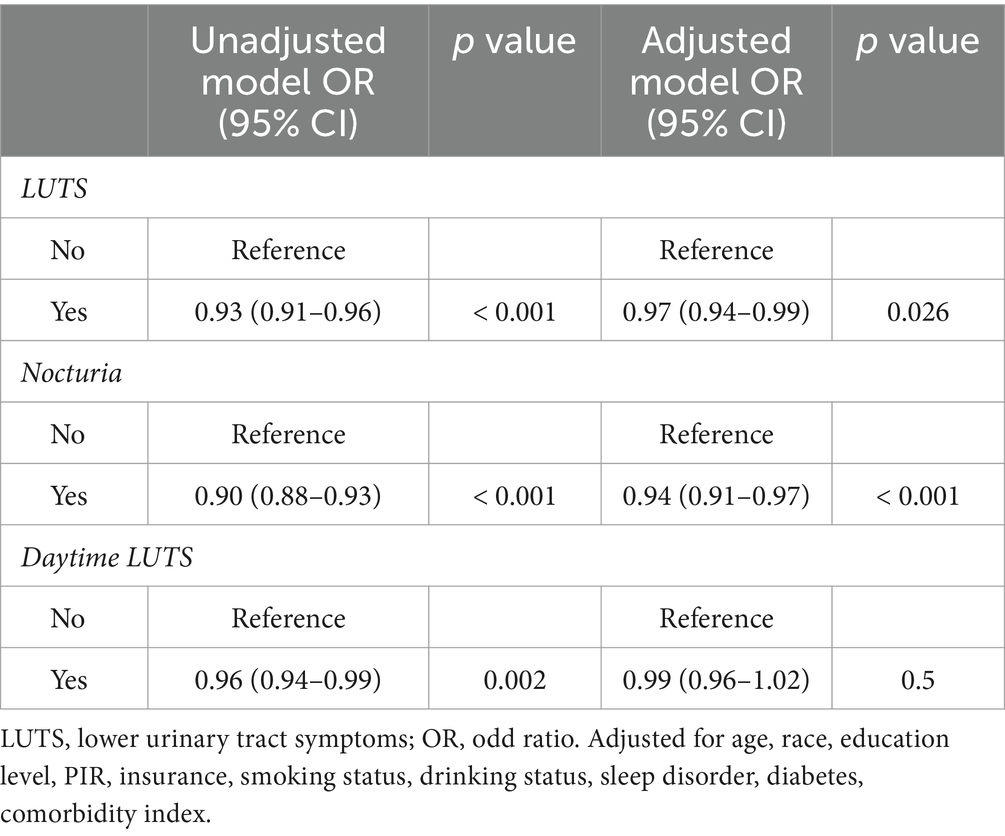
Table 2. Association of GNRI with LUTS, nocturia, and daytime LUTS.
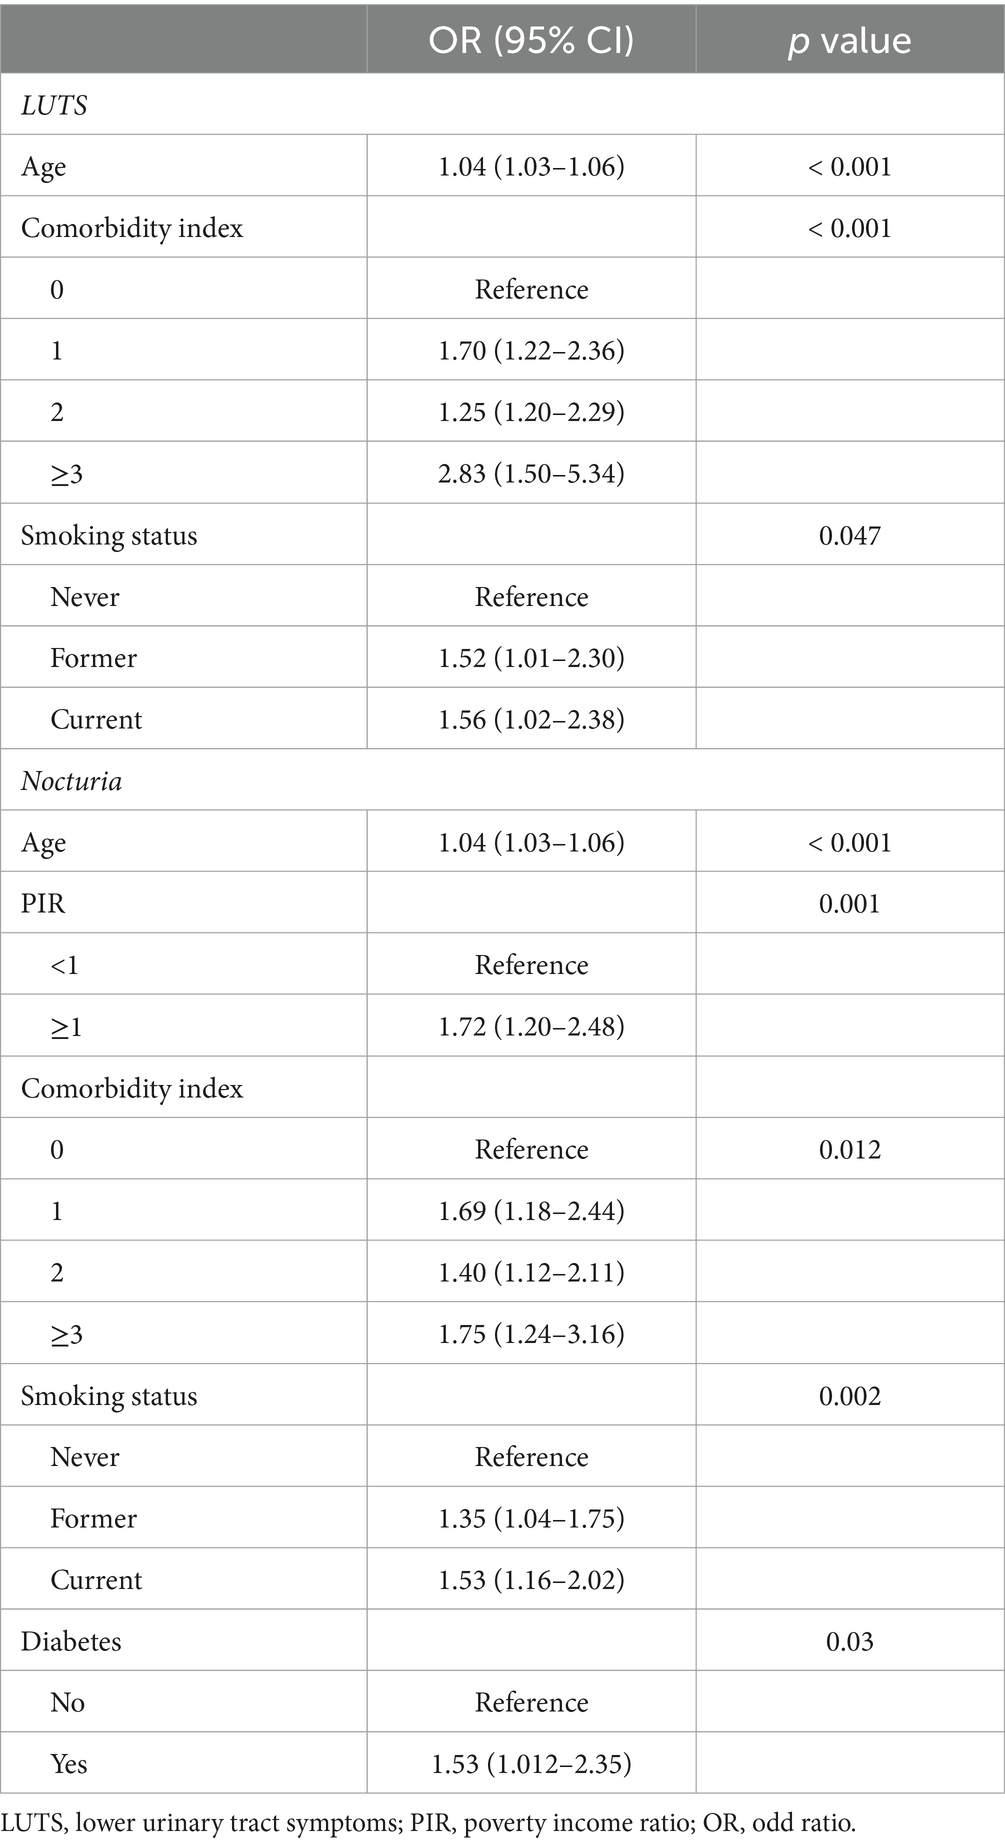
Table 3. The influence of covariates on LUTS.
Discussion
In the past few years, mechanical obstruction caused by BPH was the principal mechanism causing LUTS. Therefore, the treatment of LUTS by urologists in the past was mainly based on surgical treatment of BPH. However, with the increasing understanding of the etiology of LUTS among urologists, the etiology of LUTS is very complex, and BPH is not the only culprit of LUTS. Although there are many drugs to treat LUTS, the drug treatment process is long and requires good compliance, so many patients often give up halfway (20). Therefore, considering the distress and burden of LUTS for patients, the prevention of LUTS has gradually become the focus of urologists. Qin et al. explored the relationship between muscle mass and LUTS, demonstrating that frailty was positively correlated with LUTS (21). Many studies indicated that poor nutrition was closely related to frailty (22, 23). Malnutrition is recognized as a significant pathophysiological risk factor for frailty. Although there are many related comprehensive indicators or questionnaires, many older people cannot cooperate with the examination due to cognitive dysfunction and other reasons, which affect the credibility of the assessment. Our index requires fewer indicators, and these indicators are relatively easy to obtain and objective. Therefore, our research intended to seek the relationship between LUTS and GNRI, providing nutritional recommendations for the prevention and management of LUTS. GNRI is inversely associated with LUTS and is a protective factor, as shown in the present study, which proves that the probability of LUTS occurrence is lower under good nutritional status.
Before the advent of GNRI, the Nutritional Risk Index (NRI) was one of the indicators used to assess nutritional status. However, one study based on NHANES indicated that instrumental measurements in people older than 70 years were often inconsistent with self-reported weight (24). Therefore, the results of such calculations tend to be less reliable. GNRI avoids this error because it calculates ideal body weight in a way that makes the data more accurate. GRNI is widely adopted in the prevention and prognosis of cancer and other diseases due to its good evaluation ability (25–27). One study showed that GNRI in elderly patients was a simple and intuitive way to evaluate muscle function, especially grip strength (28). Takashi et al. analyzed data from diabetic patients and found that sarcopenia was significantly associated with low levels of GNRI (29). A previous study compared GNRI with other simple nutritional assessment indicators and found that GNRI had excellent evaluation ability compared with other indicators, especially for muscle mass and subcutaneous fat (30). Grip strength is an intuitive indicator of muscle strength and even nutritional status. One study noted a positive association between GNRI and grip strength in men (31). These studies show that the GNRI is an effective indicator of evaluating muscle mass and that a decline in muscle mass is one of the classic symptoms of frailty. Malnutrition is the initiating factor of muscle mass loss. Therefore, muscle mass appears to link nutritional status to frailty.
In a study analyzing the condition of LUTS in patients with systemic sclerosis, researchers found that muscle atrophy can lead to symptoms of overactive bladder (32). A large study showed significantly higher frailty scores among participants with nocturia than those without nocturia (33). Another study followed 247 patients with LUTS for five years and found that patients with higher frailty scores had worse LUTS symptoms over time. This study also demonstrates that LUTS, in turn, can exacerbate frailty (34). A community survey initiated by Japanese scholars indicates that oxidative stress indicators are closely related to nocturia (35). Oxidative stress activates inflammatory pathways and leads to increased degradation and decreased synthesis of proteins, which is the underlying mechanism of sarcopenia (36). In terms of inflammation and GNRI, as part of this index, albumin is associated with inflammation, so inflammation is also one of the causes (37). Besides, a study based on rural populations showed that older, frail people are vulnerable to suffering from urinary incontinence (38). Bauer et al. analyzed patients with LUTS in this center and pointed out that frailty should be considered in the initial diagnosis of LUTS (39).
The potential mechanism of malnutrition leading to LUTS may be frailty due to malnutrition. Malnutrition in middle-aged and elderly people is a major social challenge affecting population health. The imbalance between insufficient nutrient intake and energy expenditure leads to a negative nitrogen balance, which contribute to muscle atrophy followed by frail symptoms such as decreased physical function. And these are the classic signs of frailty. In addition, frail patients are often due to low muscle content and low metabolic levels, resulting in problems such as loss of appetite, exacerbating the problem of malnutrition. As a result, a vicious circle is created between poor nutrition and frailty. In addition, albumin is considered a reference index of nutritional level and inflammation (40). The activation of inflammatory pathways caused by oxidative stress will produce a large number of tumor necrosis factor and interleukin molecules, and these inflammatory factors will lead to the decrease of albumin levels (36, 41). This coincides with the relationship between LUTS and oxidative stress mentioned above. Increased vascular permeability caused by oxidative stress can also cause albumin to enter the extravascular tissue space. Therefore, oxidative stress and nutritional status are inextricably linked. European scholars have analyzed the etiology of sarcopenia and found that nutritional status plays a vital role in it. Bartali et al. (42) assessed the relationship between various indicators of frailty and malnutrition and showed that malnutrition directly leads to frailty. Elderly people with poor nutrition conditions tend to have weakened immune defenses and decreased bone mineral density, and studies have shown that such patients have significantly increased mortality (43, 44). Therefore, malnutrition directly and indirectly affects LUTS due to frailty and loss of muscle mass.
Among the covariates, age, comorbidities index, and smoking status had some influence on LUTS. As people get older, they become more likely to suffer from physical and mental illnesses, so frailty becomes more common, especially in nursing homes and hospitals. Therefore, for most diseases, age is a common factor that induces or aggravates the condition. Frail older adults tend to have multiple chronic illnesses. The large prospective study by Hanlon et al. not only affirmed the fact that there were more comorbidities in frail patients, but they also suggested that middle-aged adults with multiple chronic conditions tended to have higher mortality due to frailty (45). It proves that chronic diseases exacerbate frailty, which may also be the reason why chronic diseases affect LUTS. A large questionnaire survey from Japan showed a significantly increased risk of LUTS in men who were former or current smokers compared with men who had never smoked (46).
Combined with other research on LUTS, we realized that few research explored the relationship between LUTS and GNRI. The NHANES is a rigorous multistage cluster sampling survey design with weights assigned to each participant, so the data are well representative. In addition, the staff were professionally trained and examined the collected data, which made our study data more authentic and reliable. Our study also included covariates factors reported in other literature to influence LUTS, which made our research more comprehensive. However, our research still has some relevant limitations. First of all, due to the limitations of cross-sectional studies, the causality between GNRI and LUTS cannot be determined, and more in-depth research is needed to explore the specific mechanism. Secondly, although the questionnaire process is very rigorous, it is based on the subjective description of patients, so there is a certain degree of recall bias. Finally, although the sample capacity we included was relatively adequate, a larger study with more covariates is needed for further refinement.
Conclusion
Our study indicated an association between GNRI and an increased risk of LUTS and nocturia. For LUTS, urologists should consider the impact of frailty due to malnutrition on LUTS. Therefore, malnourished men should be alert to LUTS, and the management of male LUTS patients should be aware of the importance of improving nutritional status. This study provided a simple and effective nutritional index for urologists to prevent and manage LUTS and made more people aware of the impact of nutritional status on LUTS. In the future, the effectiveness of nutritional intervention in the prevention and alleviation of LUTS needs further research to uncover.
Data availability statement
Publicly available datasets were analyzed in this study. This data can be found at: https://www.cdc.gov/nchs/nhanes/index.htm.
Ethics statement
The studies involving humans were approved by the institutional review board of the National Center for Health Statistics. The studies were conducted in accordance with the local legislation and institutional requirements. The participants provided their written informed consent to participate in this study.
Author contributions
TZ: Conceptualization, Data curation, Formal analysis, Methodology, Writing – original draft. HS: Formal analysis, Methodology, Writing – review & editing. YT: Conceptualization, Writing – original draft. YZ: Software, Writing – original draft. LY: Supervision, Writing – review & editing.
Funding
The author(s) declare that no financial support was received for the research, authorship, and/or publication of this article.
Conflict of interest
The authors declare that the research was conducted in the absence of any commercial or financial relationships that could be construed as a potential conflict of interest.
Publisher’s note
All claims expressed in this article are solely those of the authors and do not necessarily represent those of their affiliated organizations, or those of the publisher, the editors and the reviewers. Any product that may be evaluated in this article, or claim that may be made by its manufacturer, is not guaranteed or endorsed by the publisher.
References
1. Berry, SJ, Coffey, DS, Walsh, PC, and Ewing, LL. The development of human benign prostatic hyperplasia with age. J Urol. (1984) 132:474–9. doi: 10.1016/S0022-5347(17)49698-4
2. Breyer, BN, Kenfield, SA, Blaschko, SD, and Erickson, BA. The association of lower urinary tract symptoms, depression and suicidal ideation: data from the 2005-2006 and 2007-2008 National Health and nutrition examination survey. J Urol. (2014) 191:1333–9. doi: 10.1016/j.juro.2013.12.012
3. Gratzke, C, Bachmann, A, Descazeaud, A, Drake, MJ, Madersbacher, S, Mamoulakis, C, et al. EAU guidelines on the assessment of non-neurogenic male lower urinary tract symptoms including benign prostatic obstruction. Eur Urol. (2015) 67:1099–109. doi: 10.1016/j.eururo.2014.12.038
4. Robertson, C, Link, CL, Onel, E, Mazzetta, C, Keech, M, Hobbs, R, et al. The impact of lower urinary tract symptoms and comorbidities on quality of life: the BACH and UREPIK studies. BJU Int. (2007) 99:347–54. doi: 10.1111/j.1464-410X.2007.06609.x
5. Welch, G, Weinger, K, and Barry, MJ. Quality-of-life impact of lower urinary tract symptom severity: results from the health professionals follow-up study. Urology. (2002) 59:245–50. doi: 10.1016/S0090-4295(01)01506-0
6. Zuluaga, L, Caicedo, JI, Mogollón, MP, Santander, J, Bravo-Balado, A, Trujillo, CG, et al. Anxiety and depression in association with lower urinary tract symptoms: results from the COBaLT study. World J Urol. (2023) 41:1381–8. doi: 10.1007/s00345-023-04351-w
7. Bavendam, TG, Norton, JM, Kirkali, Z, Mullins, C, Kusek, JW, Star, RA, et al. Advancing a comprehensive approach to the study of lower urinary tract symptoms. J Urol. (2016) 196:1342–9. doi: 10.1016/j.juro.2016.05.117
8. Welliver, C, Feinstein, L, Ward, JB, Fwu, C-W, Kirkali, Z, Bavendam, T, et al. Urologic diseases in America project. Trends in lower urinary tract symptoms associated with benign prostatic hyperplasia, 2004 to 2013: the urologic diseases in America project. J Urol. (2020) 203:171–8. doi: 10.1097/JU.0000000000000499
9. Helfand, BT, KT, MV, Meleth, S, Sharp, V, Foster, H, Naslund, M, et al. The relationship between lower urinary tract symptom severity and sleep disturbance in the CAMUS trial. J Urol. (2011) 185:2223–8. doi: 10.1016/j.juro.2010.12.082
10. Thurmon, KL, Breyer, BN, and Erickson, BA. Association of bowel habits with lower urinary tract symptoms in men: findings from the 2005-2006 and 2007-2008 National Health and nutrition examination survey. J Urol. (2013) 189:1409–14. doi: 10.1016/j.juro.2012.10.008
11. Tam, CA, Helfand, BT, and Erickson, BA. The relationship between diabetes, diabetes severity, diabetes biomarkers, and the presence of lower urinary tract symptoms: findings from the National Health and nutrition examination survey. Urology. (2017) 105:141–8. doi: 10.1016/j.urology.2017.03.040
12. Chilaka, C, Toozs-Hobson, P, and Chilaka, V. Pelvic floor dysfunction and obesity. Best Pract Res Clin Obstet Gynaecol. (2023) 90:102389. doi: 10.1016/j.bpobgyn.2023.102389
13. Elia, M . Defining, recognizing, and reporting malnutrition. Int J Low Extrem Wounds. (2017) 16:230–7. doi: 10.1177/1534734617733902
14. Norman, K, Haß, U, and Pirlich, M. Malnutrition in older adults-recent advances and remaining challenges. Nutrients. (2021) 13:2764. doi: 10.3390/nu13082764
15. Cereda, E, and Pedrolli, C. The use of the geriatric nutritional risk index (GNRI) as a simplified nutritional screening tool. Am J Clin Nutr. (2008) 87:1966–7. doi: 10.1093/ajcn/87.6.1966
16. Miao, S, Bao, C, Zhang, Y, Wang, L, Jin, X, Huang, B, et al. Associations of the geriatric nutritional risk index with high risk for prostate cancer: a cross-sectional study. Nutrition. (2023) 115:112164. doi: 10.1016/j.nut.2023.112164
17. Maenosono, R, Fukushima, T, Kobayashi, D, Matsunaga, T, Yano, Y, Taniguchi, S, et al. Unplanned hemodialysis initiation and low geriatric nutritional risk index scores are associated with end-stage renal disease outcomes. Sci Rep. (2022) 12:11101. doi: 10.1038/s41598-022-14123-y
18. Wei, K, Nyunt, MSZ, Gao, Q, Wee, SL, and Ng, T-P. Frailty and malnutrition: related and distinct syndrome prevalence and association among community-dwelling older adults: Singapore longitudinal ageing studies. J Am Med Dir Assoc. (2017) 18:1019–28. doi: 10.1016/j.jamda.2017.06.017
19. Bauer, SR, McCulloch, CE, Cawthon, PM, Ensrud, KE, Suskind, AM, Newman, JC, et al. Longitudinal associations between concurrent changes in phenotypic frailty and lower urinary tract symptoms among older men. J Frailty Aging. (2023) 12:117–25. doi: 10.14283/jfa.2022.33
20. Cindolo, L, Pirozzi, L, Fanizza, C, Romero, M, Tubaro, A, Autorino, R, et al. Drug adherence and clinical outcomes for patients under pharmacological therapy for lower urinary tract symptoms related to benign prostatic hyperplasia: population-based cohort study. Eur Urol. (2015) 68:418–25. doi: 10.1016/j.eururo.2014.11.006
21. Qin, Z, Zhao, J, Li, J, Yang, Q, Geng, J, Liao, R, et al. Low lean mass is associated with lower urinary tract symptoms in US men from the 2005-2006 national health and nutrition examination survey dataset. Aging (Albany NY). (2021) 13:21421–34. doi: 10.18632/aging.203480
22. Ni Lochlainn, M, Cox, NJ, Wilson, T, Hayhoe, RPG, Ramsay, SE, Granic, A, et al. Nutrition and frailty: opportunities for prevention and treatment. Nutrients. (2021) 13:2349. doi: 10.3390/nu13072349
23. Pérez-Ros, P, Vila-Candel, R, López-Hernández, L, and Martínez-Arnau, FM. Nutritional status and risk factors for frailty in community-dwelling older people: a cross-sectional study. Nutrients. (2020) 12:1041. doi: 10.3390/nu12041041
24. Kuczmarski, MF, Kuczmarski, RJ, and Najjar, M. Effects of age on validity of self-reported height, weight, and body mass index: findings from the third National Health and nutrition examination survey, 1988-1994. J Am Diet Assoc. (2001) 101:28–34. doi: 10.1016/S0002-8223(01)00008-6
25. Fan, Y, He, L, Zhou, Y, and Man, C. Predictive value of geriatric nutritional risk index in patients with coronary artery disease: a Meta-analysis. Front Nutr. (2021) 8:736884. doi: 10.3389/fnut.2021.736884
26. Nakagawa, N, Maruyama, K, and Hasebe, N. Utility of geriatric nutritional risk index in patients with chronic kidney disease: a Mini-review. Nutrients. (2021) 13:3688. doi: 10.3390/nu13113688
27. Lidoriki, I, Schizas, D, Frountzas, M, Machairas, N, Prodromidou, A, Kapelouzou, A, et al. GNRI as a prognostic factor for outcomes in Cancer patients: a systematic review of the literature. Nutr Cancer. (2021) 73:391–403. doi: 10.1080/01635581.2020.1756350
28. Cereda, E, and Vanotti, A. Short dietary assessment improves muscle dysfunction identification by geriatric nutritional risk index in uncomplicated institutionalised patients over 70 years old. Clin Nutr. (2008) 27:126–32. doi: 10.1016/j.clnu.2007.09.006
29. Takahashi, F, Hashimoto, Y, Kaji, A, Sakai, R, Kawate, Y, Okamura, T, et al. Association between geriatric nutrition risk index and the presence of sarcopenia in people with type 2 diabetes mellitus: a cross-sectional study. Nutrients. (2021) 13:3729. doi: 10.3390/nu13113729
30. Abd Aziz, NAS, Mohd Fahmi Teng, NI, and Kamarul, ZM. Geriatric nutrition risk index is comparable to the mini nutritional assessment for assessing nutritional status in elderly hospitalized patients. Clin Nutr ESPEN. (2019) 29:77–85. doi: 10.1016/j.clnesp.2018.12.002
31. Do, JY, and Kang, SH. Sex difference in the association among nutrition, muscle mass, and strength in peritoneal dialysis patients. Sci Rep. (2022) 12:17900. doi: 10.1038/s41598-022-22722-y
32. Pacini, G, Paolino, S, Trombetta, AC, Goegan, F, Pizzorni, C, Alessandri, E, et al. Lower urinary tract symptoms in systemic sclerosis: a detailed investigation. Rheumatology (Oxford). (2020) 59:1464–324. doi: 10.1093/rheumatology/kez601
33. Soma, O, Hatakeyama, S, Imai, A, Matsumoto, T, Hamano, I, Fujita, N, et al. Relationship between frailty and lower urinary tract symptoms among community-dwelling adults. Low Urin Tract Symptoms. (2020) 12:128–36. doi: 10.1111/luts.12292
34. Ozaki, Y, Hatakeyama, S, Imai, A, Songee, J, Soma, O, Ozaki, K, et al. Relationship between lower urinary tract symptoms and frailty. Int J Urol. (2023) 30:606–13. doi: 10.1111/iju.15187
35. Matsumoto, T, Hatakeyama, S, Imai, A, Tanaka, T, Hagiwara, K, Konishi, S, et al. Relationship between oxidative stress and lower urinary tract symptoms: results from a community health survey in Japan. BJU Int. (2019) 123:877–84. doi: 10.1111/bju.14535
36. Ziaaldini, MM, Marzetti, E, Picca, A, and Murlasits, Z. Biochemical pathways of sarcopenia and their modulation by physical exercise: a narrative review. Front Med (Lausanne). (2017) 4:167. doi: 10.3389/fmed.2017.00167
37. Gärtner, S, Kraft, M, Krüger, J, Vogt, LJ, Fiene, M, Mayerle, J, et al. Geriatric nutritional risk index correlates with length of hospital stay and inflammatory markers in older inpatients. Clin Nutr. (2017) 36:1048–53. doi: 10.1016/j.clnu.2016.06.019
38. Huang, C-Y, Lee, W-J, Lin, H-P, Chen, R-C, Lin, C-H, Peng, L-N, et al. Epidemiology of frailty and associated factors among older adults living in rural communities in Taiwan. Arch Gerontol Geriatr. (2020) 87:103986. doi: 10.1016/j.archger.2019.103986
39. Bauer, SR, Jin, C, Kamal, P, and Suskind, AM. Association between lower urinary tract symptoms and frailty in older men presenting for urologic care. Urology. (2021) 148:230–4. doi: 10.1016/j.urology.2020.09.041
40. Cabrerizo, S, Cuadras, D, Gomez-Busto, F, Artaza-Artabe, I, Marín-Ciancas, F, and Malafarina, V. Serum albumin and health in older people: review and meta analysis. Maturitas. (2015) 81:17–27. doi: 10.1016/j.maturitas.2015.02.009
41. Gatta, A, Verardo, A, and Bolognesi, M. Hypoalbuminemia. Intern Emerg Med. (2012) 7:S193–9. doi: 10.1007/s11739-012-0802-0
42. Bartali, B, Frongillo, EA, Bandinelli, S, Lauretani, F, Semba, RD, Fried, LP, et al. Low nutrient intake is an essential component of frailty in older persons. J Gerontol A Biol Sci Med Sci. (2006) 61:589–93. doi: 10.1093/gerona/61.6.589
43. Nakamura, T, Haraguchi, Y, Matsumoto, M, Ishida, T, and Momomura, S-I. Prognostic impact of malnutrition in elderly patients with acute myocardial infarction. Heart Vessel. (2022) 37:385–91. doi: 10.1007/s00380-021-01922-y
44. Wei, K, Nyunt, M-S-Z, Gao, Q, Wee, S-L, Yap, K-B, and Ng, T-P. Association of Frailty and Malnutrition with Long-term Functional and mortality outcomes among community-dwelling older adults: results from the Singapore longitudinal aging study 1. JAMA Netw Open. (2018) 1:e180650. doi: 10.1001/jamanetworkopen.2018.0650
45. Hanlon, P, Nicholl, BI, Jani, BD, Lee, D, McQueenie, R, and Mair, FS. Frailty and pre-frailty in middle-aged and older adults and its association with multimorbidity and mortality: a prospective analysis of 493 737 UK biobank participants. Lancet Public Health. (2018) 3:e323–32. doi: 10.1016/S2468-2667(18)30091-4
Keywords: lower urinary tract symptoms, geriatric nutritional risk index, nocturia, nutrition, frailty
Citation: Zheng T, Sun H, Tang Y, Zeng Y and Yan L (2024) Association of lower urinary tract symptoms and geriatric nutritional risk index in men: a cross-sectional study based on NHANES. Front. Med. 11:1356921. doi: 10.3389/fmed.2024.1356921
Edited by:
Tzvi Dwolatzky, Technion Israel Institute of Technology, IsraelReviewed by:
Luca Soraci, IRCCS INRCA, ItalyI. G. P. Suka Aryana, Udayana University, Indonesia
Li Luo, Sichuan University, China
Copyright © 2024 Zheng, Sun, Tang, Zeng and Yan. This is an open-access article distributed under the terms of the Creative Commons Attribution License (CC BY). The use, distribution or reproduction in other forums is permitted, provided the original author(s) and the copyright owner(s) are credited and that the original publication in this journal is cited, in accordance with accepted academic practice. No use, distribution or reproduction is permitted which does not comply with these terms.
*Correspondence: Lei, Yan, yanlei5309@126.com
†These authors have contributed equally to this work and share first authorship