 Hyun Lee1†
 Sang Hyuk Kim2†
 Sun-Kyung Lee1,3†
 Hayoung Choi4
 Sung Jun Chung1
 Dong Won Park1
 Tai Sun Park1
 Ji-Yong Moon1
 Tae-Hyung Kim1
 Sang-Heon Kim1Jang Won Sohn1Ho Joo Yoon1*
- 1Division of Pulmonary Medicine and Allergy, Department of Internal Medicine, Hanyang University College of Medicine, Seoul, Republic of Korea
- 2Division of Pulmonary, Allergy, and Critical Care Medicine, Department of Internal Medicine, Dongguk University Gyeongju Hospital, Dongguk University College of Medicine, Gyeongju, Republic of Korea
- 3Department of Mathematics, College of Natural Sciences, Hanyang University, Seoul, Republic of Korea
- 4Division of Pulmonary, Allergy, and Critical Care Medicine, Department of Internal Medicine, Hallym University Kangnam Sacred Heart Hospital, Hallym University College of Medicine, Seoul, Republic of Korea
Introduction: Air pollutants are increasingly recognized to affect long-term outcomes in patients with bronchiectasis. We aimed to figure out the association between air pollutants and the risk of healthcare utilization in patients with bronchiectasis.
Methods: Data for 1,029 subjects with bronchiectasis in Seoul were extracted. The air pollutants included particulate matter of 10 μm or less in diameter (PM10), particulate matter of 2.5 μm or less in diameter (PM2.5), sulfur dioxide (SO2), carbon monoxide (CO), ozone (O3), and nitrogen dioxide (NO2). The outcome was all-cause healthcare uses, defined as outpatient visit, emergency department visit, or hospitalization. The concentration–response curves between each air pollutant and relative risks for healthcare utilization were obtained.
Results: There were significant correlations between air pollutant concentrations and the risk of healthcare utilization, particularly for PM10, NO2, SO2, and CO. This risk was observed even at concentrations below the recommended safe thresholds for the general population. The slopes for the association between PM10 and NO2 and the risk of healthcare use showed a logarithmic growth pattern, with the steepest increase up to 30 μg/m3 and 0.030 parts per million (ppm), respectively. The curves for SO2 and CO showed an inverted U-shaped pattern, with a peak at 0.0045 ppm and a slow upward curve, respectively. No specific trends were observed for PM2.5 and O3 and the risk of healthcare use.
Discussion: Increased concentrations of PM10, NO2, SO2, and CO were associated with increased healthcare utilization in patients with bronchiectasis. For patients with bronchiectasis, there were no safety thresholds for those air pollutants, and even low levels of air pollutant exposure can negatively impact bronchiectasis outcomes.
Introduction
Non-cystic fibrosis bronchiectasis (hereafter referred to as bronchiectasis) is a chronic lung disease characterized by abnormal and permanent dilation of bronchi and respiratory symptoms (1). Once considered an orphan disease, the prevalence and disease burden of bronchiectasis have also been increasing worldwide (2).
In bronchiectasis management, prevention of exacerbation is key to reducing the disease burden (3). Bronchiectasis exacerbation is generally triggered by respiratory infection, but air pollution has been shown to increase the risk of bronchiectasis exacerbation (4, 5). For example, higher levels and acute fluctuations of air pollution were associated with an increased risk of bronchiectasis exacerbation (5). A recent study from China found that air pollution increased the risk of hospital admission in patients with bronchiectasis (6).
Air quality guidelines have been announced in many countries, including Korea, to protect people from the hazardous effects of air pollution (7). These guidelines establish safe thresholds for each air pollutant. However, it is not clear whether these safe thresholds are applicable to patients with bronchiectasis, as previous studies have primarily focused on the acute fluctuation of air pollutants and have not assessed safe thresholds of air pollutants for patients with bronchiectasis.
Therefore, this study aims to investigate the association between air pollutants and healthcare utilization in patients with bronchiectasis, with a focus on determining the safe thresholds for air pollutants in this population.
Materials and methods
Study population
The data source was the 2017 Health Insurance Review and Assessment Service, National Patient Sample (HIRA-NPS), which is nationally representative and open to the public for research purposes (8). The HIRA-NPS data are cross-sectional and consists of health insurance claim records accrued in the year. The database includes approximately 1,400,000 individuals each year, drawn from 3% stratified random sampling by age and sex of the population with claims records during the year. It also provides information on healthcare costs, consisting of payers’ amounts and patients’ out-of-pocket costs. Korea has a government-run mandatory national health security system; 97% of the population is enrolled in National Health Insurance and 3% in Medical Aid Programs (2, 9).
This study initially included all patients who were ≥20 years and used hospitals in Seoul, Korea, between 1 January 2017 and 31 December 2017 (n = 320,310). We restricted the patients to those who lived in Seoul because it allowed us to acquire more accurate air pollution data. We excluded two patients diagnosed with cystic fibrosis and 319,279 patients without bronchiectasis. Finally, 1,029 patients with bronchiectasis were included (Figure 1).
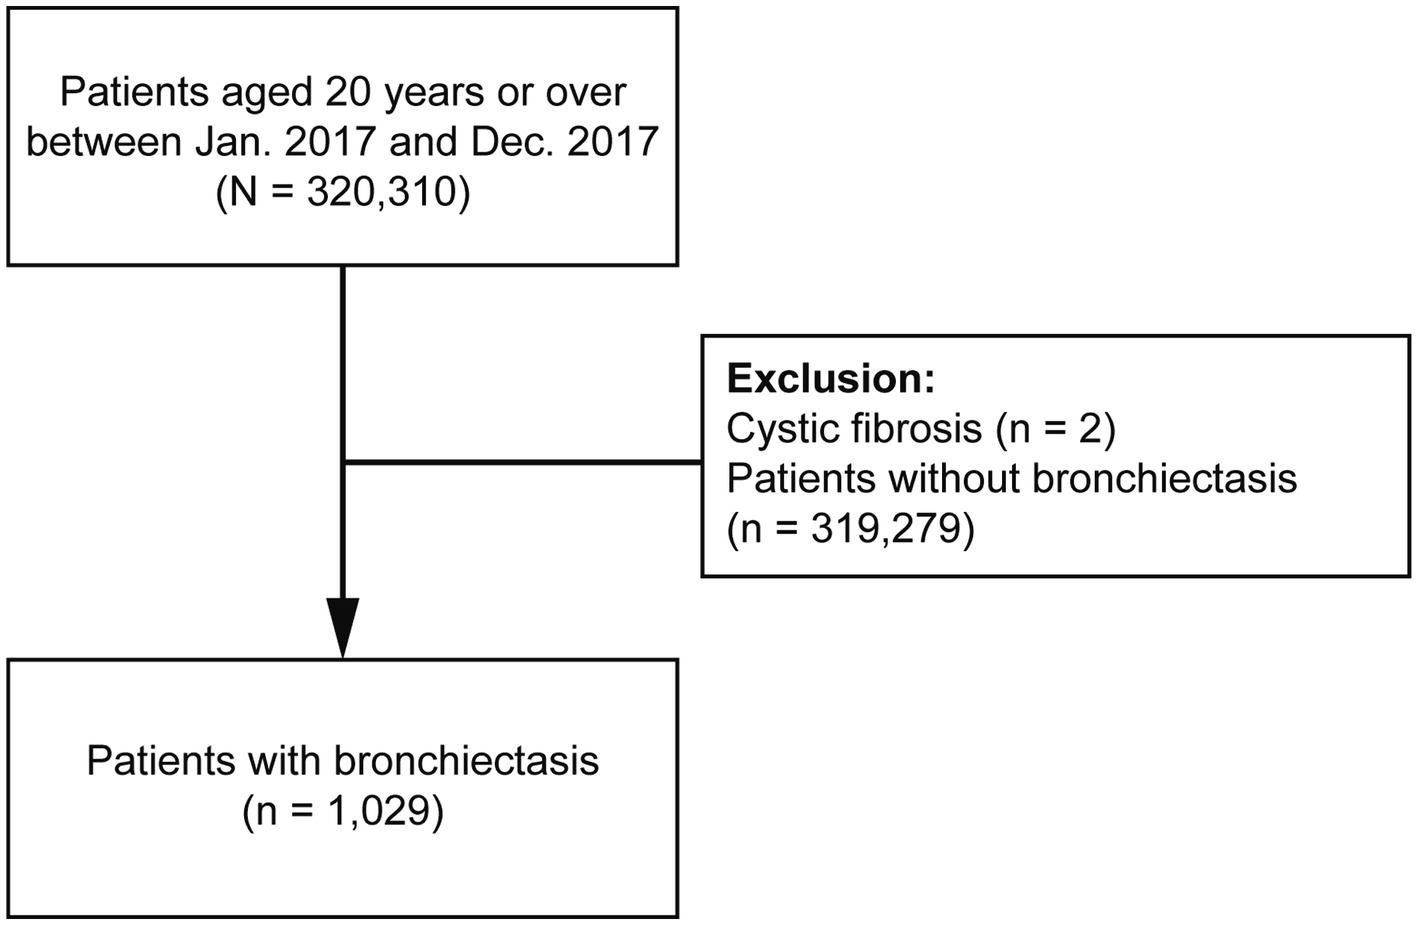
Figure 1. Flow chart of the study population.
Measurement: bronchiectasis and comorbidities
Bronchiectasis was defined by at least one claim under the 10th revision of the International Statistical Classification of Diseases and Related Health Problems (ICD-10) code J47 excluding E84 (cystic fibrosis) during the study period (2).
Comorbidities were defined using the following ICD-10 diagnosis codes: angina pectoris (I20), myocardial infarction (I21–I22, or I25.2), heart failure (I43, I50, I09.9, I11.0, I13.0, I13.2, I25.5, I42.0, I42.5–I42.9, or P29.0), peripheral vascular disease (I70–I71, I73.1, I73.8, I73.9, I77.1, I79.0, I79.2, K55.1, K55.8, K55.9, Z95.8, or Z95.9), cerebrovascular disease (G45–G46, I60–I69, or H34.0), dementia (F00–F03, F05.1, G30, or G31.1), asthma (J45–J46), chronic obstructive pulmonary disease (COPD) [J42–J44 except J43.0 (unilateral emphysema)], connective tissue disease (M05, M06, M31.5, M32–M34, M35.1, M35.3, or M36.0), peptic ulcer disease (K25–K28), liver disease (K70.3, K71.7, K73, K74.3–K74.6, K72.1, K72.9, K76.6, or K76.7), diabetes mellitus (DM) without complication (E10–E14), hemiplegia (G04.1, G11.4, G80.1, G80.2, G81–G82, G83.0–G83.4, or G83.9), and cancers (C00–C97) (2, 10). Cardiovascular disease was defined as angina pectoris, myocardial infarction, or heart failure. The Charlson comorbidity index (CCI) was calculated as previously reported (11).
Measurement: meteorological and air pollution data
Meteorological data for Seoul (latitude, 37.57° N) were obtained from the database of the Korea Meteorological Administration: 24 h mean temperature, relative humidity, and sea-level air pressure. Data on outdoor air pollution were obtained from Air Korea, the open database from the Ministry of the Environment (Korean government) (12). Daily mean concentrations were recorded at 25 observatory stations in Seoul during the study period (13, 14).
Air pollutants and air quality standards
The air pollutants included particulate matter of 10 μm or less in diameter (PM10), particulate matter of 2.5 μm or less in diameter (PM2.5), nitrogen dioxide (NO2), sulfur dioxide (SO2), ozone (O3), and carbon monoxide (CO). The air quality standards of Korea and the World Health Organization (WHO) are provided in Supplementary Table S1 (12, 15).
Study outcome
The main outcome of this study was all-cause healthcare uses in 2017, including outpatient department visits, emergency room visits, or hospitalization.
Statistical analysis
Data are presented as frequencies (percentages) for categorical variables. We evaluated the relative risk (RR) for increased healthcare utilization according to air pollution concentration using concentration–response curves with the lowest pollutant level as the reference. The generalized additive model (GAM) based on Poisson distribution was used to examine the association between air pollution and healthcare use. The smoothing splines with degrees of freedom included in GAM control the variations in the generalized linear model (GLM) equation. Degrees of freedom are determined by the smallest Akaike’s information criterion (AIC) value, which suggests the best statistical model fits (16). We used the natural cubic splines to adjust for nonlinear confounding variables of daily average temperature and seasonality with seven and four degrees of freedom, respectively.
Additionally, we included the special daily trends using a dummy variable to account for the effects of weekends and holidays on healthcare use. The daily average relative humidity was corrected by applying a linear function. The multivariable analysis, which includes two or more pollutants, was not conducted because of the significant correlation among air pollutants (Table 1). All statistical analyses were performed using SAS 9.4 (SAS Institute, Cary, NC, United States) and R 3.6.1 (R Foundation for Statistical Computing, Vienna, Austria).
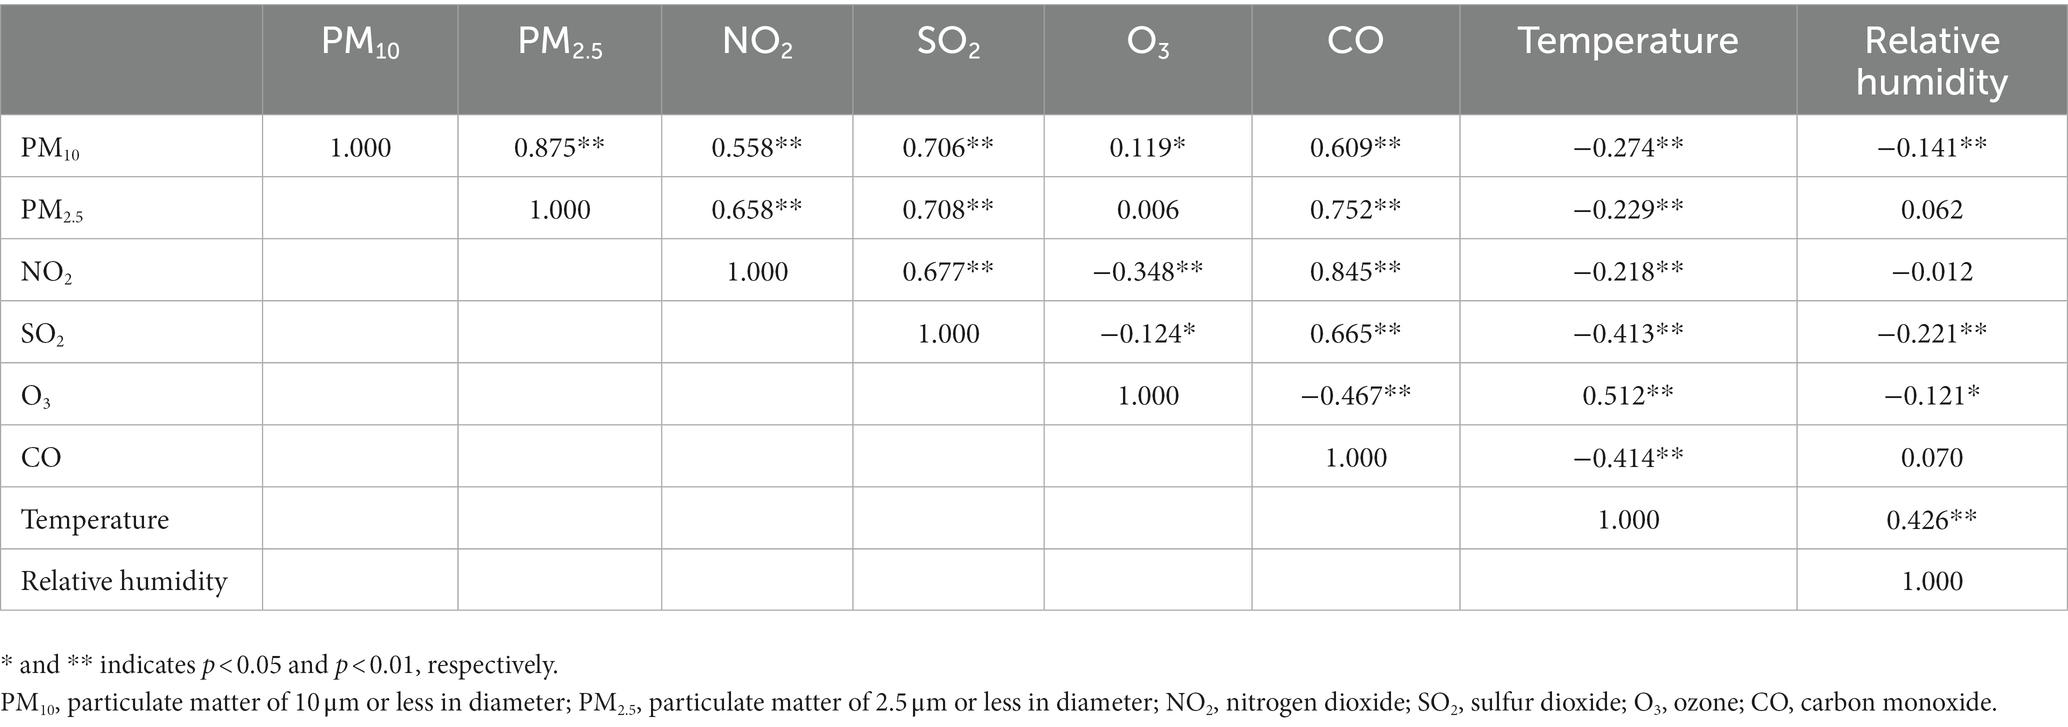
Table 1. Spearman correlation coefficients between concentrations of air pollutants in Seoul, Korea in 2017.
Results
Population, air pollutants, and metrological data
The baseline characteristics of the study population are presented in Table 2. The majority of patients were older than 60 years (67.9%), female (60.5%), and had self-employed health insurance (93.2%). Nearly three-fourths of patients had a CCI score ≥2 (76.2%). The most common comorbid condition was dyslipidemia (52.0%), followed by asthma (36.6%), COPD (34.5%), diabetes mellitus (25.7%), cardiovascular disease (15.2%), hypertension (14.4%), and cancers (10.4%). A total of 4.8% of patients had a history of pulmonary tuberculosis. Summary statistics for air pollutants and meteorological data during the study period are described in Supplementary Table S2.
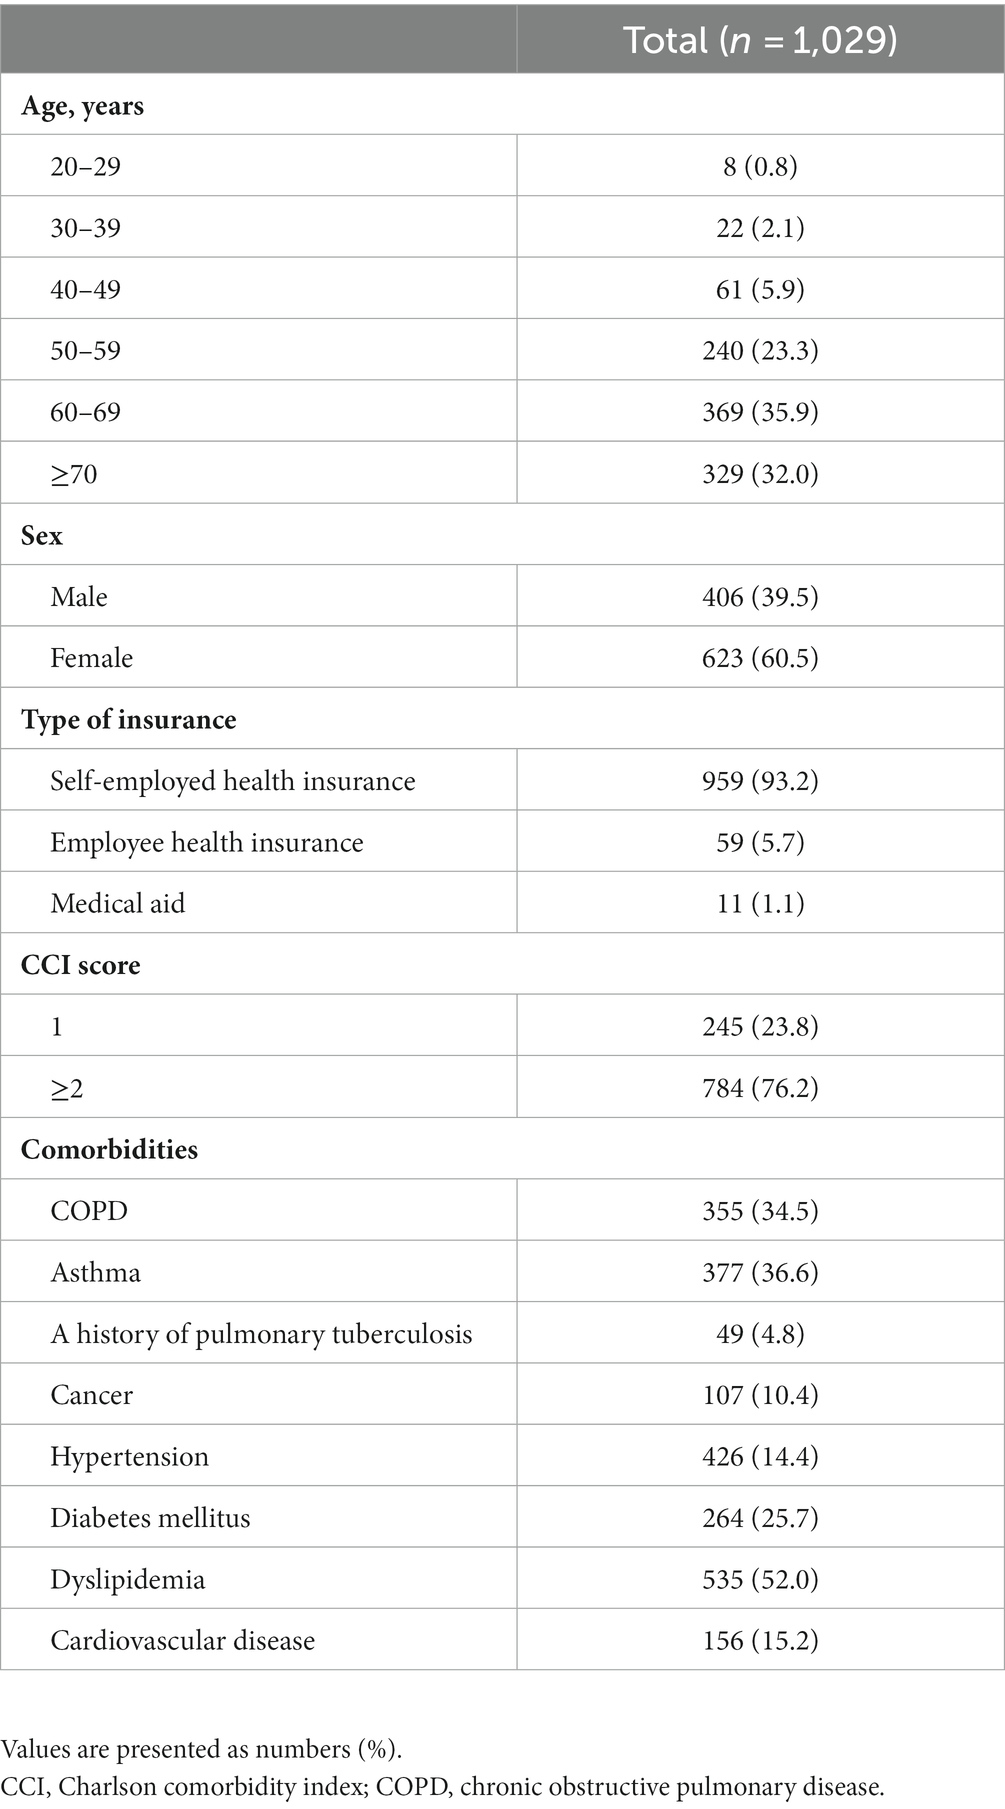
Table 2. Baseline characteristics of the study population.
Correlation between concentrations of air pollutants
There were significant correlations between six pollutants, except PM2.5 and O3 (Table 1). Particularly, strong correlations were found between the following pollutants: PM10–PM2.5, PM10–SO2, PM2.5–SO2, PM2.5–CO, and NO2–CO. Most of the associations between air pollutants showed positive correlations, except for O3, which showed a negative correlation with NO2, SO2, and CO. Temperature was negatively correlated with all air pollutants, except for O3.
Effects of air pollution on healthcare utilization
Figure 2 depicts concentration–response curves between the air pollutants and RR for healthcare utilization. There was a significant increase in RRs for healthcare utilization with increasing air pollutant concentration for PM10, NO2, SO2, and CO. Notably, NO2, SO2, and CO were associated with increased risk of healthcare utilization even below the recommended safe thresholds. The slopes for the association between PM10 and NO2 and the risk of healthcare utilization showed a logarithmic growth, with the steepest increase up to 30 μg/m3 and 0.030 parts per million (ppm), respectively. The curves for the association between SO2 and CO and healthcare utilization showed an inverted U shape with a peak at 0.0045 ppm and a slow upward curve, respectively. However, no specific trends were observed for the association between PM2.5 and O3 and the risk of healthcare utilization.
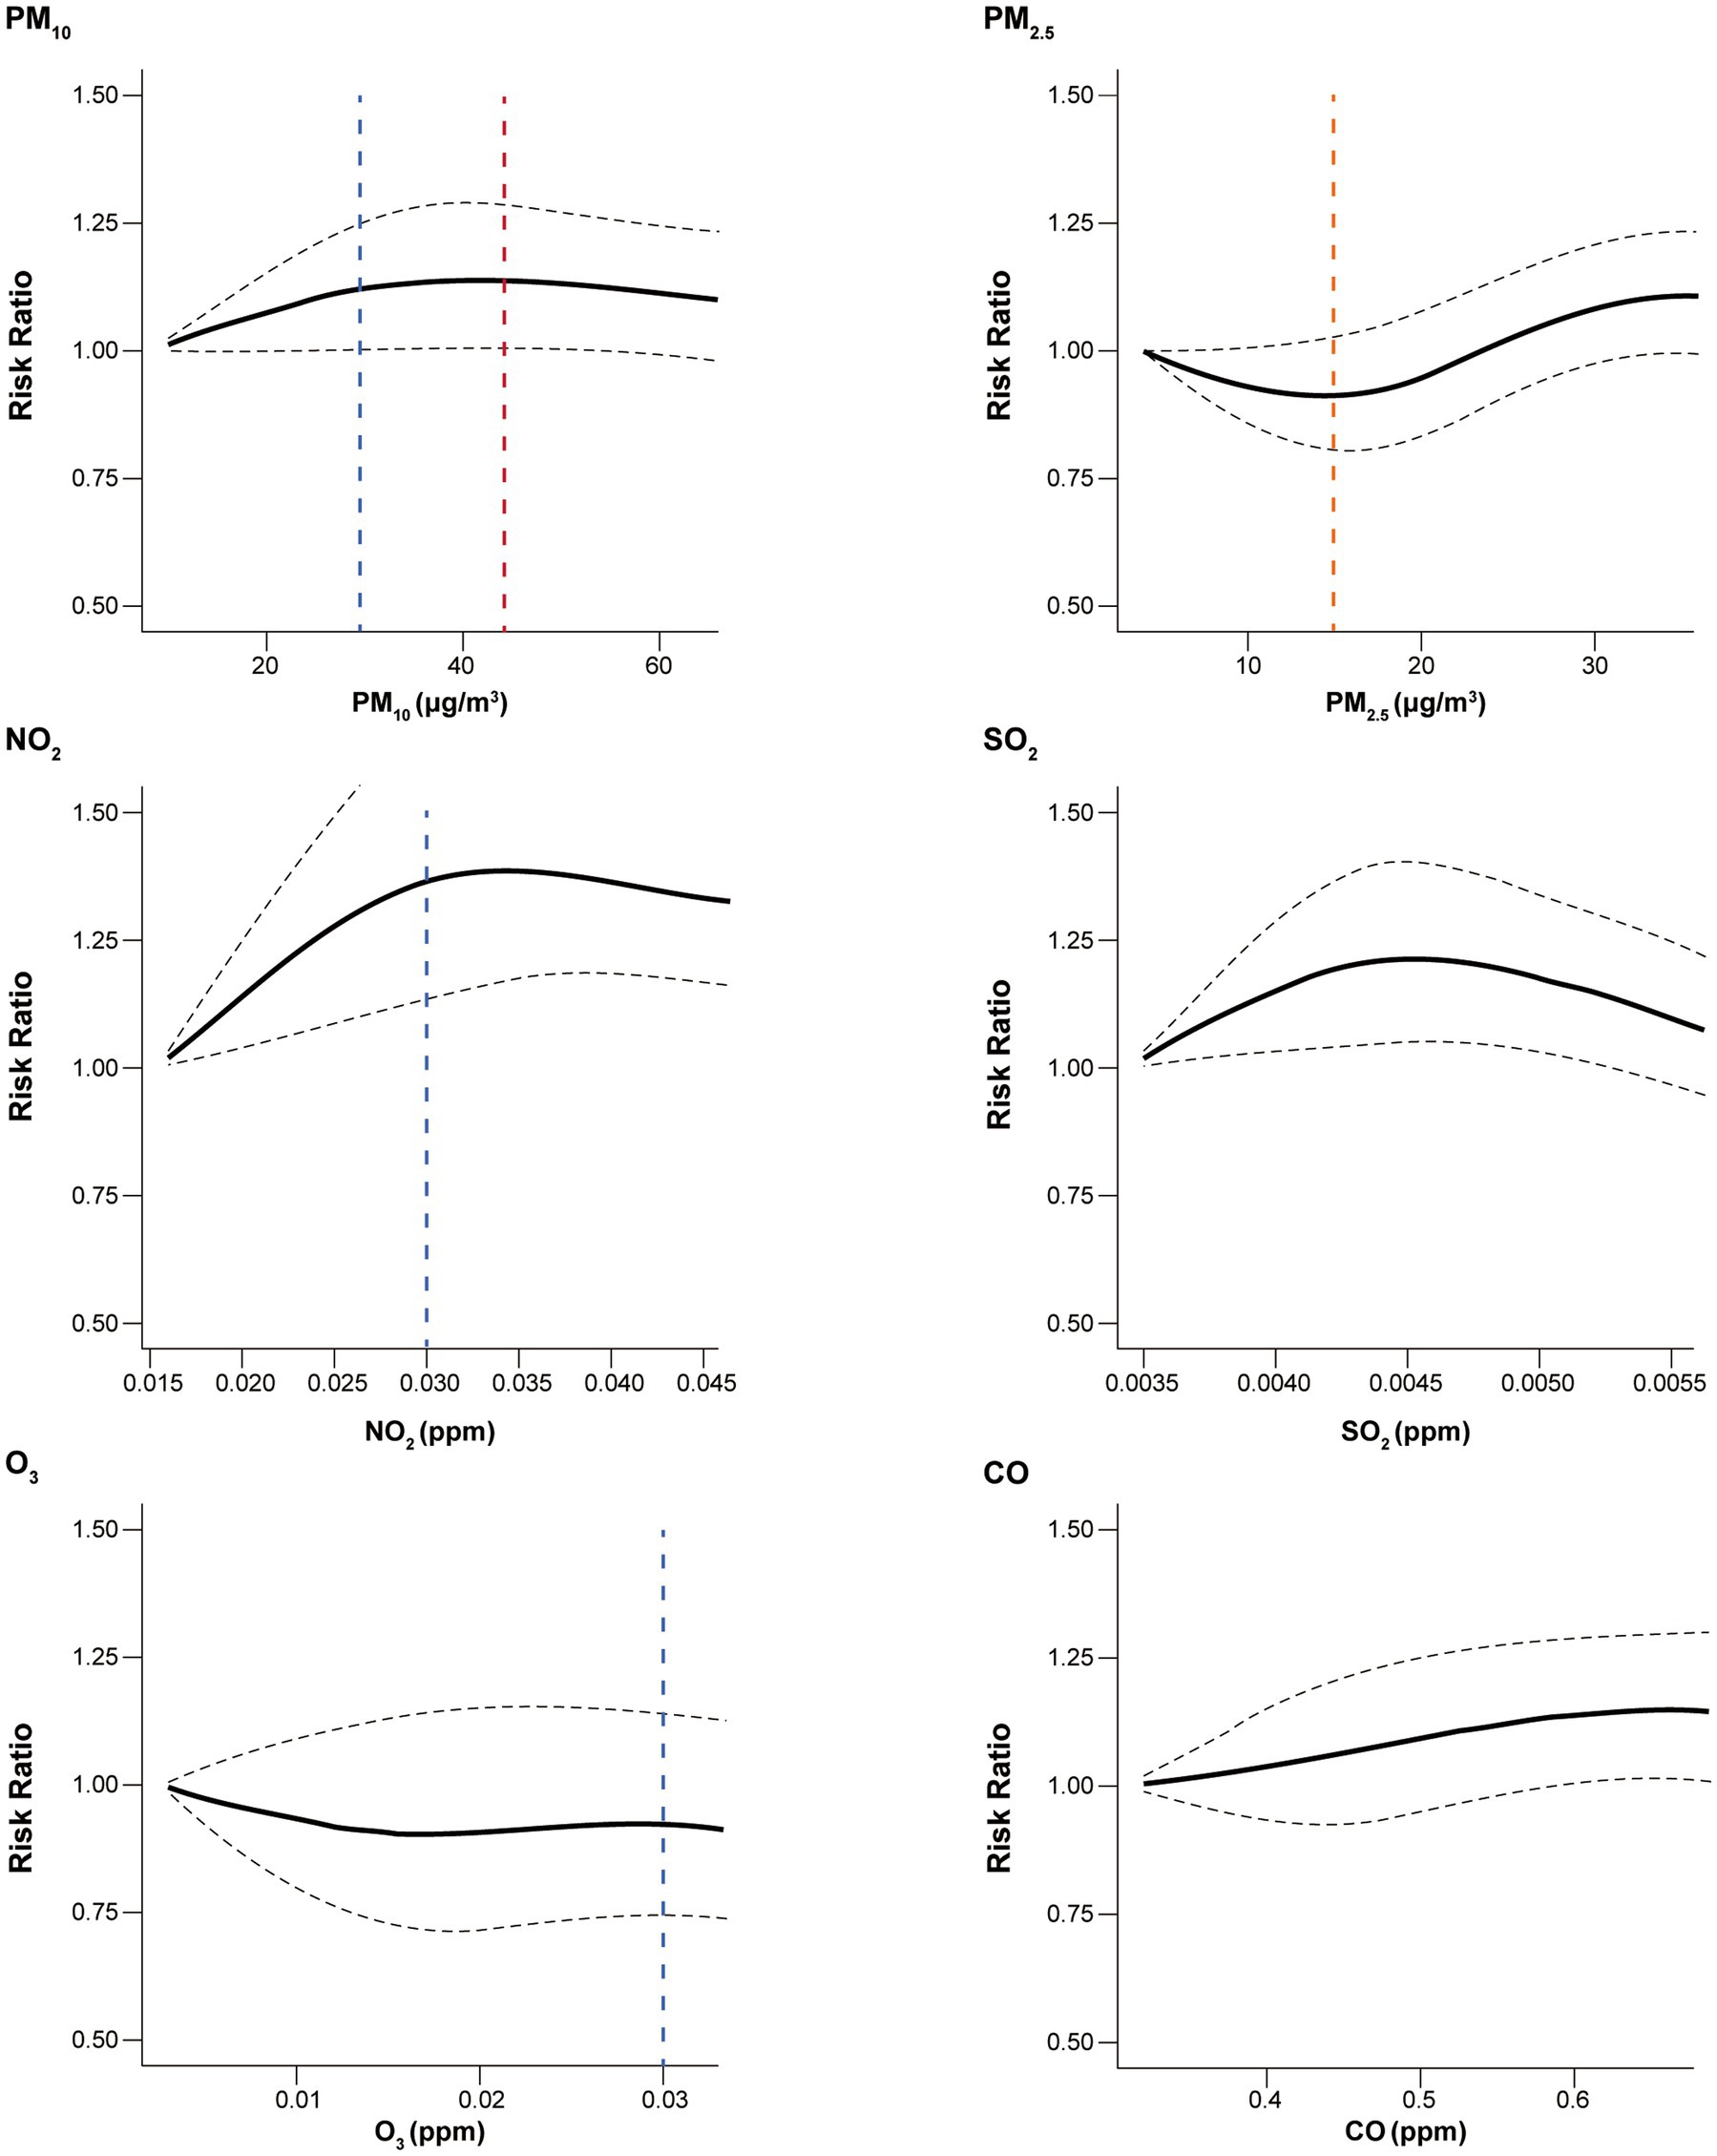
Figure 2. Concentration–response curves for the association between all-cause healthcare utilization and air pollutants. Black dashed line indicates 95% confidence interval. Blue, red, orange vertical dashed lines indicate, the Korean, WHO, and the shared threshold for good air quality, respectively. The safe thresholds for SO2 and CO were higher than observed values. PM10, particulate matter of 10 μm or less in diameter; PM2.5, particulate matter of 2.5 μm or less in diameter; NO2, nitrogen dioxide; SO2, sulfur dioxide; O3, ozone; CO, carbon monoxide; WHO, World Health Organization.
Discussion
In this population-based cohort study, PM10, NO2, SO2, and CO were associated with increased healthcare utilization in patients with bronchiectasis. Also, we found that healthcare utilization increased even levels below the safe thresholds for those air pollutants in a concentration-dependent manner. These results suggest that there are no safe thresholds for air pollutants in patients with bronchiectasis and that even low levels of exposure can negatively impact bronchiectasis.
Our findings that air pollution increases the risk of healthcare use in patients with bronchiectasis support previous studies (5, 6, 17). The potentially deleterious effects of air pollution on the prognosis of bronchiectasis were first reported by Goeminne and his colleagues (17). In their study, patients with bronchiectasis who lived near major roads were more likely to die than those who did not. In a subsequent study, the authors found that short-term changes in air pollution are associated with an increased risk of exacerbation of bronchiectasis regardless of subtype or severity of bronchiectasis (5). Recently, a population-based study in southern China found that the risk of hospitalization for bronchiectasis increased by 3.8%–6.7% as the interquartile range of air pollution increased (6).
Although there is limited scientific evidence, some plausible explanations exist for the association between air pollution and increased healthcare utilization in patients with bronchiectasis. First, the direct effects of air pollutants may cause bronchial constriction. High levels of NO2 and SO2 are associated with the irritant response of the airway (18). Second, air pollutants may cause systemic inflammation associated with bronchiectasis exacerbation. Exposure to particulate matter can activate a variety of cytokines [e.g., tumor necrosis factor (TNF)-α, interleukin (IL)-6, and IL-13] involved in the pathogenesis of chronic airway inflammation (19). Third, lung microbiome status might be altered due to air pollution. Air pollution can make patients with bronchiectasis more prone to respiratory infection (20), which may lead to dysbiosis in the lower airway. Previous studies have reported a link between air pollution and increased risk of respiratory infections, including SARS-CoV-2 and influenza virus (21). These respiratory infections can disrupt the normal balance of microbes in the lungs, making it easier for other infections to take hold (22). Since bacterial colonization is an important factor in bronchiectasis management, disrupting the balance of the lung microbiome may affect bronchiectasis exacerbation (23).
In our study, significant correlations were found between air pollutants, with some strong relationships. This suggests the possibility that air pollutants work together to worsen bronchiectasis. It has been reported that PM2.5 exhibits a synergistic effect when combined with other pollutants; for example, simultaneous exposure to PM2.5 and O3 aggravated bronchial asthma in the animal study (24). Nevertheless, there has been no established comprehensive integrated air pollution index, and most countries only provide individual air pollutant levels. The complex interplay between air pollutants makes it difficult to predict how they affect individual patients, but it seems clear they can play a role in the worsening of bronchiectasis. Therefore, further studies should focus on developing an integrated air pollution model aimed at assessing its effect on bronchiectasis.
We confirmed that there are no safety thresholds for air pollutants, particularly for PM10, NO2, SO2, and CO in patients with bronchiectasis. The significant association between these air pollutants and increased risks for healthcare utilization in patients with bronchiectasis was observed even below the good air quality values set by the Korean and WHO guidelines (15). Several countries and organizations still provide thresholds for air pollution based on the results of studies evaluating the effect of air pollutants on mortality (25, 26), which were conducted in a single region or country that did not focus on the thresholds of air pollutants. A meta-analysis from the Multi-City Multi-Country (MCC) data, encompassing 652 cities in 24 countries/regions, revealed that PM10 and PM2.5 increased the mortality without identifiable thresholds (27). Moreover, a recent study using Medicaid data demonstrated that air pollutant exposures were associated with increased risk of asthma hospitalization, below the level of U.S. standard (28). Considering these outcomes and our study results, it is suggested that there is no safety threshold for air pollution in the general population as well as patients with bronchiectasis.
Notably, our study showed that the increase in healthcare utilization risk per unit increase in PM10 and NO2 was more pronounced at below the safety thresholds, demonstrating a logarithmic growth pattern. Previous studies showed similar results that per unit increase of PM10 and PM2.5 at lower concentrations more substantially increased mortality and cardiovascular hospitalization compared to the increase at higher concentrations (27, 29). While the mechanism for these observations remains unclear, our study contributes additional evidence to the previous studies, urging efforts to reduce air pollution irrespective of prescribed safety thresholds recommended to the general population. Current policies aimed at maintaining concentrations of air pollution just below specific levels should be reconsidered. Through continuous improvements in air pollution, patients with bronchiectasis will be able to achieve improved health outcomes.
We should address some limitations of our study. First, we used ICD-10 codes for the definition of bronchiectasis. There might have been under or over-diagnosis in all studies using claim data. Second, this study was conducted only in 1 year. Therefore, comprehensive analysis, such as lagged day model and moving average, was unsuitable for our analysis. Third, we could not conduct a sensitivity analysis due to a small number of patients and the nature of claim data resulting in an outcome limited to all-cause healthcare utilization. Fourth, only air pollution data in the residential area were used without consideration of that in the workplace. If study subjects work outside of Seoul, their exposure to air pollution may be different. However, since most of the patients were elderly people aged 60 or older who were likely to have retired from work, the effect of this factor may not be significant. Fifth, previously known risk factors for exacerbation of bronchiectasis, such as lung function, microbial colonization, and bronchiectasis severity index, could not be evaluated due to a lack of information. Sixth, due to limited healthcare utilization details, routine hospital visits might be included as healthcare utilization. However, given their regularity, their influence on the study’s outcomes is likely minimal. Finally, since data were obtained from a major city in a single country, caution is needed in generalizing our results.
In conclusion, PM10, NO2, SO2, and CO were associated with increased healthcare utilization in patients with bronchiectasis, even below the recommended safe thresholds.
Data availability statement
The datasets presented in this article are not readily available because the HIRA-NPS database is for use only by designated persons. Requests to access the datasets should be directed to http://opendata.hira.or.kr.
Ethics statement
The studies involving humans were approved by Institutional Review Board (IRB) of Hanyang University Hospital (application no. HYUH 2022-08-043). The studies were conducted in accordance with the local legislation and institutional requirements. The ethics committee/institutional review board waived the requirement of written informed consent for participation from the participants or the participants’ legal guardians/next of kin because the HIRA-NPS database was constructed after anonymization.
Author contributions
HY: study conception and design. S-KL: data analysis. HL and SK: data interpretation and manuscript writing. HC, SC, DP, TP, J-YM, T-HK, S-HK, and JS: revision of manuscript and contribution of intellectual content. All authors contributed to the article and approved the submitted version.
Funding
This work was supported by the research fund of Hanyang University (HY-202200000002823). The funders had no role in the design of the study, the collection and analysis of the data, or the preparation of the manuscript.
Conflict of interest
The authors declare that the research was conducted in the absence of any commercial or financial relationships that could be construed as a potential conflict of interest.
Publisher’s note
All claims expressed in this article are solely those of the authors and do not necessarily represent those of their affiliated organizations, or those of the publisher, the editors and the reviewers. Any product that may be evaluated in this article, or claim that may be made by its manufacturer, is not guaranteed or endorsed by the publisher.
Supplementary material
The Supplementary material for this article can be found online at: https://www.frontiersin.org/articles/10.3389/fmed.2023.1233516/full#supplementary-material
References
1. Choi, H, Lee, H, Ra, SW, Jang, JG, Lee, JH, Jhun, BW, et al. Developing a diagnostic bundle for bronchiectasis in South Korea: a modified Delphi consensus study. Tuberc Respir Dis. (2022) 85:56–66. doi: 10.4046/trd.2021.0136
2. Choi, H, Yang, B, Nam, H, Kyoung, DS, Sim, YS, Park, HY, et al. Population-based prevalence of bronchiectasis and associated comorbidities in South Korea. Eur Respir J. (2019) 54:1900194. doi: 10.1183/13993003.00194-2019
3. Polverino, E, Goeminne, PC, McDonnell, MJ, Aliberti, S, Marshall, SE, Loebinger, MR, et al. European Respiratory Society guidelines for the management of adult bronchiectasis. Eur Respir J. (2017) 50:1700629. doi: 10.1183/13993003.00629-2017
4. Amati, F, Simonetta, E, Gramegna, A, Tarsia, P, Contarini, M, Blasi, F, et al. The biology of pulmonary exacerbations in bronchiectasis. Eur Respir Rev. (2019) 28:190055. doi: 10.1183/16000617.0055-2019
5. Goeminne, PC, Cox, B, Finch, S, Loebinger, MR, Bedi, P, Hill, AT, et al. The impact of acute air pollution fluctuations on bronchiectasis pulmonary exacerbation: a case-crossover analysis. Eur Respir J. (2018) 52:1702557. doi: 10.1183/13993003.02557-2017
6. Wang, Z, Zhou, Y, Zhang, Y, Huang, X, Duan, X, Ou, Y, et al. Association of hospital admission for bronchiectasis with air pollution: a province-wide time-series study in southern China. Int J Hyg Environ Health. (2021) 231:113654. doi: 10.1016/j.ijheh.2020.113654
7. Bae, S, and Kwon, HJ. Current state of research on the risk of morbidity and mortality associated with air pollution in Korea. Yonsei Med J. (2019) 60:243–56. doi: 10.3349/ymj.2019.60.3.243
8. Song, S, Lee, SE, Oh, SK, Jeon, SA, Sung, JM, Park, JH, et al. Demographics, treatment trends, and survival rate in incident pulmonary artery hypertension in Korea: a nationwide study based on the Health Insurance Review and Assessment Service database. PLoS One. (2018) 13:e0209148. doi: 10.1371/journal.pone.0209148
9. Kim, L, Kim, JA, and Kim, S. A guide for the utilization of Health Insurance Review and Assessment Service National Patient Samples. Epidemiol Health. (2014) 36:e2014008. doi: 10.4178/epih/e2014008
10. Choi, H, Lee, H, Ryu, J, Chung, SJ, Park, DW, Sohn, JW, et al. Bronchiectasis and increased mortality in patients with corticosteroid-dependent severe asthma: a nationwide population study. Ther Adv Respir Dis. (2020) 14:1753466620963030. doi: 10.1177/1753466620963030
11. Choi, H, Han, K, Jung, JH, Park, SH, Kim, SH, Kang, HK, et al. Long-term mortality of tuberculosis survivors in Korea: a population-based longitudinal study. Clin Infect Dis. (2022) 25:ciac411. doi: 10.1093/cid/ciac411
12. Korean Environmental Corporation. Air Korea: comprehensive air-quality index. Available at: https://www.airkorea.or.kr/web/khaiInfo?pMENU_NO=129.
13. Lee, SW, Yon, DK, James, CC, Lee, S, Koh, HY, Sheen, YH, et al. Short-term effects of multiple outdoor environmental factors on risk of asthma exacerbations: age-stratified time-series analysis. J Allergy Clin Immunol. (2019) 144:1542–50.e1. doi: 10.1016/j.jaci.2019.08.037
14. Pak, H-Y, and Pak, Y-S. The effects of PM10 on the hospital admission of patients with respiratory disease in Seoul, Korea. J Converg Inf Technol. (2019) 9:194–201. doi: 10.22156/CS4SMB.2019.9.6.194
15. World Health Organization. WHO global air quality guidelines: particulate matter (PM2.5 and PM10), ozone, nitrogen dioxide, sulfur dioxide and carbon monoxide. Geneva: World Health Organization (2021).
16. Hastie, TJ, and Tibshirani, RJ. Generalized additive model. New York/Boca Raton: Chapman & Hall/CRC (1990).
17. Goeminne, PC, Bijnens, E, Nemery, B, Nawrot, TS, and Dupont, LJ. Impact of traffic related air pollution indicators on non-cystic fibrosis bronchiectasis mortality: a cohort analysis. Respir Res. (2014) 15:108. doi: 10.1186/s12931-014-0108-z
18. Kampa, M, and Castanas, E. Human health effects of air pollution. Environ Pollut. (2008) 151:362–7. doi: 10.1016/j.envpol.2007.06.012
19. Ni, Y, Shi, G, and Qu, J. Indoor PM2.5, tobacco smoking and chronic lung diseases: a narrative review. Environ Res. (2020) 181:108910. doi: 10.1016/j.envres.2019.108910
20. Kirwa, K, Eckert, CM, Vedal, S, Hajat, A, and Kaufman, JD. Ambient air pollution and risk of respiratory infection among adults: evidence from the multiethnic study of atherosclerosis (MESA). BMJ Open Respir Res. (2021) 8:e000866. doi: 10.1136/bmjresp-2020-000866
21. Domingo, JL, and Rovira, J. Effects of air pollutants on the transmission and severity of respiratory viral infections. Environ Res. (2020) 187:109650. doi: 10.1016/j.envres.2020.109650
22. Hanada, S, Pirzadeh, M, Carver, KY, and Deng, JC. Respiratory viral infection-induced microbiome alterations and secondary bacterial pneumonia. Front Immunol. (2018) 9:2640. doi: 10.3389/fimmu.2018.02640
23. Mac Aogáin, M, Narayana, JK, Tiew, PY, Ali, N, Yong, VFL, Jaggi, TK, et al. Integrative microbiomics in bronchiectasis exacerbations. Nat Med. (2021) 27:688–99. doi: 10.1038/s41591-021-01289-7
24. Nan, N, Yan, Z, Zhang, Y, Chen, R, Qin, G, and Sang, N. Overview of PM2.5 and health outcomes: focusing on components, sources, and pollutant mixture co-exposure. Chemosphere. (2023) 323:138181. doi: 10.1016/j.chemosphere.2023.138181
25. Chen, J, and Hoek, G. Long-term exposure to pm and all-cause and cause-specific mortality: a systematic review and meta-analysis. Environ Int. (2020) 143:105974. doi: 10.1016/j.envint.2020.105974
26. Orellano, P, Reynoso, J, Quaranta, N, Bardach, A, and Ciapponi, A. Short-term exposure to particulate matter (PM10 and PM2.5), nitrogen dioxide (No2), and ozone (O3) and all-cause and cause-specific mortality: systematic review and meta-analysis. Environ Int. (2020) 142:105876. doi: 10.1016/j.envint.2020.105876
27. Liu, C, Chen, R, Sera, F, Vicedo-Cabrera, AM, Guo, Y, Tong, S, et al. Ambient particulate air pollution and daily mortality in 652 cities. N Engl J Med. (2019) 381:705–15. doi: 10.1056/NEJMoa1817364
28. Wei, Y, Qiu, X, Sabath, MB, Yazdi, MD, Yin, K, Li, L, et al. Air pollutants and asthma hospitalization in the Medicaid population. Am J Respir Crit Care Med. (2022) 205:1075–83. doi: 10.1164/rccm.202107-1596OC
29. Stafoggia, M, Samoli, E, Alessandrini, E, Cadum, E, Ostro, B, Berti, G, et al. Short-term associations between fine and coarse particulate matter and hospitalizations in southern Europe: results from the med-particles project. Environ Health Perspect. (2013) 121:1026–33. doi: 10.1289/ehp.1206151
Keywords: bronchiectasis, public health, environmental pollution, air pollution, particulate matter
Citation: Lee H, Kim SH, Lee S-K, Choi H, Chung SJ, Park DW, Park TS, Moon J-Y, Kim T-H, Kim S-H, Sohn JW and Yoon HJ (2023) Impact of air pollution on healthcare utilization in patients with bronchiectasis. Front. Med. 10:1233516. doi: 10.3389/fmed.2023.1233516
Edited by:
James B. Fink, Texas State University System, United StatesReviewed by:
Su-Boon Yong, China Medical University, TaiwanPaulo Hilario Nascimento Saldiva, University of São Paulo, Brazil
Copyright © 2023 Lee, Kim, Lee, Choi, Chung, Park, Park, Moon, Kim, Kim, Sohn and Yoon. This is an open-access article distributed under the terms of the Creative Commons Attribution License (CC BY). The use, distribution or reproduction in other forums is permitted, provided the original author(s) and the copyright owner(s) are credited and that the original publication in this journal is cited, in accordance with accepted academic practice. No use, distribution or reproduction is permitted which does not comply with these terms.
*Correspondence: Ho Joo Yoon, aGp5b29uQGhhbnlhbmcuYWMua3I=
†These authors have contributed equally to this work