
95% of researchers rate our articles as excellent or good
Learn more about the work of our research integrity team to safeguard the quality of each article we publish.
Find out more
ORIGINAL RESEARCH article
Front. Med. , 13 July 2023
Sec. Intensive Care Medicine and Anesthesiology
Volume 10 - 2023 | https://doi.org/10.3389/fmed.2023.1219257
 Aileen C. Naef1
 Samuel E. J. Knobel1†
 Nicole Ruettgers1†Marilyne Rossier1Marie-Madlen Jeitziner2,3Bjoern Zante2
 René M. Müri1,4Joerg C. Schefold2
 Tobias Nef1,4†
 Stephan M. Gerber1*†
Background: Exposure to elevated sound pressure levels within the intensive care unit is known to negatively affect patient and staff health. In the past, interventions to address this problem have been unsuccessful as there is no conclusive evidence on the severity of each sound source and their role on the overall sound pressure levels. Therefore, the goal of the study was to perform a continuous 1 week recording to characterize the sound pressure levels and identify negative sound sources in this setting.
Methods: In this prospective, systematic, and quantitative observational study, the sound pressure levels and sound sources were continuously recorded in a mixed medical–surgical intensive care unit over 1 week. Measurements were conducted using four sound level meters and a human observer present in the room noting all sound sources arising from two beds.
Results: The mean 8 h sound pressure level was significantly higher during the day (52.01 ± 1.75 dBA) and evening (50.92 ± 1.66 dBA) shifts than during the night shift (47.57 ± 2.23; F(2, 19) = 11.80, p < 0.001). No significant difference was found in the maximum and minimum mean 8 h sound pressure levels between the work shifts. However, there was a significant difference between the two beds in the based on location during the day (F(3, 28) = 3.91, p = 0.0189) and evening (F(3, 24) = 5.66, p = 0.00445) shifts. Cleaning of the patient area, admission and discharge activities, and renal interventions (e.g., dialysis) contributed the most to the overall sound pressure levels, with staff talking occurring most frequently.
Conclusion: Our study was able to identify that continuous maintenance of the patient area, patient admission and discharge, and renal interventions were responsible for the greatest contribution to the sound pressure levels. Moreover, while staff talking was not found to significantly contribute to the sound pressure levels, it was found to be the most frequently occurring activity which may indirectly influence patient wellbeing. Overall, identifying these sound sources can have a meaningful impact on patients and staff by identifying targets for future interventions, thus leading to a healthier environment.
Prolonged and elevated sound pressure levels in the intensive care unit (ICU) have long been identified as problematic, unduly affecting both patients and healthcare professionals. From a patient perspective, excessive sounds have been found to contribute to negative outcomes, such as cardiovascular stress (1–3), sleep disturbance (4–8), and delirium (5, 9, 10). Similarly, healthcare professionals report negative consequences of high sound pressure levels on their health. Specifically, acute and prolonged exposure has been linked to tachycardia, hypertension, stroke, and burnout (11–14).
Despite these consequences, research has shown that the sound pressure levels in the ICU continuously trend upward (15). Current assessments indicate that the daytime and night-time sound pressure levels in the ICU far exceed the recommended level of 35 dBA and 30 dBA, respectively (12). However, addressing such elevation of levels is challenging, as it often arises directly from patient care involving various medical devices, alarms, and personnel. More specifically, alarms (16, 17), staff behavior (16, 18–20), general activity (19), other patients (8), and equipment (8, 19) all play an essential role in the overall sound pressure levels. Existing studies suggest that over 50% of sound peaks can be attributed to modifiable human behavior, indicating that these sound sources could most easily be addressed through behavioral changes (13, 20, 21). Such sound sources include the ringing of telephones or pagers, talking, and watching of televisions (13, 21). Conversely, non-modifiable sound sources include aspects related to running equipment, such as equipment-related alarms with preset volumes, and life-saving procedures.
However, which of these sound sources occur most frequently and which play the most prominent role in the overall sound pressure level remain inconclusive, with some studies citing staff (16, 20, 22), alarms (23, 24), and daily activities (19, 25). Moreover, comparing or drawing conclusions across studies is challenging owing to the lack of clearly defined methods (25–27). For example, existing studies have performed measurements for anywhere from less than 3 h to 72 h cumulatively, with few studies incorporating any continuous measurement (19–21, 25, 26, 28). Therefore, the understanding of which sound sources are identified and their contribution to the soundscape remains elusive (20, 25). This is problematic when trying to determine which sound sources need to be targeted to decrease the overall sound pressure levels and improve the associated patient and staff outcomes.
Therefore, the goal of this work is to carry out the precise identification of the sound sources and quantify their contribution to the overall sound pressure levels in an ICU setting. Moreover, using the published methods and dataset, future researchers will be able to use this work as a basis for further analyses or as a reference for their results (26). This will ease the implementation of specific interventions to improve the soundscape in the ICU and, consequently, patient and healthcare professionals’ wellbeing (29). Related to this goal, we first hypothesize that an exhaustive list of sound sources from two ICU beds, measured during a continuous 7 day (168 h) period, can be successfully collected. Moreover, we believe that as a result it will be possible to identify roughly for how much time various sound sources occur in this setting. Secondly, we hypothesize that it will be possible to identify which sound sources are responsible for an increase in sound pressure levels greater than 3 dB in the ICU setting (30).
This prospective, systematic, and quantitative observational study was conducted between August 23 and August 30, 2021. Follow-up sound pressure levels were recorded from August 30 to September 20, 2021, to ensure that the week during which the observational study was conducted remained unbiased by the presence of the observer. Measurements started and ended at 9:15 a.m. The local ethics committee approved this study via waiver since no identifiable patient data were collected (KEK 2020-01294).
Two procedures were conducted during the study: (1) The sound pressure level was measured continuously over 1 month and (2) the sound source was identified continuously for 7 days, concurrent with the first week of the sound pressure level measurements (Figure 1).
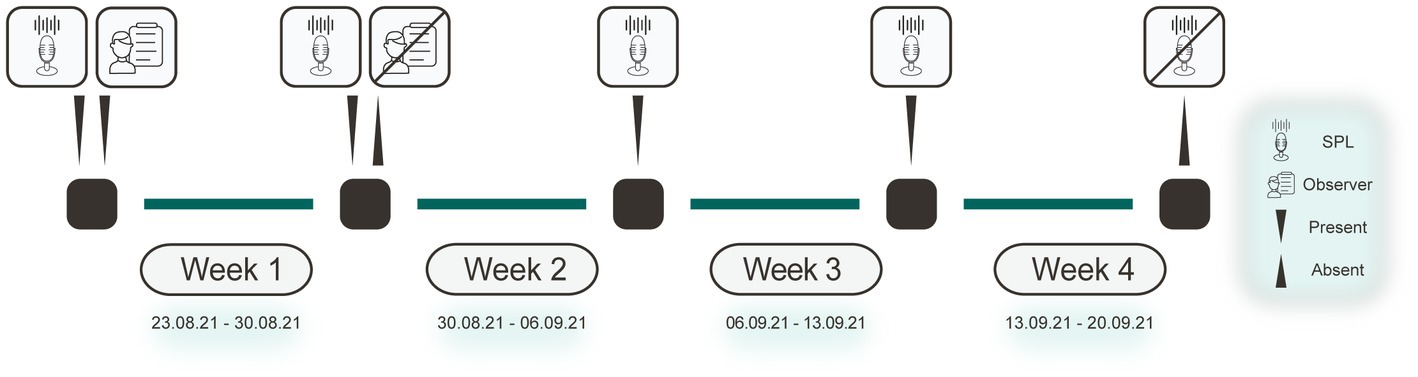
Figure 1. Study procedure. Diagram highlighting when certain aspects were present or absent over the 4 week measurement period. The microphone icon indicates that the SPLs were continuously recorded. The human and paper icon represents the presence of a human observer in the room. SPL, sound pressure level.
The study was conducted in the mixed medical–surgical ICU at the University Hospital Bern (Inselspital), Switzerland. In this hospital, the ICU comprises three mixed medical–surgical wards, each with 16 beds spread across one-, two-, and four-bed rooms and two central nursing stations. The ward selected for this study had four two-bed and two four-bed rooms. None of the rooms had any sound-proofing materials installed, nor was the ward specifically designed to target elevated sound pressure levels. The study focused on two neighboring beds within a four-bed room [Figure 2 adapted from Naef et al. (23)]. As this study was conducted during the COVID-19 pandemic, a non-COVID-19 ward was selected to ensure that a variety of patients would be present.
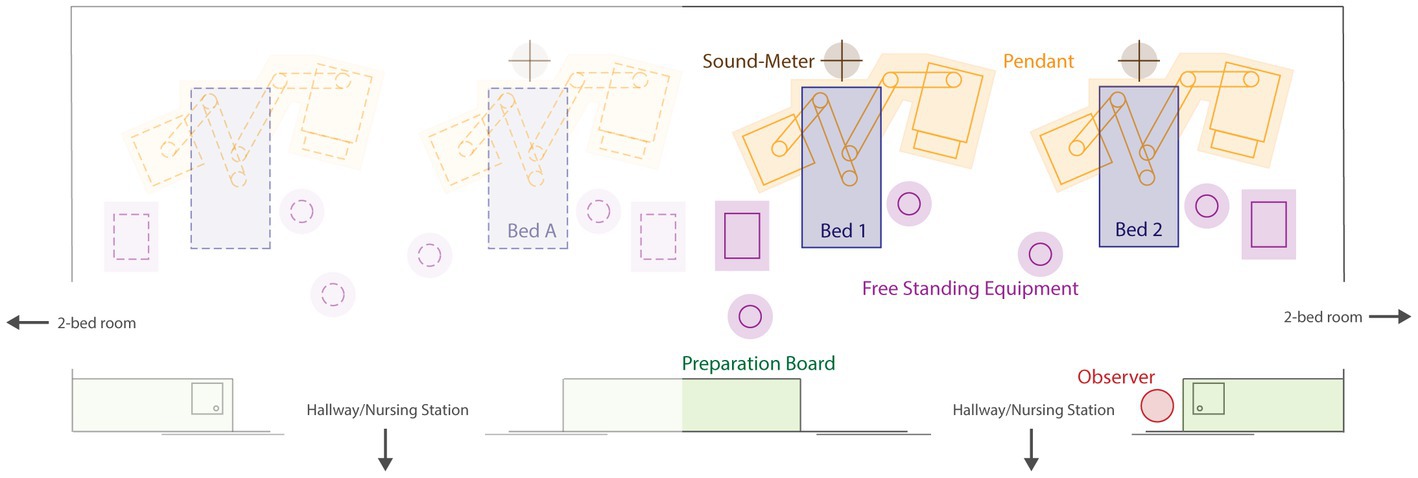
Figure 2. Schematic diagram of ICU rooms. Layout of the four-bed ICU room. The study included two beds (bed 1 and bed 2). Figure adapted from Naef et al. (26). ICU, intensive care unit.
The sound pressure levels were recorded using four sound level meters: one class I device (PCE-430, PCE Germany GmbH, Germany) and three class II devices (Extech-SL400, Extech Instruments, United States; Supplementary Data 1). Class I sound level meters are generally called “precision”-grade devices owing to their wider range. In contrast, class II sound level meters are typically called “general purpose” devices owing to their narrower ranges at higher frequencies (31, 32). The manufacturer calibrated all sound level meters with an accuracy of ±1.4 dB (class II at 1 kHz) and ±1.1 dB (class I at 1 kHz). The class I sound level meter had a sampling rate of 10 Hz, while the class II sound level meters had a sampling frequency of 1 Hz. The measurements were performed using a fast A-frequency weighting method and presented as decibels, as these measurements are comparable to how the human ear responds and are the standard for indoor measurements (31, 33).
The sound level meters were all briefly stopped and restarted every day, so that the data could be collected to minimize the risk of losing data. They were stopped during an observer break, which took 5–10 min on average.
The three class II sound level meters were placed in the four-ICU bed room, one directly above each of the two beds of interest and one above the neighboring bed (Figure 2). The sound level meters were placed approximately 2.5 m above the floor at the head-end of the bed. This was done as the greatest sound pressure levels occur around the head area of the patient bed (22). The class I sound level meter was placed at the central nursing station in the hallway, directly in front of the doors leading to the beds of interest (26). This location was selected based on previously used methods and it’s known relationship with elevated sound pressure levels (13, 17, 22, 34). The doors leading to and between the patient rooms were typically kept open.
Using information provided by the clinic information system of the ICU, we calculated the number of healthcare professionals working in the ICU ward and the bed occupancy (Supplementary Data 1). The healthcare professionals worked in three shifts: day from 7:00 a.m. to 3:00 p.m., evening from 3:00 p.m. to 11:00 p.m., and night from 11:00 p.m. to 7:00 a.m. This also held true on the weekends, except for ICU physicians who worked two 12 h shifts on the weekend: from 8:00 a.m. to 8:00 p.m. and from 8:00 p.m. to 8:00 a.m. Night shifts were classified on the basis of the day they start, not the day they end. Bed occupancy was recorded as one of four possibilities: (1) unoccupied, (2) occupied but absent, (3) occupied and alive, and (4) occupied but deceased. For further analyses, a bed was considered to be unoccupied in the first two cases and occupied in the latter two cases, unless otherwise specified.
One human observer was continuously present in the ICU room for 1 week to identify the sources of sounds that occurred. Four observers, whose interrater reliability was tested to ensure no bias was present, rotated through the ICU room (26). All observers had prior experience working in the ICU, either as medical doctors or researchers, and extensively studied and discussed possible sound sources prior to beginning the study. To note the sound sources, the observer used a scoring sheet, which allowed the observer to classify the audible sound sources and note within which 5 min period the sound occurred and for how many minutes. The observer was allowed to take an optional 10 min break per hour between: 20 and: 30 of the hour. Full details and tools used have been previously described by Naef et al. (26). A list of categories of the sound sources that occurred is shown in Supplementary Table S1; Full dataset can be found in Supplementary Data 1.
The possibility of retrospectively extracting information from the medical equipment used during the study period was exploited to identify the timing and duration of alarms (Supplementary Data 1). Monitoring alarms, such as alarms for the heart rate, blood pressure, and respiration rate, were all collected using a vital sign monitoring system (Carescape Monitor B650, G.E. Healthcare, United Kingdom) and recorded using the BedMasterEx software (Anandic Medical Systems AG, Switzerland). The monitoring alarms were identified as four types, with a fixed volume: type I, patient advisory alarms (~64 dB); type II, patient warnings (~70 dB); type III, patient crisis alarms (~72.5 dB); and type IV, system alarms (~70 dB). Alarms concerning ventilation were extracted from the ventilator (Hamilton-C6, Hamilton Medical, Switzerland) and categorized into three types according to priority, with no fixed volume. Perfusion alarms (Perfusor Space, B Braun Medical Inc., Germany) also did not have a fixed volume, with warnings and main alarms. Dialysis alarms were extracted from the dialysis devices (Prismaflex, Baxter, United States) and classified as either warnings or main alarms.
Finally, there were miscellaneous alarms such as door alarms or reanimation alarms, which were tracked by the hospital and obtained retrospectively from the clinical information system.
After the sound pressure level data exported directly using the manufacturer’s software were collected, they were preprocessed using Python (Python Software Foundation, 2022). Initially, the different days were stitched into a single file. The class I data were then downsampled to 1 Hz, while the class II sound level meters were resampled, so that their timestamps aligned to the full second. The preprocessed sound pressure levels were then used to calculate the equivalent sound pressure level (LAeq). Based on the LAeq, the minimum (LAFmin) and maximum (LAFmax) sound pressure levels were calculated per time interval of interest.
After accounting for the breaks taken, we noted that the full duration of the observational data was 148 h and 10 min (8,890 min), instead of 168 h and 0 min (10,080 min). Therefore, to ensure that the data could be accurately compared across work shifts, we resampled the observational data to remove all data recorded during a scheduled break (10 min per hour), regardless of whether it was taken. This ensured that the total duration of each 8 h shift for the analysis, except for the first and last days, was equivalent to 6 h and 40 min (400 min). The duration for 1 day was 20 h and 0 min (1,200 min) or 140 h and 0 min (8,400 min) for 7 days. For data that were not compared directly across work shifts, such as those for the agreement calculation and the linear mixed-effect model, the total dataset was subtracted from the actual breaks taken (148 h and 10 min [8,890 min] for 1 week).
To quantify the relatively calmer periods for the sound pressure levels, we calculated the restorative periods. The restorative periods were defined as the 5 min periods wherein the LAeq,5min was <50.0 dBA (35). As the measurements were conducted using a fast time-weighting method, the restorative periods were calculated using the LAeq only. The number of the restorative periods, mean duration per shift, and five most prolonged restorative periods during week 1 were calculated.
All statistical analyses were performed using R statistical language (version 4.2.2; R Core Team, 2022), with the psych (version 2.2.9) and lme4 (version 1.1-31) packages being used for the main analyses.
Descriptive statistics were used to analyze the differences between the 4 week continuous recording data, sound level meter locations, and differences between shifts. Comparisons were made using one-way analysis of variance (ANOVA), with Tukey’s HSD test used for posthoc analyses. One-way ANOVA, with Tukey’s HSD test for posthoc analyses, was also used to investigate the differences between the occurrences and duration of the restorative periods per shift. A dependent two-sample t-test was used to analyze the differences between the beds, during each shift, and in the number of occurrences and duration of the restorative periods.
To understand whether certain sound sources showed a relationship, we calculated and presented the agreement between the various sound sources using Cohen’s weighted kappa coefficient (κ). Only those whose 95% confidence intervals (CIs) were smaller than 1.0 were further examined to determine which results were most relevant.
To determine which sound sources should be included in the final model, we first modeled each source individually using a linear mixed-effect model. Herein, the goal was two-fold. The first goal was to determine whether the raw data had to be categorized. Specifically, because the preprocessed data were specified as the number of minutes a given sound occurred, an equal distribution between the levels had to be ensured. When the CI of the sound source was greater than 1.50 based on the preprocessed data, the data were grouped into three categories: 0 (no sound present), 1 (sound present for 1 min), or 2 (sound present for ≥2 min). The model was then run again with the new grouping. When the CI was again greater than 1.50, the data were further grouped into two categories: 0 (no sound present) or 1 (sound present). The second goal of the initial model was to determine which of the categorized or non-categorized sound sources should be included in the final model. To do so, we determined that only those whose model estimated a change of ≥3 dB, rounded to the nearest tenth, would be included in the final model. This value was selected, since a healthy ear can perceive only changes in 3 dB (30). Therefore, this was used as a cut-off for the individual sound sources.
The final model included sound sources in their original preprocessed state, with data categorized into three groups or binary data categorized into two groups. The model included the bed (i.e., bed 1 and bed 2) and bed occupancy (1: unoccupied; 2: occupied but absent; 3: occupied and present; and 4: occupied but deceased) as random effects.
During week 1, eight patients (two patients in bed 1 and six patients in bed 2) were treated in the two beds. Bed 1 and bed 2 were unoccupied for 29 h and 35 min and 35 h and 50 min (2,150 min), respectively. This duration included a continuous period of 13 h and 22 min (802 min) wherein both beds were simultaneously unoccupied. Based on a linear regression patient length of stay was not found to have a significant relationship with the overall sound pressure levels (p = 0.8879). In the other 14 beds of the ICU ward, 43 additional patients were treated. The overall ward occupancy for week 1 was 74.5% of the 16 beds. The total daily occupancy for the entire ward and the beds of interest is shown in Supplementary Table S4.
During week 1, there were, on average, 11.12 ± 0.78 nurses and 5.63 ± 1.11 physicians working during the day shift (Figure 3C). During the evening shift, there were, on average, 7.00 ± 0.00 nurses and 2.14 ± 0.23 physicians working (Figure 3C). During the night shift, 6.14 ± 0.35 nurses and 2.00 ± 0.00 physicians on average were working (Figure 3C).
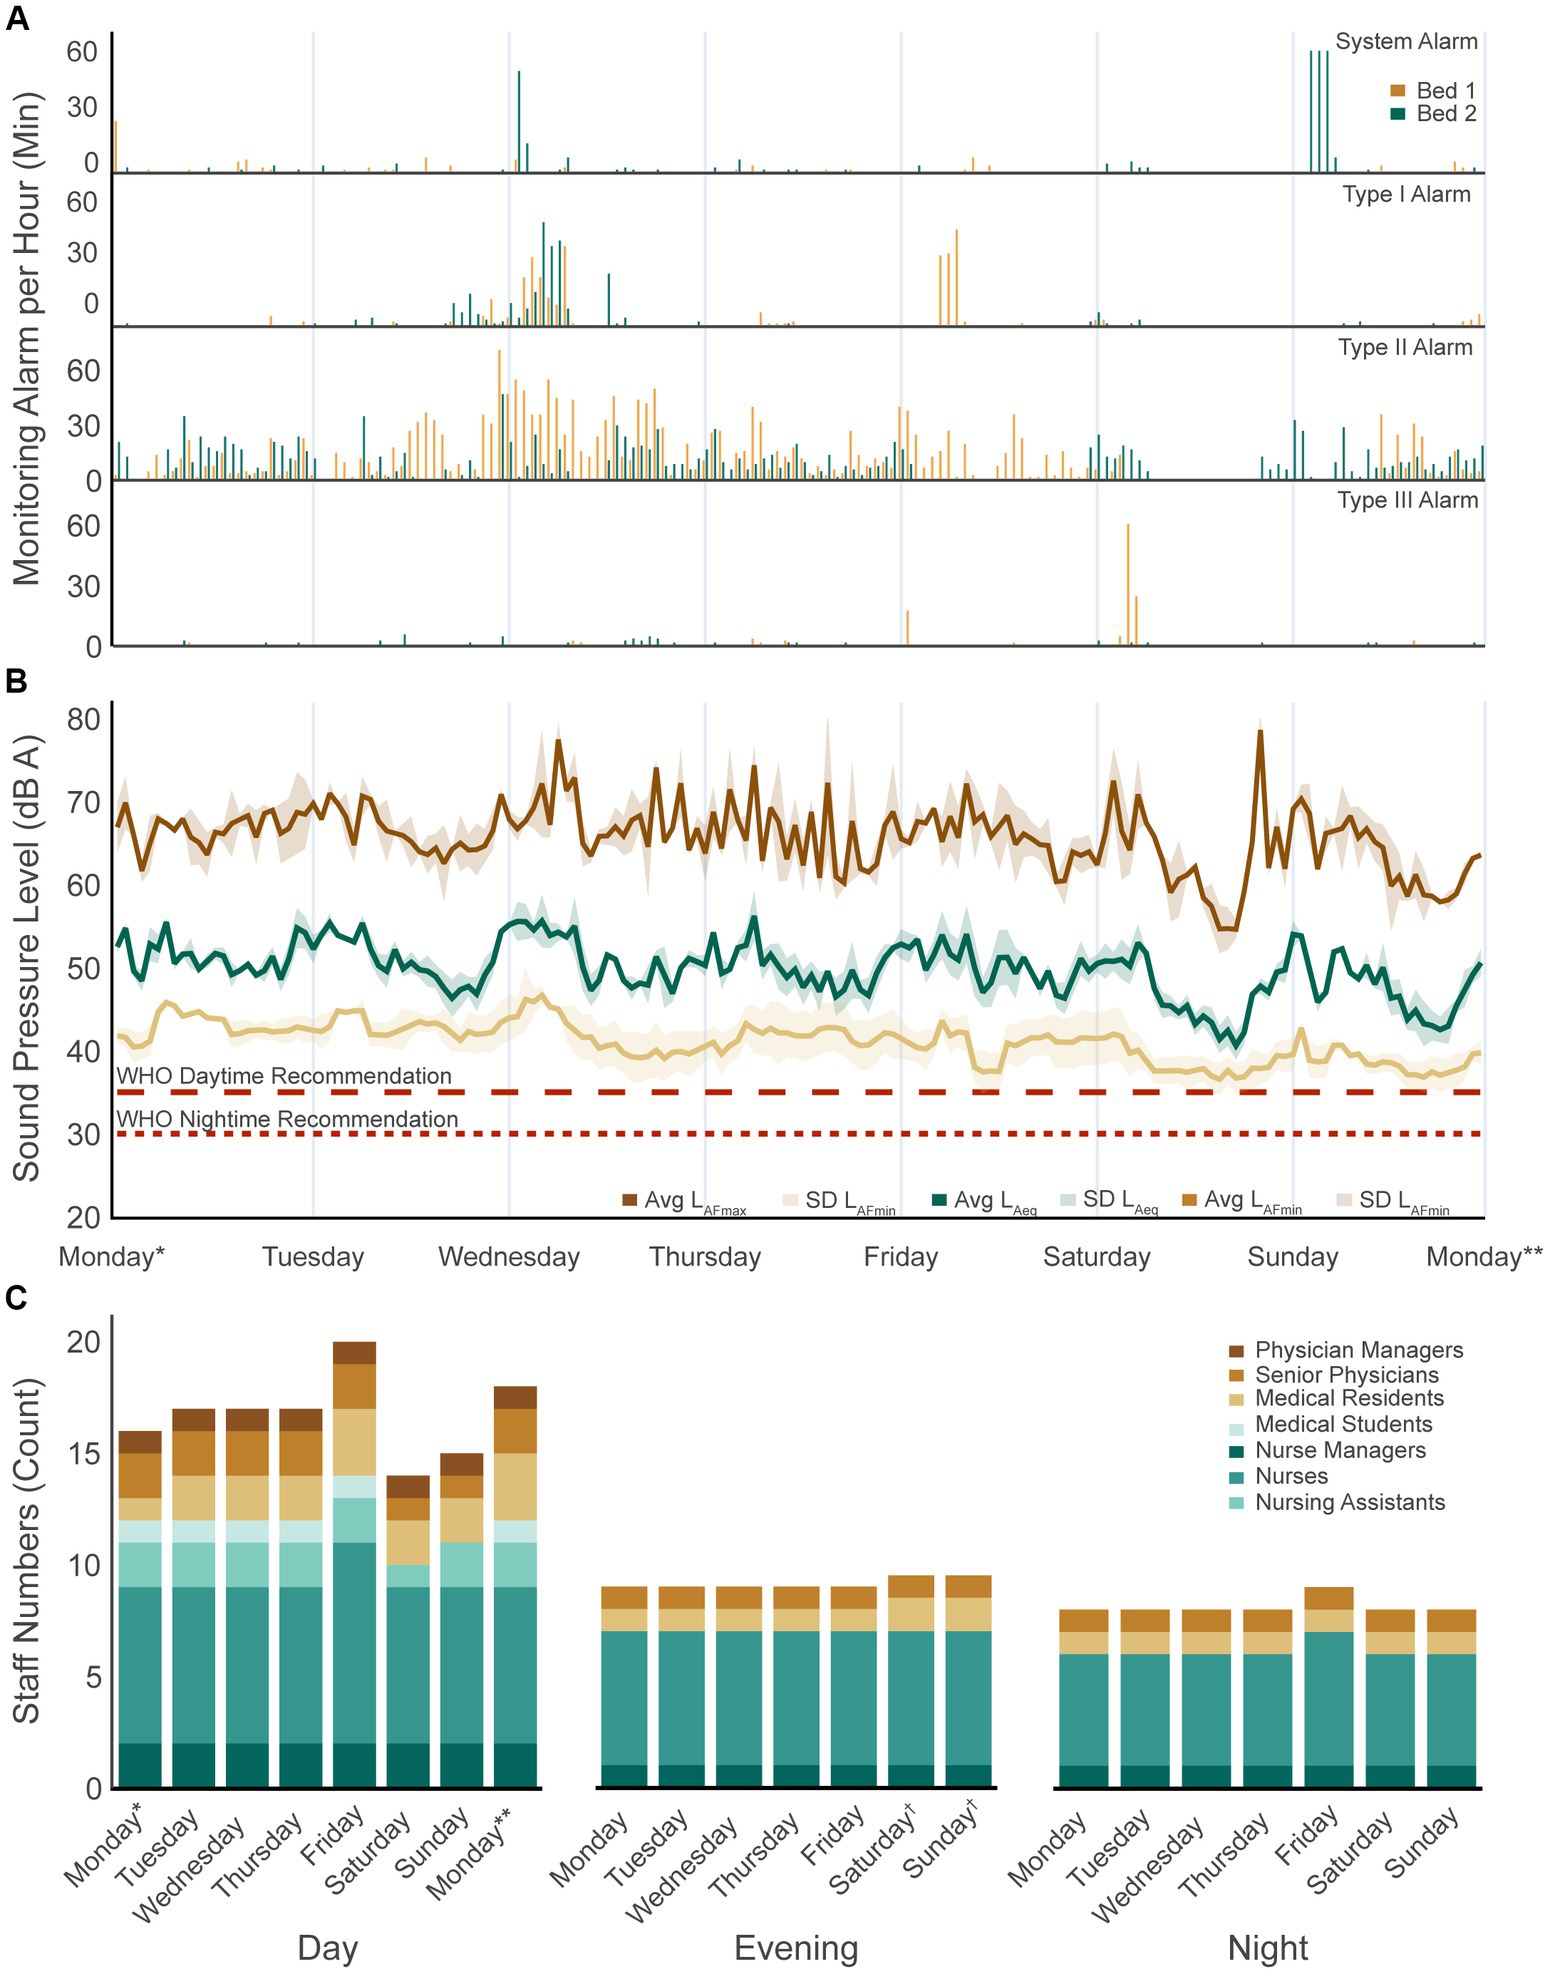
Figure 3. Week 1 sound pressure levels and sound sources. (A) Four patient monitoring alarm types present per bed over the 1 week recording period. (B) Average equivalent sound pressure level (LAeq,1h) as well as the maximum (LAFmax,1h) and minimum (LAFmin,1h) levels reached for bed 1 and bed 2 over the 1 week recording period. The dotted lines show the daytime and night-time recommendations by the WHO. (C) Number of staff present in the ward per day and shift. WHO, World Health Organization. *Not an entire shift: from study start at 9:15 a.m. to shift end at 03:00 p.m.; **Not an entire shift: from shift start at 7:00 a.m. to study end at 9:15 a.m.; †On weekends, physicians have two instead of three shifts: day shifts start from 8:00 a.m. to 8:00 p.m. and night shifts from 8:00 p.m. to 8:00 a.m. The average of the two values was calculated.
In the analysis of the 4 week continuous recordings, there were no significant differences in the LAeq,1week, LAFmax,1week, and LAFmin,1week between the weeks for the two beds of interest (Supplementary Table S5).
The mean LAeq,8h of the two beds of interest was 52.01 ± 1.75 dBA for the day shift, 50.92 ± 1.66 dBA for the evening shift, and 47.57 ± 2.23 dBA for the night shift (Table 1; Figure 3B). There were significant differences in the LAeq,8h between the shifts (F(2, 19) = 11.80, p < 0.001), with the LAeq,8h during the night shift being significantly lower than that during the day (p < 0.001, 95% CI = [−6.84, −2.05]) and evening (p = 0.007, 95% CI = [−5.82, −0.88]) shifts.
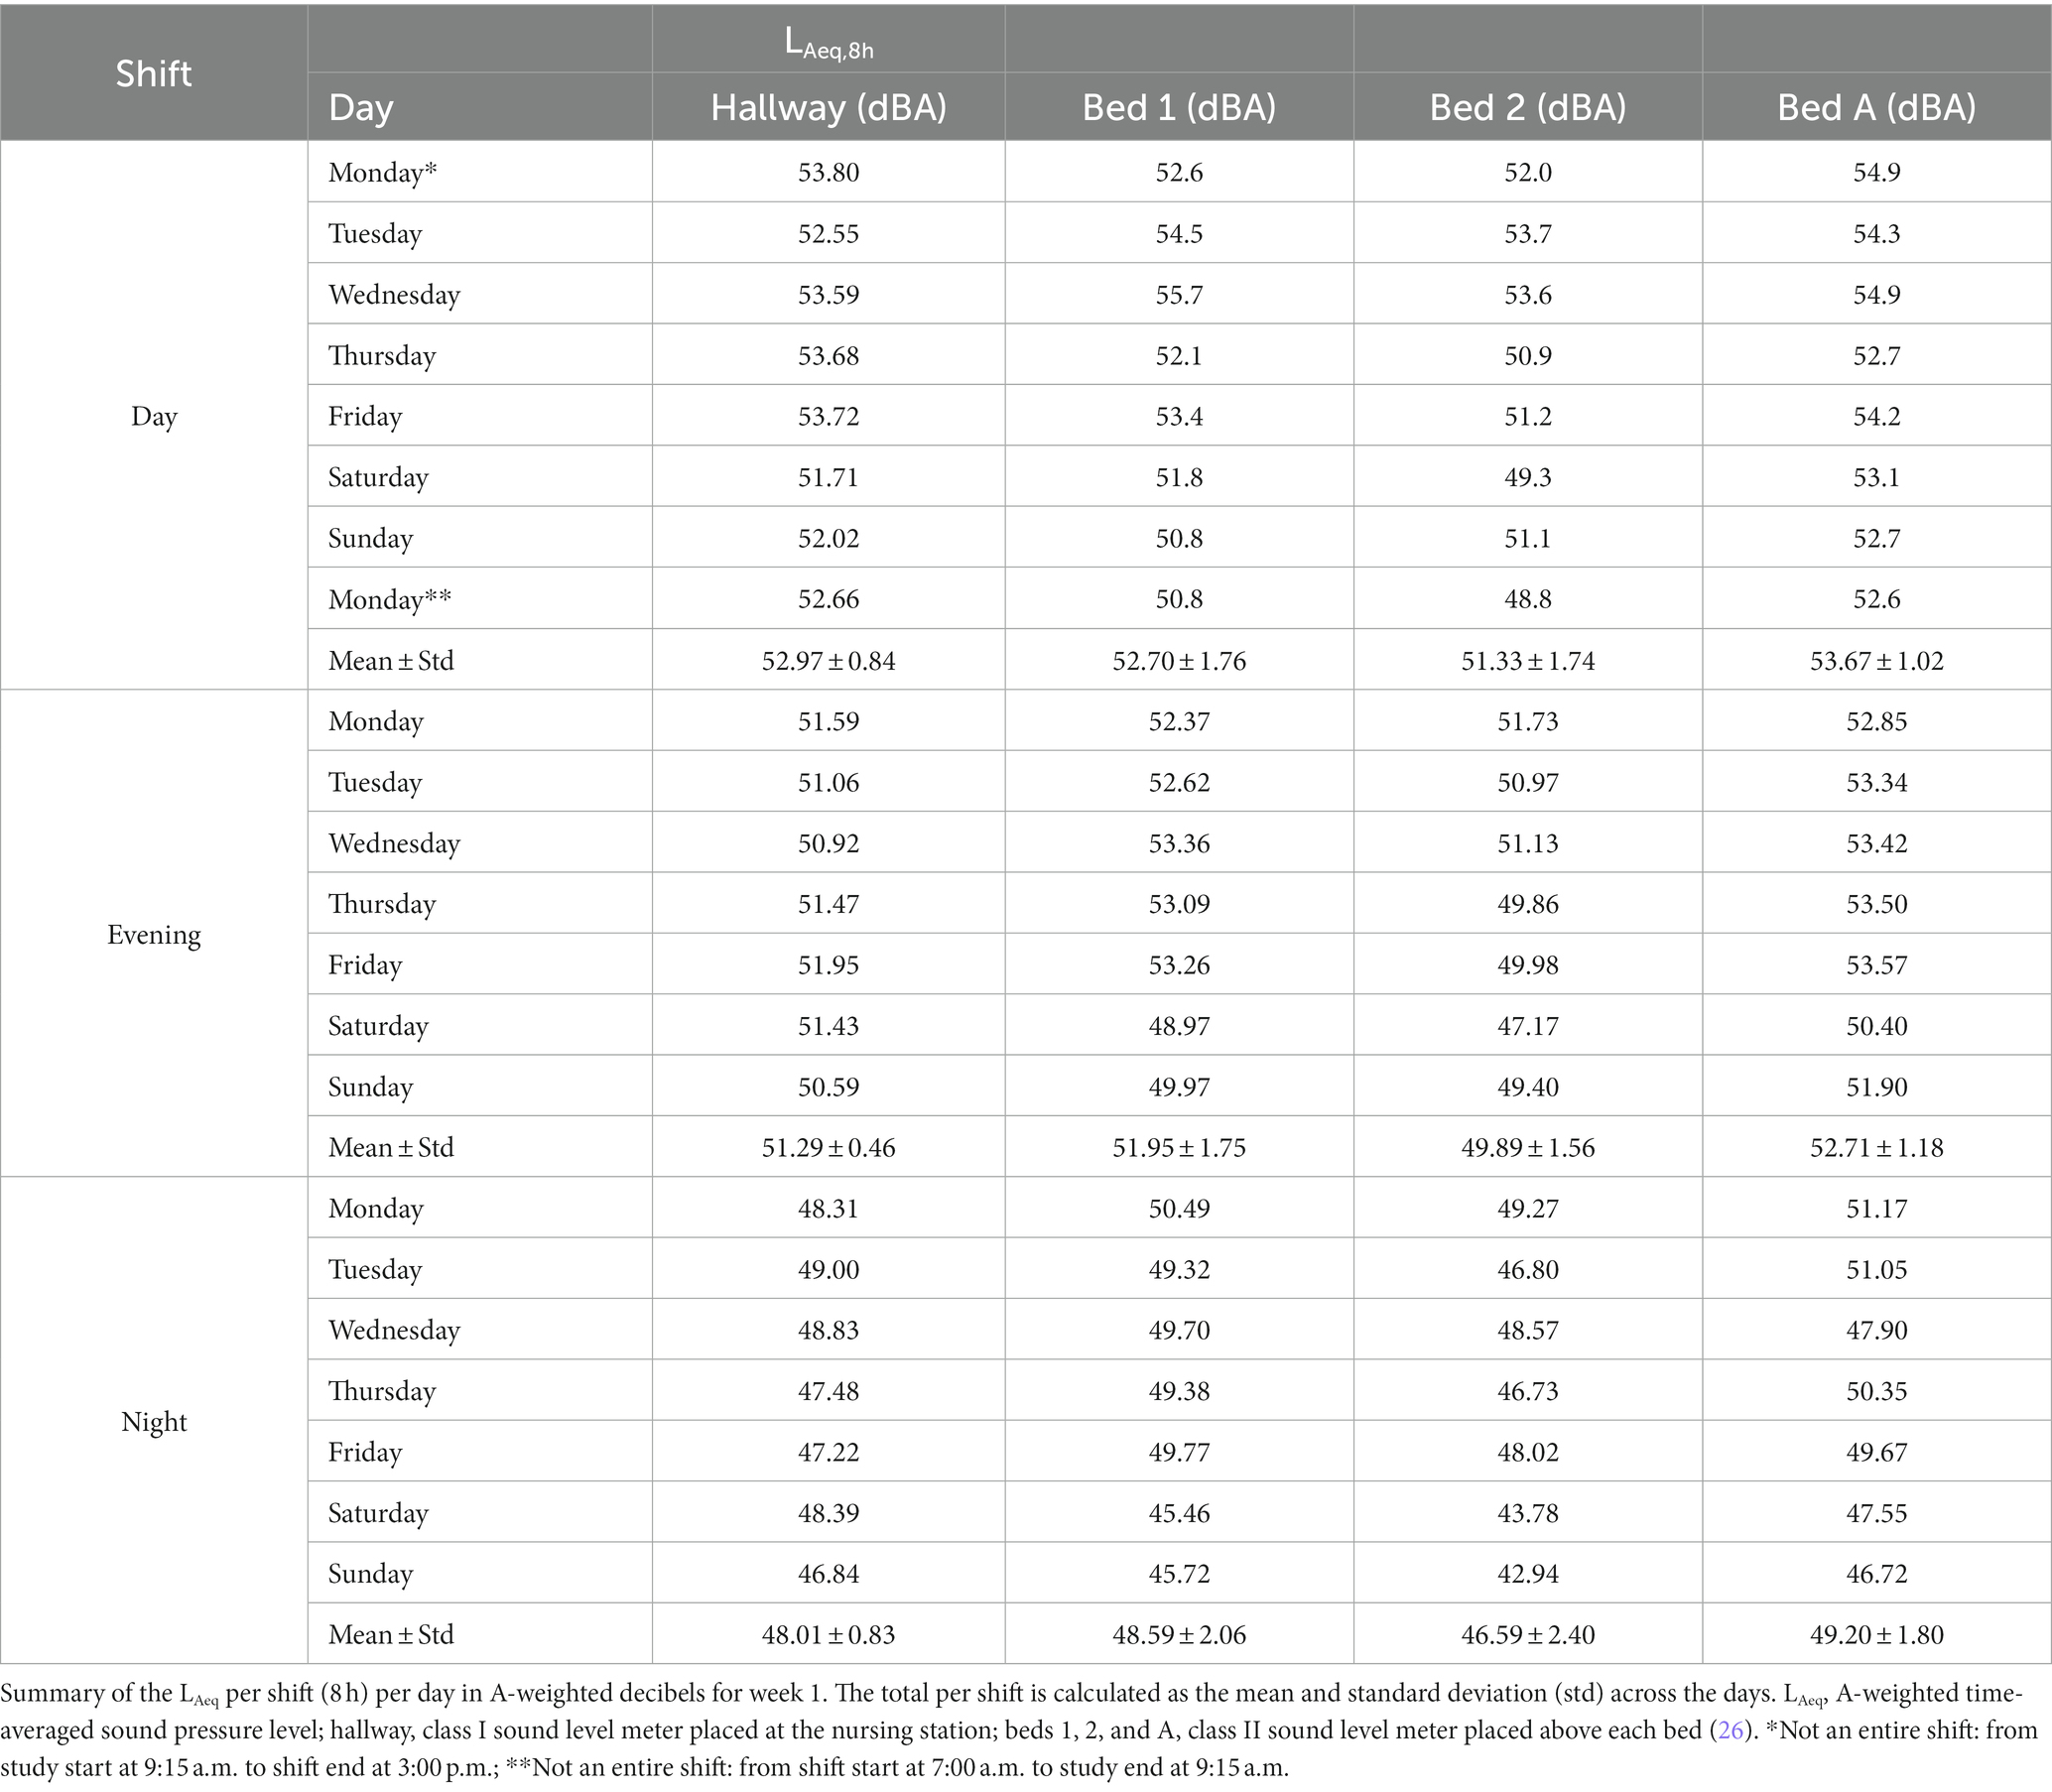
Table 1. Sound pressure levels per shift and day.
There was a significant difference in the LAeq,8h according to the sound level meter location during the day (F(3, 28) = 3.91, p = 0.0189) and evening (F(3, 24) = 5.66, p = 0.00445) shifts (Table 1). Bed 2 had a significantly lower LAeq,8h than bed A (bed adjacent to beds of interest) during the day (p = 0.0121, 95% CI = [0.423, 4.26]) and evening (p = 0.00303, 95% CI = [0.86, 4.78]) shifts. During the evening shift, bed 2 also had a significantly lower (p = 0.0375, 95% CI = [0.10, 4.02]) LAeq,8h than bed 1. During the night shift, there were no significant differences in the LAeq,8h according to the different sound level meter locations (F(3, 24) = 2.49, p = 0.0844).
The mean LAFmax,8h of the two beds of interest was 70.61 ± 3.70 dBA for the day shift, 71.99 ± 3.30 dBA for the evening shift, and 70.56 ± 6.32 dBA for the night shift (Figure 3B; Supplementary Table S2). There were no significant differences in the LAFmax,8h between the shifts (F(2, 19) = 0.26, p = 0.777).
The maximum level reached differed significantly according to the sound level meter location during both the day (F(3, 28) = 9.39, p < 0.001) and evening (F(3, 24) = 5.70, p = 0.00429) shifts (Supplementary Results 1; Supplementary Table S2).
The mean LAFmin,8h of the two beds of interest was 40.2 ± 1.4 dBA for the day shift, 40.1 ± 2.5 dBA for the evening shift, and 39.5 ± 2.1 dBA for the night shift (Figure 3B; Supplementary Table S3). There were no significant differences in the LAFmin,8h between the shifts (F(2, 19) = 0.20, p = 0.818).
The minimum level reached differed significantly according to the sound level meter location during the day (F(3, 28) = 26.90, p < 0.001), evening (F(3, 24) = 7.39, p < 0.001), and night (F(3, 24) = 8.46, p < 0.001) shifts (Supplementary Results 1; Supplementary Table S3).
The total number of the restorative periods (LAeq < 50 dBA) that occurred during the 1 week observation period when the beds of interest were occupied and unoccupied was 975 (81 h and 15 min [4,875 min]) for bed 1 and 1,351 (112 h and 35 min) for bed 2. The most prolonged restorative period for both beds occurred simultaneously, lasted 12.50 h, and occurred on a weekend while the beds were unoccupied. The details of the five most prolonged restorative periods per bed, not accounting for bed occupancy, are described in Supplementary Results 2 and shown in Supplementary Table S6.
When the restorative periods were considered only when the beds were occupied, bed 1 had 81, 154, and 432 restorative periods for the day, evening, and night shifts, respectively (Table 2). Bed 2 had 223, 251, and 518 restorative periods for the same shifts, respectively (Table 2). There were no significant differences in the mean number of occurrences per day between the shifts for both bed 1 (F(2, 16) = 3.12, p = 0.0717) and bed 2 (F(2, 18) = 3.17, p = 0.0662) when occupied. The mean length of the restorative periods significantly differed between bed 1 (1.32 ± 1.08; 0 h and 6 min ± 0 h and 5 min) and bed 2 (3.42 ± 1.74; 0 h and 17 min ± 0 h and 8 min) during the day shift (t(13) = −2.75, p =.01655) (Table 2).
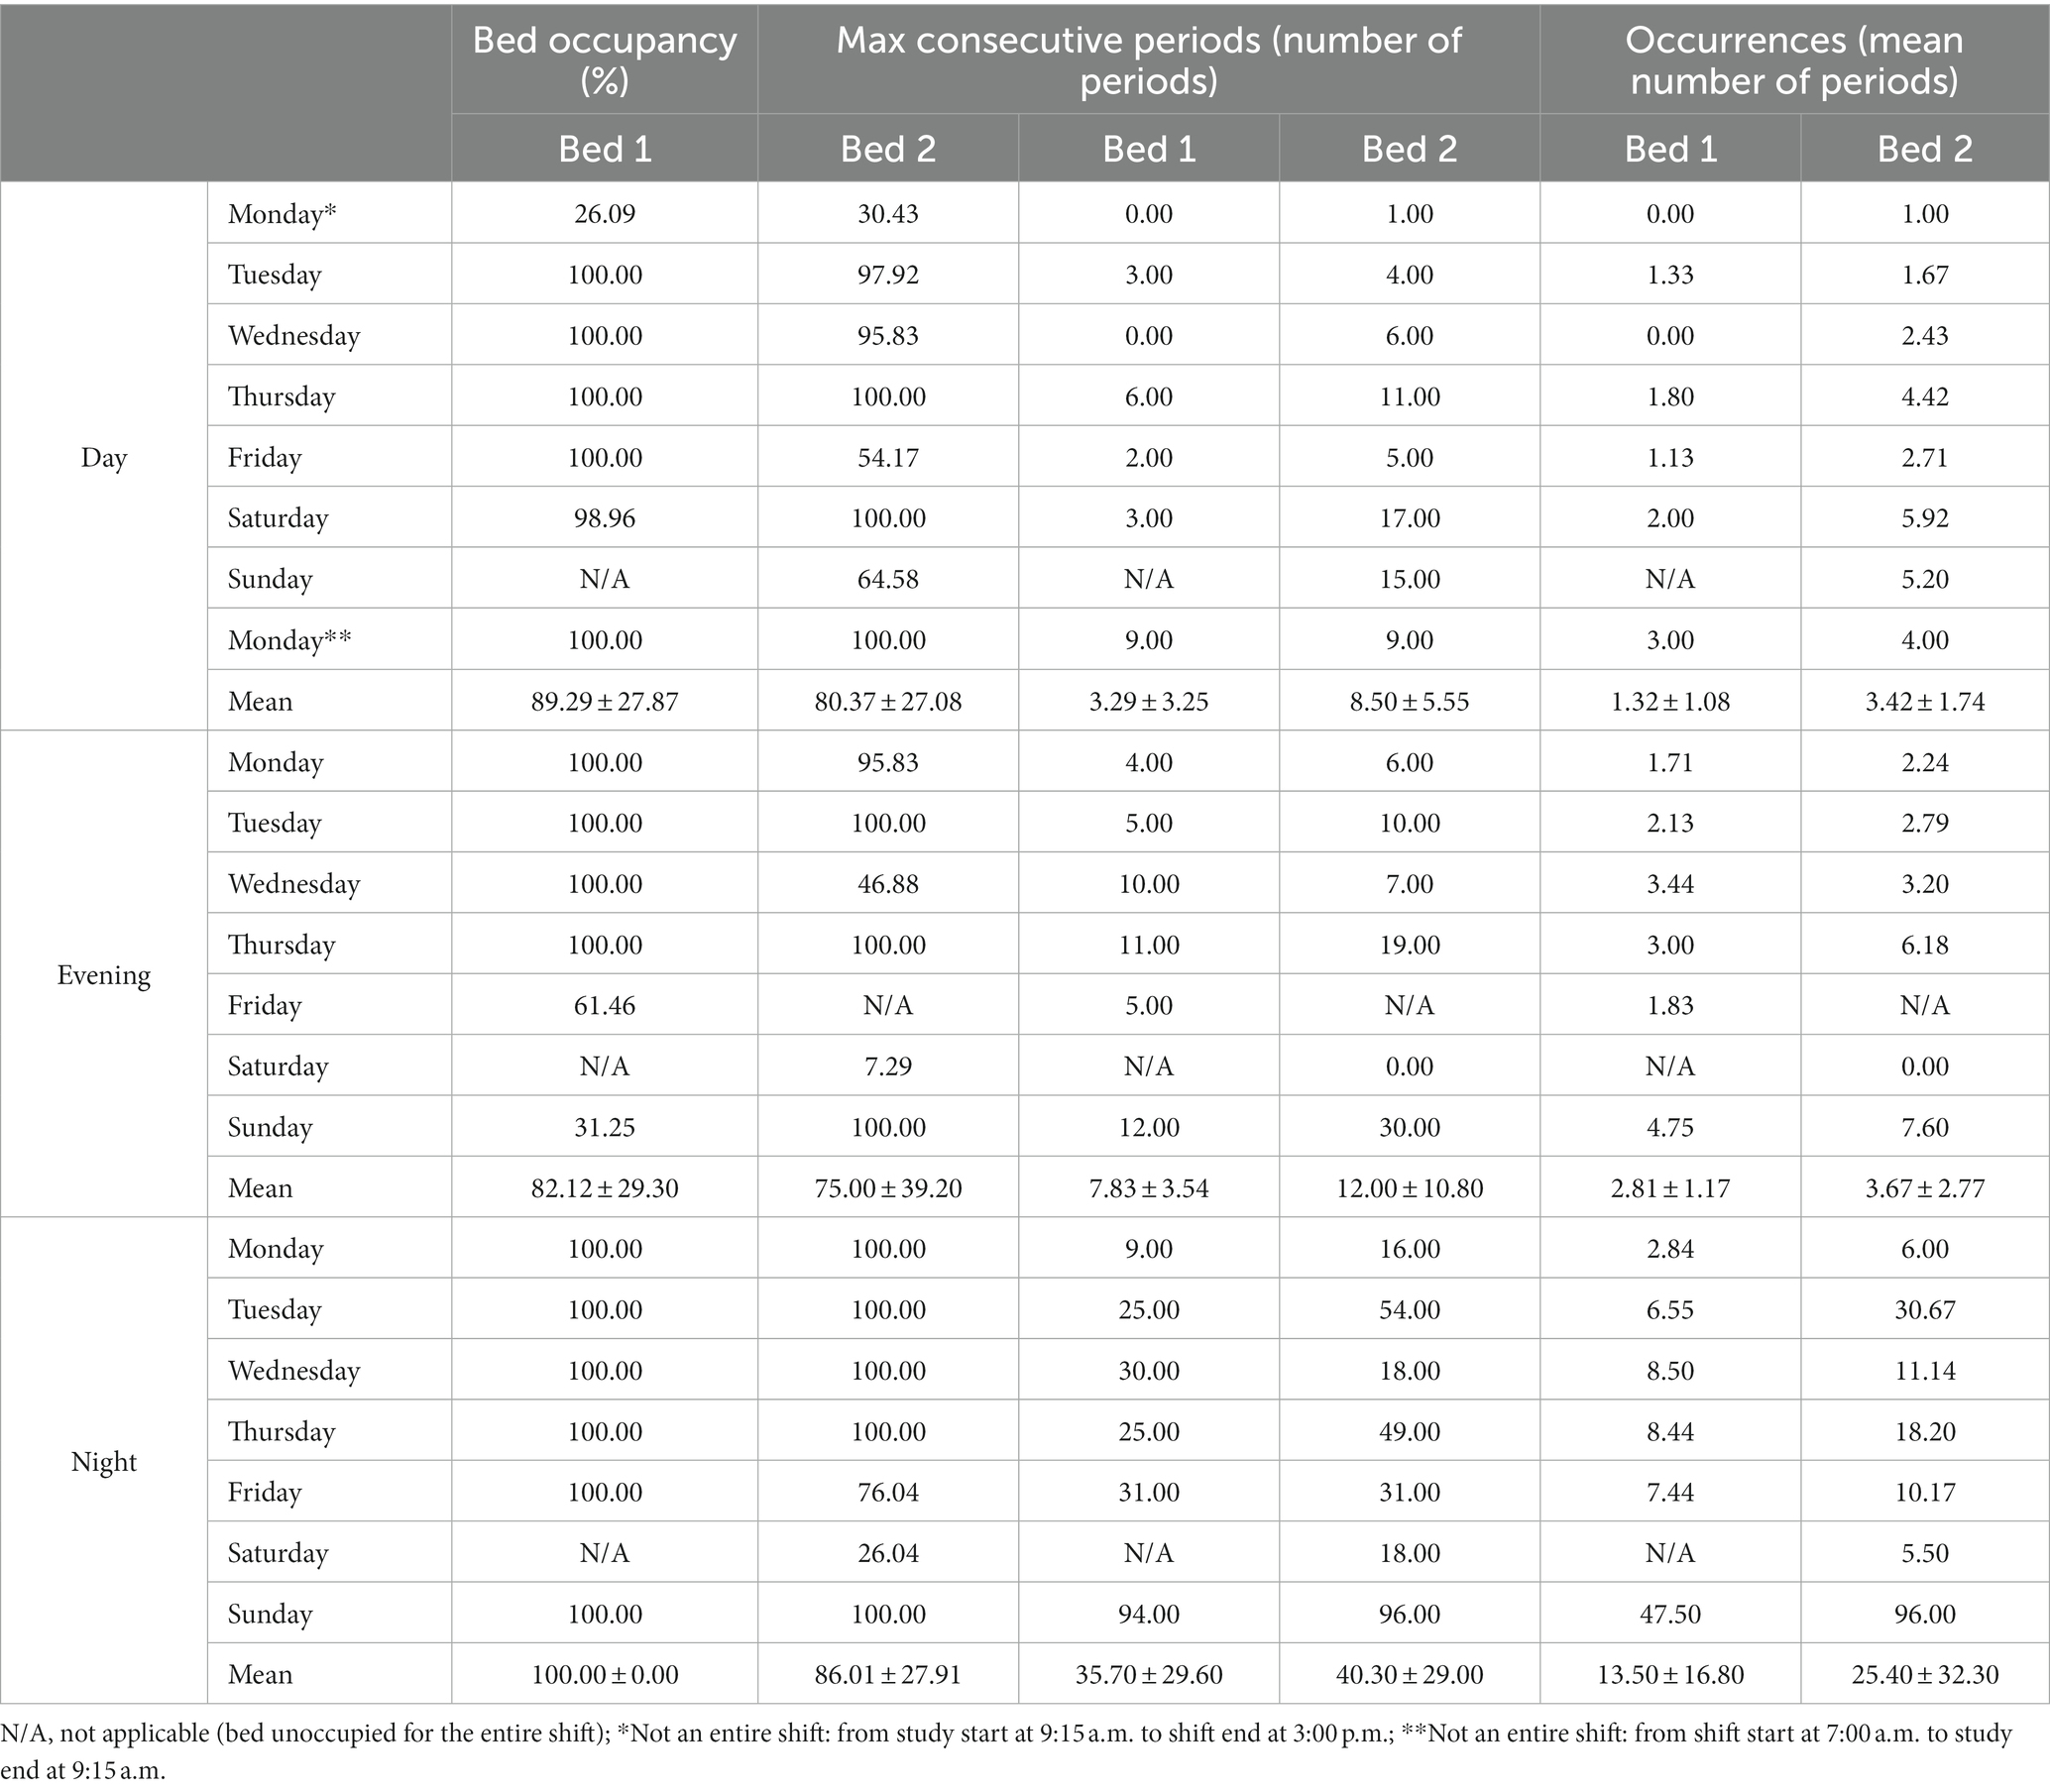
Table 2. Restorative period occurrence and consecutive period.
The maximum number of consecutive periods was significantly different between the shifts for bed 1 (F(2, 16) = 5.46, p =.0134) and bed 2 (F(2, 18) = 7.31, p =.00442; Table 2). The posthoc test revealed that the maximum average number of consecutive periods reached was significantly larger during the night shift than during the day (bed 1: p =.01563, 95% CI = [4.98, 50.42]; bed 2: p =.00693, 95% CI = [8.50, 55.07]) and evening (bed 1: p =.04591, 95% CI = [0.39, 47.32]; bed 2: p =.01336, 95% CI = [5.95, 54.05]) shifts for both beds (Table 2).
During week 1, the equipment generated alarms for 94 h and 5 min (5,645 min). Specifically, patient monitoring alarms occurred for 64 h and 44 min (3,884 min) (Figure 3A), ventilator alarms for 22 h and 58 min (1,378 min), door alarms for 4 h and 2 min (242 min), perfusion alarms for 2 h and 9 min (129 min), and dialysis alarms for 0 h and 12 min (12 min) across the two beds (Table 3).
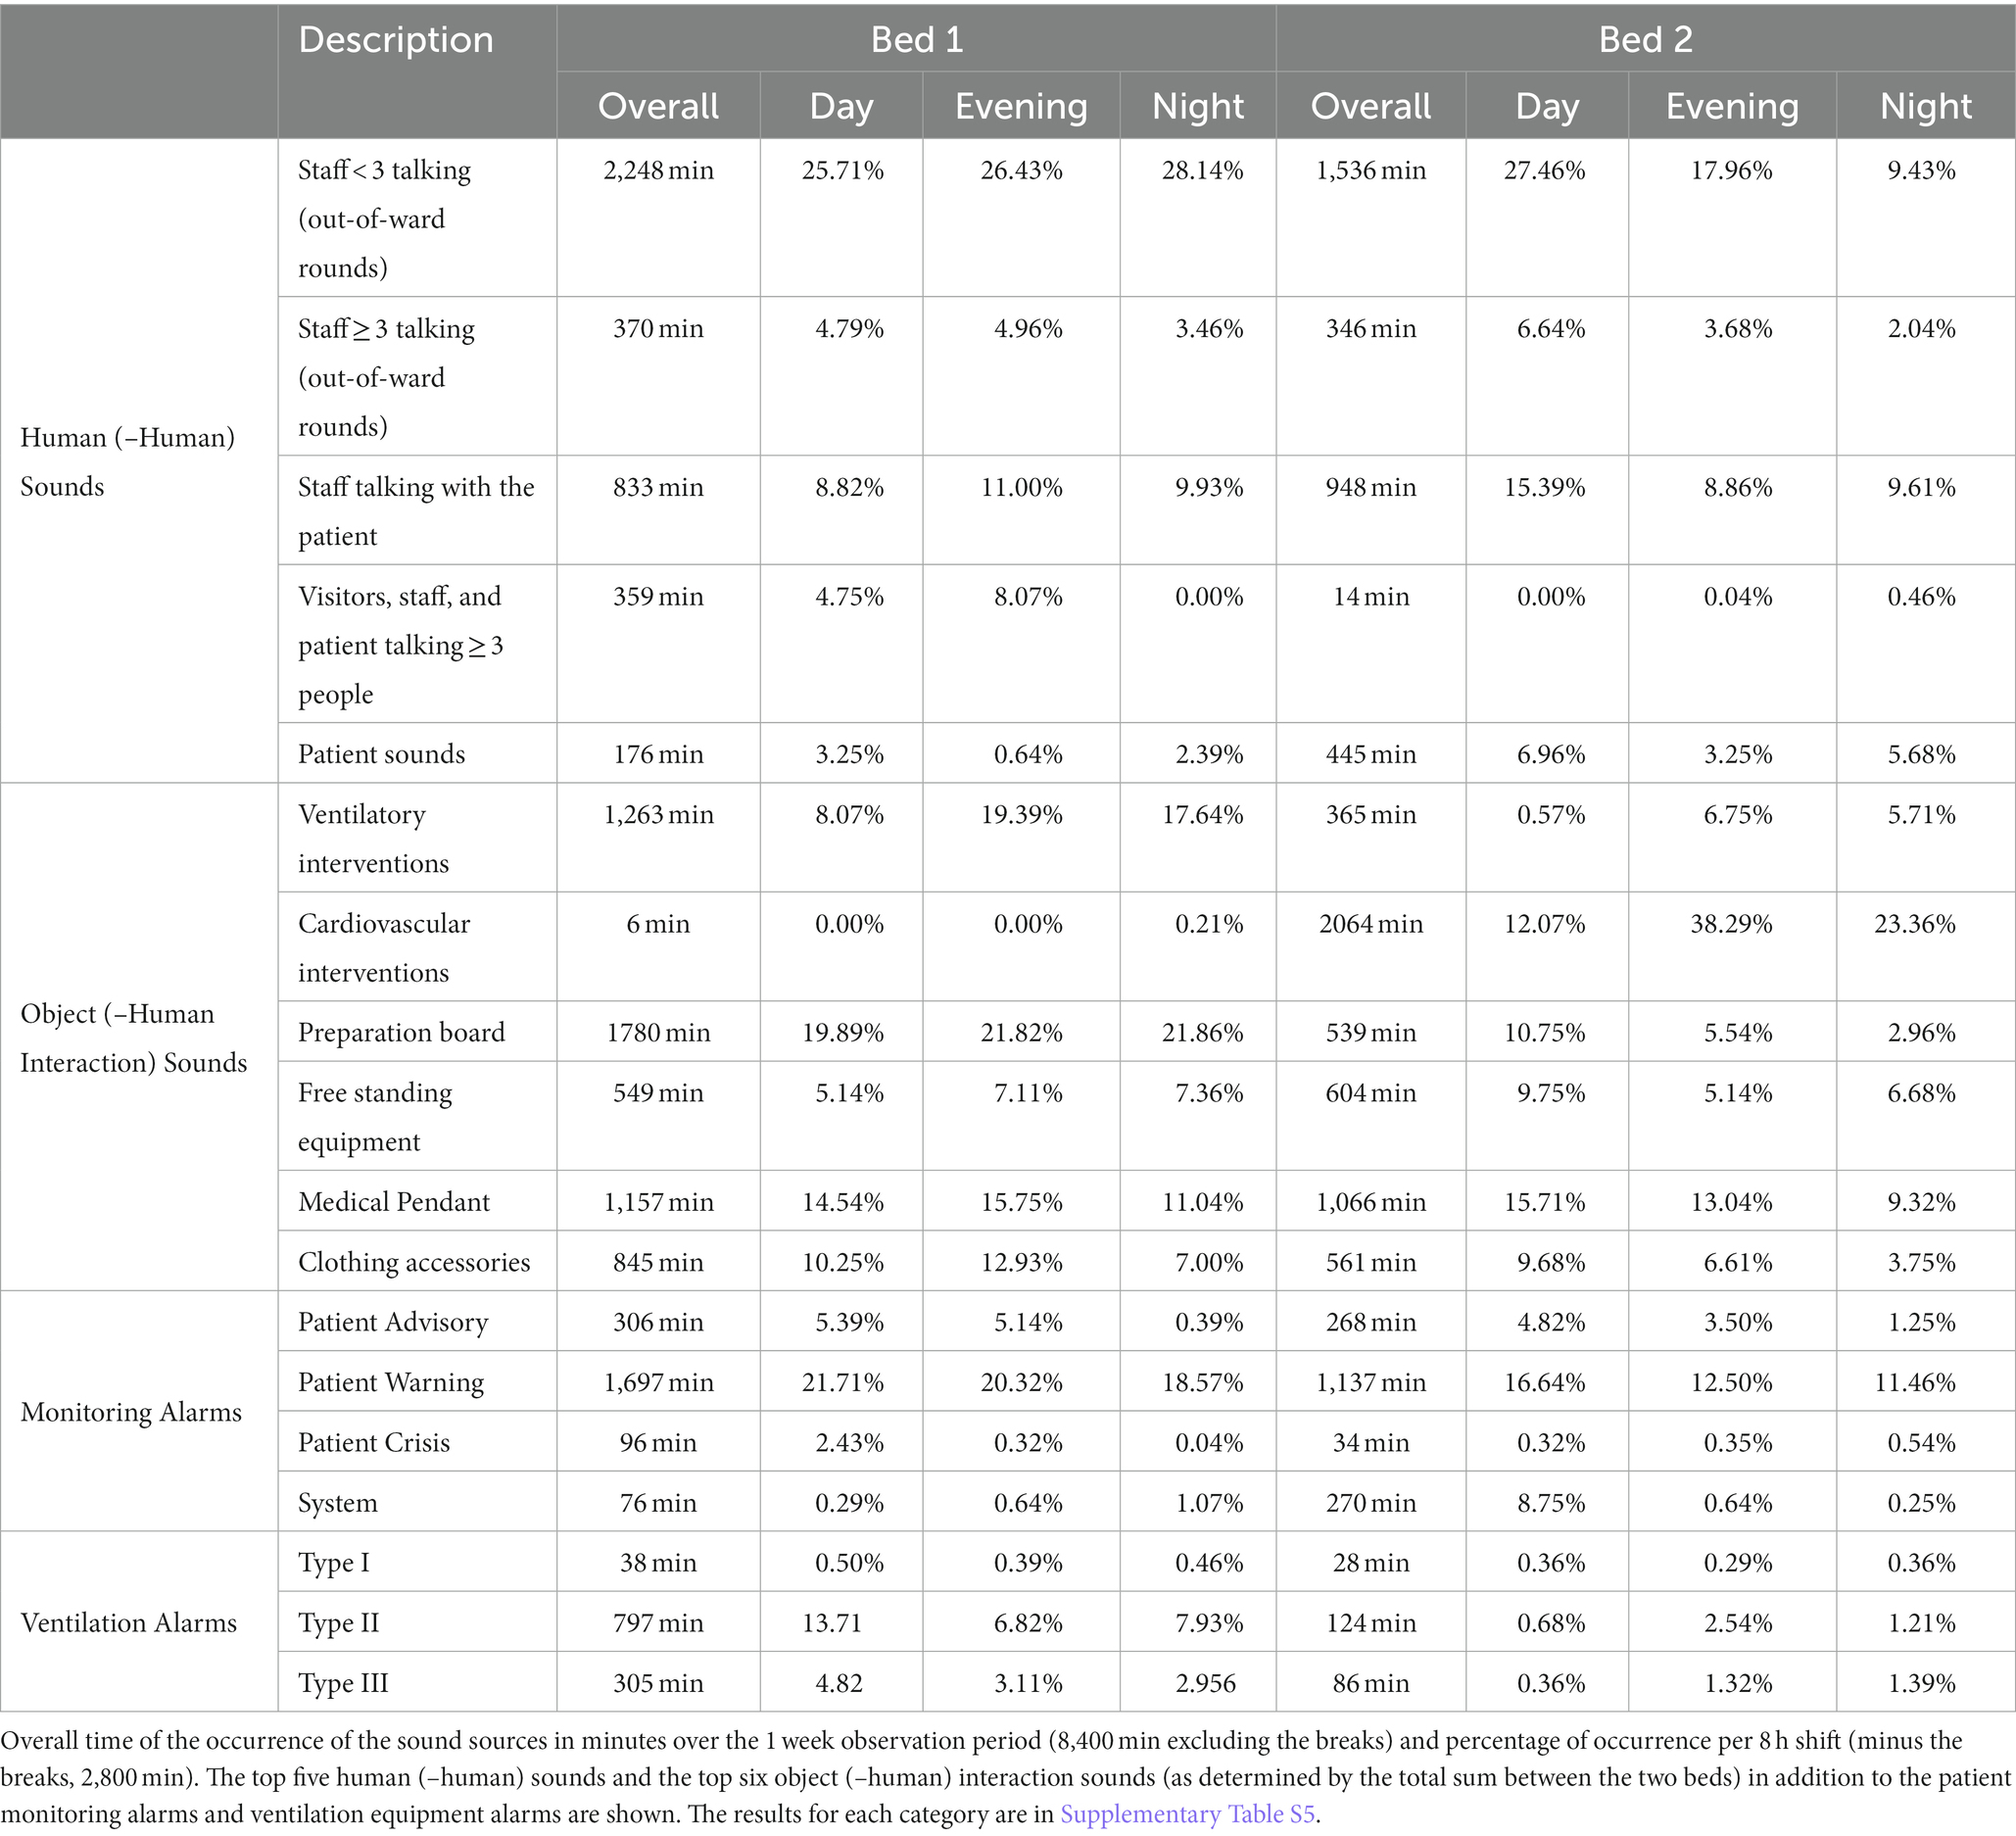
Table 3. Duration of occurrence of different human and object sound sources over week 1.
Considering the observer breaks during week 1 (140 h; 8,400 min), human (–human interaction) sounds occurred for 69 h and 21 min (4,161 min, 49.54%) for bed 1 and 58 h and 12 min (3,492 min, 41.57%) for bed 2. The greatest contributor to the overall duration of human (–human interaction) sounds was one to two staff members talking outside of ward rounds, which occurred for 37 h and 28 min (2,248 min, 26.76%) for bed 1 and 25 h and 36 min (1,536 min, 18.29%) for bed 2 (Table 3). Over week 1, object (–human interaction) sounds, not including alarms, occurred for 106 h and 58 min (6,418 min, 76.41%) for bed 1 and 108 h and 36 min (6,516 min, 77.57%) for bed 2. For bed 1, the sources responsible for the highest percentage of sounds were preparation boards (21.19%, 29 h and 40 min, 1780 min), ventilatory interventions (15.04%, 21 h and 3 min, 1,263 min), medical pendants (13.77%, 19 h and 17 min, 1,157 min), clothing accessories (10.06%, 14 h and 5 min, 845 min), and free-standing equipment (6.54%, 9 h and 9 min, 549 min). For bed 2, cardiovascular interventions were the greatest contributor of the sounds (24.57%, 34 h and 24 min, 2064 min), followed by medical pendants (12.69%, 17 h and 46 min, 1,066 min), free-standing equipment (7.19%, 10 h and 4 min, 604 min), clothing accessories (6.68%, 9 h and 21 min, 561 min), preparation boards (6.42%, 8 h and 59 min, 539 min), and ventilatory interventions (4.35%, 6 h and 5 min, 365 min). The five human (–human interaction) sounds and the six object (–human interaction) sounds that occurred for the greatest amount of time are presented in Table 3, with the full results presented in Supplementary Tables S7–S15.
In the analysis of the agreement between the sound sources whose CI was smaller than 1, the highest agreement was noted between type II monitoring alarms and one to two staff members talking outside of ward rounds (κ = 0.28, CI = [0.11, 0.44]; Table 4). The subsequent five highest agreements were found between one to two staff members talking outside of ward rounds and medical pendants (κ = 0.27, CI = [0.05, 0.48]), preparation boards (κ = 0.21, CI = [−0.02, 0.45]), and staff talking with patients (κ = 0.19, CI = [−0.11, 0.48]) as well as between type II monitoring alarms and medical pendants (κ = 0.24, CI = [−0.06, 0.53]) and ventilatory interventions (κ = 0.19, CI = [−0.18, 0.56]; Table 4).
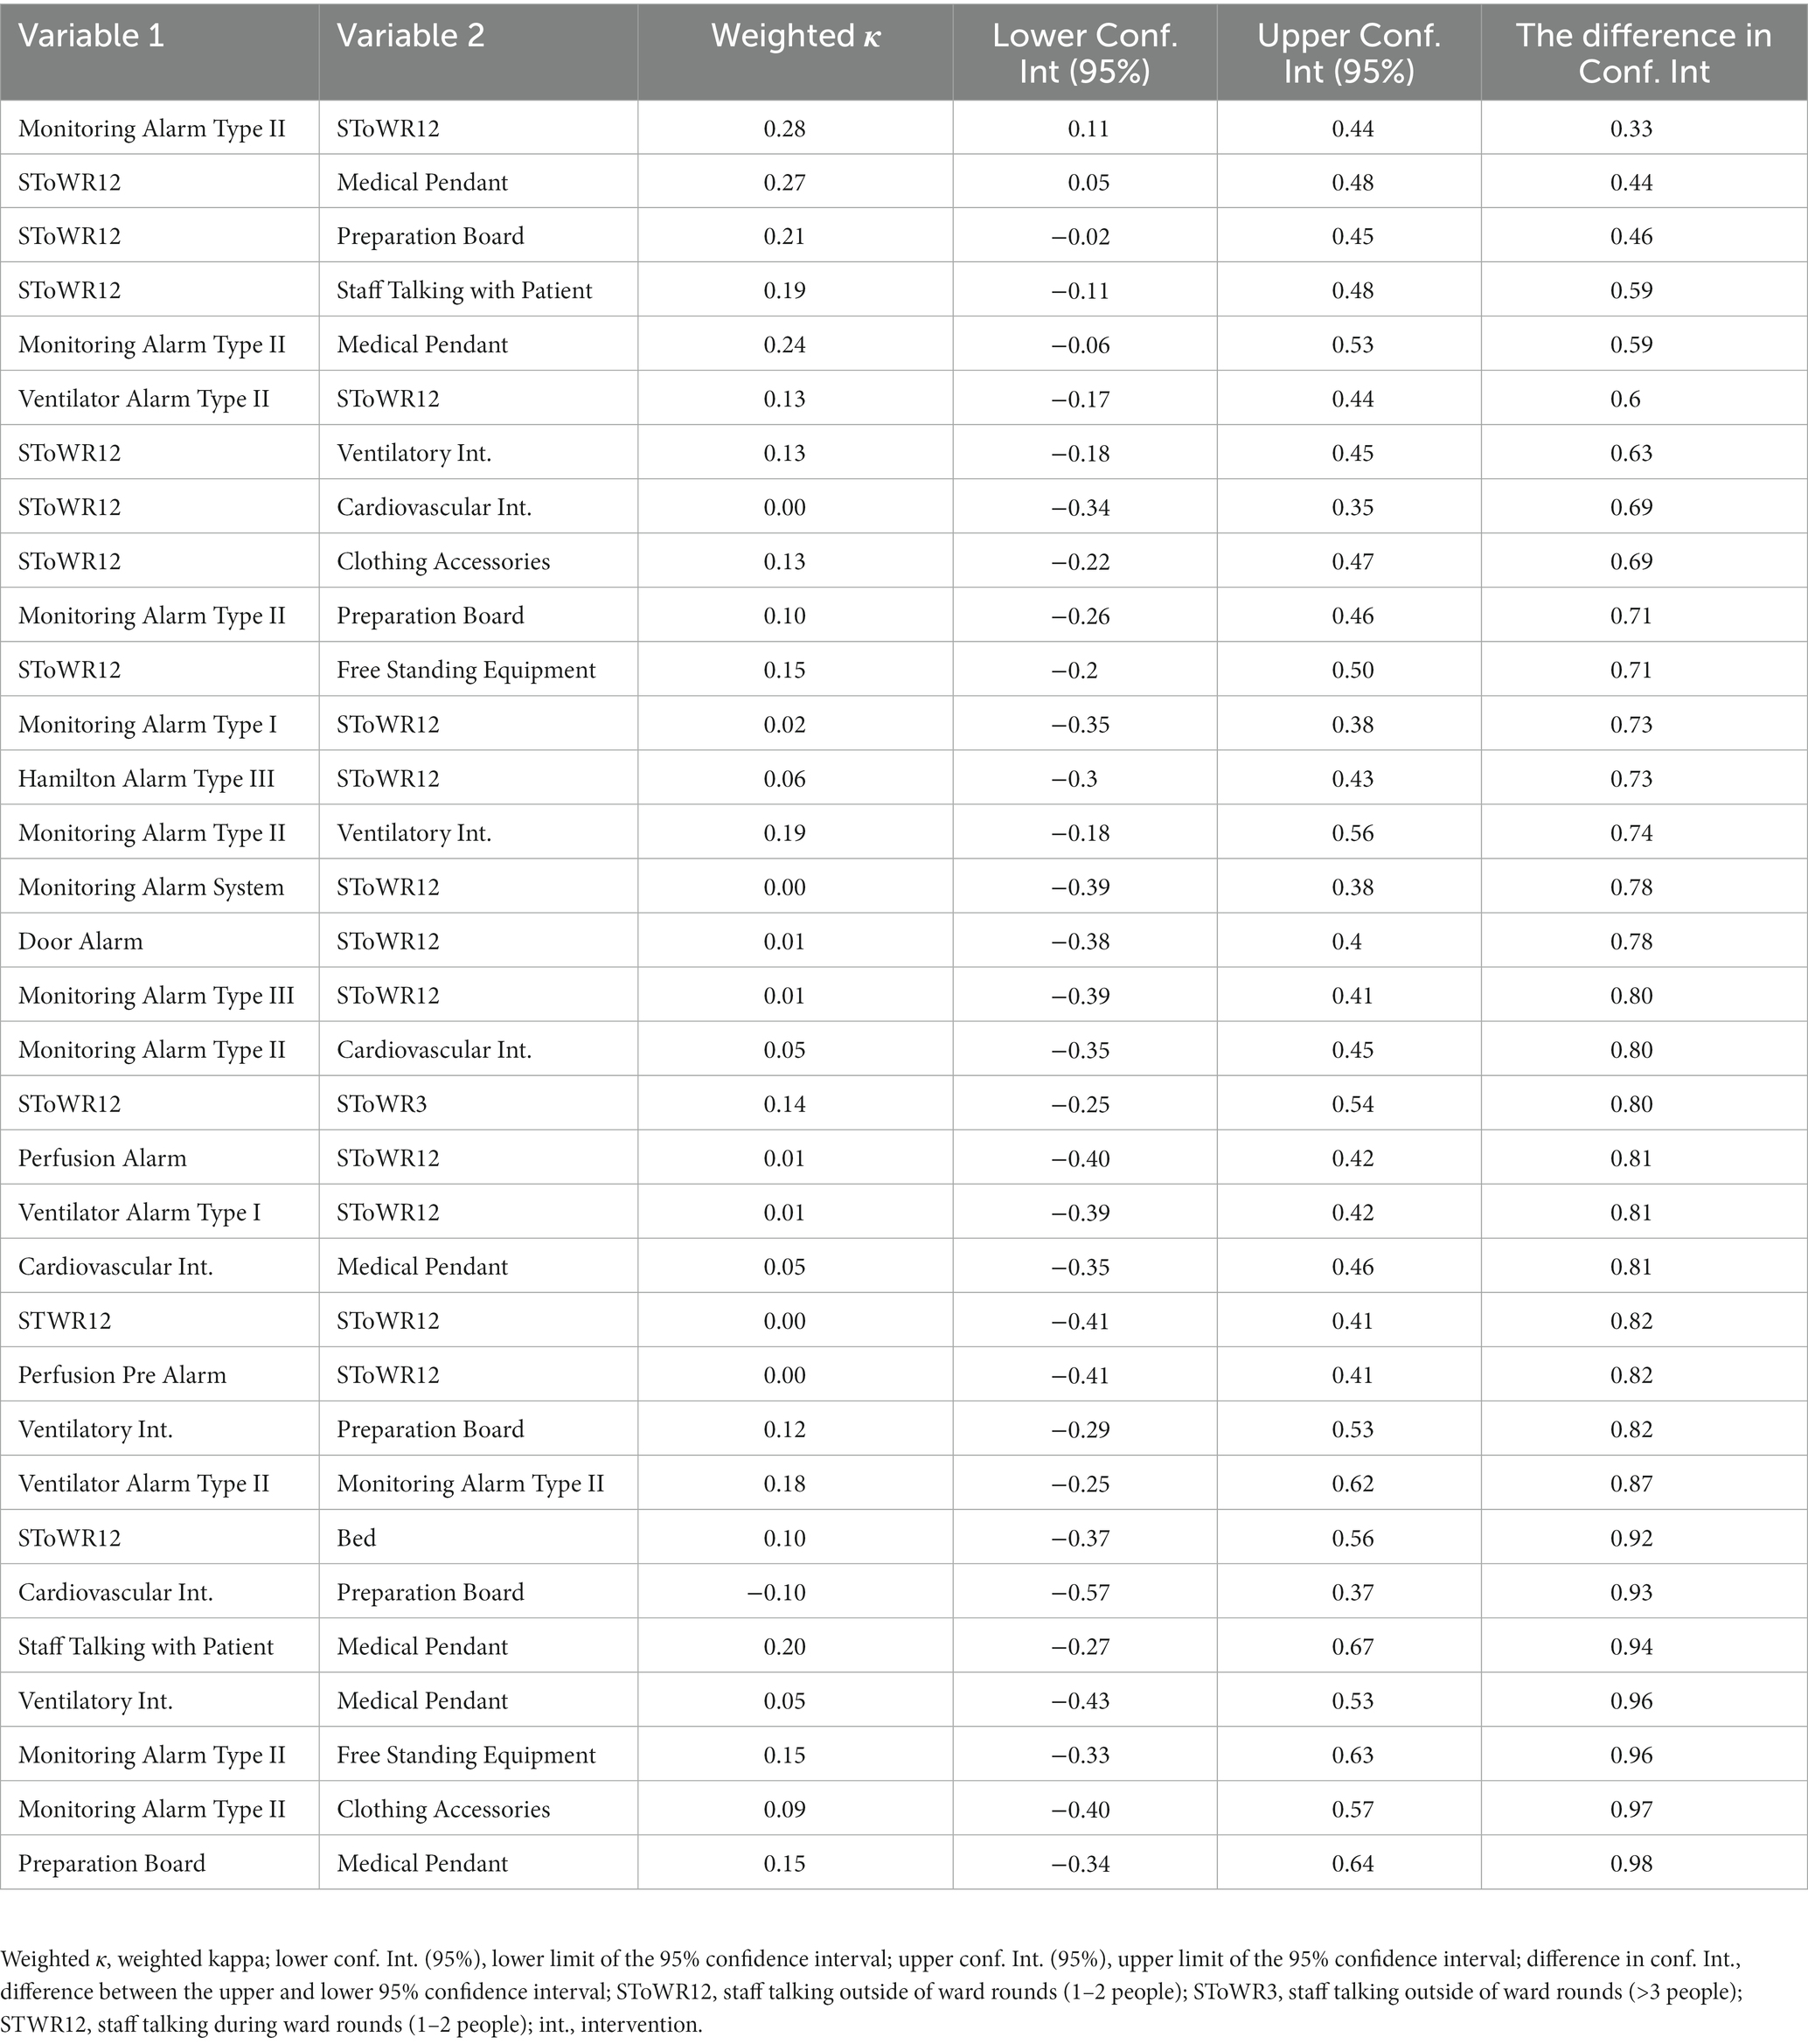
Table 4. Agreement between the sound sources.
Using the linear mixed-effect model, we evaluated the effects of the various sound sources on the sound pressure level of bed 1 and bed 2 (formula: LAeq ~ sound sources). The total explanatory power of the random-and fixed-effect model was R2 of 0.44 (conditional R2), with fixed effects accounting for 0.34 (marginal R2) of the variance alone. The intercept of the model was at 47.16 (95% CI = [45.46, 48.85], p < 0.001). Numerous sound sources were found to show a significant increase within the model (Table 5). Those presenting a change of greater than 3 dB were renal interventions (estimate = 3.87, 95% CI = [3.14, 4.60], p < 0.001) and continuous maintenance (estimate = 3.98, 95% CI = [3.37, 4.58], p < 0.001; Table 5). The five next highest estimates were noted with admission and discharge (estimate = 2.97, 95% CI = [2.00, 3.94], p < 0.001), three or more staff members talking outside of ward rounds for ≥2 min (estimate = 2.62, 95% CI = [2.14, 3.10], p < 0.001), radiological intervention (estimate = 2.27, 95% CI = [1.35, 3.19], p < 0.001), type II monitoring alarm for 5 min (estimate = 2.26, 95% CI = [1.80, 2.72], p < 0.001), and nursing tasks (estimate = 3.87, 95% CI = [1.39, 2.75], p < 0.001; Table 5). An increased duration of the sound sources increased the model estimates {e.g., type II monitoring alarm with a duration of 2 min [estimate = 0.87, 95% CI = (0.44, 1.30), p < 0.001] versus a duration of 5 min [estimate = 2.26, 95% CI = (1.80, 2.72), p < 0.001]; Table 5}.
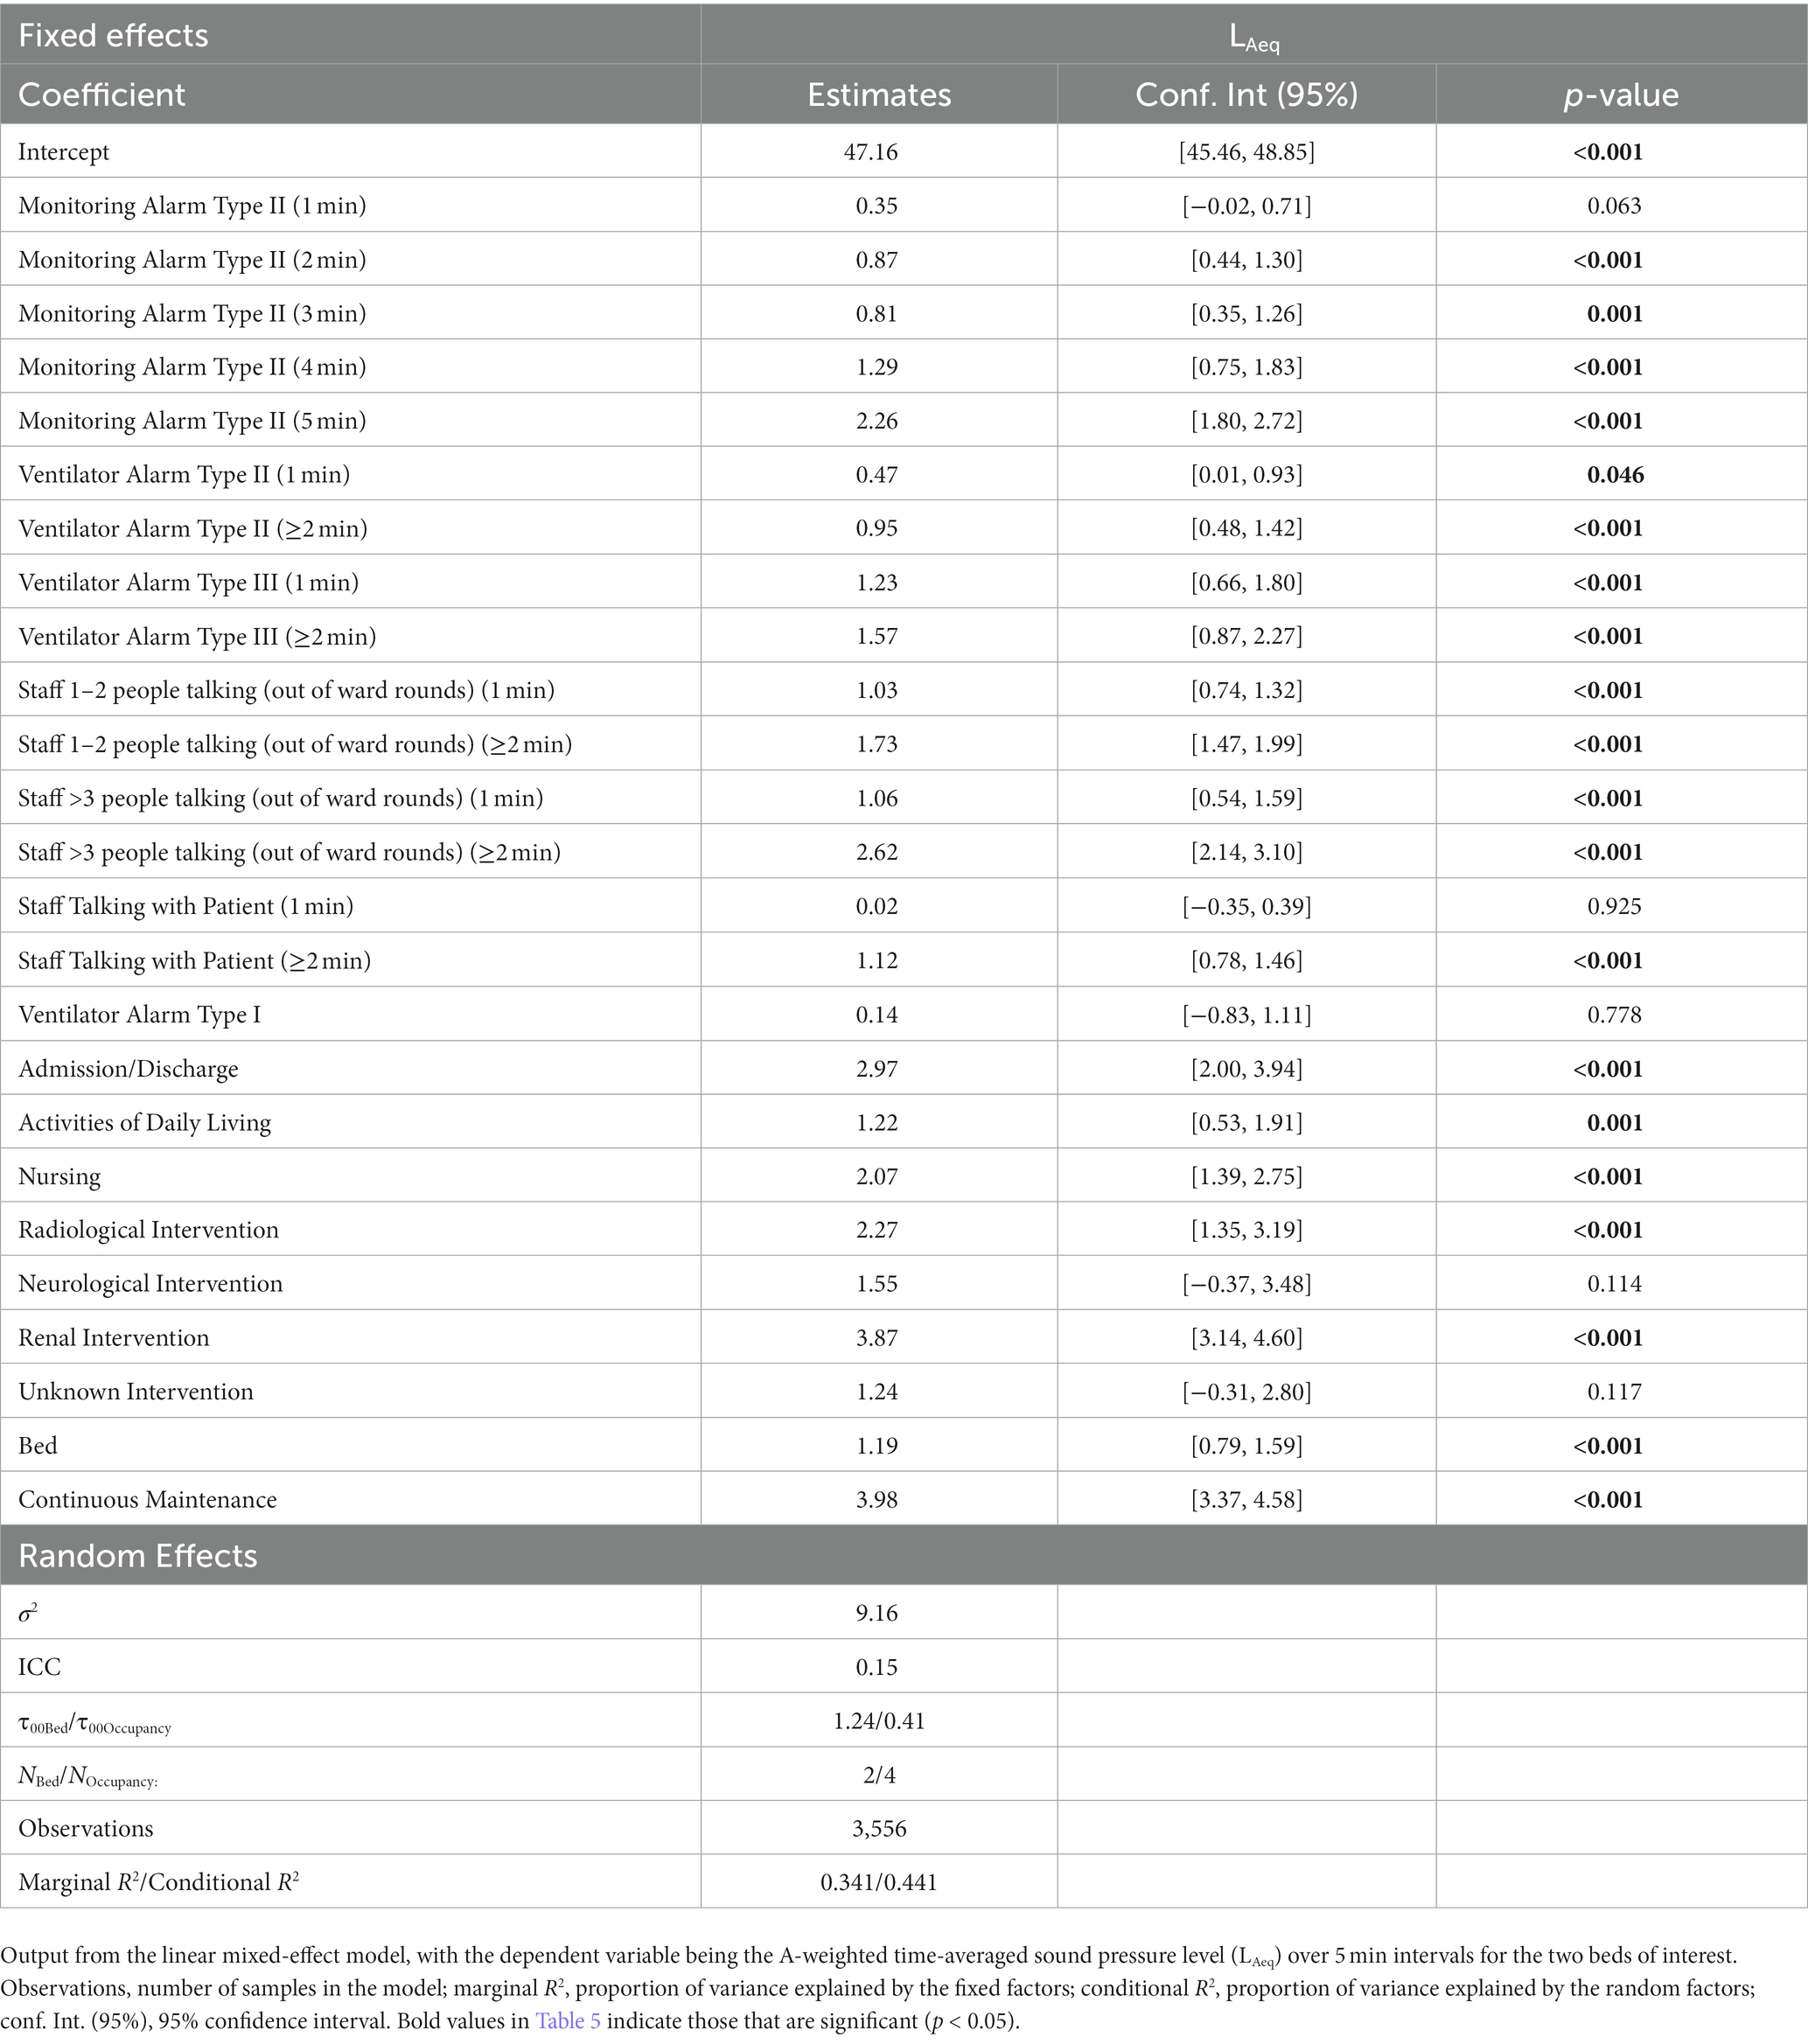
Table 5. Linear mixed-effect model: LAeq 5 min.
Within our 1 week continuous observation period, and in line with the goal of this work, we were able to identify the characteristics of the sound pressure levels across work shifts and sound level meter locations in the ICU. Specifically, we were able to confirm our first hypothesis by showing that it is possible to successfully identify and collect an exhaustive list of sound sources, and their duration of occurrence, over a continuous 7 day period. Furthermore, in line with our second hypothesis, it was possible to identify the greatest contributors to the overall sound pressure levels in our setting. This is an important step for the future implementation of effective interventions aimed at lowering these levels. Moreover, our work, based on a previously validated and repeatable method, acts as a reference for future work on this topic (26).
The results of our work showed no differences in the overall sound pressure levels, nor the maximum and minimum levels reached, during the 4 week recording period. Therefore, while it is possible that the individual sound sources differed from 1 week to another, these differences did not impact the overall sound pressure levels. These findings also highlight that even if some bias was introduced by the presence of an observer in the room, such bias was not sufficient to alter the overall sound pressure levels during the observation week. This notion was further examined in prior work and limited here in a few ways (26). Firstly, the staff were informed about the study and instructed not to interact with the study team members and to continue working normally. Additionally, the staff were informed that no identifying information was being written down, nor was the content of their conversations being noted. Finally, the continuous presence of an observer in the room makes it unlikely that staff would have been able to maintain any altered behavior for a prolonged period, should they have made adaptations.
Consistent with the literature, the LAeq recorded during this study confirms that the overall decibel levels surpass both the World Health Organization’s recommendations (35 dBA daytime; 30 dBA night time) and that of the Environmental Protection Agency (45 dBA daytime; 35 dBA nighttime) (12, 36). This is in line with findings from Busch-Vischniac et al. showing that no previously published results have found a hospital that complies with these recommendations (15). Moreover, the results found here, while above recommended levels, were lower than findings from other studies (16, 17, 19). Moreover, the minimum levels reached approximately 40 dBA levels during each shift, which is below the daytime recommendation set forth by the Environmental Protection Agency (36).
Regarding the restorative periods (LAeq < 50 dBA), the results highlight fewer restorative periods during the day shift than during the evening and night shifts. Furthermore, the restorative periods were most noted during the night shift but more frequently occurred on weekends than on weekdays. This finding is in line with the literature and what is expected, as there are fewer staff working and fewer interventions scheduled on weekends (17). The restorative periods in our study, particularly at night, are longer than those in the study by Ryherd et al. (35).
Apart from having significantly more restorative periods than bed 1, bed 2 was also significantly quieter than bed 1 and bed A. When the position of bed 2 was considered, it could be seen that this bed was bordered on two sides by walls. However, Darbyshire et al. (22) found that the majority of sounds in a four-ICU bed room came from areas adjacent to the head of patients, suggesting that sounds do not come from the sides of beds or neighboring beds. This latter notion is supported by the report by Tegnestedt et al. (17), who found no significant difference in the mean sound pressure levels between room types (i.e., one-versus three-bed rooms). However, this study found that disruptive sounds occurred less frequently in one-bed rooms than in three-bed rooms. Considering the layout of the four-bed room where the present study was conducted, it seems feasible that the beds in the middle of the room were louder owing to the presence of a preparation board at the foot end of these beds (Figure 2). This preparation board is the main area in the room where nurses for all four beds prepare medication, gather supplies, and often hold conversations. The results from our agreement calculation support this notion, showing a trend in the agreement between one to two staff members talking outside of ward rounds and activity at the preparation board. The preparation board was also found to display trends in agreement with type II patient monitoring alarms, cardiovascular interventions, ventilatory interventions, and medical pendants, suggesting that activity at the preparation board is often related to time-sensitive actions. However, this does not rule out that the elevated sound pressure levels recorded at bed A arise due to specific patient care taking place there.
These activities were also among the top sound sources, further supporting the notion that these activities may overlap in occurrence. Moreover, they largely align with the main sound sources found in the literature (16, 17, 20). Among the other top sound sources were staff talking among each other, with patients, and with visitors. Notably, staff talking during ward rounds, wherein multiple individuals enter the patient room simultaneously, was not considered an important contributor to the overall sound pressure levels. However, this may be attributed to the short duration of occurrence. Therefore, while moving ward rounds to a quieter location may be beneficial for information processing, it may have a limited influence on decreasing the sound pressure levels in the room (37). Another explanation as to why talking between individuals was not a significant contributor to the overall sound pressure levels could be explained by the mask requirement during this period. As all individuals entering the ICU were required to wear a non-fabric surgical mask this could have attenuated the sound pressure levels generated (38). As such, this is a limitation of our work but remains relevant in ICUs that still enforce mask mandates. Irrespective of their role on the overall sound pressure levels, talking activities may still affect patients. This is because humans typically perceive sounds with comprehensible content, such as speech, as more disturbing than those without, as well as sudden and short-lasting sounds as more bothersome than continuous sounds (39, 40). This also touches on the fact that how patients and staff perceive a sound can influence its tolerability. This is important because while previous work examining this question in healthcare professionals has found that they perceived short-lasting human sounds (e.g., shouts, laughing, moaning) as most disturbing, this was not found to be a significant contributor to the overall sound pressure levels in our study. Therefore, it would be important for future work to examine how the greatest contributors to sound pressure levels, and the sound sources that occur most often, are perceived by patients and staff.
That being said, the results of the linear mixed-effect model point to two main activities that could be targeted to decrease the overall sound pressure levels in the room. Specifically, continuous maintenance in the room, including emptying, cleaning, and preparation of the room for another patient, was responsible for an almost 4 dB increase in the overall sound pressure level, with the arrival or discharge of a patient accounting for almost an additional 3 dB increase. Therefore, activities related to these procedures should be further investigated to decrease the overall sound pressure levels in the ICU. Renal interventions, such as dialysis, also accounted for an almost 4 dB increase in the overall sound pressure levels. This is likely attributed to the continuous sound produced by the dialysis machine, rather than any dialysis-related alarms, which may imply that such interventions should potentially be moved into designated areas to reduce the overall sound pressure level in shared rooms. Our results also suggest that addressing alarms as rapidly as possible can also help decrease the overall sound pressure levels. While our results are in line with those by Vreman et al. (33), who also concluded that alarms do not greatly contribute to the mean sound pressure levels in the ICU, we found that the amount alarms contribute increases in line with their duration. Therefore, we do not exclude the possibility that alarms can become significant contributors to the overall sound pressure levels should they be allowed to continue for prolonged periods.
Accordingly, we cannot conclude that reducing medical equipment alarms is the best approach for reducing the sound pressure levels, as expressed as desirable by healthcare professionals (40). Instead, our results clearly demonstrate that specific activities and processes should be targeted to decrease the overall sound pressure level. We specifically recommend that future studies investigate how processes such as cleaning and preparing patient rooms and admitting and discharging patients are conducted and how they may be adapted to decrease their contribution to the sound pressure levels. Moreover, interventions such as renal, radiological, cardiovascular, and ventilatory interventions may be further studied to identify why these interventions greatly contribute to the overall levels. The findings may be used to study how aspects of such interventions could be transferred to locations further from patient beds. However, the feasibility of making such changes will remain challenging owing to the structural limitations of ICU wards and patient rooms. A more feasible change may be to address clothing accessories. Perhaps a less expected sound source, clothing accessories were among the most frequently noted sound sources occurring approximately 10% of the time in bed 1 and 7% in bed 2. These sounds arise from objects attached to the clothing, such as keys, badges, and pens, hitting each other while walking or even hitting the bed or equipment while bending over. Although seemingly insignificant, targeting such aspects of the ICU environment could be a simple and efficient way of reducing a recurrent sound source.
An important limitation of this study is that not all sound sources occurred equally, which must be considered when comparing them. Nevertheless, the week selected for the study was likely representative of an average week in terms of the sound pressure levels and representative of real working conditions. Future work could consider this and investigate how the various sound sources compare when corrected for their frequency of occurrence. Due to a second limitation, owing to the study design, we were unable to determine whether certain diagnoses were associated with higher sound pressure levels than others, but which could be explored in future work. Additionally, owing to the sheer number of sounds produced, it was impossible to note what aspects of a sound source were responsible for the greatest contribution to the sound pressure levels. For example, during the various interventions, it was impossible to determine whether the sound came from the opening of the packaging, the equipment used, or some other source responsible for contributing the most to the sound pressure levels. These aspects of sound sources could interest future researchers and enable the creation of interventions for decreasing the sound pressure levels in a given setting.
Additional limitations faced by our study include the lack of sleep assessment, meaning that it was not possible to determine how the sound pressure levels and sound sources highlighted in this study affect patient sleep. This would be important to investigate in future research due to the relationship between sleep disruption and various psychophysiological effects, which can in turn increase pain perception, hinder recovery, and increase mortality (41–43). Moreover, our study failed to conduct an objective measurement of the baseline background sound pressure levels created by structural systems, for example any air filtration systems. During the measurement period the ward was always in use and the room occupied by at minimum one patient. Therefore, nothing can be said about how such air filtration systems contribute to the overall sound pressure levels, or whether other sounds are louder because of this (e.g., talking louder to overcome the baseline).
Decreasing the elevated sound pressure levels that continuously surpass recommended levels is an important step to improve patient and staff wellbeing in the intensive care unit. Findings from our 1 week continuous recording have found that to achieve this, future interventions should target continuous maintenance of the patient area, patient admissions and discharges, and renal interventions; these sound sources are responsible for the greatest changes in the sound pressure levels and are detectable by the human ear. We also determined that one to two staff members talking in the room occurred for the greatest amount of time, and while not a significant contributor to the overall sound pressure levels, may still play an indirect role in patient wellbeing. Overall, identifying these sound sources can have a meaningful impact on patients and staff by identifying targets for future interventions to decrease the sound pressure levels, thus leading to a healthier environment.
The original contributions presented in the study are included in the article/Supplementary material, further inquiries can be directed to the corresponding author.
AN, NR, SK, and SG designed the study, collected data, analyzed the data, and were involved in the writing, editing, and reviewing of the manuscript. MR, M-MJ, BZ, RM, JS, and TN assisted in the data collection and study design, and were involved in editing and reviewing the manuscript. All authors contributed to the article and approved the submitted version.
Open access funding by University Of Bern.
The study team would like to thank the intensive care staff at the University Hospital Bern (Inselspital), who allowed us to observe their work. The team would also like to thank Pia Buri for helping us understand how alarms can be collected from individual devices and Lukas Bütikofer (Ph.D.) from CTU Bern for his statistical support.
M-MJ, BZ, and JS report grants from Orion Pharma, Abbott Nutrition International, B. Braun Medical AG, CSEM AG, Edwards Lifesciences Services GmbH, Kenta Biotech Ltd., Maquet Critical Care AB, Omnicare Clinical Research AG, Nestle, Pierre Fabre Pharma AG, Pfizer, Bard Medica S.A., Abbott AG, Anandic Medical Systems, Pan Gas AG Healthcare, Bracco, Hamilton Medical AG, Fresenius Kabi, Getinge Group Maquet AG, Dräger AG, Teleflex Medical GmbH, Glaxo Smith Kline, Merck Sharp and Dohme AG, Eli Lilly, and Company, Baxter, Astellas, Astra Zeneca, CSL Behring, Novartis, Covidien, Hemotune, Phagenesis, Philips Medical, Prolong Pharmaceuticals, and Nycomed outside the submitted work. The money received was paid into departmental funds. No personal financial gain was applied.
The remaining authors declare that the research was conducted in the absence of any commercial or financial relationships that could be construed as a potential conflict of interest.
All claims expressed in this article are solely those of the authors and do not necessarily represent those of their affiliated organizations, or those of the publisher, the editors and the reviewers. Any product that may be evaluated in this article, or claim that may be made by its manufacturer, is not guaranteed or endorsed by the publisher.
The Supplementary material for this article can be found online at: https://www.frontiersin.org/articles/10.3389/fmed.2023.1219257/full#supplementary-material
1. Aaron, JN, Carlisle, CC, Carskadon, MA, Meyer, TJ, Hill, NS, and Millman, RP. Environmental noise as a cause of sleep disruption in an intermediate respiratory care unit. Sleep. (1996) 19:707–10. doi: 10.1093/sleep/19.9.707
2. Basner, M, Babisch, W, Davis, A, Brink, M, Clark, C, Janssen, S, et al. Auditory and non-auditory effects of noise on health. Lancet. (2014) 383:1325–32. doi: 10.1016/S0140-6736(13)61613-X
3. Morrison, WE, Haas, EC, Shaffner, DH, Garrett, ES, and Fackler, JC. Noise, stress, and annoyance in a pediatric intensive care unit. Crit Care Med. (2003) 31:113–9. doi: 10.1097/00003246-200301000-00018
4. Freedman, NS, Gazendam, J, Levan, L, Pack, AI, and Schwab, RJ. Abnormal sleep/wake cycles and the effect of environmental noise on sleep disruption in the intensive care unit. Am J Respir Crit Care Med. (2001) 163:451–7. doi: 10.1164/ajrccm.163.2.9912128
5. Honarmand, K, Rafay, H, Le, J, Mohan, S, Rochwerg, B, Devlin, JW, et al. A systematic review of risk factors for sleep disruption in critically ill adults. Crit Care Med. (2020) 48:1066–74. doi: 10.1097/CCM.0000000000004405
6. Kamdar, BB, Needham, DM, and Collop, NA. Sleep deprivation in critical illness: its role in physical and psychological recovery. J Intensive Care Med. (2012) 27:97–111. doi: 10.1177/0885066610394322
7. Topf, M, Bookman, M, and Arand, D. Effects of critical care unit noise on the subjective quality of sleep. J Adv Nurs. (1996) 24:545–51. doi: 10.1046/j.1365-2648.1996.22315.x
8. Delaney, LJ, Currie, MJ, Huang, H-CC, Lopez, V, and Van Haren, F. “They can rest at home”: an observational study of patients’ quality of sleep in an Australian hospital. BMC Health Serv Res. (2018) 18:524. doi: 10.1186/s12913-018-3201-z
9. Sangari, A, Emhardt, EA, Salas, B, Avery, A, Freundlich, RE, Fabbri, D, et al. Delirium variability is influenced by the sound environment (DEVISE study): how changes in the intensive care unit soundscape affect delirium incidence. J Med Syst. (2021) 45:76. doi: 10.1007/s10916-021-01752-5
10. van de Pol, I, van Iterson, M, and Maaskant, J. Effect of nocturnal sound reduction on the incidence of delirium in intensive care unit patients: an interrupted time series analysis. Intensive Crit Care Nurs. (2017) 41:18–25. doi: 10.1016/j.iccn.2017.01.008
11. Alidosti, M, Babaei Heydarabadi, A, Baboli, Z, Nazarbigi, H, and Mobasheri, M. Association between job burnout and noise pollution among nurses in Behbahan city. Iran Q J Fundam Mental Health. (2016) 18:103–8. doi: 10.22038/JFMH.2016.6676
12. Berglund, B, Lindvall, T, and Schwela, DH, Organization WH. Guidelines for community noise. Stockholm Sweden: World Health Organization (1999). 1999 p.
13. Pugh, RJ, Jones, C, and Griffiths, R. Editors. The impact of noise in the intensive care unit. Intensive care medicine: annual update 2007 Springer (2007).
14. Topf, M, and Dillon, E. Noise-induced stress as a predictor of burnout in critical care nurses. Heart Lung. (1988) 17:567–74.
15. Busch-Vishniac, IJ, West, JE, Barnhill, C, Hunter, T, Orellana, D, and Chivukula, R. Noise levels in Johns Hopkins Hospital. J Acoust Soc Am. (2005) 118:3629–45. doi: 10.1121/1.2118327
16. Delaney, LJ, Currie, MJ, Huang, HC, Lopez, V, Litton, E, and Van Haren, F. The nocturnal acoustical intensity of the intensive care environment: an observational study. J Intensive Care. (2017) 5:41. doi: 10.1186/s40560-017-0237-9
17. Tegnestedt, C, Günther, A, Reichard, A, Bjurström, R, Alvarsson, J, Martling, C, et al. Levels and sources of sound in the intensive care unit–an observational study of three room types. Acta Anaesth Scand. (2013) 57:1041–50. doi: 10.1111/aas.12138
18. Luetz, A, Weiss, B, Penzel, T, Fietze, I, Glos, M, Wernecke, K, et al. Feasibility of noise reduction by a modification in ICU environment. Physiol Meas. (2016) 37:1041–55. doi: 10.1088/0967-3334/37/7/1041
19. Mac Kenzie, D, and Galbrun, L. Noise levels and noise sources in acute care hospital wards. Build Serv Eng Res T. (2007) 28:117–31. doi: 10.1177/0143624406074468
20. Park, M, Kohlrausch, A, and Bruijn, W, (Eds.), Source-specific analysis of the noise in an intensive care unit. Proceedings of the 42nd international congress and exposition on noise control engineering (2013)
21. Kahn, DM, Cook, TE, Carlisle, CC, Nelson, DL, Kramer, NR, and Millman, RP. Identification and modification of environmental noise in an ICU setting. Chest. (1998) 114:535–40. doi: 10.1378/chest.114.2.535
22. Darbyshire, JL, Muller-Trapet, M, Cheer, J, Fazi, FM, and Young, JD. Mapping sources of noise in an intensive care unit. Anaesthesia. (2019) 74:1018–25. doi: 10.1111/anae.14690
23. Cho, OM, Kim, H, Lee, YW, and Cho, I. Clinical alarms in intensive care units: perceived obstacles of alarm management and alarm fatigue in nurses. Healthc Inform Res. (2016) 22:46–53. doi: 10.4258/hir.2016.22.1.46
24. Petersen, EM, and Costanzo, CL. Assessment of clinical alarms influencing Nurses’ perceptions of alarm fatigue. Dimens Crit Care Nurs. (2017) 36:36–44. doi: 10.1097/DCC.0000000000000220
25. Konkani, A, and Oakley, B. Noise in hospital intensive care units—a critical review of a critical topic. J Crit Care. (2012) 27:522.e1. doi: 10.1016/j.jcrc.2011.09.003
26. Naef, AC, Knobel, SE, Ruettgers, N, Jeitziner, M-M, Mg, H, Zante, B, et al. Methods for measuring and identifying sounds in the intensive care unit. Front Med. (2022) 9:836203. doi: 10.3389/fmed.2022.836203
27. Wallis, R, Harris, E, Lee, H, Davies, W, and Astin, F. Environmental noise levels in hospital settings: a rapid review of measurement techniques and implementation in hospital settings. Noise Health. (2019) 21:200–16. doi: 10.4103/nah.NAH_19_18
28. Simons, KS, Park, M, Kohlrausch, A, van den Boogaard, M, Pickkers, P, de Bruijn, W, et al. Noise pollution in the ICU: time to look into the mirror. Crit Care. (2014) 18:1–2. doi: 10.1186/s13054-014-0493-1
29. Delaney, L, Litton, E, and Van Haren, F. The effectiveness of noise interventions in the ICU. Curr Opin Anaesthesiol. (2019) 32:144–9. doi: 10.1097/ACO.0000000000000708
30. Murphy, E, and King, EA. Chapter 2- principles of environmental noise, E Murphy and EA King, (Eds.) Environmental Noise Pollution. Boston: Elsevier; (2014). p. 9–49
31. Harrison, M. Vehicle refinement: controlling noise and vibration in road vehicles Elsevier (2004).
32. Institute ANS. American National Standard Specification for sound level meters: ANSI S1. 4A-1985 amendment to ANSI S1 4-1983 Acoustical Society of America (1985).
33. Vreman, J, van Loon, LM, van den Biggelaar, W, van der Hoeven, JG, Lemson, J, and van den Boogaard, M. Contribution of alarm noise to average sound pressure levels in the ICU: an observational cross-sectional study. Intensive Crit Care Nurs. (2020) 61:102901. doi: 10.1016/j.iccn.2020.102901
34. Darbyshire, JL, and Young, JD. An investigation of sound levels on intensive care units with reference to the WHO guidelines. Crit Care. (2013) 17:1–8. doi: 10.1186/cc12870
35. Ryherd, EE, Waye, KP, and Ljungkvist, L. Characterizing noise and perceived work environment in a neurological intensive care unit. J Acoust Soc Am. (2008) 123:747–56. doi: 10.1121/1.2822661
36. Abatement USOoN. Information on levels of environmental noise requisite to protect public health and welfare with an adequate margin of safety US Government Printing Office (1974).
37. Erne, K, Knobel, SEJ, Naef, AC, Gerber, SM, Fischer, T, Mast, FW, et al. Influence of noise manipulation on retention in a simulated ICU ward round: an experimental pilot study. Intensive Care Med Exp. (2022) 10:3. doi: 10.1186/s40635-022-00430-1
38. Corey, RM, Jones, U, and Singer, AC. Acoustic effects of medical, cloth, and transparent face masks on speech signals. J Acoust Soc Am. (2020) 148:2371–5. doi: 10.1121/10.0002279
39. Passchier-Vermeer, W, and Passchier, WF. Noise exposure and public health. Environ Health Perspect. (2000) 108:123–31. doi: 10.1289/ehp.00108s1123
40. Ruettgers, N, Naef, AC, Rossier, M, Knobel, SE, Jeitziner, M-M, Grosse Holtforth, M, et al. Perceived sounds and their reported level of disturbance in intensive care units: a multinational survey among healthcare professionals. PLoS One. (2022) 17:e0279603. doi: 10.1371/journal.pone.0279603
41. Chang, VA, Owens, RL, and LaBuzetta, JN. Impact of sleep deprivation in the neurological intensive care unit: a narrative review. Neurocrit Care. (2020) 32:596–608. doi: 10.1007/s12028-019-00795-4
42. Delaney, LJ, Van Haren, F, and Lopez, V. Sleeping on a problem: the impact of sleep disturbance on intensive care patients - a clinical review. Ann Intensive Care. (2015) 5:3. doi: 10.1186/s13613-015-0043-2
Keywords: intensive care unit, noise, sound level meters, hospital, decibels, sound pressure levels, sound sources
Citation: Naef AC, Knobel SEJ, Ruettgers N, Rossier M, Jeitziner M-M, Zante B, Müri RM, Schefold JC, Nef T and Gerber SM (2023) Characterization of sound pressure levels and sound sources in the intensive care unit: a 1 week observational study. Front. Med. 10:1219257. doi: 10.3389/fmed.2023.1219257
Edited by:
Rahul Kashyap, WellSpan Health, United StatesReviewed by:
Rahul Vojjini, Mayo Clinic, United StatesCopyright © 2023 Naef, Knobel, Ruettgers, Rossier, Jeitziner, Zante, Müri, Schefold, Nef and Gerber. This is an open-access article distributed under the terms of the Creative Commons Attribution License (CC BY). The use, distribution or reproduction in other forums is permitted, provided the original author(s) and the copyright owner(s) are credited and that the original publication in this journal is cited, in accordance with accepted academic practice. No use, distribution or reproduction is permitted which does not comply with these terms.
*Correspondence: Stephan M. Gerber, c3RlcGhhbi5tLmdlcmJlckB1bmliZS5jaA==
†These authors have contributed equally to this work and share last authorship
Disclaimer: All claims expressed in this article are solely those of the authors and do not necessarily represent those of their affiliated organizations, or those of the publisher, the editors and the reviewers. Any product that may be evaluated in this article or claim that may be made by its manufacturer is not guaranteed or endorsed by the publisher.
Research integrity at Frontiers
Learn more about the work of our research integrity team to safeguard the quality of each article we publish.