 Luka Beverin
 Marko Topalovic
 Armin Halilovic2
 Paul Desbordes
 Maarten De Vos
94% of researchers rate our articles as excellent or good
Learn more about the work of our research integrity team to safeguard the quality of each article we publish.
Find out more
ORIGINAL RESEARCH article
Front. Med. , 19 May 2023
Sec. Pulmonary Medicine
Volume 10 - 2023 | https://doi.org/10.3389/fmed.2023.1174631
This article is part of the Research Topic Artificial Intelligence and Big Data for Value-Based Care - Volume II View all 8 articles
Background and objective: Spirometry patterns can suggest that a patient has a restrictive ventilatory impairment; however, lung volume measurements such as total lung capacity (TLC) are required to confirm the diagnosis. The aim of the study was to train a supervised machine learning model that can accurately estimate TLC values from spirometry and subsequently identify which patients would most benefit from undergoing a complete pulmonary function test.
Methods: We trained three tree-based machine learning models on 51,761 spirometry data points with corresponding TLC measurements. We then compared model performance using an independent test set consisting of 1,402 patients. The best-performing model was used to retrospectively identify restrictive ventilatory impairment in the same test set. The algorithm was compared against different spirometry patterns commonly used to predict restriction.
Results: The prevalence of restrictive ventilatory impairment in the test set is 16.7% (234/1402). CatBoost was the best-performing machine learning model. It predicted TLC with a mean squared error (MSE) of 560.1 mL. The sensitivity, specificity, and F1-score of the optimal algorithm for predicting restrictive ventilatory impairment was 83, 92, and 75%, respectively.
Conclusion: A machine learning model trained on spirometry data can estimate TLC to a high degree of accuracy. This approach could be used to develop future smart home-based spirometry solutions, which could aid decision making and self-monitoring in patients with restrictive lung diseases.
Restrictive lung disorders are a group of conditions that affect the ability of the lungs to expand fully, resulting in reduced lung capacity and difficulty breathing. These conditions are typically caused by either intrinsic or extrinsic factors, such as interstitial lung diseases or chestwall problems (1). Patients with restrictive lung disorders often experience a decreased quality of life and increased morbidity, as the reduced lung capacity can make it difficult for them to engage in physical activities and perform everyday tasks (2). While the true population prevalence of restrictive diseases is unknown, it is estimated that the occurrence is 3–6 persons per 100,000 in the United States (3).
The diagnostic criterion for restrictive lung disease is a total lung capacity (TLC) that falls below the lower limit of normal (LLN), which is defined as the fifth percentile of a healthy population. The measurement of TLC can be obtained using five different standardized methods: whole-body plethysmography (WBP), helium dilution, nitrogen gas washout, chest radiographs, and computed tomography scanning (4, 5). However, these methods are not widely available in primary care, require expert knowledge and are costly for routine use. As a result, primary care clinicians often rely on spirometry results to identify potential cases of lung restriction and decide which patients should undergo further pulmonary function testing.
In recent years, the use of home-based spirometry to monitor lung function in patients with interstitial lung disease (ILD) has gained attention in clinical practice and research (6–8). Home-based spirometry has the potential to increase convenience and accessibility for patients with ILD, improve the frequency of data collection, and make it easier for patients to receive regular assessments of their lung function. In addition, the integration of smartphone applications has facilitated communication and collaboration between patients and healthcare providers. With advances in machine learning (ML) and an increasing amount of health data available for analysis, it is becoming more feasible to use ML algorithms to improve both the quality and the interpretation of pulmonary function testing (9, 10). Despite the potential benefits of using ML in home-based spirometry, most research has focused on automating current human tasks (e.g., diagnosis). Besides, ML approaches have also the potential to estimate non-standard values that have clinical impact, like TLC values.
The objective of this study was to train a supervised ML model to predict TLC values using patient characteristics and data from spirometry. The secondary objective was to investigate whether these predictions could be used to accurately identify restrictive lung impairment defined as TLC < LLN, where reference values are derived from the 2012 global lung initiative (GLI) equations (11). We evaluate the performance of our model on an independent dataset and compare its ability to identify restrictive lung impairment to commonly used clinical guidelines (2005 ATS/ERS standards). Overall, our study investigates the potential use of ML to aid in decision-making in office and home-based spirometry by providing accurate and timely predictions of TLC. Moreover, it allows to investigate in which patient population such ML-based prediction might be most beneficial.
In this study, we obtained data from two different sources: ArtiQ1 and University Hospital Leuven. The data from ArtiQ is used to train and tune the ML models, whereas the Hospital data is used as an independent test set to evaluate each model’s ability to predict TLC and subsequently identify restrictive lung impairment. Both datasets contain only Caucasian patients. The training data collected from ArtiQ consists of patient characteristics and spirometry measurements with a known TLC value. To detect anomalies, we implemented the Isolation Forest algorithm with 100 base estimators (12). We removed all observations with an anomaly score at or above the 99th percentile. After pre-processing, we were left with 51,761 unique observations where each observation represented a different patient.
The independent test data set consists of 1,402 patients who performed spirometry and WBP. This data set is formed by combining two different cohorts that were studied in previous work:
1. a prospective cohort study on first-time admissions in a population-based sample (13), and
2. a retrospective cohort study of PFT data (14).
More details on the studies can be found in the corresponding publications. Each subject had a validated clinical diagnosis based on their medical history and complete PFT. Collected data for testing the models are from studies approved by the Ethics Committee of the University Hospital in Leuven. The combined cohort data set included patients diagnosed with obstructive (n = 885) and restrictive (n = 288) lung disorders, as well as healthy individuals (n = 229). All patients included in the studies provided informed consent. A cohort description is provided in Table 1.
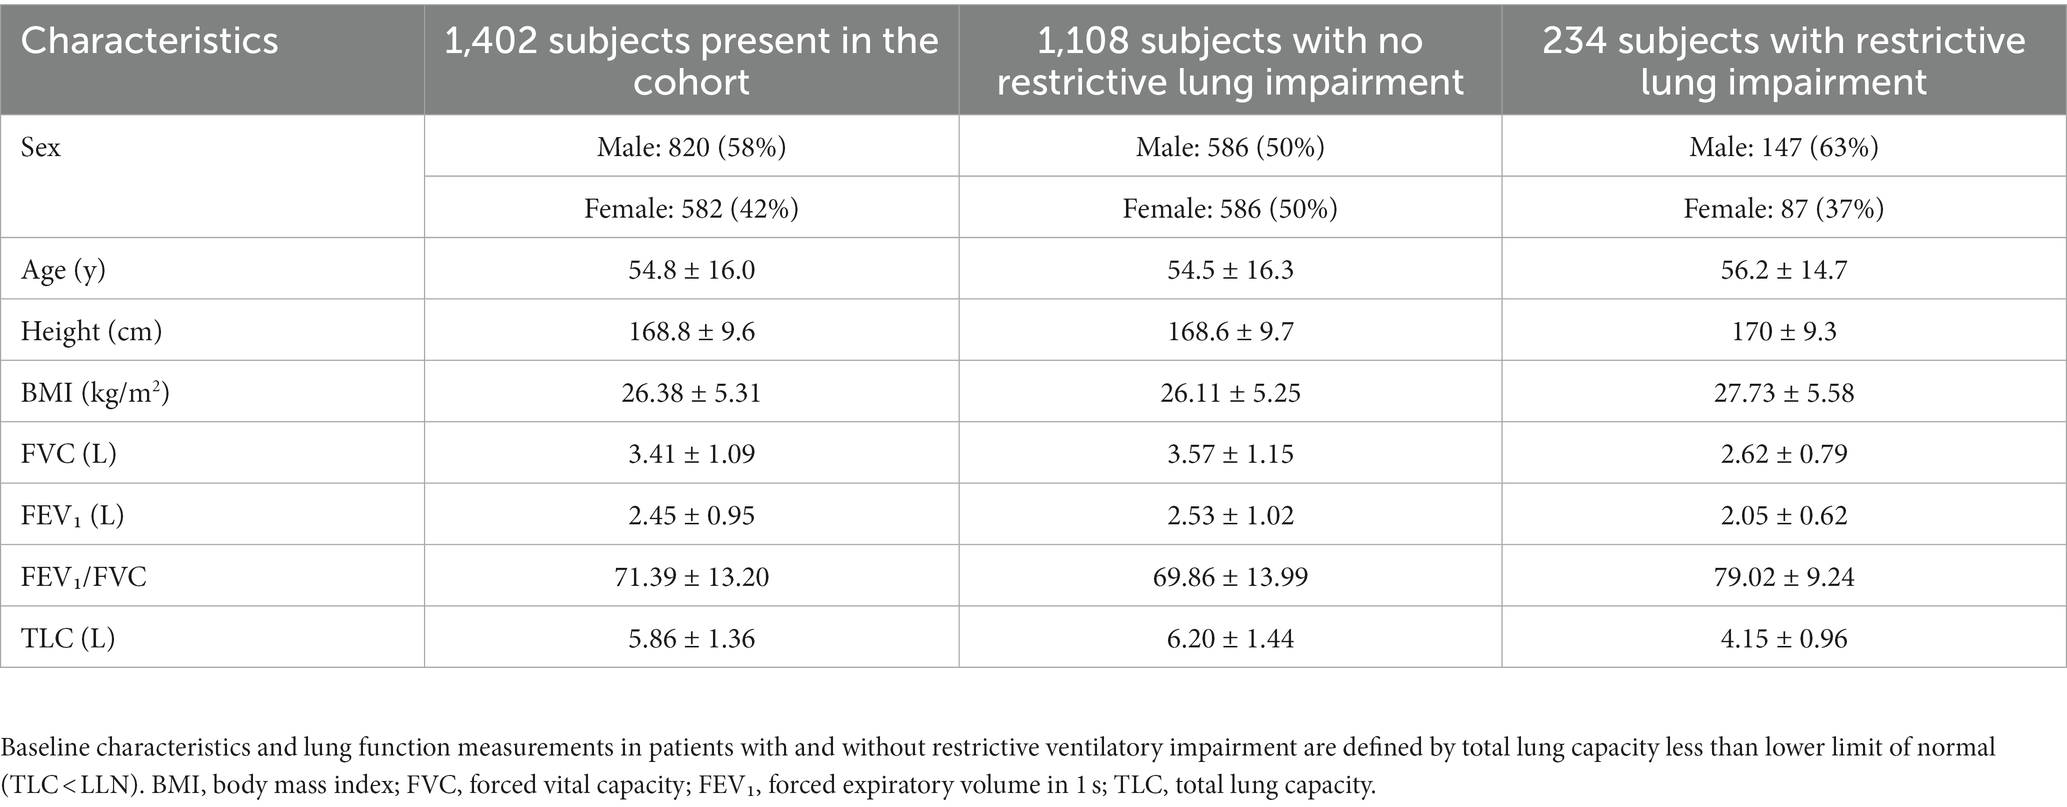
Table 1. Data are presented as mean +/-standard deviation, or number (%).
For the predicton of TLC, we trained three tree-based ML models - Random Forest (RF) (15), Extreme Gradient Boosting (XGBoost) (16), and Categorical Boosting (CatBoost) (17). These algorithms are well suited for tabular data sets, and are commonly used in industry, research, and competitions. The final feature set used for model training consisted of patient characteristics (e.g., age, height, gender, and weight) and well-known spirometry measurements (e.g., FVC, FEV₁, FEV₁/FVC, peak expiratory flow and forced expiratory flow at different percentages of FVC). For the XGBoost and RF models, one-hot encoding was applied to the categorical feature (gender). These were all the features available for use in the model training.
Hyper-parameters of the models were fine-tuned through a randomized search (18) with 220 sampled hyper-parameters. To develop the XGBoost model, a total of 43,200 possible combinations were considered. For the CatBoost and RF models, 30,870 and 672 possible combinations were considered, respectively. To find the optimal combination of hyper-parameters, we applied k-Fold Cross-Validation (k-fold CV) to the training data set (19). The value of k was set to 5 when performing k-fold CV because we found it to provide a good balance between computing time, bias, and variance. We then selected the hyper-parameters that resulted in the lowest CV mean squared error (MSE). The modeling process is depicted in Figure 1. For all models, we constructed hyper-parameter grid values that are in accordance with existing literature and best practices from competitive data science platforms such as Kaggle.2
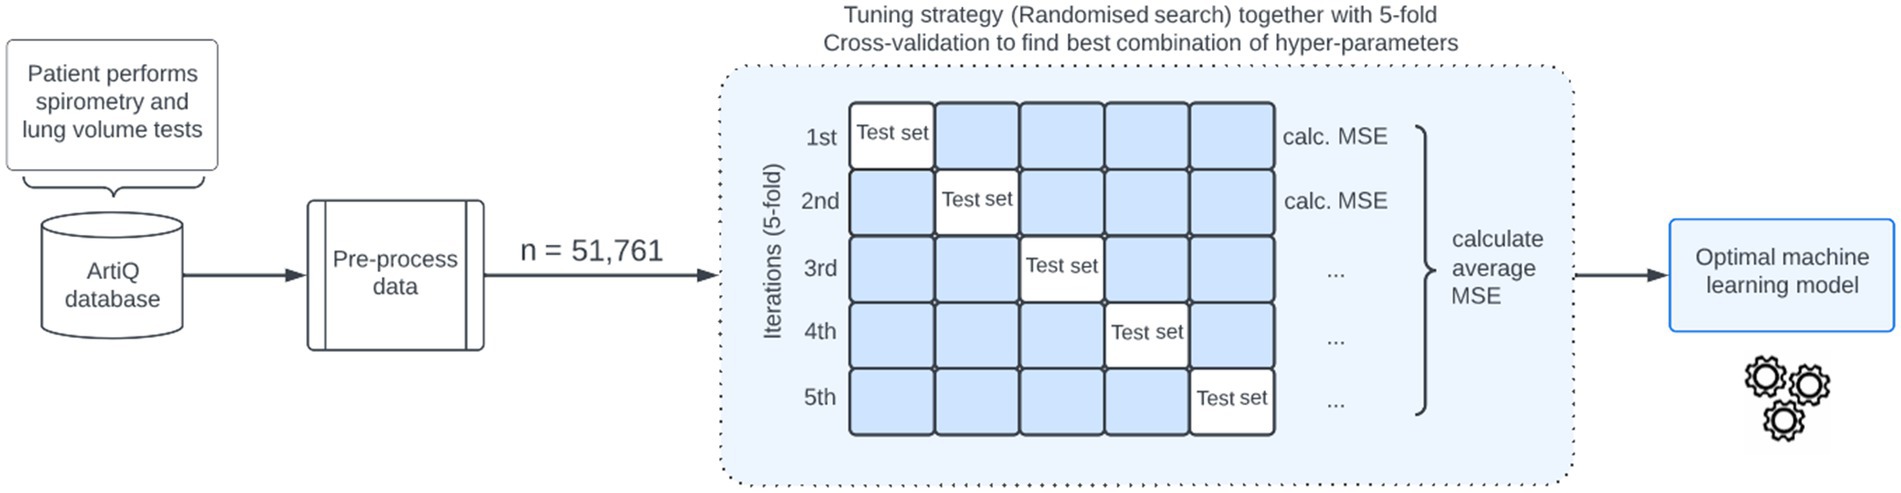
Figure 1. Illustration of the machine learning-based algorithm for predicting total lung capacity. MSE, mean squared error.
Model development and statistical analyses were performed using the Python programming language. The MSE was used as a statistical measure for assessing the accuracy of our TLC prediction models. Low MSE values express a good fit of the model. To demonstrate the relationship between reference TLC values and the model predictions, the Pearson correlation coefficient was calculated. A value closer to 1 indicates better model performance.
In this study, the ground truth for restrictive lung impairment was defined as TLC < LLN (5th percentile), where the LLN for each patient was derived from the GLI reference values (11).
Two different definitions of restrictive patterns were compared to this ground truth. The first one is based on our model and is defined as TLCpredicted < LLN. The second one is based on the 2005 ERS/ATS standards [5], commonly used by physicians to identify patients, and is defined as FVC < LLN and FEV₁/FVC ≥ LLN.
The two proposed definitions were compared to the ground truth according to the confusion matrix as depicted in Table 2. For instance, if the predicted TLC values are below the LLN, this suggests that the ML model accurately identifies patients with restrictive lung impairment. From this confusion matrix, performance indicators can be calculated such as sensitivity, specificity, positive predictive value (PPV) and F1-score.
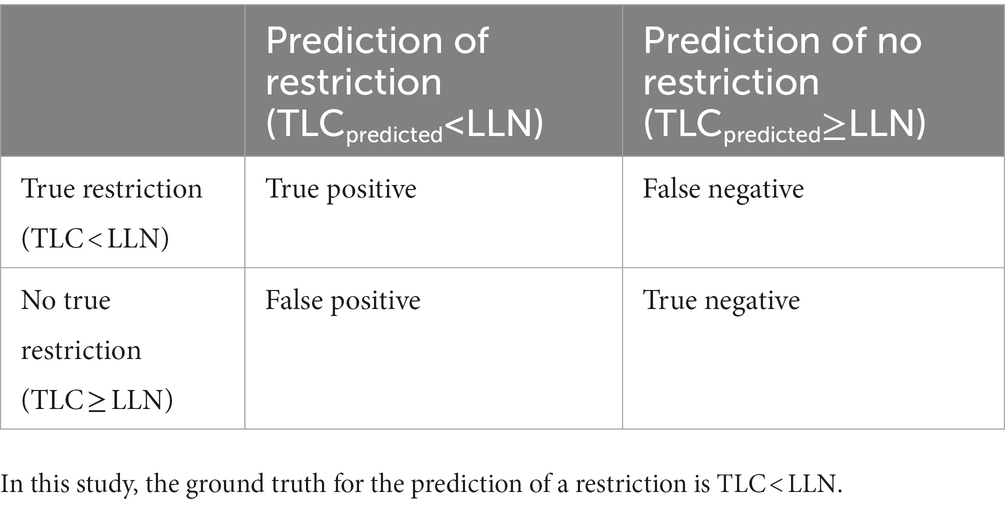
Table 2. Confusion matrix for the prediction of restriction.
The optimal hyperparameter configurations for the CatBoost and XGBoost models shared some similarities. For example, both models found 1,000 trees (or estimators) to be ideal, and the maximum depth of the tree in both configurations was 10. More details are given in Supplementary material. After fine-tuning, none of the models revealed any signs of overfitting, suggesting a satisfactory balance between bias and variance.
The three studied ML algorithms are assessed using the MSE. Among all models, CatBoost yielded the lowest MSE (MSECatBoost = 560.1, MSEXGBoost = 569.6 and MSERF = 575.1). Therefore, we proceeded with this model for TLC predictions (TLCCatBoost).
Model predictions and reference TLC values (range: 1.47–11.51 l) were highly correlated with a Pearson correlation coefficient of 0.88 (see Figure 2). The average difference between TLCCatBoost and true TLC values was 107.2 mL.
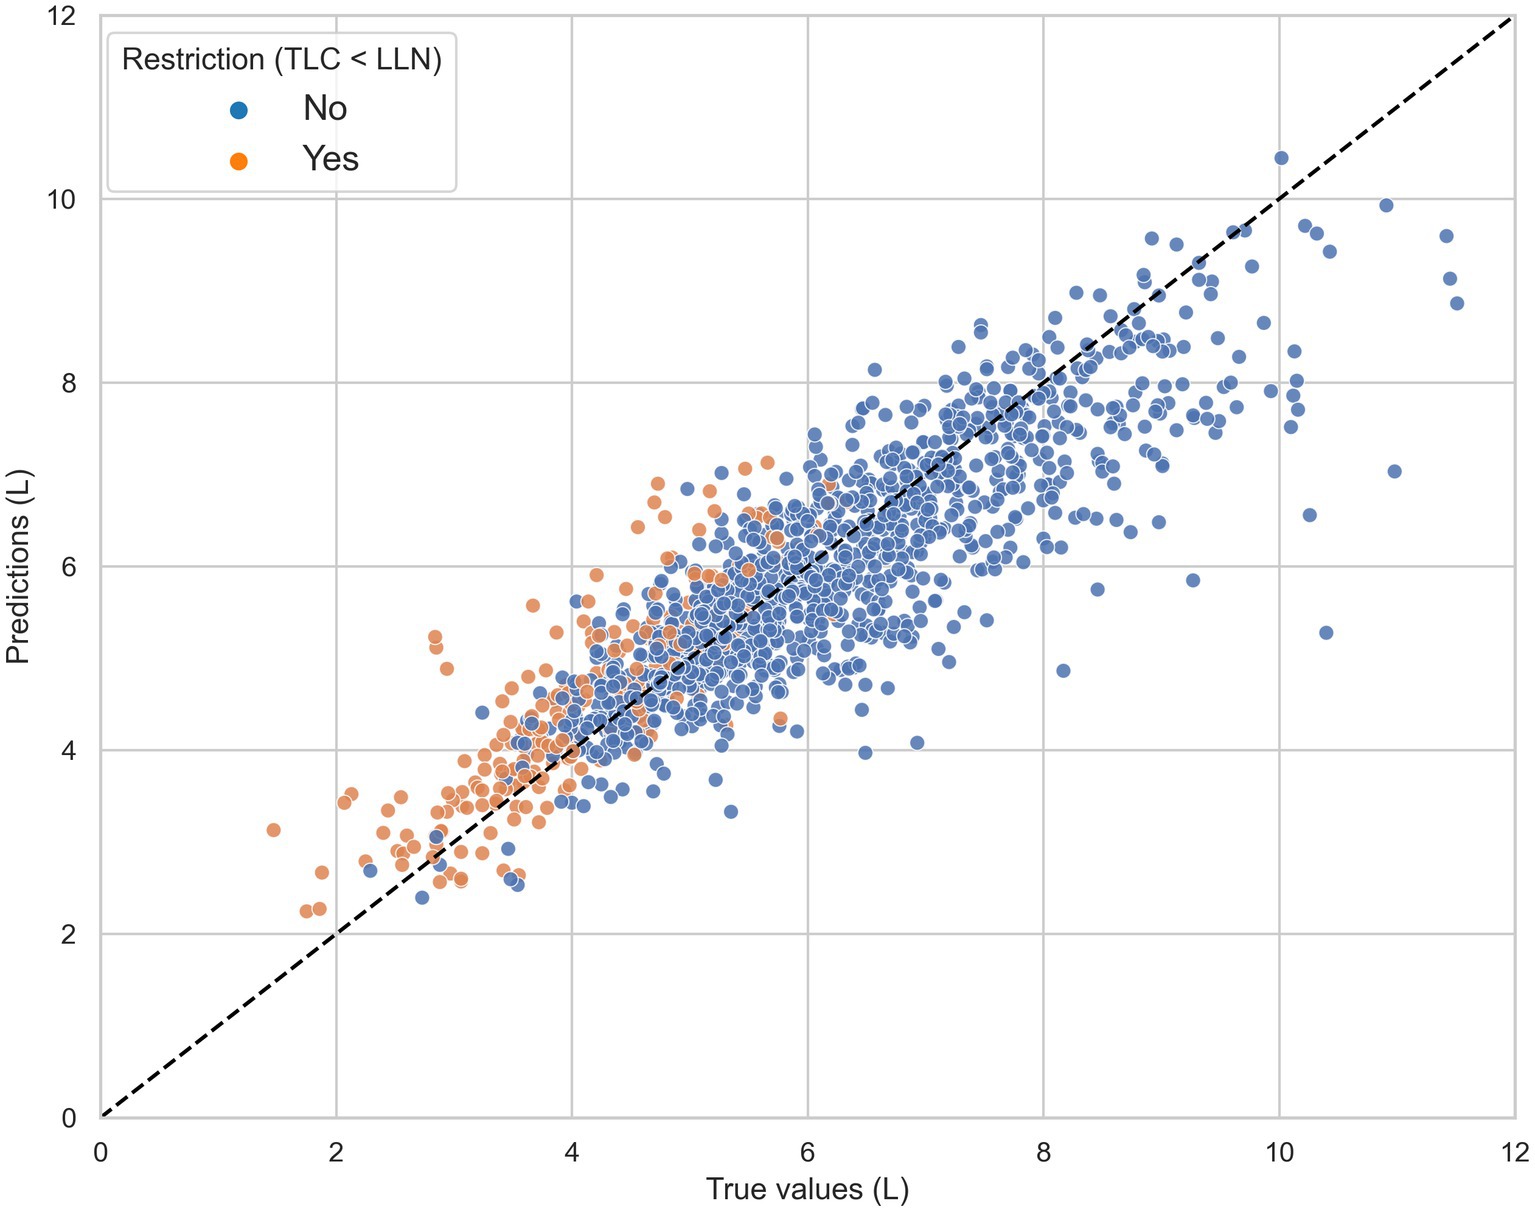
Figure 2. The total lung capacity (TLC) predictions of the CatBoost model (TLCCatBoost) against the reference TLC measurements in the independent test set, grouped by true restriction defined as TLC < lower limit of normal (LLN). The black dashed line represents the line of ideal agreement.
Figure 3 shows that the magnitude of underestimation was highest in patients diagnosed with obstructive ventilatory impairments such as chronic obstructive pulmonary disorder (COPD) and asthma. In contrast, the model on average largely overestimated the TLC values for patients with restrictive disorders, including ILD and thoracic deformity.

Figure 3. The prediction error for each diagnosis is calculated as the difference between the average total lung capacity (TLC) value and the average TLCCatBoost prediction for that group. Bars above and below the horizontal dotted line indicate model underestimation and overestimation, respectively. COPD, chronic obstructive pulmonary disease; ILD, interstitial lung disease; OBD, other obstructive disease; NMD, neuromuscular disease; PVD, pulmonary vascular disease; TD, thoracic deformity.
Confusion matrices for the different definitions are shown in Table 3. 16.7% (234/1402) of the 1,402 patients were detected as having restriction defined as TLC < LLN (5th percentile) compared to 13.8% (194/1402) with our algorithm and 18.0% (252/1402). Following the 2005 standards, 93 unnecessary full PFT would have been performed (PPV of 62%) versus only 35 with our method (PPV of 82%). Most of unnecessary tests would be done in patients diagnosed with asthma (32 patients) and COPD (20 patients). Those subjects will have a small airway obstructive syndrome or non-specific pattern, as previously described (20, 21).
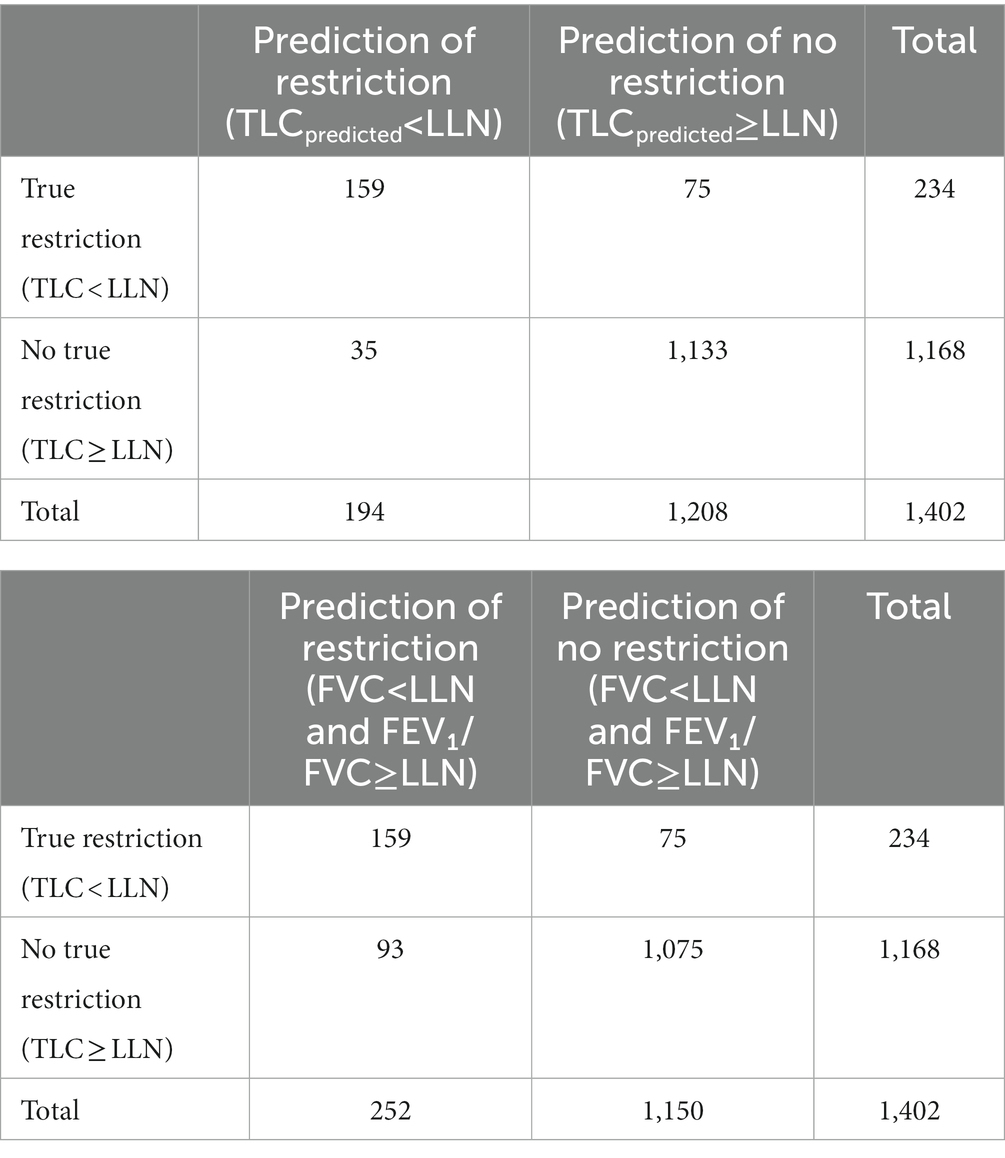
Table 3. Confusion matrix for the prediction of restriction (a) based on our machine learning model and (b) based on the 2005 standards definition.
Table 4 details the performance indicators (sensitivity, specificity, PPV and F1-score) for the studied approaches. Our baseline algorithm achieved the same sensitivity (68%) as the 2005 ERS/ATS guidelines for predicting restriction. However, our algorithm had higher specificity and attained a relatively good balance between sensitivity and PPV (F1-score of 74%). Moreover, lowering TLC estimations by subtracting α = 0.3 substantially increased the sensitivity of our algorithm from 68 to 83%. The algorithm’s ability to effectively rule out restriction was then only moderately reduced (specificity 92%).
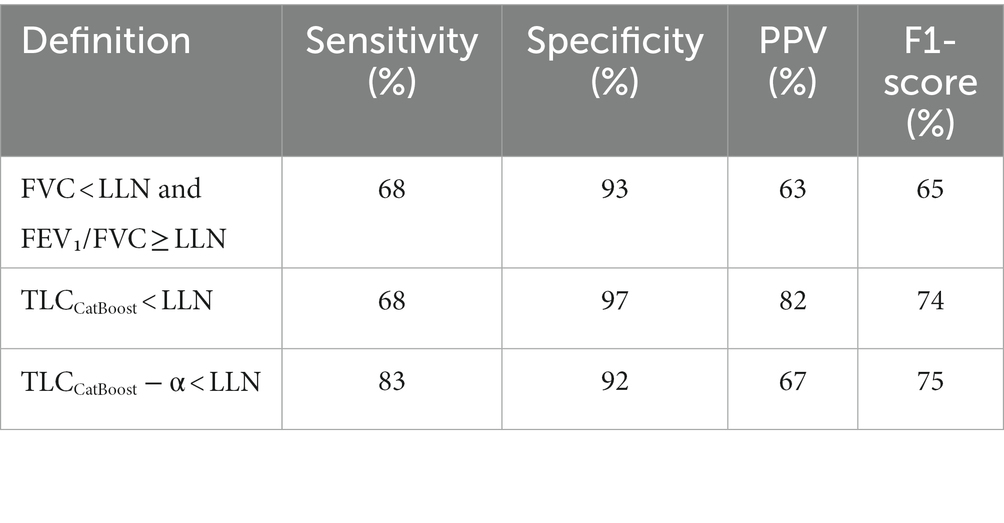
Table 4. Overall performance of different definitions to identify restrictive ventilatory impairment defined by TLC < LLN.
The number of patients that would have missed necessary lung volume tests to confirm restriction when using the different definitions is shown in Table 5. Across all definitions, patients diagnosed with ILD were the most susceptible to false negative results. Of the 165 patients with ILD, the 2005 ERS/ATS guideline definition missed pulmonary restriction in 33 patients. Our baseline algorithm yielded a similar result; however, when α was adjusted to 0.3 the number of false negatives for ILD patients decreased almost threefold.
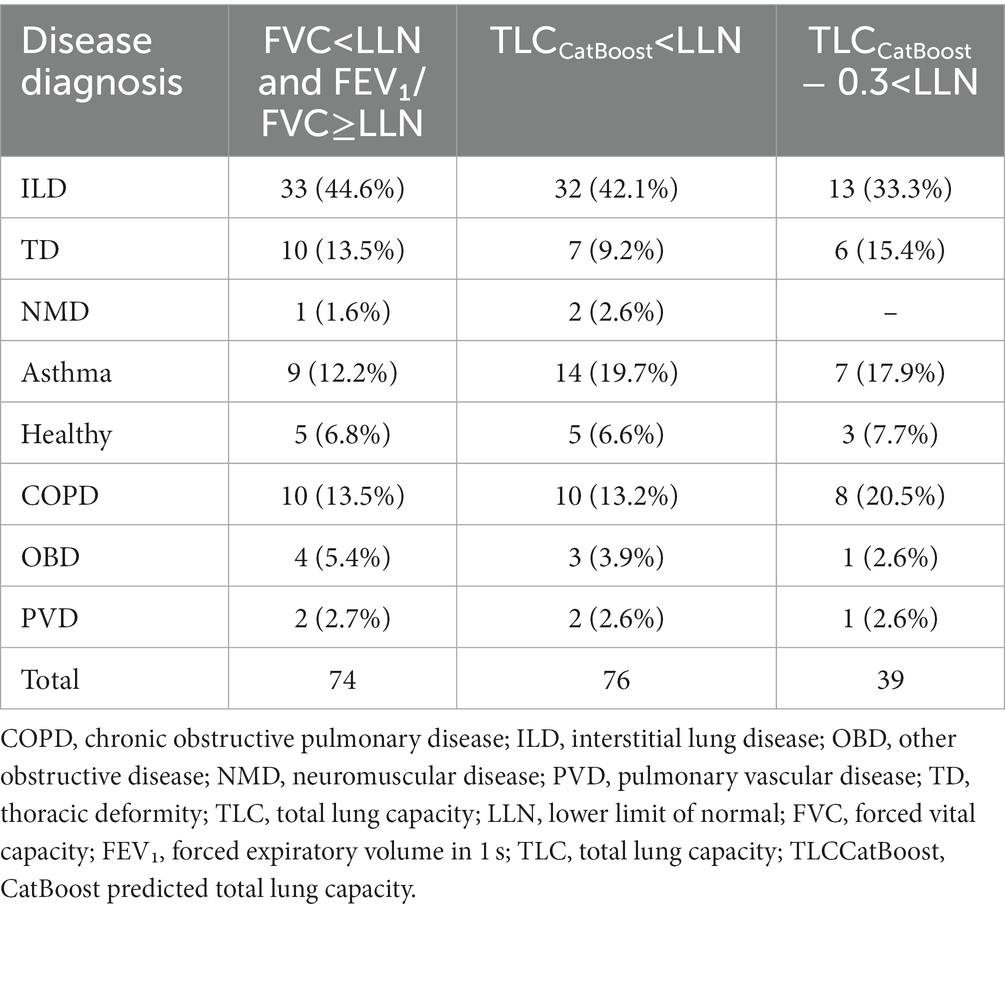
Table 5. Number of patients missed with restriction (TLC < LLN) in test data, grouped by disease subtype.
To the best of our knowledge, this is the first time that spirometry data has been investigated to estimate TLC values using ML models and large data sets. Given the type of data, our findings indicate that tree-based algorithms in general are well suited for the prediction task at hand. After evaluating the models using MSE, we found that the CatBoost model performed the best.
For patients diagnosed with pulmonary vascular disease and neuromuscular disease, the mean absolute difference between TLC values obtained by CatBoost and volume measurements was the lowest with 392.2 and 324.1 mL, respectively. However, in patients with COPD our TLC prediction model largely underestimated true TLC values. This finding might be explained by a phenomenon called pseudorestriction (22). Patients with severe obstruction may have air trapping with high residual volumes, thereby reducing FVC for a given increased TLC (4). To date, 228 patients were identified with low FVC (LLN) despite normal TLC, of which 49.6% had the diagnosis of COPD. These subjects contributed most to the underestimation we observe in the upper end of Figure 2.
Considering the satisfactory performance of our TLC prediction model, we examined its ability to serve as a tool for identifying restrictive lung impairment. We incorporated a linear correction term α to account for the model’s tendency to overestimate and underestimate in patients with and without restriction, respectively. By subtracting a small value of α to lower TLC predictions, the algorithm was able to achieve a remarkably high sensitivity without negatively impacting specificity; thereby transforming spirometry into a high-value screening test. The tuning constant α that controls the trade-off between sensitivity and specificity can be adjusted according to the context and priorities of different testing laboratories. For instance, an algorithm that emphasizes a higher specificity over sensitivity might be more desirable in rural or sparsely populated areas, where avoiding unnecessary referrals is important. In other scenarios, where PFTs are more developed and accessible, the algorithm can be tuned to prioritize sensitivity.
By using our algorithm to predict TLC from spirometry data, primary care providers can quickly and accurately identify patients who are likely to have a restrictive lung disease. For example, if a patient’s predicted TLC falls below a certain threshold, the ML algorithm could alert the patient and their healthcare provider, indicating that the patient should see a doctor for further evaluation and potential treatment. This can help to prevent diagnostic delays and ensure that patients receive timely and appropriate care. At the moment, diagnosing restrictive lung diseases is challenging, and many patients with ILD have experienced misdiagnosis, delayed treatment, and unnecessary tests on their path to a final diagnosis (23, 24). This methodology might be particularly useful to identify ILD. It is different from clinical standards that it directly estimates TLC, regardless of the preset spirometry criteria (FVC < LLN and FEV1/FVC > LLN) and will therefore also identify real restriction (proven TLC < LLN) in patients that are not having the preset spirometry disturbances. To document the difference, we checked in our test set in the group of patients with no restrictive spirometry (FVC > LLN) how many were still determined by the algorithm to have a TLC < LLN: 14 subjects. These 14 subjects would normally not have been referred for volumes. Interestingly, the majority (n = 11) of these patients had ILD. When we increase sensitivity of TLC CATboost with −0.3 alpha correction to 83% (by reducing the number of FN) compared to the ERS spirometry criteria, even a larger group of ILD patients can be identified.
Although our approach benefited from a large and varied data set for model building and parameter tuning, this study has some important limitations. First, our ML models were trained and tested mostly on Caucasian patients from a Belgium population. Therefore, the model’s ability to equally perform on other populations cannot be guaranteed. Second, the majority of the TLC measurements in the training data were obtained by whole body plethysmography. Although this method is often considered the gold standard, it has been shown to overestimate TLC in patients with obstructive diseases (25, 26). Moreover, we estimate that in the training dataset 20% of the volume measurements were obtained with Helium dilution technique, which might be less accurate. We expect this influence to be small, but cannot exclude that it results in an underestimation of volumes, particularly with obstructive airways disease. Hence, we do observe that volumes for obstructive airways diseases are underestimated when evaluated in the test set of which all data are plethysmography volumes. In our view it is less likely to play a role in restrictive diseases as it is know that discrepancies between plethysmography and volumes are less pronounced. Third, our volume data were obtained from the clinical routine of expert centers according to ERS/ATS standards, but no additional quality control was performed on the individual maneuvers which may have introduced some bias. Finally, we only investigated common ML algorithms and structured tabular data for developing our TLC prediction model. It is worth exploring the integration of unstructured data such as full flow-volume curves in combination with other prediction techniques like deep neural networks.
In conclusion, we have demonstrated that ML has the potential to estimate TLC from spirometry data and patient characteristics with high accuracy. Additionally, we showed that the TLC predictions can be used to identify restrictive ventilatory impairment with higher sensitivity and specificity than commonly used RSPs. Our solution can be integrated into smart spirometry software that is used at the level of the practicing physicians and home use spirometry. While adoption of such a tool may enable earlier diagnosis of restriction, further research studies are required to evaluate the accuracy and effectiveness of our model in predicting TLC and identifying restrictive lung impairment. This will help to determine whether the model can improve diagnostic accuracy and patient outcomes, and guide future research and development in this area.
The data analyzed in this study is subject to the following licenses/restrictions: patient confidentiality and participant privacy. Requests to access these datasets should be directed to ArtiQ, aW5mb0BhcnRpcS5ldQ==.
The studies involving human participants were reviewed and approved by www.clinicaltrials.gov. The patients/participants provided their written informed consent to participate in this study.
LB: conceptualization, formal analysis, investigation, and writing original draft. MT and AH: data curation, methodology, resources and validation. PD and WJ: writing, reviewing, and editing. MV: supervision and editing. All authors contributed to the article and approved the submitted version.
MT, AH, and PD were employed by the ArtiQ NV. MV has received consultancy fees from ArtiQ NV. WJ was a shareholder at ArtiQ NV.
The remaining author declares that the research was conducted in the absence of any commercial or financial relationships that could be construed as a potential conflict of interest.
All claims expressed in this article are solely those of the authors and do not necessarily represent those of their affiliated organizations, or those of the publisher, the editors and the reviewers. Any product that may be evaluated in this article, or claim that may be made by its manufacturer, is not guaranteed or endorsed by the publisher.
The Supplementary material for this article can be found online at: https://www.frontiersin.org/articles/10.3389/fmed.2023.1174631/full#supplementary-material
1. Martinez-Pitre, PJ, Sabbula, BR, and Cascella, M. In StatPearls [Internet]. Treasure Island (FL): StatPearls Publishing (2023).
2. Guerra, S, Sherrill, DL, Venker, C, Ceccato, CM, Halonen, M, and Martinez, FD. Morbidity and mortality associated with the restrictive spirometric pattern: a longitudinal study. Thorax. (2010) 65:499–504. doi: 10.1136/thx.2009.126052
3. Raj, R, Raparia, K, Lynch, DA, and Brown, KK. Surgical lung biopsy for interstitial lung diseases. Chest. (2017) 151:1131–40. doi: 10.1016/j.chest.2016.06.019
4. Wanger, J, Clausen, JL, Coates, A, Pedersen, OF, Brusasco, V, Burgos, F, et al. Standardisation of the measurement of lung volumes. Eur Respir J. (2005) 26:511–22. doi: 10.1183/09031936.05.00035005
5. Pellegrino, R, Viegi, G, Brusasco, V, Crapo, RO, Burgos, F, Casaburi, R, et al. Interpretative strategies for lung function tests. Eur Respir J. (2005) 26:948–68. doi: 10.1183/09031936.05.00035205
6. Maher, TM, Schiffman, C, Kreuter, M, Moor, CC, Nathan, SD, Axmann, J, et al. A review of the challenges, learnings and future directions of home handheld spirometry in interstitial lung disease. Respir Res. (2022) 23:307. doi: 10.1186/s12931-022-02221-4
7. Moor, CC, van den Berg, CAL, Visser, LS, Aerts, JGJV, Cottin, V, and Wijsenbeek, MS. Diurnal variation in forced vital capacity in patients with fibrotic interstitial lung disease using home spirometry. ERJ Open Res. (2020) 6:00054–2020. doi: 10.1183/23120541.00054-2020
8. Nakshbandi, G, Moor, CC, and Wijsenbeek, MS. Home monitoring for patients with ILD and the COVID-19 pandemic. Lancet Respir Med. (2020) 8:1172–4. doi: 10.1016/S2213-2600(20)30452-5
9. Giri, PC, Chowdhury, AM, Bedoya, A, Chen, H, Lee, HS, Lee, P, et al. Application of machine learning in pulmonary function assessment where are we now and where are we going? Front Physiol. (2021) 12:678540. doi: 10.3389/fphys.2021.678540
10. Gonem, S, Janssens, W, Das, N, and Topalovic, M. Applications of artificial intelligence and machine learning in respiratory medicine. Thorax. (2020) 75:695–701. doi: 10.1136/thoraxjnl-2020-214556
11. Quanjer, PH, Stanojevic, S, Cole, TJ, Baur, X, Hall, GL, Culver, BH, et al. Multi-ethnic reference values for spirometry for the 3-95-yr age range: the global lung function 2012 equations. Eur Respir J. (2012) 40:1324–43. doi: 10.1183/09031936.00080312
12. Liu, FT, Ting, KM, and Zhou, ZH. Isolation forest. In: Proceedings of the 8th IEEE International Conference on Data Mining, Pisa, Italy. Los Alamitos: IEEE (2008). p. 413–422.
13. Decramer, M, Janssens, W, Derom, E, Joos, G, Ninane, V, Deman, R, et al. Contribution of four common pulmonary function tests to diagnosis of patients with respiratory symptoms: a prospective cohort study. Lancet Respir Med. (2013) 1:705–13. doi: 10.1016/S2213-2600(13)70184-X
14. Topalovic, M, Laval, S, Aerts, JM, Troosters, T, Decramer, M, Janssens, W, et al. Automated interpretation of pulmonary function tests in adults with respiratory complaints. Respiration. (2017) 93:170–8. doi: 10.1159/000454956
16. Chen, T, and Guestrin, C. Xgboost: A scalable tree boosting system. In Proceedings of the 22nd ACM SIGKDD International Conference on Knowledge Discovery and Data Mining (2016) (pp. 785–794).
17. Prokhorenkova, L, Gusev, G, Vorobev, A, Dorogush, AV, and Gulin, A. Cat boost: unbiased boosting with categorical features. Adv Neural Inf Proces Syst. (2018) 31, 6639–6649.
18. Bergstra, J, and Bengio, Y. Random search for hyper-parameter optimization. J Mach Learn Res. (2012) 13, 281–305.
19. Arlot, S, and Celisse, A. A survey of cross-validation procedures for model selection. Stat Surv. (2010) 4:40–79.
20. Hyatt, RE, Cowl, CT, Bjoraker, JA, and Scanlon, PD. Conditions associated with an abnormal nonspecific pattern of pulmonary function tests. Chest. (2009) 135:419–24. doi: 10.1378/chest.08-1235
21. Chevalier-Bidaud, B, Gillet-Juvin, K, Callens, E, Chenu, R, Graba, S, Essalhi, M, et al. Non-specific pattern of lung function in a respiratory physiology unit: causes and prevalence: results of an observational cross-sectional and longitudinal study. BMC Pulm Med. (2014) 14:148. doi: 10.1186/1471-2466-14-148
22. Al-Ashkar, F, Mehra, R, and Mazzone, PJ. Interpreting pulmonary function tests: recognize the pattern, and the diagnosis will follow. Cleve Clin J Med. (2003) 70: 866, 868, 871–873, passim. doi: 10.3949/ccjm.70.10.866
23. Cosgrove, GP, Bianchi, P, Danese, S, and Lederer, DJ. Barriers to timely diagnosis of interstitial lung disease in the real world: the INTENSITY survey. BMC Pulm Med. (2018) 18:9. doi: 10.1186/s12890-017-0560-x
24. Pritchard, D, Adegunsoye, A, Lafond, E, Pugashetti, JV, DiGeronimo, R, Boctor, N, et al. Diagnostic test interpretation and referral delay in patients with interstitial lung disease. Respir Res. (2019) 20:253. doi: 10.1186/s12931-019-1228-2
25. Tang, Y, Zhang, M, Feng, Y, and Liang, B. The measurement of lung volumes using body plethysmography and helium dilution methods in COPD patients: a correlation and diagnosis analysis. Sci Rep. (2016) 6:37550. doi: 10.1038/srep37550
Keywords: restriction, spirometry, machine learning, interstitial lung disease, total lung capacity
Citation: Beverin L, Topalovic M, Halilovic A, Desbordes P, Janssens W and De Vos M (2023) Predicting total lung capacity from spirometry: a machine learning approach. Front. Med. 10:1174631. doi: 10.3389/fmed.2023.1174631
Edited by:
Md. Mohaimenul Islam, The Ohio State University, United StatesReviewed by:
Chandra Segar T, Vellore Institute of Technology (VIT), IndiaCopyright © 2023 Beverin, Topalovic, Halilovic, Desbordes, Janssens and De Vos. This is an open-access article distributed under the terms of the Creative Commons Attribution License (CC BY). The use, distribution or reproduction in other forums is permitted, provided the original author(s) and the copyright owner(s) are credited and that the original publication in this journal is cited, in accordance with accepted academic practice. No use, distribution or reproduction is permitted which does not comply with these terms.
*Correspondence: Maarten De Vos, bWFhcnRlbi5kZXZvc0BrdWxldXZlbi5iZQ==
Disclaimer: All claims expressed in this article are solely those of the authors and do not necessarily represent those of their affiliated organizations, or those of the publisher, the editors and the reviewers. Any product that may be evaluated in this article or claim that may be made by its manufacturer is not guaranteed or endorsed by the publisher.
Research integrity at Frontiers
Learn more about the work of our research integrity team to safeguard the quality of each article we publish.