
95% of researchers rate our articles as excellent or good
Learn more about the work of our research integrity team to safeguard the quality of each article we publish.
Find out more
OPINION article
Front. Med. , 01 June 2023
Sec. Precision Medicine
Volume 10 - 2023 | https://doi.org/10.3389/fmed.2023.1155057
This article is part of the Research Topic Current Advances in Precision Microscopy View all 10 articles
 Uwe Ritter1,2*
In 1898, microscopic examinations were used to study changes in lymphoid tissues and cell distribution in pathological settings (1). More than 100 years after these first discoveries, the complexity of lymphoid organ composition and the existence of distinct immune-cell subpopulations with a diverse set of functions has been described.
For the adaptive immune system to function efficiently, complex series of spatial and temporal interactions between specialized immune cells must take place. This has been a field of vigorous interest, exemplified by the fact that nearly 100.000 papers have been published dealing with the keywords “interaction” and “immune cells” (PubMed search March 2023). Understanding cell-cell communication—resulting in immunological pathways—is being supported by a range of sophisticated analysis pipelines, ranging from in vitro and ex vivo single-cell sequencing analysis to genic analysis of immunological alterations. In this context, it is commonly accepted that cells can communicate through juxtacrine and paracrine processes (2). Signal transmission and reception between neighboring cells is fundamentally involved in the regulation of immunological processes, ranging from tissue homeostasis to defense mechanisms against tumour cells or pathogens. However, the final decryption of immunological programs responsible for coordinated and dynamic immunological adaption is multi-factorial and remains challenging.
Flow-cytometric analysis represents a central pilar of immunophenotyping (3). Based on this technique, it could be shown that immune cells sense and release many molecular mediators capable of modifying immune cell development, phenotype, and function. However, the limited availability of fluorescently labeled antibodies imposes limitations on the detection of different epitopes. Consequently, other approaches such as single-cell RNA sequencing (scRNA-seq) have been established, allowing an upscaling of the analytic dimensions (4). What was previously impossible becomes routine. Transcriptomic datasets in combination with computational analytic pipelines can match raw data with cell clusters of interest and identify biomarkers involved in the developmental trajectory of immune cells (5–7). While these sequencing approaches improve our ability to analyse different cell populations in a variety of contexts, some limitations remain (5). Especially the enzymatic digestion of tissues is critical, as mediators released during tissue processing for single-cell analysis can result in cell activation or death (6). Consequently, rare cell populations can be lost and valuable information about cell-cell interactions and the transcriptome are overlooked. Most importantly, single-cell preparations abolish the spatial context of the cell populations and information about cell-cell interactions become inaccessible (2). Spatial transcriptomics (ST) (7, 8) address these shortcomings by detecting and localizing mRNA transcripts within tissues (2) and became “Method of the Year” in 2021 (9).
In contrast to early in situ hybridization techniques which only detect a single transcript (10), ST can detect a broad range of genes expressed within defined detection spots, containing barcoded poly-T oligonucleotides capable of trapping their complementary tissue mRNA. However, the resolution of detection spots can range from two to 55 microns [2 μm: High-definition spatial transcriptomics (11), 10 μm Slide-seq, Slide-seq v2 (12, 13); 55 μm: Visium spatial gene Expression (7)], leading to considerable uncertainty regarding the precise cell assignment of any identified mRNA. These relatively large spot areas represent therefore a major limitation (14) to this technique, since it is challenging to assign the generated RNAseq data to a distinct “cell type” within a sampled portion of tissue. Furthermore, even with a tissue thickness of less than seven microns, the processed tissue-sample still represents a three-dimensional cell layer (15, 16) containing cells stacked on top of each other, which causes a further inaccuracy of cellular specificity. Consequently, the genetic information of adjacent contaminating cells is easily trapped within the measured spot (14). These issues can be limited by integrating additional gene expression profiles from scRNA-seq or other single-cell genomic approaches and subsequent predictions of location specific cell-type proportions. This complex procedure also called “deconvolution” (2) requires the application of certain algorithms [e.g. SPOTlight (17), SpatialDWLS (18), stereoscope (19), robust cell-type decomposition (14)]. After cell-type scoring, a scRNA-seq-based assignment can be calculated to predict the RNA localization. This process is called “mapping” and can be achieved by the integration of suitable algorithms, such as Harmony (20), LIGER (21), or Seurat Integration (22).
Due to the occurrence of mismatched data sets, the current integrating computational models used for deconvolution and subsequent mapping are reaching their limits. Therefore, it remains difficult to precisely determine the spatial context of cell subsets (2). The essential aspects are summarized below: First, pre-sequencing issues are caused by the fact that classical sc-RNAseq data show a tendency towards a higher sequencing depth compared to most ST-methods (2, 16). Second, a preparation of single cells from tissues can also induce artificial stress responses, that do not take place in intact tissues (23). Third, a loss of cell subsets during the enzymatic preparation of tissues can further induce mismatches and problems during deconvolution steps (24, 25). Fourth, it is possible that “clustering capture spots” may uncover cell subsets only captured by spatial barcoding (2). Thus, a precise decryption of cell-cell interactions by ST still remains an ambitious goal.
It is widely accepted that tissue-resident cells are continuously involved in short-range (< 200 μm) communication (2). This is of crucial importance for the maintenance of organ architecture and coordination of immune responses. Some monospecific receptor-ligand-interactions have already been decoded, highlighting distinct immunological programs (26–28). However, the mode of action by which cellular phenotype adoption takes place, especially within a given temporal microenvironment, is still not fully understood. In line with this challenging question, different in situ approaches have been established to uncover cell-cell communication. A combination of multiplexed ion beam imaging (MIBI) and ST has been used to evaluate receptor-ligand proximity or ligand-receptor-target co-expression. Based on these computed data and appropriate algorithms, it is feasible to determine distinct multi-cellular areas of communicating and non-communicating cell subsets within tissues (8). The achieved resolution of the techniques used in “marker-mapping” and creating immunological landscapes is promising [Slide-seq 10 μm; ST 50–100 μm; MIBI 800 × 800 μm (12, 29)]. Most recently, a bead-based method produced high-definition ST with resolutions nearly comparable to the size of individual cells (11). Therefore, an integration of different ex vivo and in situ techniques might be suitable to push the limits in contextualized modeling of spatial cellular communication (30) in the near future. However, in silico generated landscapes still remain constructed based on computed models of cell type specifications (29). This reconstruction of “highly probable signaling networks” is often based on scRNA-seq data, without exact pairing transcriptomic quantification with probability-based protein identification (30). Models capable of indexing both transcriptomes and epitopes by sequencing, such as CITE-seq, already exist (31) and will help to combine RNA-data and protein abundance in a contextual manner. However, as Alexander F. Schier has already asked: …“Is “landscapes” even the proper analogy for multidimensional phenotypic complexity? Addressing these questions requires the multiplex in vivo measuring of dozens of transcripts over time and at single-cell resolution — a Holy Grail technology that is not yet available”… (29).
Unbiased mapping of omics to a spatial context opens a new dimension in the field of immunology (29). Given the ST-limitations described above and the multidimensionality of cell-interactions, a precise characterization of single cells in situ still seems to be a distant goal. To understand the immunological relevance of physically interacting cells [PICs, (32)] in situ, a combination of existing sequencing methods and data sets might be promising. Given the broad spectrum of cell-cell communication during homeostasis and pathological conditions, it is impossible to present one conceptual workflow of data processing, covering all cell subsets and immunological responses. Thus, I would like to address this aspect of “PIC-decryption” based on dendritic cell (DC)/T-cell interactions.
Initiation of adaptive immunity by DCs involves a cascade of fine-tuned bidirectional processes (33). We and others have been able to identify that certain subsets of DCs are mandatory for adaptive T-cell responses against pathogens (34, 35). In this context, the formation of immunological synapses between DCs and T cells is crucial for T-cell polarization (36–38). Although DC/T-cell interactions are of high clinical relevance, current genomics and imaging tools for their detection and precise in situ characterization are still limited, possibly due to the fact that PICs must be analyzed in situ on a cell-by-cell basis. There is one general problem: Within lymphoid organs, all cells are close neighbors due to the density of the tissues.
One must realize that proximity alone is not sufficient to induce cell activation or differentiation. Thus, a robust detection-signature, capable of highlighting PICs like DC/T-cell interactions by multiplex imaging systems, would be of tremendous importance for the field to understand early events in adaptive immunity (32). PICs isolated from tissues, are already under investigation (32, 39, 40). The pipeline of PIC-transcriptome analysis [abbreviated as PIC-seq (32)] is encouraging (41). One strength of this PIC-seq-concept lies in the combination of transcriptome data from ex vivo isolated PIC-complexes and respective single-cell data (32). If transcriptional profiles of PICs are sufficiently different, a good deconvolution is possible and PIC-seq data can be generated (42). To further calculate the transcriptional profiles of PICs, other pipelines and algorithms, such as the Giotto workflow (43), SpaOTsc algorithm (44), or CSOmap (45) might be also be implemented.
Using PIC-seq and a dermal infection model with Nippostrongylus brasiliensis (Nb), it could be shown that PICs consisting of dermal-derived DCs that present Nb-antigens to T cells, upregulate distinct transcriptional profiles—also called gene modules (32). In case of Nb-infection, this DC-specific gene module is composed of chemokines (Ccl22 and Ccl17) and co-stimulatory genes CD40, Ebi3, and Dll4 (32). The T cell-specific gene modules of PICs seem to be more complex, due to the heterogeneity of T cells that interact with DCs (32). However, co-culture experiments revealed that T cells that interact with antigen-presenting DCs show a reduced Th-precursor program (Klf2, Sell) associated with an induction of interferon type-I response (Stat1, Irf7), and metabolic programs (Myc and Npm1), as well as an upregulation of cytokines, chemokine receptors and effector genes (Tigit, Il22, Cxcr6, Pdcd1, and Tnfrsf9) (32). Based on these data, it can be concluded that DCs, which physically interact with T cells (Figures 1A–C), express distinct PIC-associated gene modules (32). Consequently, it is possible to design gene module-derived staining panels, allowing a refined identification of DC/T-cell interactions by multiplex imaging and tissue image cytometry (47) (Figures 1D–F).
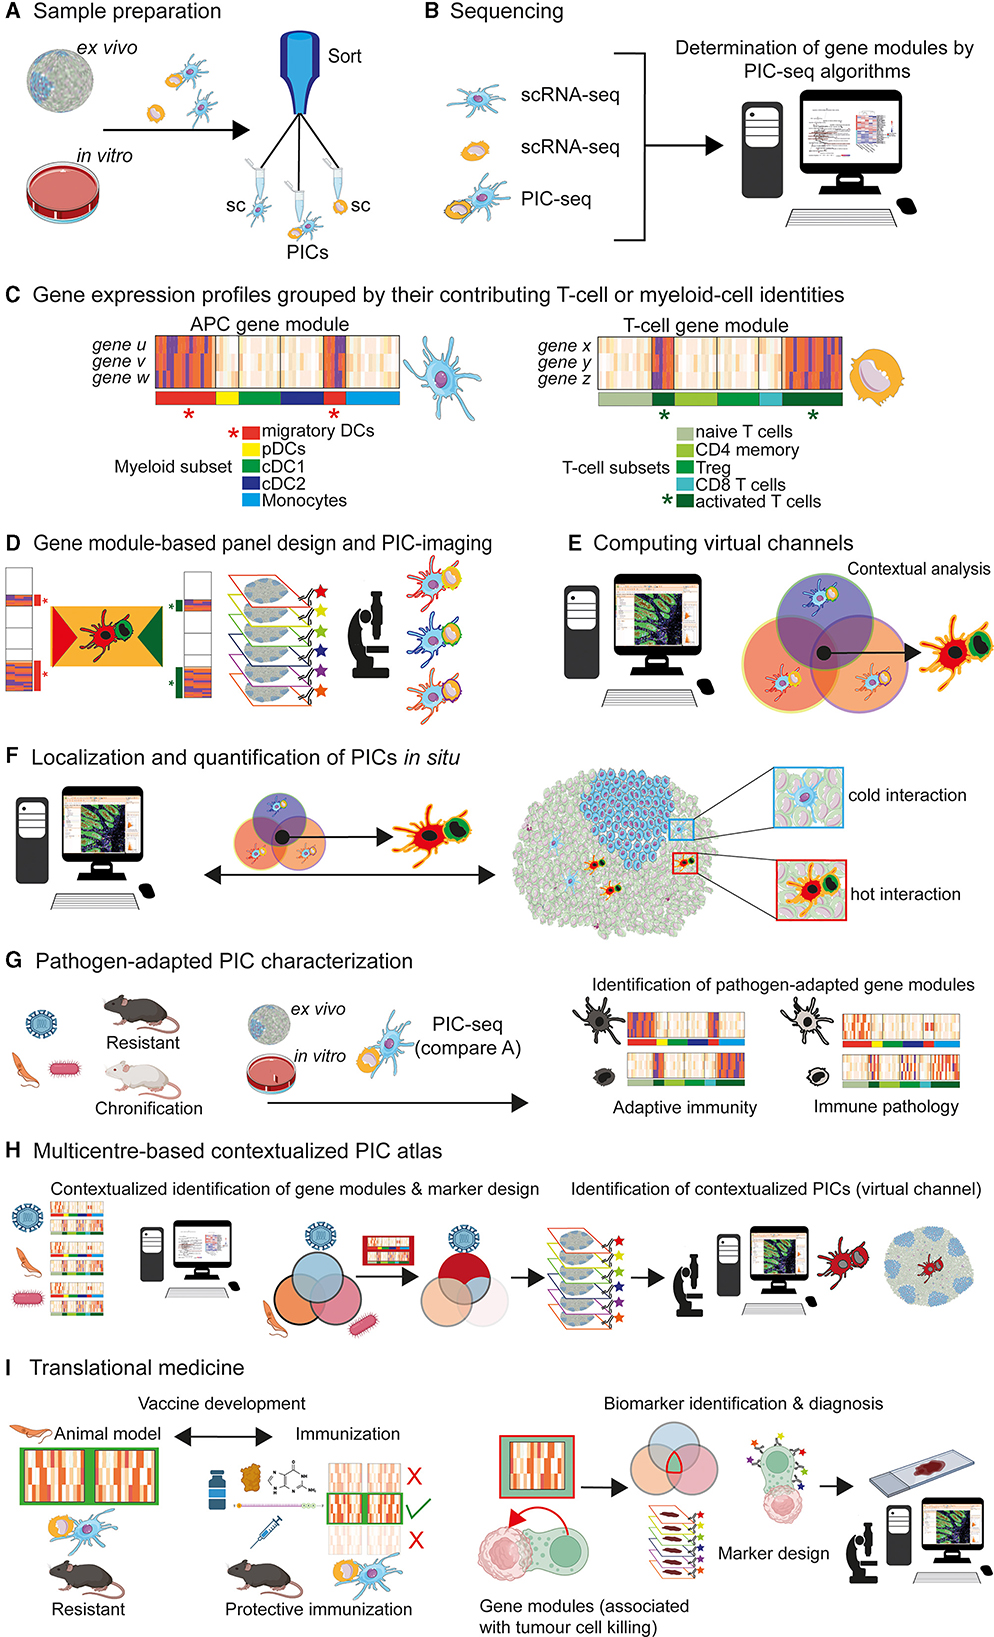
Figure 1. PIC characterization and implementation for contextual multiplex imaging. (A) Ex vivo and in vitro cultures, exposed to antigens, can be used for sorting single cells (sc; T cells or DCs) and physical interacting cells (PIC) [For further reading, see Giladi et al. (32)]. (B) Implementation of scRNA-seq and PIC-seq algorithms for subsequent characterization of gene modules (exemplary for T cells and DCs). (C) Grouped by their contributing myeloid or T-cell subset identities, it is possible to assign distinct gene modules to PICs: e.g., genes u, v, w to DC subsets and genes x, y, z to T-cell subsets [For further reading, see Giladi et al. (32)]. The putative gene expression profiles of PIC-contributing cell subsets are depicted. Specific “APC gene modules” of migratory DCs (red star) and “T-cell gene modules” of activated T cells (green star) can be generated [For further reading, see Giladi et al. (32)]. (D) Gene modules assigning specific cellular phenotypes can be used for panel designs and multiplex imaging. PICs consisting of migratory DCs and activated T cells can be computed (orange insert). A contextualized detection of “migratory DCs” physically interacting with “activated T cells” becomes possible (highlighted by distinct DC and T cell shapes and colors). (E) Based on the phenotype of cells that contribute to PICs, a virtual channel (orange contour) can be generated by imaging software tools, capable of contextualized image analysis in situ. PICs (orange contour) consisting of “migratory DCs (red shape)” and “activated T cells (green shape)” can be computed. (F) Visualization and further characterization of PICs of interest (orange contour). It is feasible to dissect “cold” cell interactions (blue insert; non-reactive cells) from “hot” cell interactions (red insert; reactive cells) resulting in T-cell activation. (G) Different pathogens (viruses, protozoan, bacteria etc.) and models must be considered for the generation of context-adapted gene modules. This would allow a detailed characterization of gene modules of PICs in a pathogen-specific manner. A contextualized generation of PIC-associated gene modules will permit the decryption of two central immunological categories: beneficial adaptive immune responses, resulting in protective host defense mechanisms against pathogens and immunopathological process, associated with chronic diseases. (H) Multicentre data acquisition and storage (PIC atlas) for the long-term generation of contextualized gene models and subsequent marker design. This concept will allow an allocation of certain immunological attributes to PICs, in a contextualized manner. A spatial detection of PICs contributing to disease chronification or successful immunity would become possible. (I) Conceivable applications of the PIC-seq concept in translational medicine are depicted. Left side: vaccination development. Based on experimental models and definition of gene modules (green box), it is possible to define PICs that are contributing to protective immunity against pathogens. This protective gene signatures can be compared with gene modules of PICs that occur after immunization with different vaccine protocols. Such an approach might be useful for the selection of most promising (green check) and inefficient (red cross) vaccine formulation. Right side: biomarker identification in tumour immunology. Physical interactions among tumour and immune cells are supposed to play crucial roles in immune modulation, progression and response to treatments (46). Thus, contextualized analysis of tumour-immune communications would improve the understanding of the tumour-immune interface. Comparable to the described immune cell interactions [compare (A–H)] a biocomputational analysis of gene modules, associated with physically interacting immune and tumour cells, might help to identify biomarkers, involved in protective tumour-immune interactions. The integration of those biomarker in high precision imaging, would lead to massive improvements of contextual resolutions regarding tumour cell/effector cell interactions. This feature will help to correlate microenvironmental neoplasia with molecular modifications—aspects that are crucial for the evaluation of tumour progression and therapy controls.
Focusing on physically interacting DC/T cells, Gialdi and colleagues could demonstrate that PICs are associated with a distinct expression of gene modules, under defined experimental conditions (32) (Figures 1A–E). This aspect represents a major limitation of the PIC-approach. Based on the huge antigen repertoire of pathogens and the corresponding heterogeneity of adaptive immunity, a context-adapted generation of gene modules is of crucial importance to avoid restrictive and oversimplified conditions. This approach is also necessary to ensure the determination of pathogen-adapted gene modules, expressed by PICs of interest (Figure 1G). Referring to the complexity of possible DC/T-cell interactions, a multicentre global database might represent a mandatory prerequisite for the identification of contextualized gene modules (Figure 1H). In line with the integration of high-dimensional data sets, an acceptable point of data reduction can be achieved, allowing the compilation of gene module-based antibody panels, useful for the spatial characterization of PICs, in a context-dependent manner (Figure 1H). This strategy might be further integrated into the new discipline of spatiotemporal molecular medicine, which aims to decrypt pathological processes within a spatial context (48, 49). A variety of applications in the field of basic research and translational medicine are conceivable. Two aspects are of particular importance in translational medicine: identification of potent vaccination strategies and biomarker identification in the field of tumour immunology (Figure 1I).
It is quite clear that antigen-specific immunity represents more than the sum of its parts. Based on the multimodal incorporation of single-cell omics, ST, PIC-seq, and other cutting-edge technologies, deep-learning reconstruction of gene-regulatory and cellular networks in situ will become possible soon. This will be of central importance to understand the cellular crosstalk in tissues and for the decryption of complex immune responses within pathological tissues at a so far unknown level.
Conceptualization, investigation, and writing—original draft: UR.
This study was supported by the Bavarian Research Network (bayresq.net; Bavarian State Ministry for Science and the Arts, UR).
Many thanks to Russell Ulbrich of ScientiaLux LLC (www.scientialux.com) Worcester Massachusetts, United States of America, for critical reading and readability improvement of the manuscript. Lisa Schmidleithner (Department for Immunology, LIT—Leibniz Institute for Immunotherapy—Universitätsklinikum Regensburg Franz-Josef-Strauß-Allee 11, 93053 Regensburg) for critical reading of the manuscript and sharing BioRender icons created with BioRender.com. Graphic abstract illustration credits from Servier Medical Art (https://smart.servier.com/), reproduced under Creative Commons License attribution 3.0 Unported License.
The author declares that the research was conducted in the absence of any commercial or financial relationships that could be construed as a potential conflict of interest.
All claims expressed in this article are solely those of the authors and do not necessarily represent those of their affiliated organizations, or those of the publisher, the editors and the reviewers. Any product that may be evaluated in this article, or claim that may be made by its manufacturer, is not guaranteed or endorsed by the publisher.
1. Montgomery DWV. Report of a case of epithelioma of the skin of the face, with unusual course of infection of lymph-nodes. Ann Surg. (1898) 27:193–8.
2. Longo SK, Guo MG Ji AL, Khavari PA. Integrating single-cell and spatial transcriptomics to elucidate intercellular tissue dynamics. Nat Rev Genet. (2021) 22:627–44. doi: 10.1038/s41576-021-00370-8
3. Nolan JP. The evolution of spectral flow cytometry. Cytometry A. (2022). doi: 10.1002/cyto.a.24566
4. Tang F, Barbacioru C, Wang Y, Nordman E, Lee C, Xu N, et al. Mrna-Seq whole-transcriptome analysis of a single cell. Nat Methods. (2009) 6:377–82. doi: 10.1038/nmeth.1315
5. Chen G, Ning B, Shi T. Single-Cell Rna-Seq technologies and related computational data analysis. Front Genet. (2019) 10:317. doi: 10.3389/fgene.2019.00317
6. Merad M, Sathe P, Helft J, Miller J, Mortha A. The dendritic cell lineage: ontogeny and function of dendritic cells and their subsets in the steady state and the inflamed setting. Annu Rev Immunol. (2013) 31:563–604. doi: 10.1146/annurev-immunol-020711-074950
7. Stahl PL, Salmen F, Vickovic S, Lundmark A, Navarro JF, Magnusson J, et al. Visualization and analysis of gene expression in tissue sections by spatial transcriptomics. Science. (2016) 353:78–82. doi: 10.1126/science.aaf2403
8. Ji AL, Rubin AJ, Thrane K, Jiang S, Reynolds DL, Meyers RM, et al. Multimodal analysis of composition and spatial architecture in human squamous cell carcinoma. Cell. (2020) 182:497–514 e22. doi: 10.1016/j.cell.2020.05.039
9. Marx V. Method of the year: spatially resolved transcriptomics. Nat Methods. (2021) 18:9–14. doi: 10.1038/s41592-020-01033-y
10. Ritter U, Moll H, Laskay T, Brocker E, Velazco O, Becker I, et al. Differential expression of chemokines in patients with localized and diffuse cutaneous american leishmaniasis. J Infect Dis. (1996) 173:699–709. doi: 10.1093/infdis/173.3.699
11. Vickovic S, Eraslan G, Salmen F, Klughammer J, Stenbeck L, Schapiro D, et al. High-definition spatial transcriptomics for in situ tissue profiling. Nat Methods. (2019) 16:987–90. doi: 10.1038/s41592-019-0548-y
12. Rodriques SG, Stickels RR, Goeva A, Martin CA, Murray E, Vanderburg CR, et al. Slide-Seq: a scalable technology for measuring genome-wide expression at high spatial resolution. Science. (2019) 363:1463–7. doi: 10.1126/science.aaw1219
13. Stickels RR, Murray E, Kumar P, Li J, Marshall JL, Di Bella DJ, et al. Highly sensitive spatial transcriptomics at near-cellular resolution with slide-Seqv2. Nat Biotechnol. (2021) 39:313–9. doi: 10.1038/s41587-020-0739-1
14. Cable DM, Murray E, Zou LS, Goeva A, Macosko EZ, Chen F, et al. Robust decomposition of cell type mixtures in spatial transcriptomics. Nat Biotechnol. (2022) 40:517–26. doi: 10.1038/s41587-021-00830-w
15. Halpern KB, Shenhav R, Matcovitch-Natan O, Toth B, Lemze D, Golan M, et al. Single-cell spatial reconstruction reveals global division of labour in the mammalian liver. Nature. (2017) 542:352–6. doi: 10.1038/nature21065
16. Lohoff T, Ghazanfar S, Missarova A, Koulena N, Pierson N, Griffiths JA, et al. Integration of spatial and single-cell transcriptomic data elucidates mouse organogenesis. Nat Biotechnol. (2022) 40:74–85. doi: 10.1038/s41587-021-01006-2
17. Elosua-Bayes M, Nieto P, Mereu E, Gut I, Heyn H. Spotlight: seeded nmf regression to deconvolute spatial transcriptomics spots with single-cell transcriptomes. Nucleic Acids Res. (2021) 49:e50. doi: 10.1093/nar/gkab043
18. Dong R, Yuan GC. Spatialdwls: accurate deconvolution of spatial transcriptomic data. Genome Biol. (2021) 22:145. doi: 10.1186/s13059-021-02362-7
19. Andersson A, Bergenstrahle J, Asp M, Bergenstrahle L, Jurek A, Fernandez Navarro J, et al. Single-cell and spatial transcriptomics enables probabilistic inference of cell type topography. Commun Biol. (2020) 3:565. doi: 10.1038/s42003-020-01247-y
20. Korsunsky I, Millard N, Fan J, Slowikowski K, Zhang F, Wei K, et al. Fast, sensitive and accurate integration of single-cell data with harmony. Nat Methods. (2019) 16:1289–96. doi: 10.1038/s41592-019-0619-0
21. Welch JD, Kozareva V, Ferreira A, Vanderburg C, Martin C, Macosko EZ. Single-cell multi-omic integration compares and contrasts features of brain cell identity. Cell. (2019) 177:1873–87 e17. doi: 10.1016/j.cell.2019.05.006
22. Stuart T, Butler A, Hoffman P, Hafemeister C, Papalexi E, Mauck WM, et al. Comprehensive integration of single-cell data. Cell. (2019) 177:1888-902 e21. doi: 10.1016/j.cell.2019.05.031
23. Femino AM, Fay FS, Fogarty K, Singer RH. Visualization of single rna transcripts in situ. Science. (1998) 280:585–90. doi: 10.1126/science.280.5363.585
24. Moffitt JR, Bambah-Mukku D, Eichhorn SW, Vaughn E, Shekhar K, Perez JD, et al. Molecular, spatial, and functional single-cell profiling of the hypothalamic preoptic region. Science. (2018) 362. doi: 10.1126/science.aau5324
25. Ji AL, Rubin AJ, Thrane K, Jiang S, Reynolds DL, Meyers RM, et al. Multimodal analysis of composition and spatial architecture in human squamous cell carcinoma. Cell. (2020) 182:1661–2. doi: 10.1016/j.cell.2020.08.043
26. Forster R, Davalos-Misslitz AC, Rot A. Ccr7 and its ligands: balancing immunity and tolerance. Nat Rev Immunol. (2008) 8:362–71. doi: 10.1038/nri2297
27. Vinuesa CG, Cook MC. The molecular basis of lymphoid architecture and B Cell responses: implications for immunodeficiency and immunopathology. Curr Mol Med. (2001) 1:689–725. doi: 10.2174/1566524013363276
28. Cook MC, Korner H, Riminton DS, Lemckert FA, Hasbold J, Amesbury M, et al. Generation of splenic follicular structure and B cell movement in tumour necrosis factor-deficient mice. J Exp Med. (1998) 188:1503–10. doi: 10.1084/jem.188.8.1503
29. Schier AF. Single-cell biology: beyond the sum of its parts. Nat Methods. (2020) 17:17–20. doi: 10.1038/s41592-019-0693-3
30. Efremova M, Teichmann SA. computational methods for single-cell omics across modalities. Nat Methods. (2020) 17:14–7. doi: 10.1038/s41592-019-0692-4
31. Brombacher E, Hackenberg M, Kreutz C, Binder H, Treppner M. The performance of deep generative models for learning joint embeddings of single-cell multi-omics data. Front Mol Biosci. (2022) 9:962644. doi: 10.3389/fmolb.2022.962644
32. Giladi A, Cohen M, Medaglia C, Baran Y, Li B, Zada M, et al. Dissecting cellular crosstalk by sequencing physically interacting cells. Nat Biotechnol. (2020) 38:629–37. doi: 10.1038/s41587-020-0442-2
33. Hespel C, Moser M. Role of inflammatory dendritic cells in innate and adaptive immunity. Eur J Immunol. (2012) 42:2535–43. doi: 10.1002/eji.201242480
34. Brewig N, Kissenpfennig A, Malissen B, Veit A, Bickert T, Fleischer B, et al. Priming of Cd8+ and Cd4+ T cells in experimental leishmaniasis is initiated by different dendritic cell subtypes. J Immunol. (2009) 182:774–83. doi: 10.4049/jimmunol.182.2.774
35. Ritter U, Osterloh A, A. New view on cutaneous dendritic cell subsets in experimental leishmaniasis. Med Microbiol Immunol. (2007) 196:51–9. doi: 10.1007/s00430-006-0023-0
36. Cassioli C, Baldari CT. Lymphocyte polarization during immune synapse assembly: centrosomal actin joins the game. Front Immunol. (2022) 13:830835. doi: 10.3389/fimmu.2022.830835
37. Rodriguez-Fernandez JL, Criado-Garcia O. The actin cytoskeleton at the immunological synapse of dendritic cells. Front Cell Dev Biol. (2021) 9:679500. doi: 10.3389/fcell.2021.679500
38. Castro-Sanchez P, Aguilar-Sopena O, Alegre-Gomez S, Ramirez-Munoz R, Roda-Navarro P. Regulation of Cd4(+) T cell signaling and immunological synapse by protein tyrosine phosphatases: molecular mechanisms in autoimmunity. Front Immunol. (2019) 10:1447. doi: 10.3389/fimmu.2019.01447
39. Zimara N, Florian C, Schmid M, Malissen B, Kissenpfennig A, Mannel DN, et al. Langerhans cells promote early germinal center formation in response to leishmania-derived cutaneous antigens. Eur J Immunol. (2014) 44:2955–67. doi: 10.1002/eji.201344263
40. Bendall SC. Diamonds in the doublets. Nat Biotechnol. (2020) 38:559–61. doi: 10.1038/s41587-020-0511-6
41. Qian X, Harris KD, Hauling T, Nicoloutsopoulos D, Munoz-Manchado AB, Skene N, et al. Probabilistic cell typing enables fine mapping of closely related cell types in situ. Nat Methods. (2020) 17:101–6. doi: 10.1038/s41592-019-0631-4
42. Koch L. Transcriptional profiling of physically interacting cells. Nat Rev Genet. (2020) 21:275. doi: 10.1038/s41576-020-0229-9
43. Dries R, Zhu Q, Dong R, Eng CL Li H, Liu K, et al. Giotto: A Toolbox for integrative analysis and visualization of spatial expression data. Genome Biol. (2021) 22:78. doi: 10.1186/s13059-021-02286-2
44. Cang Z, Nie Q. Inferring spatial and signaling relationships between cells from single cell transcriptomic data. Nat Commun. (2020) 11:2084. doi: 10.1038/s41467-020-15968-5
45. Arnol D, Schapiro D, Bodenmiller B, Saez-Rodriguez J, Stegle O. Modeling cell-cell interactions from spatial molecular data with spatial variance component analysis. Cell Rep. (2019) 29:202–11e6. doi: 10.1016/j.celrep.2019.08.077
46. Biswas A, Ghaddar B, Riedlinger G, De S. Inference on spatial heterogeneity in tumour microenvironment using spatial transcriptomics data. Comput Syst Oncol. (2022) 2:3. doi: 10.1002/cso2.1043
47. Meshcheryakova A, Mungenast F, Ecker R, Mechtcheriakova D. Tissue Image Cytometry. (2021). In: Imaging Modalities for Biological and Preclinical Research: A Compendium, Volume 1. IOP Publishing. doi: 10.1088/978-0-7503-3059-6ch14
48. Wang X, Fan J. Spatiotemporal molecular medicine: a new era of clinical and translational medicine. Clin Transl Med. (2021) 11:e294. doi: 10.1002/ctm2.294
Keywords: proteomics, RNA-seq, spatial transcriptomics, multiplex imaging, physically interacting cells, dendritic cells, T cells
Citation: Ritter U (2023) In situ veritas: combining omics and multiplex imaging can facilitate the detection and characterization of cell-cell interactions in tissues. Front. Med. 10:1155057. doi: 10.3389/fmed.2023.1155057
Received: 31 January 2023; Accepted: 25 April 2023;
Published: 01 June 2023.
Edited by:
Quan Nguyen, The University of Queensland, AustraliaReviewed by:
Camelia Quek, Melanoma Institute Australia, AustraliaCopyright © 2023 Ritter. This is an open-access article distributed under the terms of the Creative Commons Attribution License (CC BY). The use, distribution or reproduction in other forums is permitted, provided the original author(s) and the copyright owner(s) are credited and that the original publication in this journal is cited, in accordance with accepted academic practice. No use, distribution or reproduction is permitted which does not comply with these terms.
*Correspondence: Uwe Ritter, dXdlLnJpdHRlckB1a3IuZGU=
Disclaimer: All claims expressed in this article are solely those of the authors and do not necessarily represent those of their affiliated organizations, or those of the publisher, the editors and the reviewers. Any product that may be evaluated in this article or claim that may be made by its manufacturer is not guaranteed or endorsed by the publisher.
Research integrity at Frontiers
Learn more about the work of our research integrity team to safeguard the quality of each article we publish.