 Yanting Shi
 Ning Wei1
 Bing Lv
94% of researchers rate our articles as excellent or good
Learn more about the work of our research integrity team to safeguard the quality of each article we publish.
Find out more
SYSTEMATIC REVIEW article
Front. Med., 02 May 2023
Sec. Gastroenterology
Volume 10 - 2023 | https://doi.org/10.3389/fmed.2023.1134980
This article is part of the Research TopicCapsule Endoscopy Procedure for the Diagnosis of Gastrointestinal DiseasesView all 7 articles
Background and aims: The diagnosis of chronic atrophic gastritis (CAG) under normal white-light endoscopy depends on the endoscopist's experience and is not ideal. Artificial intelligence (AI) is increasingly used to diagnose diseases with good results. This review aimed to evaluate the accuracy of AI-assisted diagnosis of CAG through a meta-analysis.
Methods: We conducted a comprehensive literature search of four databases: PubMed, Embase, Web of Science, and the Cochrane Library. Studies published by November 21, 2022, on AI diagnosis CAG with endoscopic images or videos were included. We assessed the diagnostic performance of AI using meta-analysis, explored the sources of heterogeneity through subgroup analysis and meta-regression, and compared the accuracy of AI and endoscopists in diagnosing CAG.
Results: Eight studies that included a total of 25,216 patients of interest, 84,678 image training set images, and 10,937 test set images/videos were included. The results of the meta-analysis showed that the sensitivity of AI in identifying CAG was 94% (95% confidence interval [CI]: 0.88–0.97, I2 = 96.2%), the specificity was 96% (95% CI: 0.88–0.98, I2 = 98.04%), and the area under the summary receiver operating characteristic curve was 0.98 (95% CI: 0.96–0.99). The accuracy of AI in diagnosing CAG was significantly higher than that of endoscopists.
Conclusions: AI-assisted diagnosis of CAG in endoscopy has high accuracy and clinical diagnostic value.
Systematic review registration: http://www.crd.york.ac.uk/PROSPERO/, identifier: CRD42023391853.
According to global cancer data released by the International Agency for Research on Cancer (IARC), approximately 1.09 million new cases of gastric cancer (GC) and approximately 770,000 deaths were recorded in 2020, ranking fifth in incidence and fourth in mortality (1). Professor Correa proposed that the development of intestinal-type gastric adenocarcinoma follows a cascade pattern: from normal gastric mucosa to chronic non-atrophic gastritis (CNAG), followed by chronic atrophic gastritis (CAG), atypical hyperplasia (dysplasia), and finally to intestinal GC (2, 3). This model has been widely recognized (4–6). A Dutch study found that the annual incidence of GC was 0.1 and 0.25% for patients with atrophic gastritis (AG) and intestinal metaplasia (IM), respectively (7). The risk of GC is higher in the CAG population in East Asia, and a long-term follow-up study in Japan found that the 10-year cumulative GC incidence after Helicobacter pylori eradication ranged from 3.4 to 16% in patients with moderate-to-severe atrophy and from 11 to 16% in patients with IM (8). A Korean study found that 52.5% of patients with diffuse GC had AG, and 18.4% had severe AG (9). CAG is a precancerous disease; therefore, early diagnosis of CAG is vital in preventing GC (10, 11).
Gastroscopic biopsy of the gastric mucosal tissue for histopathological analysis is the “gold standard” for diagnosing CAG (12, 13). In clinical endoscopy, gastric mucosal tissues are first observed by conventional white-light endoscopy, and the need for endoscopic biopsy depends on the endoscopist's experience. A study showed that the sensitivity of conventional normal white light endoscopy (WLE) for diagnosing CAG is only 42% (14). Another study showed that the diagnostic sensitivity and specificity of conventional WLE for gastric mucosal atrophy were 61.5 and 57.7% for the gastric sinus, and 46.8 and 76.4% for the gastric body, respectively (15). In recent years, electronic or virtual color endoscopy has received increasing attention for the diagnosis CAG because it allows for more accurate detection of lesion (16, 17). However, these advanced techniques are usually further steps taken when CAG is already suspected after WLE, and the accuracy of endoscopic diagnosis still relies on the endoscopist's experience (18). It is difficult to avoid missed diagnoses due to fatigue and inexperience of endoscopists. Biopsies are expensive and time-consuming, and could increase the risk of gastric mucosal bleeding. Therefore, developing a method to identify CAG objectively, stably, and accurately is important to reduce the workload of endoscopists and to prevent the occurrence of GC.
In recent years, artificial intelligence (AI) technology, particularly deep learning, has become a popular analytical tool for medical imaging (19). AI techniques have been widely used in computer-aided diagnosis (20–22). In computer vision, the primary tasks of deep learning include image classification, object detection, and semantic segmentation. Image classification determines the category to which a given image belongs, and typical algorithms include VGGNet (23), ResNet (24), TResNet (25), and SE-ResNet (26). Object Detection is used to identify objects and their positions in the image and frame them with rectangles, such as R-CNN (27), YOLO (28, 29), and SSD (30). Semantic segmentation involves recognizing the objects and their positions in the image and outlines them in the image. Typical algorithms are U-Net (31), UNet++ (32), and DeeplabV3 (33). The differences between the three algorithms are shown in Figure 1. If AI can accurately identify CAG on endoscopy, it will greatly alleviate the current problems faced in CAG diagnosis. However, this requires a combination of existing studies to quantify the accuracy of AI in detecting CAG.
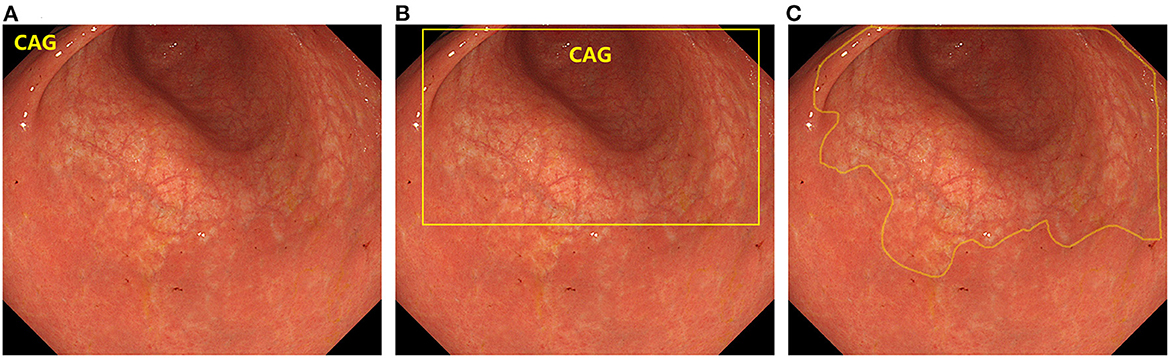
Figure 1. The difference between the three types of deep learning algorithms. (A) Image classification. (B) Object detection. (C) Semantic segmentation.
This meta-analysis aimed to systematically review and analyze the diagnostic performance of AI in CAG. It mainly includes the overall performance of AI in CAG diagnosis, comparison between AI and endoscopists, and analysis of various factors that influence the diagnostic performance of AI.
This systematic review followed the guidelines of the preferred reporting items for systematic review and meta-analysis of diagnostic test accuracy studies (PRISMA-DTA) (34). The PRISMA-DTA checklist is shown in Supplementary Table S1. Before initiating the study, it was registered with the International Prospective Register of Systematic Reviews (PROSPERO) on October 31, 2022 (ID: CRD42022371134). All data for this study were collected from the literature, and ethical approval was not required.
We systematically searched the following four databases: PubMed, Embase, Web of Science, and Cochrane Library. PubMed, Embase, and Web of Science are widely used medical databases, while the Cochrane Library is a database related to evidence-based medicine. The last search was conducted on November 21, 2022 and covered all articles in the four databases up to the time of the search. The keywords searched included ten terms related to AI and five related to CAG. The keywords related to AI included “artificial intelligence,” “deep learning,” “machine learning,” “computer aided diagnosis,” “neural networks,” “transfer learning,” and “transformer.” The keywords related to CAG include “atrophic,” “atrophy,” “gastritis,” “intestinal metaplasia,” and “endoscopy.” The search strategy is presented in Supplementary Table S2.
Two authors (NW and FY) independently screened the retrieved articles to determine whether they met the inclusion criteria. When judgment could not be made based on the title and abstract, the full text of the article was reviewed. All disagreements were resolved through discussion with YS.
The inclusion criteria were as follows: (1) Studies using AI to diagnose CAG; (2) diagnosis was based on endoscopic images or videos; (3) compositions of the dataset were described in detail; (4) clear diagnostic criteria, pathology or expert consensus.; (5) studies that provided the number of true positives (TP), false positives (FP), true negatives (TN), and false negatives (FN), either directly, or indirectly; and (6) for similar studies by the same author or team, preference was given to prospective studies and those with larger sample sizes.
The exclusion criteria were as follows: (1) studies without primary data (e.g., narrative reviews, comments, letters); (2) studies whose full text was unavailable; and (3) studies with insufficient data to obtain TP, FP, TN, and FN. We contacted the corresponding author of the article by email to obtain relevant data and will include the article if we can receive a response before the official publication of this meta-analysis.
NW and TT independently extracted data for inclusion in the study, and all disagreements were resolved by discussion with YS. For each study, the following data were collected: first author, year of publication, country or region, diagnostic criteria, endoscopy type, data source, number of patients, number of images/lesions in the training set, number of patients/images/videos/lesions in the test set, AI algorithm, and number of TP, FP, TN, and FN. In a study with multiple sets of test data, we selected according to the following rules: (1) preference for prospective test results; (2) preferences were given to external test results; and (3) preference was given to test results with a large sample size.
We also extracted data related to the endoscopic diagnosis of CAG by endoscopists to compare with the diagnostic performance of AI.
The most commonly used instrument for evaluating the quality of diagnostic trials is the Quality Assessment of Diagnostic Accuracy Studies Version 2 (QUADAS-2) tool (35). There is no widely accepted assessment tool for the quality assessment of diagnostic assistance provided by AI. We referenced two studies (36, 37) and added four questions to QUADAS-2 to precisely assess the studies included in this meta-analysis. The following were also added to the patient selection section: (1) whether the data source and data set division is described in detail. (2) Whether the preprocessing process of the data was described. The following were added to the index test section: (1) whether the type of endoscopy used is clearly described and (2) whether the test set setting is reasonable.
To evaluate the performance of AI in diagnosing CAG, we summarized the sensitivity, specificity, positive likelihood ratio (PLR), negative likelihood ratio (NLR), diagnostic odds ratio (DOR), and 95% confidence intervals (CI) based on the extracted TP, TN, FP, and FN data. The summary receiver operating characteristic (sROC) curve was plotted and the area under the curve (AUC) was calculated. The higher the PLR value, the better the AI can confirm the diagnosis of CAG. The smaller the NLR value, the better the AI can exclude CAG. AUC and DOR are comprehensive indicators of diagnostic performance, and larger values indicate stronger diagnostic capability of AI.
Publication bias was analyzed using the Deek's test and funnel plot, and publication bias was significant at P < 0.05. To explore the accuracy of AI in identifying CAG in different subgroups and possible sources of heterogeneity in the study, we performed subgroup analysis and meta-regression with the following grouping conditions: training set size, AI algorithm type, endoscope type, test set as image or video, and diagnostic criteria. The heterogeneity of the included studies was tested using the Cochrane Q test, with I2 > 50% or a P value < 0.05, indicating significant heterogeneity.
We assessed the quality of the included studies using Review Manager 5.4 (Cochrane Collaboration, Oxford, UK) and completed all statistics and analyses using Stata/SE 16.0 (StataCorp LLC, College Station, TX, USA) with the MIDAS package installed.
The literature search retrieved 10,494 studies, of which 3,016 duplicates were automatically removed using a software. A total of 7,444 mismatched studies were manually removed by reading the abstracts. After reading the full texts of the remaining articles, 26 more studies were excluded. Finally, eight studies were included in this meta-analysis (38–45); details of the articles are shown in Table 1, and the flow chart of study selection is shown in Figure 2. One study (46) was excluded because TP, TN, FP, and FN data were unavailable. Two studies (43, 47) were from the same team, one of which (47) constructed and tested a CAG diagnostic model, and the other (43) performed a further test; hence, we selected the more extensive test set of data (43) included in this meta-analysis. Two other studies (41, 48) were also from the same team; one study (41) used AI to identify AG and IM, and another study (48) added the identification of GC to the former, and we chose the first (41) to be included in this meta-analysis. Three studies were excluded because only IM was identified (49–51).
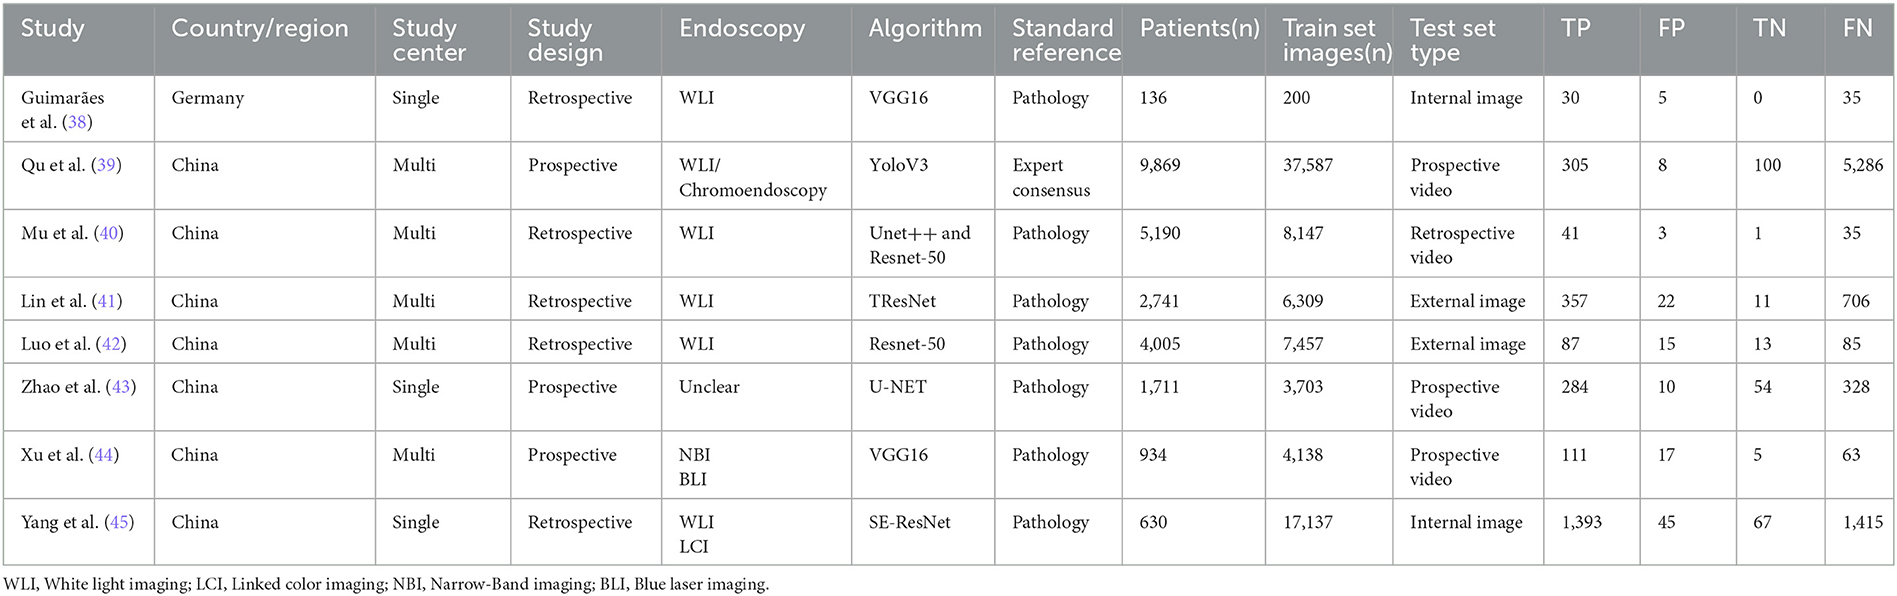
Table 1. Details of the included studies.
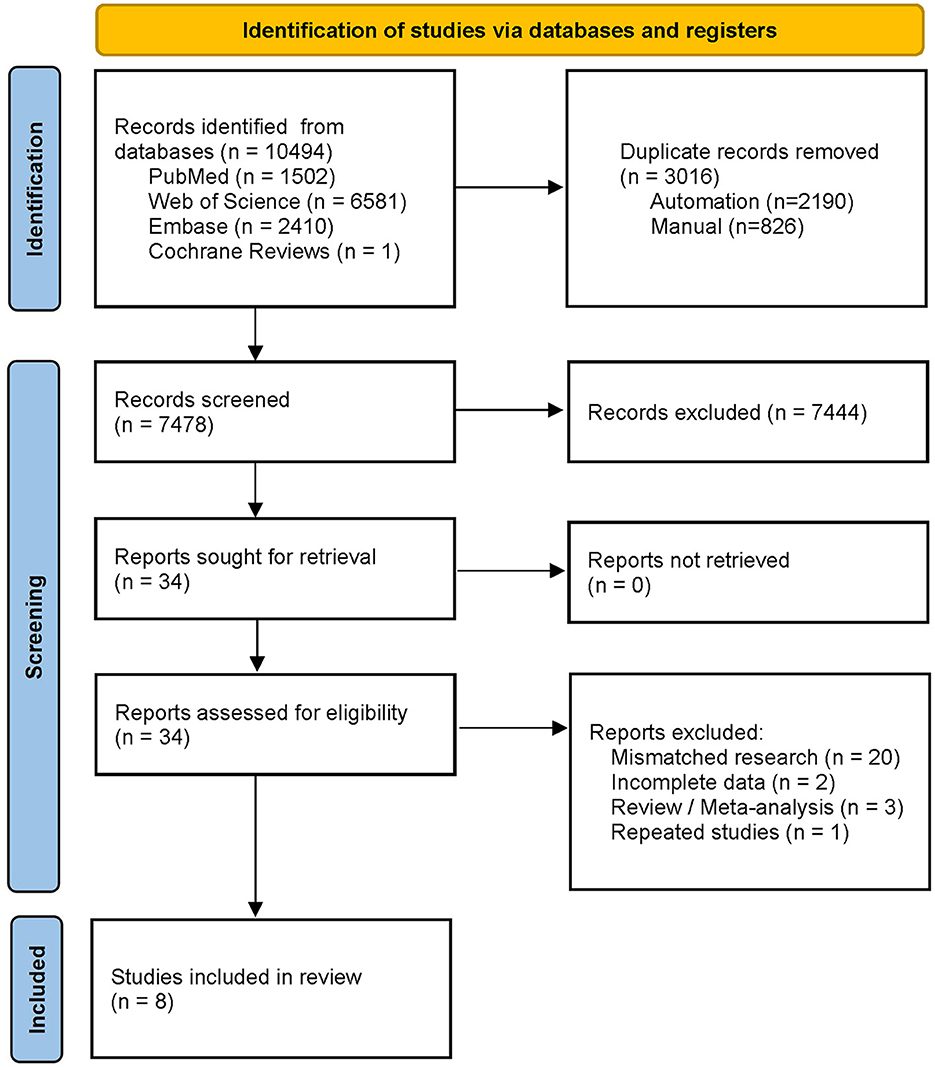
Figure 2. PRISMA flow diagram for study selection.
The included studies were evaluated using the QUADAS-2 tool. Five articles had low levels of bias, two articles had a high bias, and one article had an unclear bias, as shown in Figure 3. Yang et al. (45) evaluated the model using a data-enhanced test set and considered it to have a high risk of bias. The study by Zhao et al. (43) did not mention the type of endoscope used and was considered to have an unclear risk of bias.
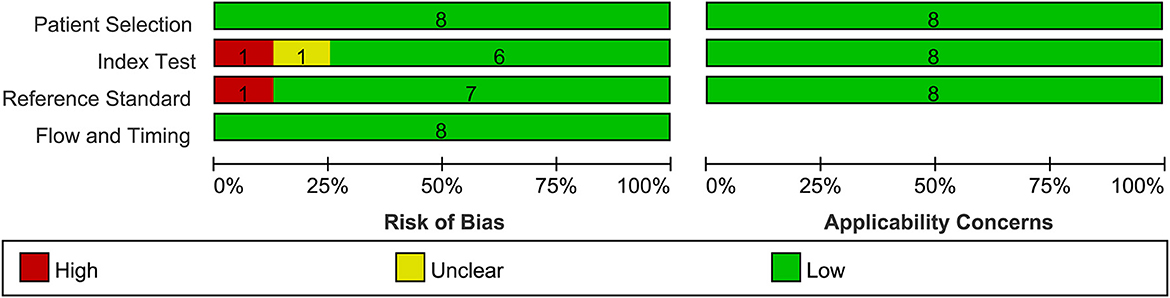
Figure 3. Summary of risk of bias and applicability of concerns graph.
The study by Qu et al. (39) did not use pathological findings as a diagnostic criterion but used expert consensus. There is a discrepancy between CAG diagnosis through endoscopic images and pathological results. However, the use of chromoendoscopy images (52) and the consensus of experts can reduce these errors. After discussions among all the authors, we decided to include this study, but it had a high risk of bias.
Five of the eight studies were retrospective (38, 40–42, 45), and three were prospective (29, 43, 44). All eight studies used deep-learning techniques: five used image-classification algorithms (38, 41, 42, 44, 45), one used an object-detection algorithm (39), one used a semantic-segmentation algorithm (43), and one used a combination of image classification and semantic segmentation (40). All studies were tested using static image models, and four studies used prospective videos to validate the models further (39, 40, 43, 44). Regarding the type of endoscopy, four studies included only normal white-light endoscopy (38, 40–42), three used enhanced endoscopy (39, 44, 45), and one did not specify the type of endoscopy (43). Seven studies used pathology as the gold standard, and one used expert consensus as the decision criterion (39).
Two studies used the internal image test set (38, 45), two studies used the external image test set (41, 42), one study used the retrospective video test set (40), and three studies used the prospective video test set (39, 43, 44). The number of test set images or videos equals the sum of TP, FP, TN, and FN values. The type and number of test sets mentioned here refer only to the data extracted by this systematic review.
Qu et al. (39) developed a complete gastrointestinal lesion identification system that can identify ten diseases, including CAG. Only test data for CAG identification were included in the meta-analysis.
Mu et al. (40) developed an AI-based assisted diagnosis system for identifying four lesions: GA, IM, erosive, and hemorrhagic gastritis. The entire system consisted of five deep-learning models. We extracted the results of the DCNN2 model to identify CAG.
Lin et al. (41) developed a computer-aided decision system for identifying the GA and IM. We obtained TP, FP, TN, and FN data by calculation, and the GA and IM identification results were combined and included in this meta-analysis.
Luo et al. (42) developed two AI models. Model 1 was used to identify CAG and the degree of atrophy, and both training and testing of model 1 used gastric sinus images. Model 2 was used to identify CAG, and the performance of model 2 was evaluated using three test sets, referred to as test sets 3, 4, and 5 in this study. Test set 3 was the internal test set, and test sets 4 and 5 were the external test sets; however, test set 5 did not contain the gastric sinus images. We selected the evaluation results of model 2 in test set 4 for inclusion in this meta-analysis.
Xu et al. (44) developed a real-time detection system for identifying GA and IM and tested it on internal, external, and prospective videos. We obtained TP, FP, TN, and FN data by calculating the recognition results of GA and IM and recomputed the sensitivity, specificity, and accuracy of CAG.
We performed a pooled analysis of the eight included studies to assess the overall performance of AI in the endoscopic-assisted diagnosis of CAG. As shown in Figure 4, the pooled sensitivity and specificity were 94% (95% CI: 0.88–0.97, I2 = 96.2%) and 96% (95% CI: 0.88–0.98, I2 = 98.04%), respectively, both of which showed significant heterogeneity. The pooled PLR, NLR, and DOR were 21.58 (95% CI: 7.91–58.85, I2 = 96.23%), 0.07 (95% CI: 0.04–0.13, I2 = 95.95%, Supplementary Figure S1), and 320.19 (95% CI: 128.5–797.84, I2 = 100%, Supplementary Figure S2), respectively. The PLR greater than 10 indicated that AI could confirm the diagnosis of CAG. The NLR less than 0.1 indicated that AI could effectively exclude CAG. The DOR is significantly greater than 1, which indicates that AI has a good discrimination of CAG.
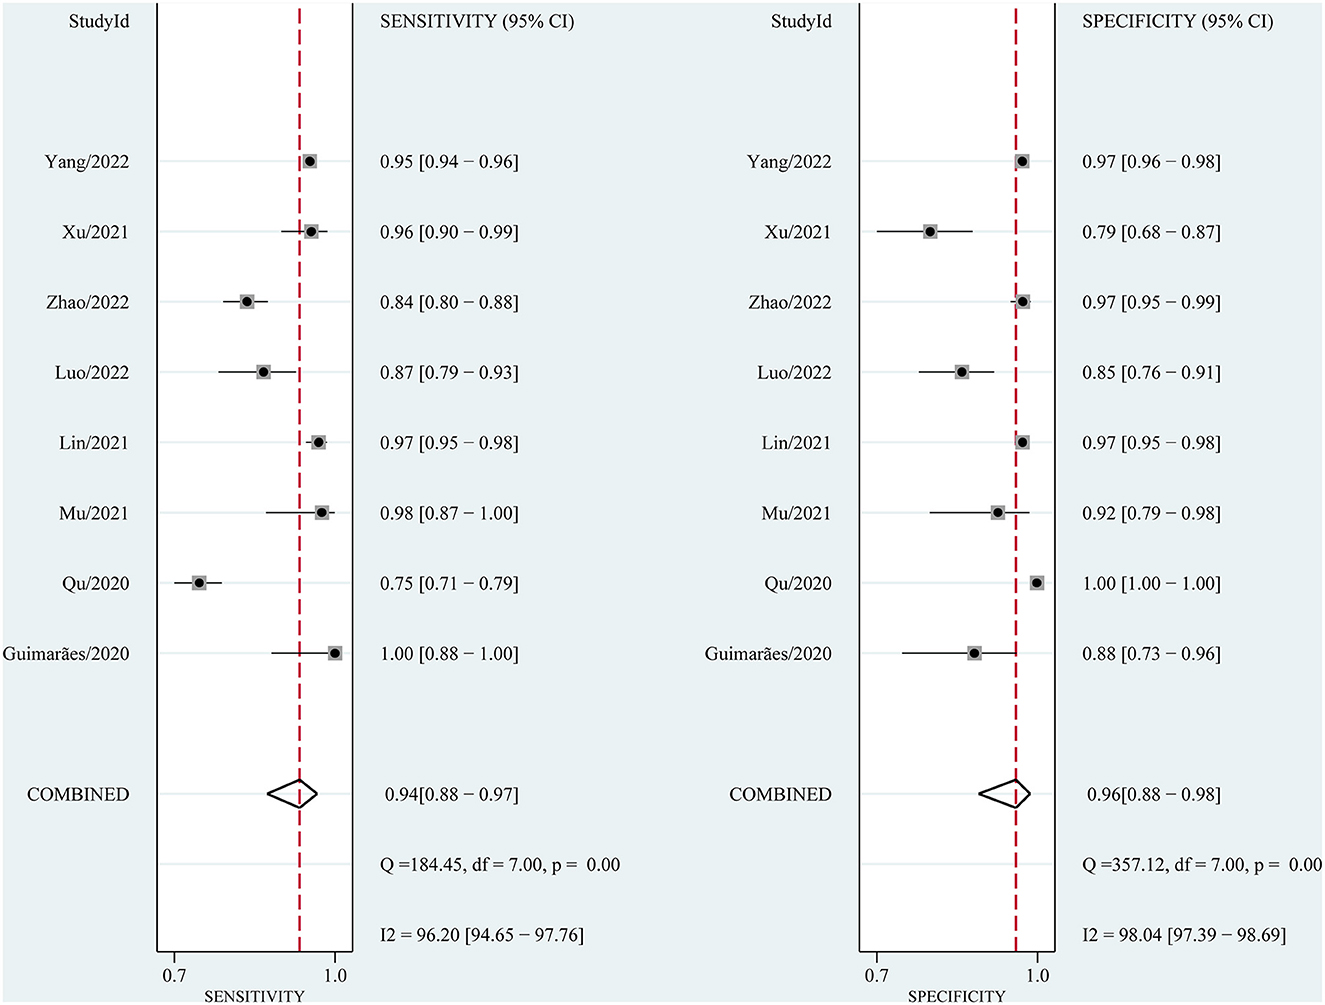
Figure 4. Forest plot of sensitivity and specificity of AI in identifying CAG.
The sROC curve is shown in Figure 5, and the AUC was 98% (95% CI: 0.96–0.99). The sROC is a composite index reflecting the sensitivity and specificity of continuous variables, and the closer the AUC value is to 1, the better the diagnosis. This shows that AI has excellent performance in the diagnosis of CAG.
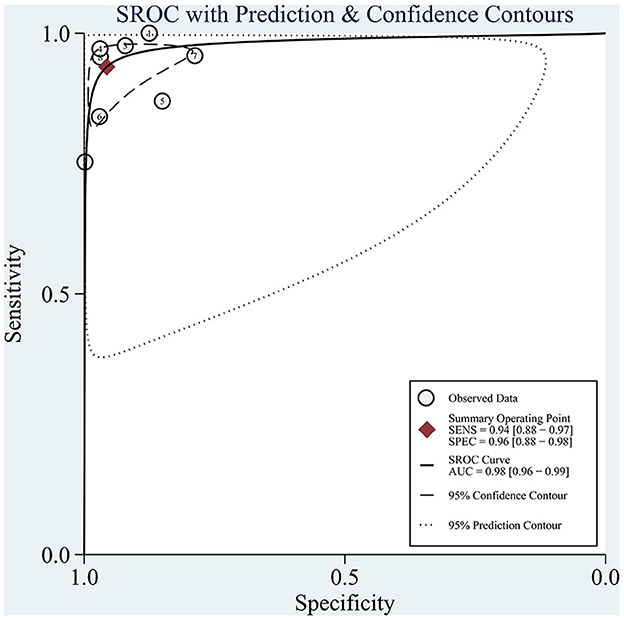
Figure 5. sROC curves for the diagnosis of CAG using AI. Each circle indicates an individual study, red diamond represents summary sensitivity and specificity.
We evaluate the clinical diagnostic capability of the AI models by means of Fagan plot (Figure 6). The global prevalence of CAG in the general population when biopsy is considered to be 33% (95% CI: 0.26–0.41) (53). We set the pretest probability to 33%, with a 91% probability of a positive patient being diagnosed with CAG and a 3% probability of a negative patient being diagnosed with CAG. The above data indicate that the diagnosis of CAG with AI has good accuracy and important clinical application.

Figure 6. Fagan nomogram of the accuracy of AI in the diagnosis of CAG.
The I2 values for pooled sensitivity and specificity were 96.2 and 98.04%, respectively, indicating high heterogeneity of the included studies. We performed a subgroup analysis and meta-regression analysis to explore possible sources of heterogeneity based on the test set type (image or video), endoscopic imaging type (WLI or other), algorithm type (image classification or object detection with semantic segmentation), diagnostic criteria (pathology or other), endoscope type (pure normal white light endoscopy or other), and the number of training set images (whether the number of images was greater than 7,000. In 7,000 is a median that exactly divides the eight studies equally into two groups). The results are shown in Figure 7 and Table 2.
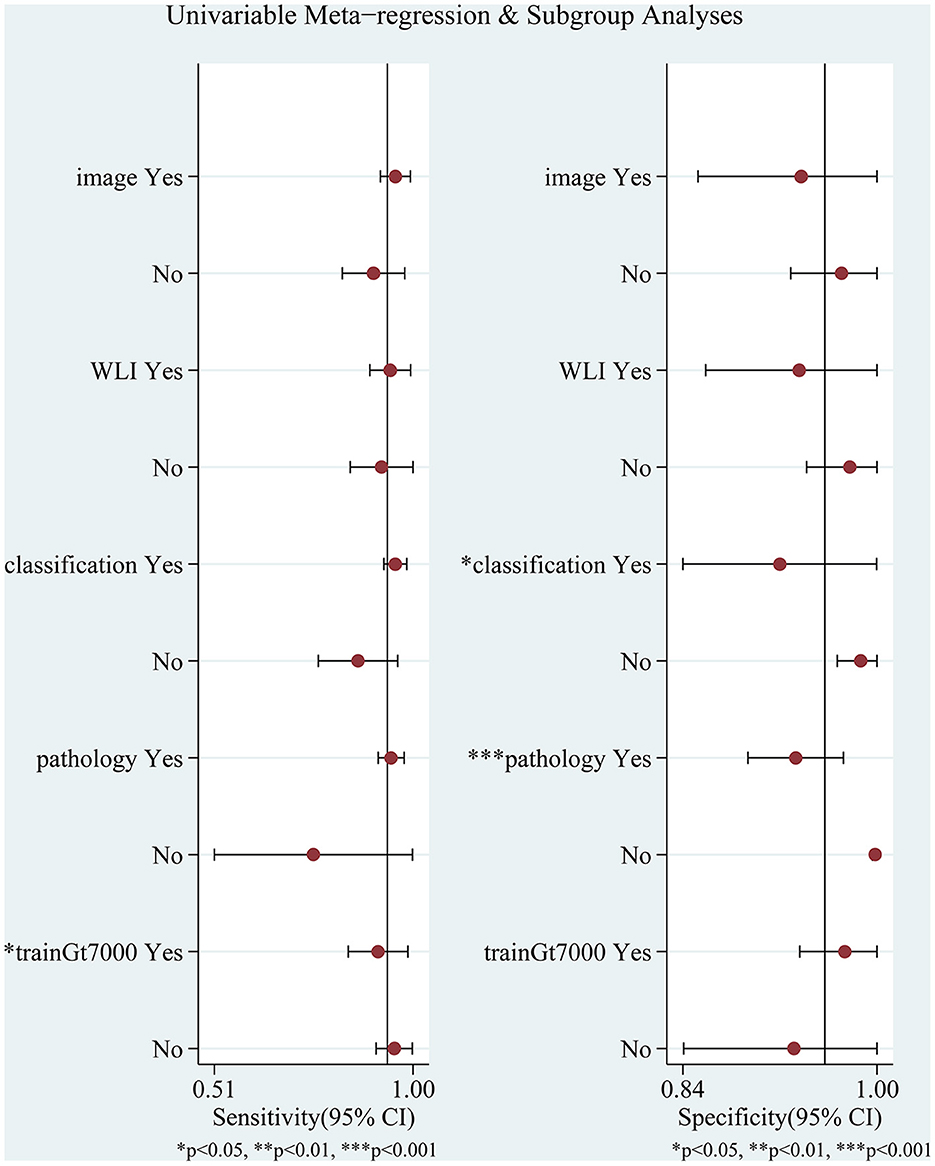
Figure 7. Meta-regression and subgroup analyses for potential sources of heterogeneity. WLI: endoscopic imaging type is WLI or other; image: test set as image or video; classification: AI algorithm an image classification algorithm or other algorithms; pathology: whether to use pathology as a diagnostic criterion; trainGt7000: whether the number of images was greater than 7,000.
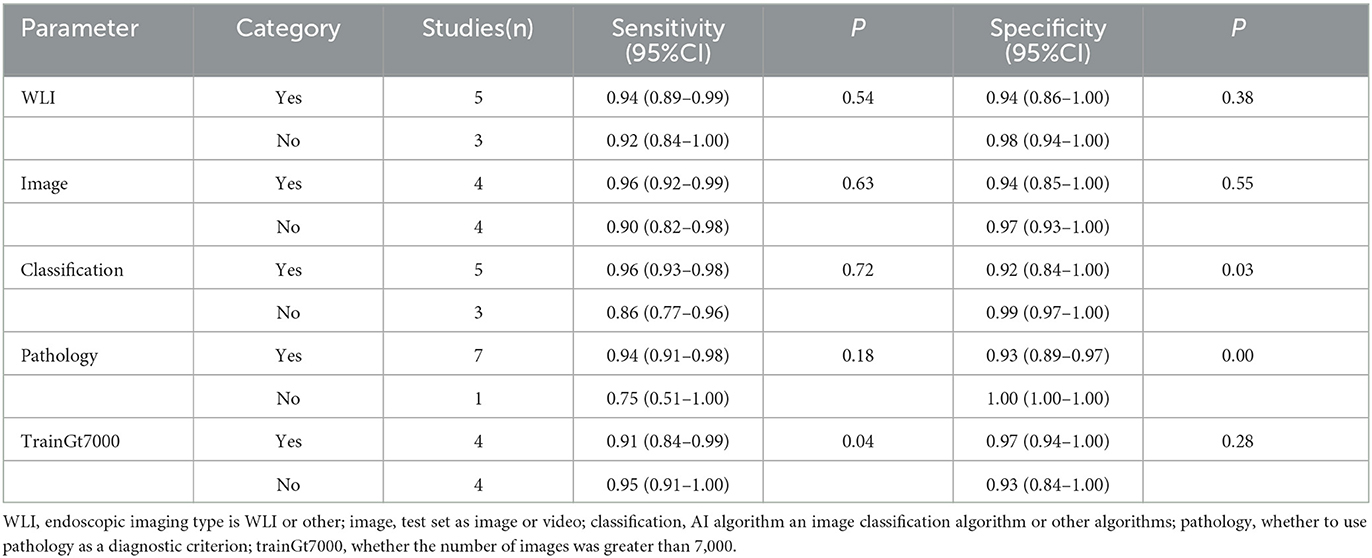
Table 2. Subgroup analyses and meta-regression results.
Meta-regression analysis showed that the number of training set images (p = 0.04) significantly affected sensitivity and could be a potential source of sensitivity heterogeneity. Algorithm type (p = 0.03) had a significant effect on specificity, and diagnostic criteria (p = 0.00) had a highly significant effect on specificity, which may be a potential source of heterogeneity in specificity. Other factors had no statistically significant effects on sensitivity and specificity. Although the study by Zhao et al. (43) did not specify the type of endoscopic imaging, we categorized it as a pure white light imaging or another form of imaging, neither of which had a significant effect on the results.
To further explore the heterogeneity of the studies, we performed a pooled analysis after removing each study individually. The results did not change significantly, indicating that the combined results were relatively stable.
We used the Deeks' funnel plots to evaluate publication bias. As shown in Figure 8, there was no significant publication bias in the included studies (p = 0.19). Although the Deeks' test was used, only eight studies were included, and there was still a risk of significant publication bias.
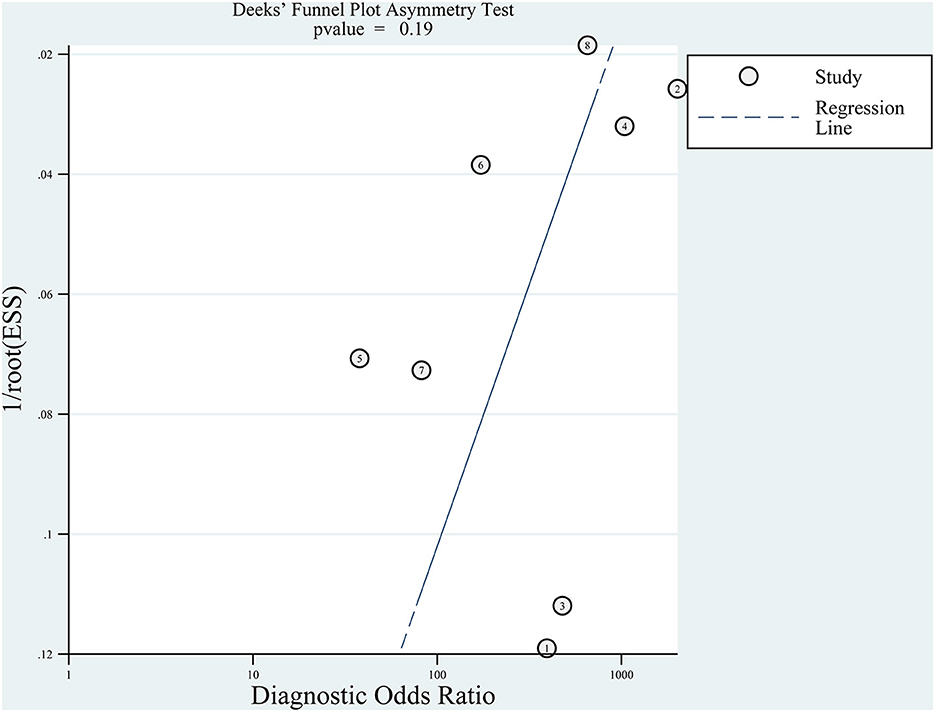
Figure 8. Deeks' funnel plot asymmetry test for publication.
From the eight included studies, we extracted five groups of data comparing (AI) with endoscopists (38, 40, 41, 43, 44). An essential condition for inclusion was that the same dataset had to be used for AI vs. endoscopist comparisons.
The study by Qu et al. (39) was excluded because no comparison between AI and endoscopists was found. The study by Luo et al. (42) was excluded because it used a test set containing only gastric sinus images for the comparison of AI with endoscopists. The study by Yang et al. (45) was excluded because it failed to extract the endoscopist's TP, FP, TN, and FN values. Details of the included studies are presented in Table 3.
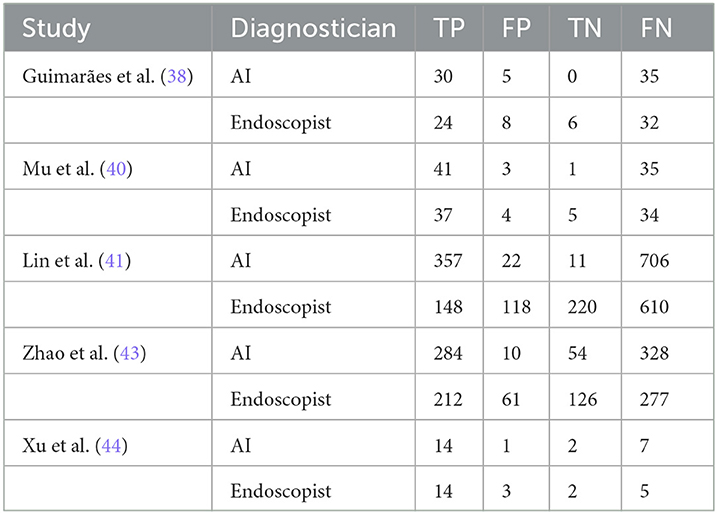
Table 3. AI vs. endoscopist related studies.
We pooled the data of the AI and endoscopists and performed a subgroup analysis. The results were as follows: the sensitivities of AI and endoscopists in diagnosing CAG were 95% (95% CI: 0.91–1.00) and 73% (95% CI: 0.55–0.91) (p = 0.1), and the specificities were 96% (95% CI: 0.95–0.98) and 82% (95% CI: 0.78–0.86) (p = 0.00), respectively. AI had higher sensitivity and specificity than endoscopists, with no statistically significant difference in sensitivity and a highly significant statistical difference in specificity between the two.
This systematic review and meta-analysis aimed to analyze the accuracy of AI techniques in aiding endoscopic-assisted diagnosis of chronic atrophic gastritis. To our knowledge, this study is the first meta-analysis of the accuracy of endoscopic AI in diagnosing CAG and comparing it with that of endoscopists. A total of eight studies involving 25,216 patients of interest, 84,678 image training set images, and 10,937 test set images/videos were included.
The overall performance of AI in diagnosing CAG was pooled. The pooled sensitivity and specificity were 94% (95% CI: 0.88–0.97, I2 = 96.2%) and 96% (95% CI: 0.88–0.98, I2 = 98.04%), respectively. The composite AUC and DOR to assess diagnostic accuracy were 98% (95% CI: 0.96–0.99) and 320.19 (95% CI: 128.5–797.84, I2 = 100%), respectively. The above data suggest that AI has an excellent diagnostic performance for CAG on endoscopic images or videos. We further compared the performance of AI with that of endoscopists in diagnosing CAG and found that the sensitivity and specificity of AI were significantly higher than those of endoscopists.
There was high heterogeneity among the included studies. Meta-regression analysis was used to determine whether pure normal white light endoscopy or other enhanced endoscopy was used and whether the test set consisted of pictures or videos that did not significantly affect the pooled diagnostic results. The different algorithm types significantly affected the pooled specificity (p = 0.03), with the classification algorithm subgroup having a significantly higher specificity than the other algorithm subgroups. However, endoscopists prefer AI to label the lesion site clearly in an image or video. The number of training set images significantly affected the aggregation sensitivity output (p = 0.04). The sensitivity of aggregation was significantly higher for the subgroup with more than 7,000 training set pictures than for the subgroup with < 7,000 images. Hence, more training set images may lead to a higher sensitivity. The effect of pathology as the gold standard was highly significant for combined specificity, with only one of the eight studies not using pathology as the gold standard, which could be a potential source of heterogeneity in the pooled results.
This systematic review and meta-analysis had some limitations. (1) Few studies were included, and with eight studies, seven of which were conducted in China, the results may not be representative of the broader population. (2) The pooled results had a high degree of heterogeneity, as not using pathology as the “gold standard,” using different AI algorithms, and using different numbers of training sets are potential sources of heterogeneity. (3) The performance of AI was overestimated. Some studies used test sets with small sample sizes to train the models. Most studies screened training images, which may have caused the AI models to be overfitted. Some studies did not use external test sets or prospective validation sets to test the models, which may have masked the overfitting problem and caused the AI performance to be overestimated.
Despite the excellent performance of AI diagnosis of CAG in endoscopy, there are some pending issues in this area. (1) The performance of AI models cannot be measured uniformly owing to the lack of publicly available datasets. Each study used its own collected dataset for performance evaluation, and different imaging types, image screening processes, and image/video quality can lead to differences in experimental results. (2) Most studies did not include any interference from other diseases. Only two studies identified other diseases (39, 40). Some diseases can seriously impact the mirror diagnosis of CAG, such as erosive gastritis. The performance of AI requires further validation after including the interference from other diseases. (3) Limited replicability of the studies. Most studies included in this systematic review did not make their codes open. This has hindered the validation of their algorithms by other researchers. Code-sharing is essential to repeat the experiment and promote continued progress in the field.
This systematic review and meta-analysis provides a comprehensive overview and quantitative analysis of the current research on AI-assisted diagnosis of CAG and shows that it has good diagnostic performance. Thus, it can be used as an effective auxiliary diagnostic tool in clinical practice. It can provide an accurate diagnosis and reduce the associated time and costs. At the same time, we should also be aware of the limitations of AI models: (1) Limited training data can affect the accuracy and generalization ability of the model. (2) Insufficient diversity of training data can lead to bias in the prediction of the model. (3) The real endoscopic environment is much more complex than the training environment of the model, which may lead to misdiagnosis or missed diagnosis during actual clinical use.
In conclusion, the results of our meta-analysis suggest that AI can provide more accurate diagnostic information on CAG and has high clinical diagnostic value. We hope that our findings will contribute to advance the development and application of AI technology in clinical practice.
The datasets presented in this study can be found in online repositories. The names of the repository/repositories and accession number(s) can be found in the article/Supplementary material.
YS and BL conceived the idea. YS analyzed the data and wrote the manuscript with the support of the other authors. NW, FY, and TT screened the collected data. BL provided suggestions for the project and revised the manuscript. KW validated the statistics and revised the manuscript. All authors discussed the project and read and approved the final manuscript.
We thank Lihong Ma from Zibo Central Hospital for proofreading the meta-analysis results.
The authors declare that the research was conducted in the absence of any commercial or financial relationships that could be construed as a potential conflict of interest.
All claims expressed in this article are solely those of the authors and do not necessarily represent those of their affiliated organizations, or those of the publisher, the editors and the reviewers. Any product that may be evaluated in this article, or claim that may be made by its manufacturer, is not guaranteed or endorsed by the publisher.
The Supplementary Material for this article can be found online at: https://www.frontiersin.org/articles/10.3389/fmed.2023.1134980/full#supplementary-material
AI, Artificial intelligence; AUC, Area under the sROC curve; BLI, Blue laser imaging; CAG, Chronic atrophic gastritis; CI, Confidence interval; DL, Deep learning; DOR, Diagnostic odds ratio; FN, False negative; FP, False positive; IM, Intestinal metaplasia; LCI, Linked color imaging; NBI, Narrow-Band imaging; NLR, Negative likelihood ratio; PLR, Positive likelihood ratio; sROC: summary Receiver Operating Characteristic; TN, True negative; TP, True positive; WLE, White light endoscopy; WLI, White light imaging.
1. Sung H, Ferlay J, Siegel RL, Laversanne M, Soerjomataram I, Jemal A, et al. Global cancer statistics 2020: GLOBOCAN estimates of incidence and mortality worldwide for 36 cancers in 185 countries. CA Cancer J Clin. (2021) 71:209–49. doi: 10.3322/caac.21660
3. Correa P. Human gastric carcinogenesis: A multistep and multifactorial process–First American Cancer Society Award Lecture on Cancer Epidemiology and Prevention. Cancer Res. (1992) 52:6735–40.
4. Dinis-Ribeiro M, Areia M, de Vries A, Marcos-Pinto R, Monteiro-Soares M, O'Connor A, et al. Management of precancerous conditions and lesions in the stomach (MAPS): guideline from the European Society of Gastrointestinal Endoscopy (ESGE), European Helicobacter Study Group (EHSG), European Society of Pathology (ESP), and the Sociedade Portuguesa de Endoscopia Digestiva (SPED). Endoscopy. (2012) 44:74–94. doi: 10.1055/s-0031-1291491
5. Pasechnikov V, Chukov S, Fedorov E, Kikuste I, Leja M. Gastric cancer: Prevention, screening and early diagnosis. World J Gastroenterol. (2014) 20:13842–62. doi: 10.3748/wjg.v20.i38.13842
6. Syrjänen K, Eskelinen M, Peetsalu A, Sillakivi T, Sipponen P, Härkönen M, et al. GastroPanel® biomarker assay: The most comprehensive test for Helicobacter pylori infection and its clinical sequelae. A critical review. Anticancer Res. (2019) 39:1091–104. doi: 10.21873/anticanres.13218
7. de Vries AC, van Grieken NCT, Looman CWN, Casparie MK, de Vries E, Meijer GA, et al. Gastric cancer risk in patients with premalignant gastric lesions: A nationwide cohort study in the Netherlands. Gastroenterology. (2008) 134:945–52. doi: 10.1053/j.gastro.2008.01.071
8. Shichijo S, Hirata Y, Niikura R, Hayakawa Y, Yamada A, Ushiku T, et al. Histologic intestinal metaplasia and endoscopic atrophy are predictors of gastric cancer development after Helicobacter pylori eradication. Gastrointest Endosc. (2016) 84:618–24. doi: 10.1016/j.gie.2016.03.791
9. Shin SY, Kim JH, Chun J, Yoon YH, Park H. Chronic atrophic gastritis and intestinal metaplasia surrounding diffuse-type gastric cancer: Are they just bystanders in the process of carcinogenesis? PLoS ONE. (2019) 14:e0226427. doi: 10.1371/journal.pone.0226427
10. Ortigão R, Figueirôa G, Frazzoni L, Pimentel-Nunes P, Hassan C, Dinis-Ribeiro M, et al. Risk factors for gastric metachronous lesions after endoscopic or surgical resection: A systematic review and meta-analysis. Endoscopy. (2022) 54:892–901. doi: 10.1055/a-1724-7378
11. Hwang YJ, Kim N, Lee HS, Lee JB, Choi YJ, Yoon H, et al. Reversibility of atrophic gastritis and intestinal metaplasia after Helicobacter pylori eradication - A prospective study for up to 10 years. Aliment Pharmacol Ther. (2018) 47:380–90. doi: 10.1111/apt.14424
12. Lahner E, Zagari RM, Zullo A, Di Sabatino A, Meggio A, Cesaro P, et al. Chronic atrophic gastritis: Natural history, diagnosis and therapeutic management. A position paper by the Italian Society of Hospital Gastroenterologists and digestive endoscopists [AIGO], the Italian Society of Digestive Endoscopy [SIED], the Italian Society of Gastroenterology [SIGE], and the Italian Society of Internal Medicine [SIMI]. Dig Liver Dis. (2019) 51:1621–32. doi: 10.1016/j.dld.2019.09.016
13. Rodriguez-Castro KI, Franceschi M, Noto A, Miraglia C, Nouvenne A, Leandro G, et al. Clinical manifestations of chronic atrophic gastritis. Acta Biomed. (2018) 89:88–92. doi: 10.23750/abm.v89i8-S.7921
14. Du Y, Bai Y, Xie P, Fang J, Wang X, Hou X, et al. Chronic gastritis in China: A national multi-center survey. BMC Gastroenterol. (2014) 14:21. doi: 10.1186/1471-230X-14-21
15. Eshmuratov A, Nah JC, Kim N, Lee HS, Lee HE, Lee BH, et al. The correlation of endoscopic and histological diagnosis of gastric atrophy. Dig Dis Sci. (2010) 55:1364–75. doi: 10.1007/s10620-009-0891-4
16. Barbeiro S, Libânio D, Castro R, Dinis-Ribeiro M, Pimentel-Nunes P. Narrow-band imaging: Clinical application in gastrointestinal endoscopy. GE Port J Gastroenterol. (2018) 26:40–53. doi: 10.1159/000487470
17. Pimentel-Nunes P, Libânio D, Lage J, Abrantes D, Coimbra M, Esposito G, et al. A multicenter prospective study of the real-time use of narrow-band imaging in the diagnosis of premalignant gastric conditions and lesions. Endoscopy. (2016) 48:723–30. doi: 10.1055/s-0042-108435
18. Imaeda A. Confocal laser endomicroscopy for the detection of atrophic gastritis: A new application for confocal endomicroscopy? J Clin Gastroenterol. (2015) 49:355–7. doi: 10.1097/MCG.0000000000000309
19. Lee JG, Jun S, Cho YW, Lee H, Kim GB, Seo JB, et al. Deep learning in medical imaging: General overview. Korean J Radiol. (2017) 18:570–84. doi: 10.3348/kjr.2017.18.4.570
20. Esteva A, Kuprel B, Novoa RA, Ko J, Swetter SM, Blau HM, et al. Dermatologist–level classification of skin cancer with deep neural networks. Nature. (2017) 542:115–8. doi: 10.1038/nature21056
21. Chen H, Dou Q, Yu L, Qin J, Heng PA. VoxResNet: Deep voxelwise residual networks for brain segmentation from 3D MR images. Neuroimage. (2018) 170:446–55. doi: 10.1016/j.neuroimage.2017.04.041
22. Cho BJ, Bang CS, Park SW, Yang YJ, Seo SI, Lim H, et al. Automated classification of gastric neoplasms in endoscopic images using a convolutional neural network. Endoscopy. (2019) 51:1121–9. doi: 10.1055/a-0981-6133
23. Simonyan K, Zisserman A. Very deep convolutional networks for large-scale image recognition. arXiv preprint arXiv:1409.1556 (2015).
24. He K, Zhang X, Ren S, Sun J. Deep Residual Learning for Image Recognition. In: 2016 IEEE Conference on Computer Vision and Pattern Recognition (CVPR). Las Vegas, NV, USA: IEEE (2016). p. 770–778. doi: 10.1109/CVPR.2016.90
25. Ridnik T, Lawen H, Noy A, Ben E, Sharir BG, Friedman I. TResNet: High performance GPU-dedicated architecture. In: 2021 IEEE Winter Conference on Applications of Computer Vision (WACV). (2021). p. 1399–1408 doi: 10.1109/WACV48630.2021.00144
26. Hu J, Shen L, Albanie S, Sun G, Wu E. Squeeze-and-Excitation Networks. IEEE Trans Pattern Anal Mach Intell. (2020) 42:2011–23. doi: 10.1109/TPAMI.2019.2913372
27. Girshick R, Donahue J, Darrell T, Malik J. Rich feature hierarchies for accurate object detection and semantic segmentation. In: 2014 IEEE Conference on Computer Vision and Pattern Recognition. Columbus, OH, USA: IEEE (2014). p. 580–587 doi: 10.1109/CVPR.2014.81
28. Redmon J, Divvala S, Girshick R, Farhadi A. You only look once: Unified, real-time object detection. In: IEEE Conference on Computer Vision and Pattern Recognition (CVPR). (2016). p. 779–88. doi: 10.1109/CVPR.2016.91
29. Redmon J, Farhadi A. YOLOv3: An incremental improvement. arXiv preprint arXiv:1804.02767. (2018).
30. Liu W, Anguelov D, Erhan D, Szegedy C, Reed S, Fu C-Y, et al. SSD: Single Shot MultiBox Detector. In:Leibe B, Matas J, Sebe N, Welling M, , editors. Computer Vision – ECCV 2016. Lecture Notes in Computer Science. Cham: Springer International Publishing (2016). p. 21–37. doi: 10.1007/978-3-319-46448-0_2
31. Ronneberger O, Fischer P, Brox T. U-Net: Convolutional Networks for Biomedical Image Segmentation. In:Navab N, Hornegger J, Wells WM, Frangi AF, , editors. Medical Image Computing and Computer-Assisted Intervention – MICCAI 2015. Lecture Notes in Computer Science. Cham: Springer International Publishing (2015). p. 234–41. doi: 10.1007/978-3-319-24574-4_28
32. Zhou Z, Siddiquee MMR, Tajbakhsh N, Liang J. UNet++: A nested U-net architecture for medical image segmentation. Deep Learn Image Anal Multimodal Learn Clin Decis Support. (2018) 11045:3–11. doi: 10.1007/978-3-030-00889-5_1
33. Chen L-C, Papandreou G, Kokkinos I, Murphy K, Yuille AL. DeepLab: semantic image segmentation with deep convolutional nets, atrous convolution, and fully connected CRFs. IEEE Trans Pattern Anal Mach Intell. (2018) 40:834–48. doi: 10.1109/TPAMI.2017.2699184
34. Salameh JP, Bossuyt PM, McGrath TA, Thombs BD, Hyde CJ, Macaskill P, et al. Preferred reporting items for systematic review and meta-analysis of diagnostic test accuracy studies (PRISMA-DTA): Explanation, elaboration, and checklist. BMJ. (2020) 370:m2632. doi: 10.1136/bmj.m2632
35. Whiting PF, Rutjes AWS, Westwood ME, Mallett S, Deeks JJ, Reitsma JB, et al. QUADAS-2: A revised tool for the quality assessment of diagnostic accuracy studies. Ann Intern Med. (2011) 155:529–36. doi: 10.7326/0003-4819-155-8-201110180-00009
36. Sounderajah V, Ashrafian H, Rose S, Shah NH, Ghassemi M, Golub R, et al. A quality assessment tool for artificial intelligence-centered diagnostic test accuracy studies: QUADAS-AI. Nat Med. (2021) 27:1663–5. doi: 10.1038/s41591-021-01517-0
37. Sounderajah V, Ashrafian H, Aggarwal R, De Fauw J, Denniston AK, Greaves F, et al. Developing specific reporting guidelines for diagnostic accuracy studies assessing AI interventions: The STARD-AI steering group. Nat Med. (2020) 26:807–8. doi: 10.1038/s41591-020-0941-1
38. Guimarães P, Keller A, Fehlmann T, Lammert F, Casper M. Deep-learning based detection of gastric precancerous conditions. Gut. (2020) 69:4–6. doi: 10.1136/gutjnl-2019-319347
39. Qu JY Li Z, Su JR, Ma MJ, Xu CQ, Zhang AJ, et al. Development and validation of an automatic image-recognition endoscopic report generation system: A multicenter study. Clin Transl Gastroenterol. (2020) 12:e00282. doi: 10.14309/ctg.0000000000000282
40. Mu G, Zhu Y, Niu Z, Li H, Wu L, Wang J, et al. Expert-level classification of gastritis by endoscopy using deep learning: A multicenter diagnostic trial. Endosc Int Open. (2021) 9:E955–64. doi: 10.1055/a-1372-2789
41. Lin N, Yu T, Zheng W, Hu H, Xiang L, Ye G, et al. Simultaneous recognition of atrophic gastritis and intestinal metaplasia on white light endoscopic images based on convolutional neural networks: A multicenter study. Clin Transl Gastroenterol. (2021) 12:e00385. doi: 10.14309/ctg.0000000000000385
42. Luo J, Cao S, Ding N, Liao X, Peng L, Xu C, et al. deep learning method to assist with chronic atrophic gastritis diagnosis using white light images. Dig Liver Dis. (2022) 54:1513–9. doi: 10.1016/j.dld.2022.04.025
43. Zhao Q, Jia Q, Chi T. Deep learning as a novel method for endoscopic diagnosis of chronic atrophic gastritis: A prospective nested case-control study. BMC Gastroenterol. (2022) 22:352. doi: 10.1186/s12876-022-02427-2
44. Xu M, Zhou W, Wu L, Zhang J, Wang J, Mu G, et al. Artificial intelligence in the diagnosis of gastric precancerous conditions by image-enhanced endoscopy: A multicenter, diagnostic study (with video). Gastrointest Endosc. (2021) 94:540–548. doi: 10.1016/j.gie.2021.03.013
45. Yang J, Ou Y, Chen Z, Liao J, Sun W, Luo Y, et al. A benchmark dataset of endoscopic images and novel deep learning method to detect intestinal metaplasia and gastritis atrophy. IEEE J Biomed Health Inform. (2022) 27:7–16. doi: 10.1109/JBHI.2022.3217944
46. Zhang Y, Li F, Yuan F, Zhang K, Huo L, Dong Z, et al. Diagnosing chronic atrophic gastritis by gastroscopy using artificial intelligence. Dig Liver Dis. (2020) 52:566–72. doi: 10.1016/j.dld.2019.12.146
47. Zhao Q, Chi T. Deep learning model can improve the diagnosis rate of endoscopic chronic atrophic gastritis: A prospective cohort study. BMC Gastroenterol. (2022) 22:133. doi: 10.1186/s12876-022-02212-1
48. Yu T, Lin N, Zhong X, Zhang X, Zhang X, Chen Y, et al. Multi-label recognition of cancer-related lesions with clinical priors on white-light endoscopy. Comput Biol Med. (2022) 143:105255. doi: 10.1016/j.compbiomed.2022.105255
49. Yang H, Wu Y, Yang B, Wu M, Zhou J, Liu Q, et al. Identification of upper GI diseases during screening gastroscopy using a deep convolutional neural network algorithm. Gastrointest Endosc. (2022) 96:787–795. doi: 10.1016/j.gie.2022.06.011
50. Siripoppohn V, Pittayanon R, Tiankanon K, Faknak N, Sanpavat A, Klaikaew N, et al. Real-time semantic segmentation of gastric intestinal metaplasia using a deep learning approach. Clin Endosc. (2022) 55:390–400. doi: 10.5946/ce.2022.005
51. Wang C, Li Y, Yao J, Chen B, Song J, Yang X. Localizing and identifying intestinal metaplasia based on deep learning in oesophagoscope. In: 8th International Symposium on Next Generation Electronics (ISNE). (2019). p. 1–4. doi: 10.1109/ISNE.2019.8896546
52. Zhao Z, Yin Z, Wang S, Wang J, Bai B, Qiu Z, et al. Meta-analysis: The diagnostic efficacy of chromoendoscopy for early gastric cancer and premalignant gastric lesions. J Gastroenterol Hepatol. (2016) 31:1539–45. doi: 10.1111/jgh.13313
Keywords: chronic atrophic gastritis, artificial intelligence, deep learning, endoscopy, systemic review, meta-analysis
Citation: Shi Y, Wei N, Wang K, Tao T, Yu F and Lv B (2023) Diagnostic value of artificial intelligence-assisted endoscopy for chronic atrophic gastritis: a systematic review and meta-analysis. Front. Med. 10:1134980. doi: 10.3389/fmed.2023.1134980
Received: 31 December 2022; Accepted: 10 April 2023;
Published: 02 May 2023.
Edited by:
Yeong Yeh Lee, University of Science Malaysia (USM), MalaysiaReviewed by:
Peng Jin, Seventh Medical Center of PLA General Hospital, ChinaCopyright © 2023 Shi, Wei, Wang, Tao, Yu and Lv. This is an open-access article distributed under the terms of the Creative Commons Attribution License (CC BY). The use, distribution or reproduction in other forums is permitted, provided the original author(s) and the copyright owner(s) are credited and that the original publication in this journal is cited, in accordance with accepted academic practice. No use, distribution or reproduction is permitted which does not comply with these terms.
*Correspondence: Bing Lv, YmluZy1sdkBob3RtYWlsLmNvbQ==; Feng Yu, emlib3l1ZmVuZ0Bob3RtYWlsLmNvbQ==
Disclaimer: All claims expressed in this article are solely those of the authors and do not necessarily represent those of their affiliated organizations, or those of the publisher, the editors and the reviewers. Any product that may be evaluated in this article or claim that may be made by its manufacturer is not guaranteed or endorsed by the publisher.
Research integrity at Frontiers
Learn more about the work of our research integrity team to safeguard the quality of each article we publish.