
94% of researchers rate our articles as excellent or good
Learn more about the work of our research integrity team to safeguard the quality of each article we publish.
Find out more
ORIGINAL RESEARCH article
Front. Med., 20 February 2023
Sec. Geriatric Medicine
Volume 10 - 2023 | https://doi.org/10.3389/fmed.2023.1094733
This article is part of the Research TopicMolecular and Physiological Aspects of Sarcopenia in the Older Person: Mechanisms, Diagnostics and TherapyView all 12 articles
 Emily James1,2,3*
 Stuart Goodall1
 Simon Nichols4,5Karen Walker6
 Sean Carroll7
 Alasdair F. O’Doherty1Lee Ingle7
Background: Low muscle mass disproportionately affects people with coronary heart disease compared to healthy controls but is under-researched and insufficiently treated. Inflammation, poor nutrition, and neural decline might contribute to low muscle mass. This study aimed to assess circulatory biomarkers related to these mechanisms [albumin, transthyretin, alanine aminotransferase (ALT), aspartate aminotransferase (AST), and C-terminal agrin fragment] and their relationship with muscle mass in people with coronary heart disease. Our findings could be beneficial to indicate mechanisms of sarcopenia, detect sarcopenia, and evaluate treatment.
Methods: Serum blood samples from people with coronary heart disease were analysed for biomarker concentrations using enzyme-linked immunosorbent assays. Skeletal muscle mass was estimated using dual X-ray absorptiometry derived appendicular lean mass and reported as skeletal muscle index (SMI; kg m−2), and as a proportion of total body mass [appendicular skeletal mass (ASM%)]. Low muscle mass was defined as a SMI <7.0 and <6.0 kg m−2, or ASM% <25.72 and <19.43% for men and women, respectively. Associations between biomarkers and lean mass were adjusted for age and inflammation.
Results: Sixty-four people were assessed; 14 (21.9%) had low muscle mass. People with low muscle mass had lower transthyretin (effect size 0.34, p = 0.007), ALT (effect size 0.34, p = 0.008), and AST (effect size 0.26, p = 0.037) concentrations, compared to those with normal muscle mass. SMI was associated with inflammation-corrected ALT (r = 0.261, p = 0.039) and with inflammation- and age-adjusted AST/ALT ratio (r = −0.257, p = 0.044). Albumin and C-terminal agrin fragment were not associated with muscle mass indices.
Conclusion: Circulatory transthyretin, ALT and AST were associated with low muscle mass in people with coronary heart disease. Low concentrations of these biomarkers might indicate that low muscle mass is partially explained by poor nutrition and high inflammation in this cohort. Targeted treatments to address these factors could be considered for people with coronary heart disease.
Between 1990 and 2019, coronary heart disease (CHD)-related mortality declined at a greater rate (61%) than CHD incidence (37%) (1). In the era of modern medical management, people with a CHD diagnosis live for longer and many will require increased support to manage their long-term health. An important component of healthy ageing is maintaining skeletal muscle mass (SMM) (2, 3). This is particularly relevant in people with CHD where there is a higher incidence of low SMM in people with CHD compared to age- and sex -matched adults (4). Emerging research in people with CHD shows that low SMM increases the risk of all-cause mortality, fatal or non-fatal major adverse cardiovascular events, lower fitness (peak oxygen uptake; V̇O2peak) and poorer quality of life (4–8). However, factors that influence loss of SMM in CHD are poorly defined. The delivery of successful interventions to improve SMM, and subsequently long-term health, in these people requires that we have: (1) the ability to identify those at risk of low SMM early, and (2) a thorough understanding of the factors influencing low SMM. For this purpose, circulatory biomarkers might be useful to complement traditional measures of SMM and strength.
Maladaptive processes and behaviours that contribute to loss of SMM and/ or function are complex. There is compelling evidence that these include neural maladaptation (9, 10), inflammation (11, 12), and sub-optimal nutrition (13, 14). Biomarkers which appear to have a central role in these systems need investigating. C-terminal agrin fragment (CAF) is a circulatory by-product of agrin cleavage by synaptic protease neurotrypsin (15), a process which can lead to neuromuscular junction breakdown (16). In healthy older adults (17, 18) and people with heart failure (19), CAF levels are elevated in those with low, compared to with normal, SMM. Thus, declining neural function might contribute to low SMM. However, it is unclear whether these findings exist in older people with CHD. Albumin and transthyretin are acute-phase response proteins which might indicate inflammation-related nutrition risk (20). In hospitalised people with CHD, albumin and transthyretin levels are lower in the presence of sarcopenia (as defined by the Asian Working Group for Sarcopenia) compared to those defined as non-sarcopenic (21). Whether albumin and transthyretin are associated with low SMM using European cut-off points (22), in people with CHD, requires clarification. Finally, alanine (ALT) and aspartate (AST) aminotransferases are liver/skeletal muscle enzymes (23). Circulatory levels of ALT are elevated in people with type 2 diabetes (24) and metabolic syndrome (25), but lower in the presence of age-related syndromes often characterised by under-nutrition, including sarcopenia (26). The AST/ALT ratio is proposed to be higher in those with sarcopenia compared to those without, although few studies have investigated this to date (27, 28).
Associations between SMM and serum CAF (17–19), albumin, transthyretin (21), ALT and AST (26–28) were reported in healthy older adults and people with chronic health conditions. The present study aimed to investigate the association between estimated SMM, and serum CAF, albumin, transthyretin, ALT and AST, in people with recently diagnosed stable CHD. We hypothesised that people with CHD and low SMM will have higher CAF levels and AST/ALT ratio and lower albumin and transthyretin levels, compared to people with CHD and preserved SMM.
Baseline serum blood samples and demographic characteristics used in this cross-sectional study were collected as part of the Cardiovascular and cardiorespiratory Adaptations to Routine Exercise-based Cardiac Rehabilitation (CARE CR) study (29). The CARE CR study protocol was published in detail elsewhere (29). Briefly, clinically stable people with a primary diagnosis of CHD (aged 30–85 years) were referred to the research team by nursing staff, within 2 weeks of a cardiac event or procedure. Participants provided their written informed consent to participate in the study. The CARE CR study was granted ethical approval by the Humber Bridge NHS Research Ethics Committee-Yorkshire and the Humber (12/YH/0278). Ethical approval for assay analysis of serum samples for biomarkers related to sarcopenia was provided by the Northumbria University Health and Life Sciences Ethics Committee (20933). The main findings from the CARE CR study on patient rehabilitation and cardiorespiratory fitness are published elsewhere (4, 30).
Body mass index (BMI; kg m−2) was calculated using mass (kg) and stature (m). Waist and hip circumferences (cm) were measured at 1 cm above the iliac crest and at the widest aspect of the hips, respectively. Appendicular lean mass (ALM), defined as total lean mass in both arms and legs (kg), was measured using dual X-ray absorptiometry (DXA; Lunar iDXA GE Healthcare Buckinghamshire, United Kingdom), as a proxy for SMM assessment. ALM is expressed as skeletal muscle index (SMI; kg m−2) and as a percentage of total body mass (appendicular skeletal mass; ASM%). Age-adjusted SMI and ASM% were moderately correlated (r = 0.507, p < 0.001). We defined low SMI as <7.0 and <6.0 kg m−2 (22) and low ASM% as <25.72 and <19.43% (31) for men and women, respectively.
Cardiopulmonary exercise testing was performed using the modified Bruce treadmill protocol (32), as previously described (4, 29). A 12-lead Electrocardiogram (ECG), ECG-gated automated blood pressure, heart rate, and rate of perceived exertion were monitored throughout. Breath-by-breath metabolic gas exchange data were collected using an Oxycon Pro metabolic cart (Jaeger, Hoechburg, Germany). We report V̇O2peak (ml), defined as the mean V̇O2 over the last 30 s of the test; V̇O2peak was adjusted for body mass (ml kg−1 min−1) (4).
Participants abstained from strenuous exercise 24-h prior to attending their baseline study visit. Resting blood samples were drawn by venepuncture and placed in a refrigerated (4°C) centrifuge at 3,000 revolutions per minute, for 15 min. Albumin, aminotransferases and N-terminal pro-brain natriuretic peptide (NT-proBNP) were analysed at the Hull Royal Infirmary in an accredited biochemistry laboratory, as a single measurement on the day of each blood draw. Calibration and quality controls were conducted in accordance with manufacturer’s guidelines. The ABX Pentra 400 biochemistry auto analyser (Horiba, Montpellier, France) was used to analyse high sensitivity C-reactive protein (hs-CRP) in duplicate, in accordance with the manufacturer’s quality control guidance (4). Remaining plasma and serum samples were stored at −80°C until analysis.
We analysed serum samples in duplicate using commercial enzyme-linked immunosorbent assay (ELISA) for CAF (Abcam #ab216945) and transthyretin (Abcam #ab108895) and followed their standard instructions for serum analysis. Concentrations of transthyretin and CAF were assessed in duplicate and the average of the two measures reported. We re-analysed samples with a coefficient of variation (CV) >40% and when biomarker concentrations were not within the limits of the standard curve. The CV for the assay analyses of transthyretin and CAF were 7.9 and 5.1%, respectively. Routine health-related serum biomarkers evaluated as part of the CARE CR study are reported elsewhere, including NT-proBNP, hs-CRP, glucose, white cell count, total cholesterol, low-density and high-density lipoprotein cholesterol, estimated glomerular filtration rate and triglycerides (4, 30).
Normal adult reference values for circulatory markers of interest are:
• Albumin: 35–50 g/L (33).
• Transthyretin: 30–33 and 25–27 mg/dl in males and females, respectively (34).
• ALT: 9.0–59.0 and 7.8–41.0 U/L in males and females, respectively (35).
• AST: 11.0–34.0 U/L (35)
• CAF: 0.86–4.66 ng/ml (17).
Statistical analyses were performed by a single researcher using commercially available software (SPSS version 28, IBM, New York, NY, United States). Distribution of the data was assessed using visual inspection of histograms, QQ-plots and using the Kolmogorov Smirnov test. Categorical variables are reported as frequency with percentage. Continuous normally distributed variables are reported as mean ± standard deviation. Continuous non-normally distributed variables are reported as median with interquartile range, or median with range where the sample size is ≤3 people. Demographic characteristics are reported for the whole cohort and separately for people with normal or low SMM (defined as low SMI or low ASM%). Differences in demographic characteristics between the two groups were assessed using the Fisher’s exact test (categorical variables), a Student’s t-test (continuous normally distributed), or Mann–Whitney U test (continuous non-normally distributed). Two-group comparison of blood biomarkers between people with normal or low SMM were evaluated using Mann–Whitney U tests and reported as U statistics, p-values, and effect sizes, calculated using the following equation (36):
Absolute r values of 0.2, 0.5, and 0.8 are considered small, moderate and large effect sizes, respectively (37). The relationship between serum biomarker concentrations, SMI and ASM% were calculated using Spearman’s rank correlations. It is well-established that age and inflammation influence SMM and some serum biomarkers; people with CHD and low SMM are significantly older than those with normal SMM (38), whilst albumin and transthyretin concentrations decrease in the presence of inflammation (39). Accordingly, we also report non-parametric partial correlations adjusted for age and circulatory hs-CRP concentrations, both separately and together. An r value of <0.3, 0.3–0.5, 0.6–0.8, and >0.8 indicated a poor, fair, moderately strong and very strong associations, respectively (40). Scatterplots of associations between SMI and circulatory markers were plotted with linear regression lines. Where a marker was associated with SMI or ASM% or had a significant effect size for low and normal SMM groups, receiver operating characteristic (ROC) curves were used to investigate the sensitivity and specificity of predicting low SMM as the dichotomous ‘state variable’. We report the area under the curve (AUC) with 95% confidence interval (CI) and p-values. The AUC value was interpreted as follows: perfect (1.0), excellent (0.9–0.99), good (0.8–0.89), fair (0.7–0.79), poor (0.51–0.69), and no value (0.5) (41). The biomarker concentration cut-off points for prediction of low SMM were selected based on the highest combination of sensitivity and specificity values. We plotted ROC curves and determined biomarker cut-off points for the whole cohort and then separately for men only. Due to a small sample, ROC curves could not be plotted for women only. Statistical significance was set at p < 0.05.
Sixty-four people were included (63.4 ± 9.8 years; 12.5% female). Participant characteristics, presenting diagnosis, comorbidities, and medications, are reported in Table 1. Low ASM% and low SMI were identified in 14.1% (n = 9) and 12.5% (n = 8) of people, respectively. Three people had both low ASM% and low SMI (4.7%) and 14 had either low ASM% or low SMI (21.9%).
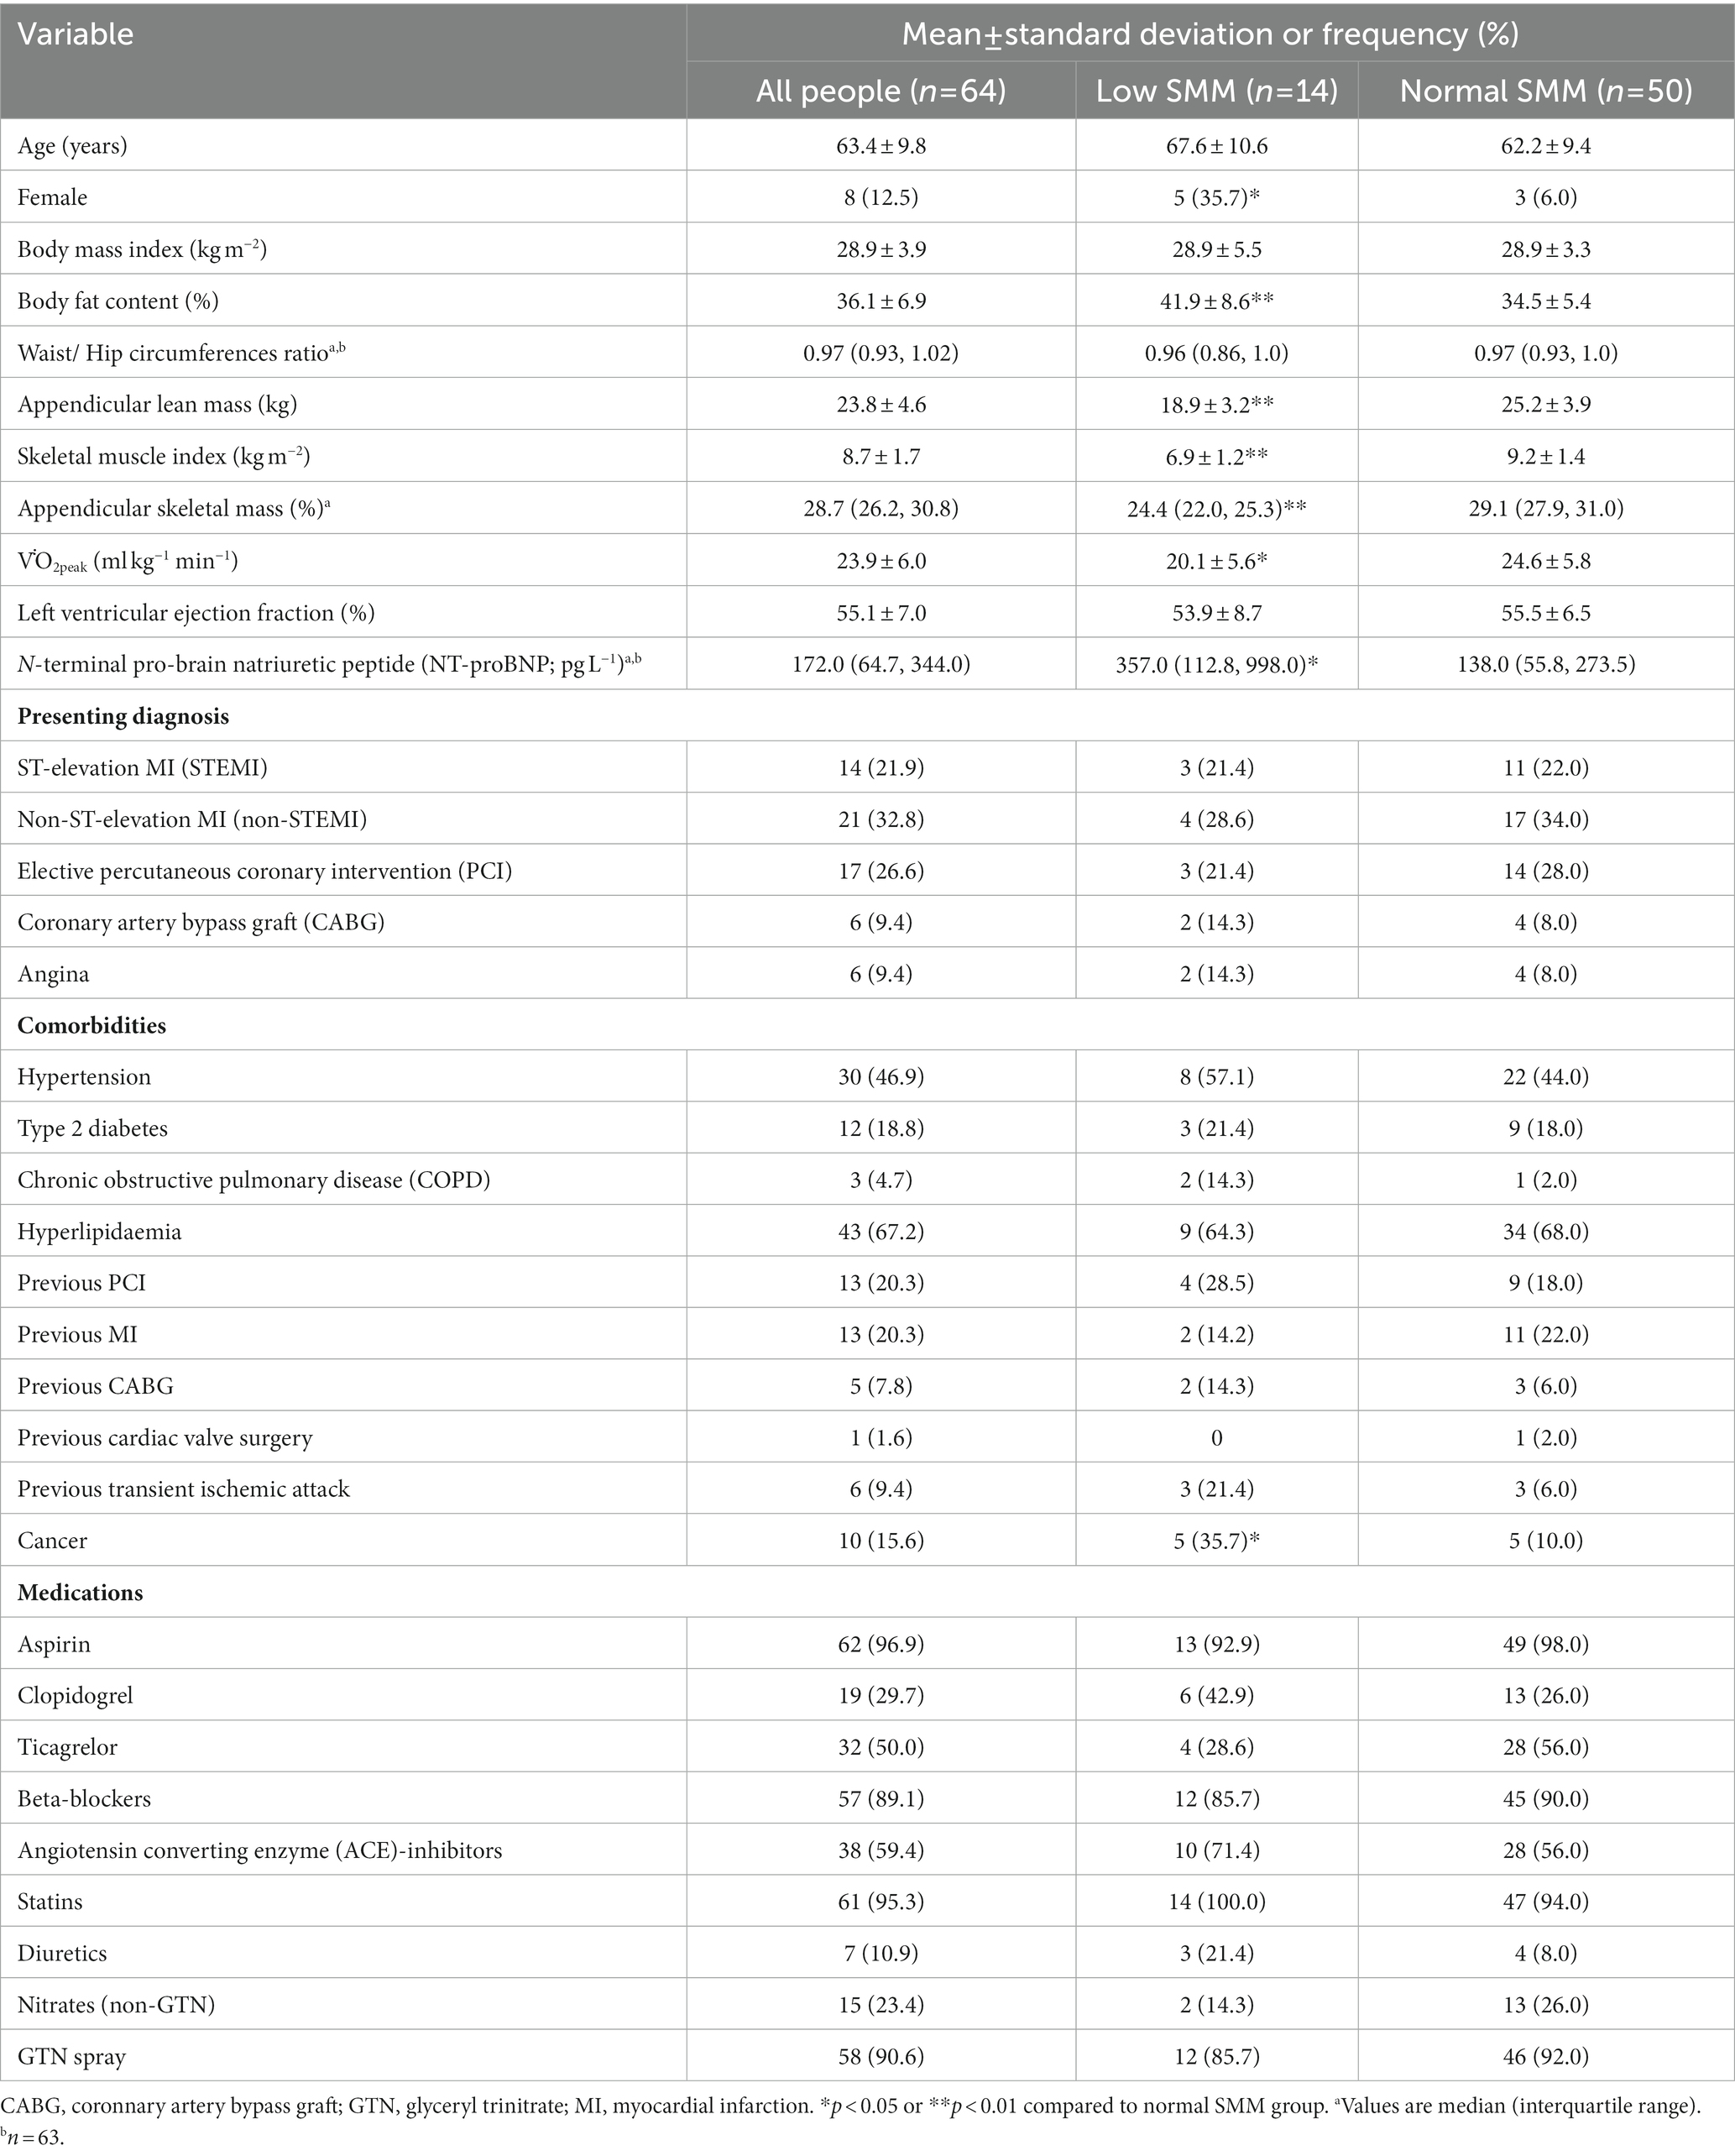
Table 1. Patient baseline characteristics.
Circulatory biomarker concentrations are reported in Table 2. The distribution of biomarker concentrations compared to normal reference values (section 2.4) were as follows: albumin, 92.2% (n = 59) within, 6.3% (n = 4) lower than and 1.6% (n = 1) higher than the normal range; transthyretin, 6.3% (n = 4) within, 34.4% (n = 22) lower than and 59.4% (n = 38) higher than the normal range; ALT, 90.6% (n = 58) within and 9.4% (n = 6) higher than the normal range; AST, 78.1% (n = 50) within and 21.9% (n = 14) higher than the normal range; and CAF, 78.1% (n = 50) within and 21.9% (n = 14) higher than the normal range. There were small to moderate effect sizes for lower serum transthyretin (effect size 0.34; 29.66 mg/dl versus 37.87 mg/dl, p = 0.007), ALT (effect size 0.34; 20.00 U/L versus 31.00 U/L, p = 0.008) and AST (effect size 0.26; 22.25 U/L versus 27.00 U/L, p = 0.037) levels in people with low SMM compared to those with normal SMM.
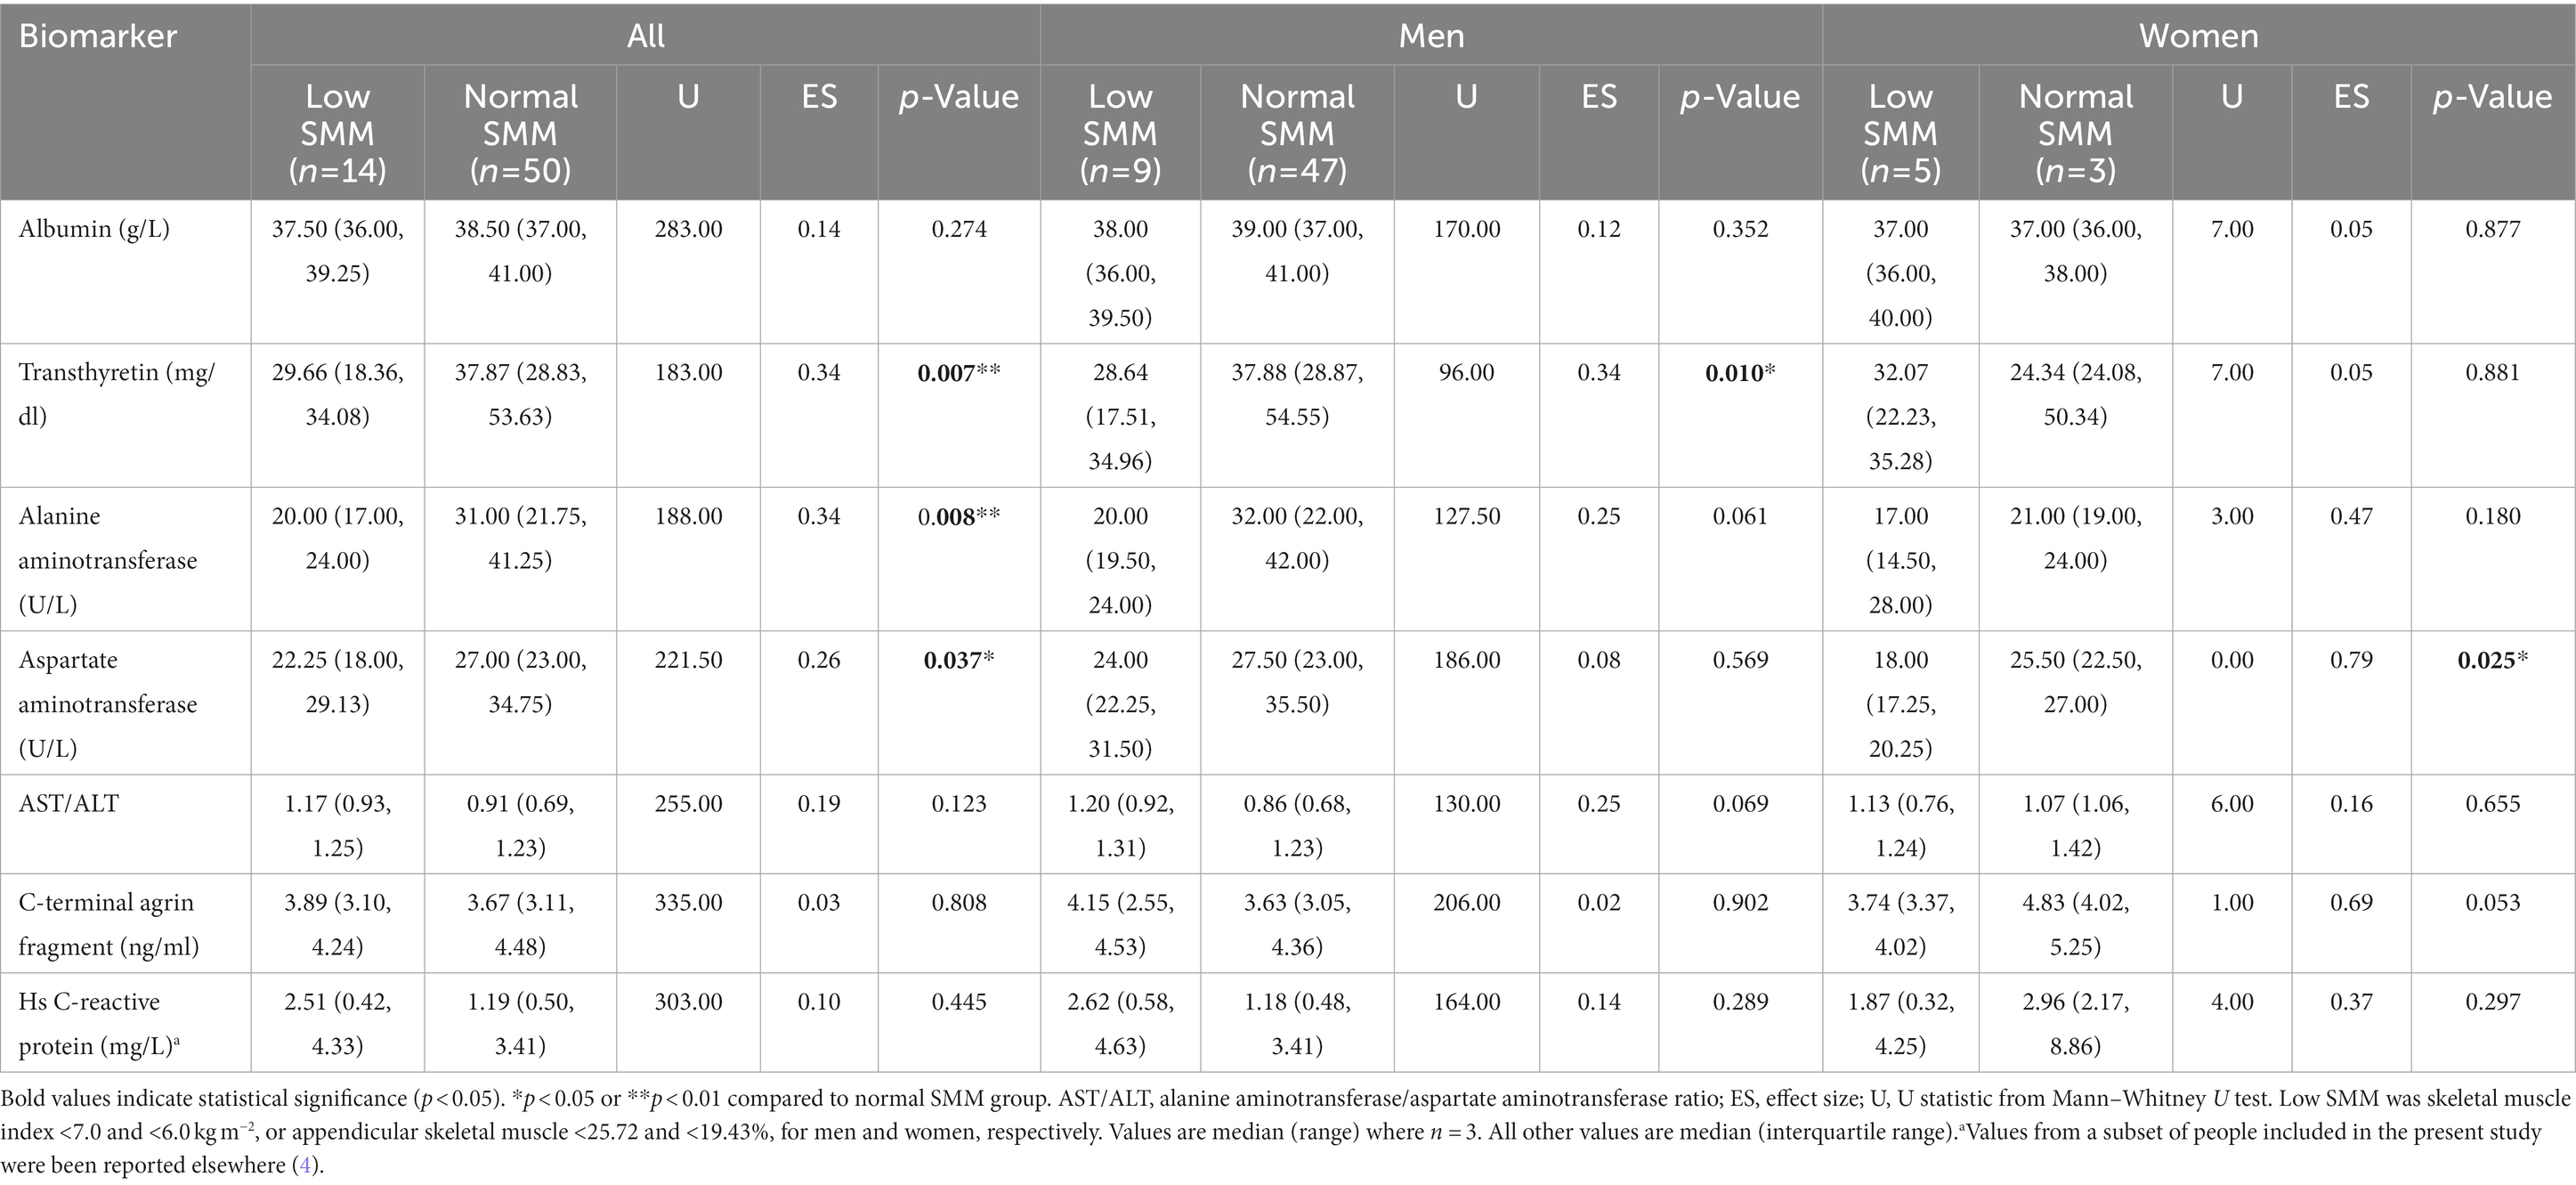
Table 2. Circulatory biomarker concentrations in people with coronary heart disease with low or normal skeletal muscle mass (SMM).
Correlations between circulatory biomarkers, SMI and ASM% are reported in Table 3. Figure 1 shows correlations between SMI and circulatory biomarkers. SMI was associated with hs-CRP -corrected serum ALT levels (r = 0.261, p = 0.039) and with hs-CRP and age -corrected AST/ALT ratio (r = −0.257, p = 0.044). In men, after correction for hs-CRP levels and age, SMI was associated with AST (r = −0.279, p = 0.041) and the AST/ALT ratio (r = −0.281, p = 0.040). In women, after correction for hs-CRP levels and age, transthyretin was negatively associated with ASM% (r = −0.889, p = 0.018).
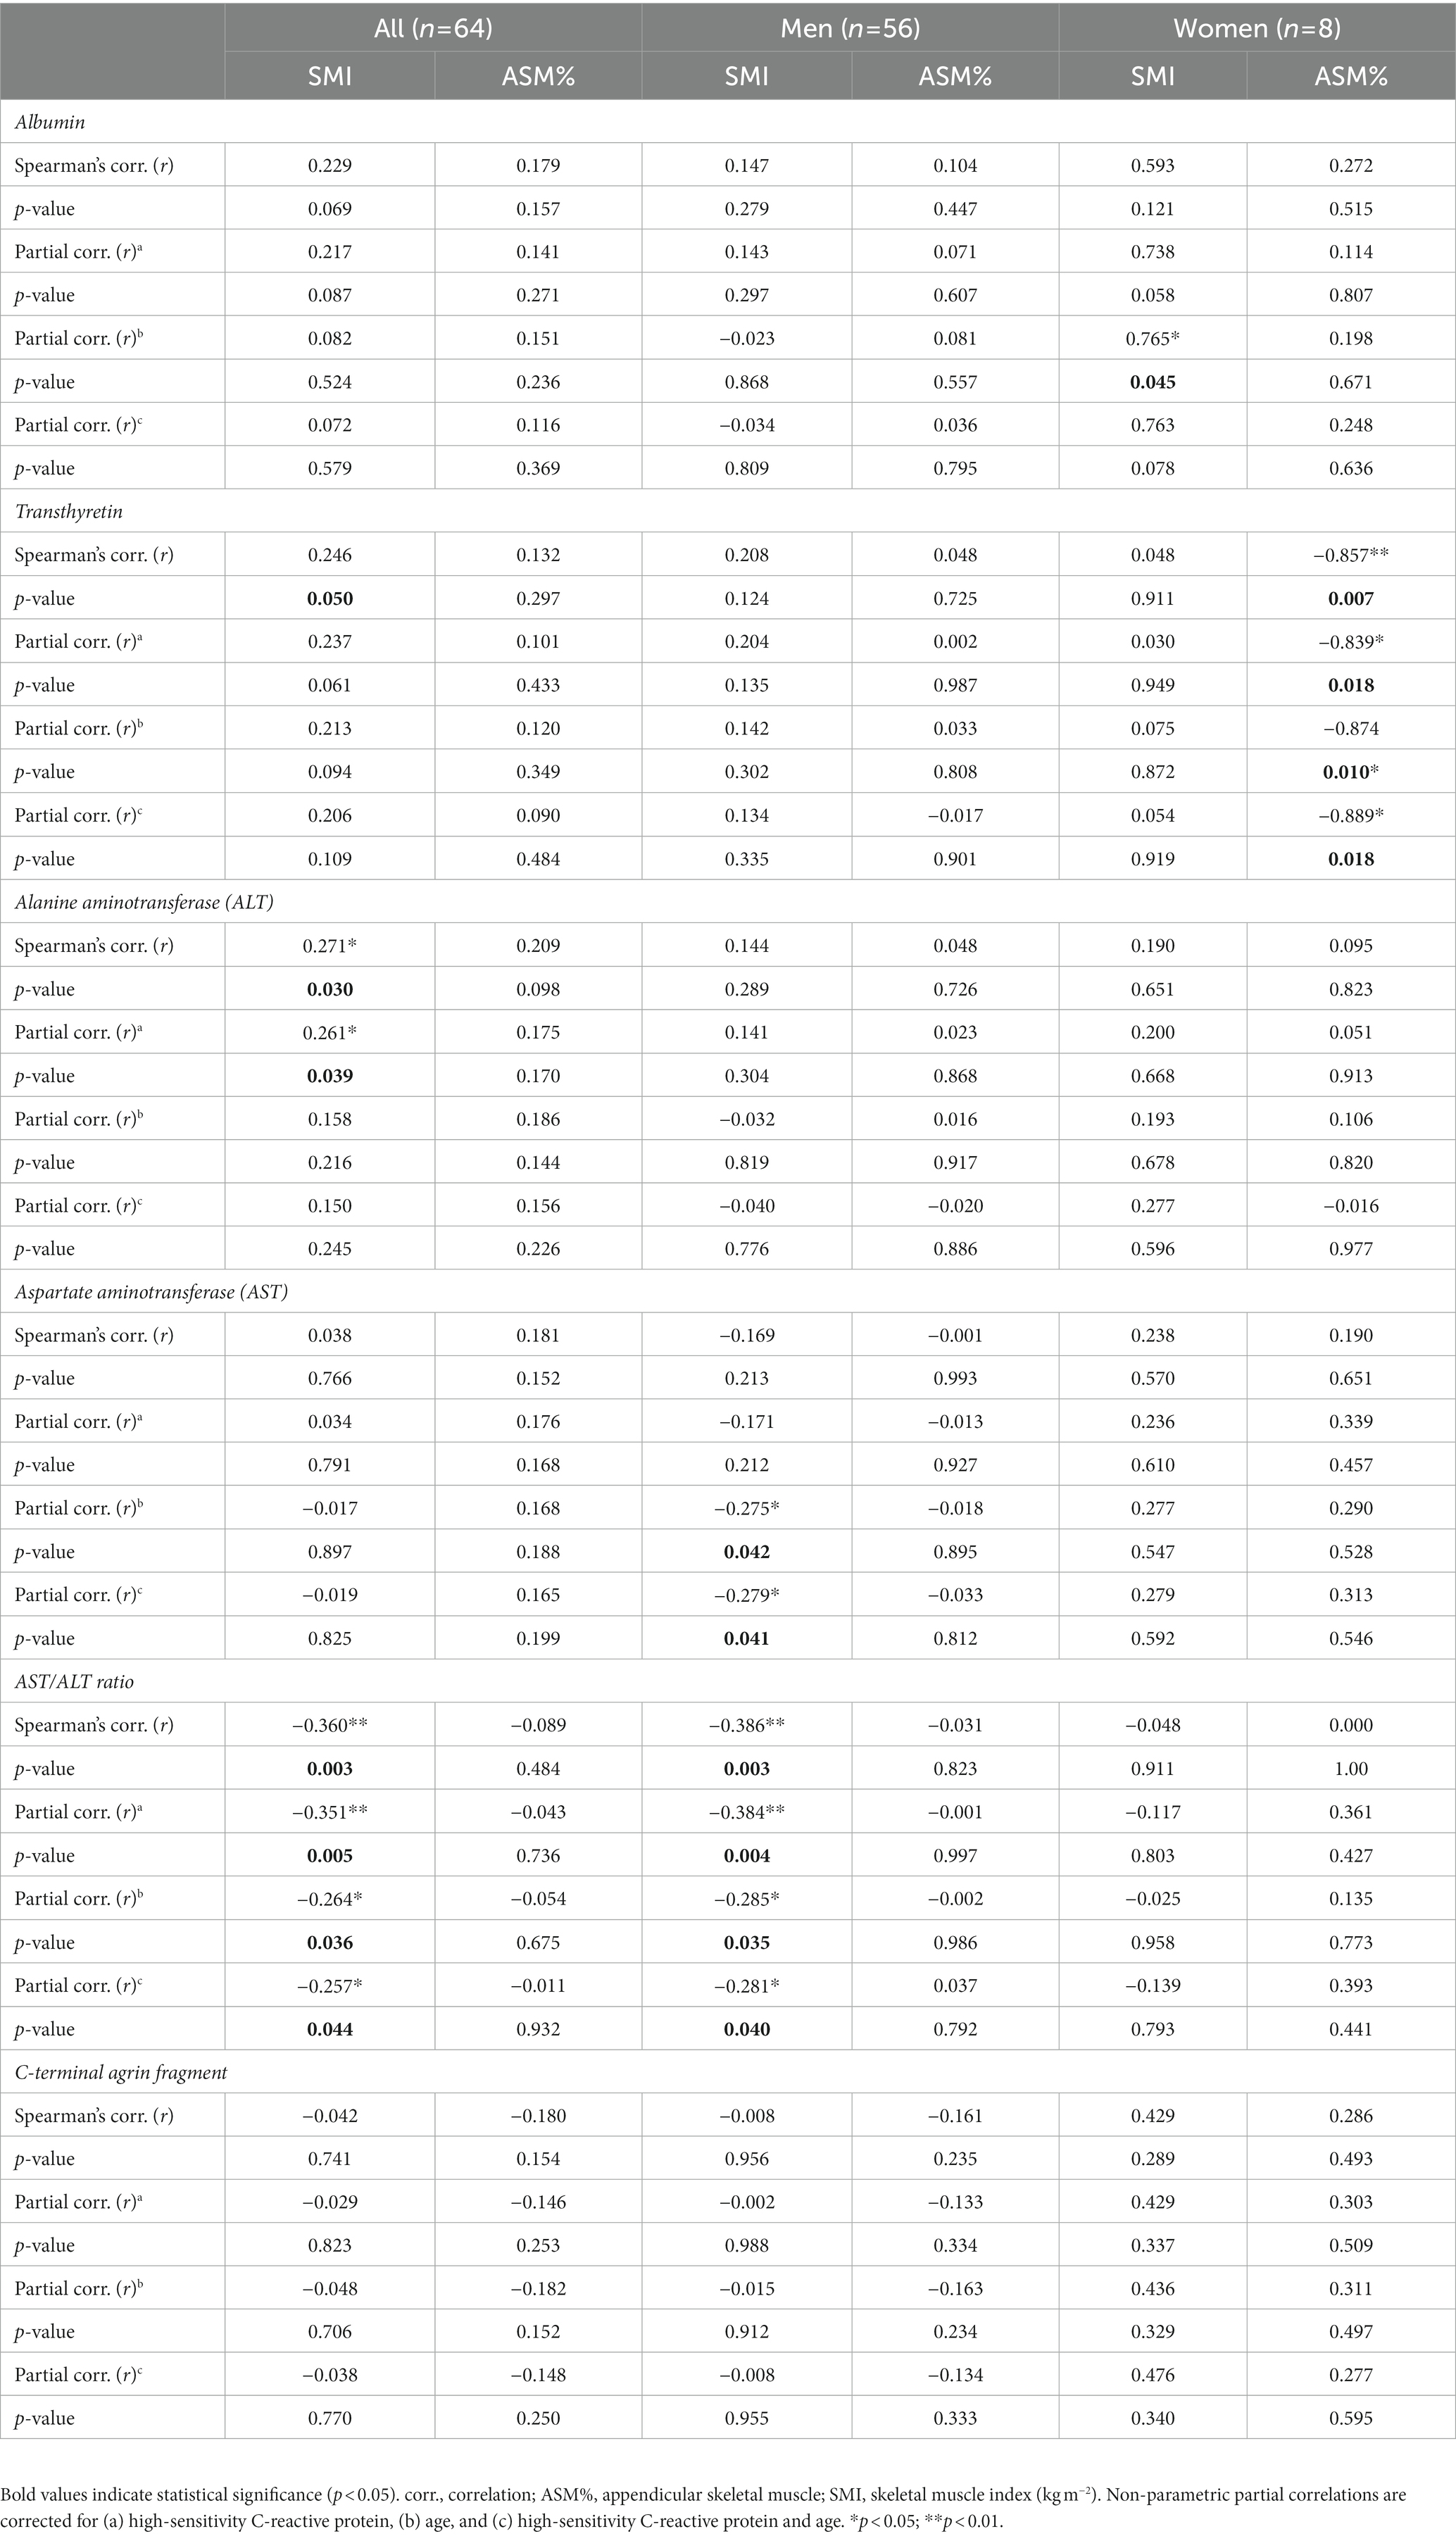
Table 3. Correlations between SMI, ASM%, and serum biomarkers.
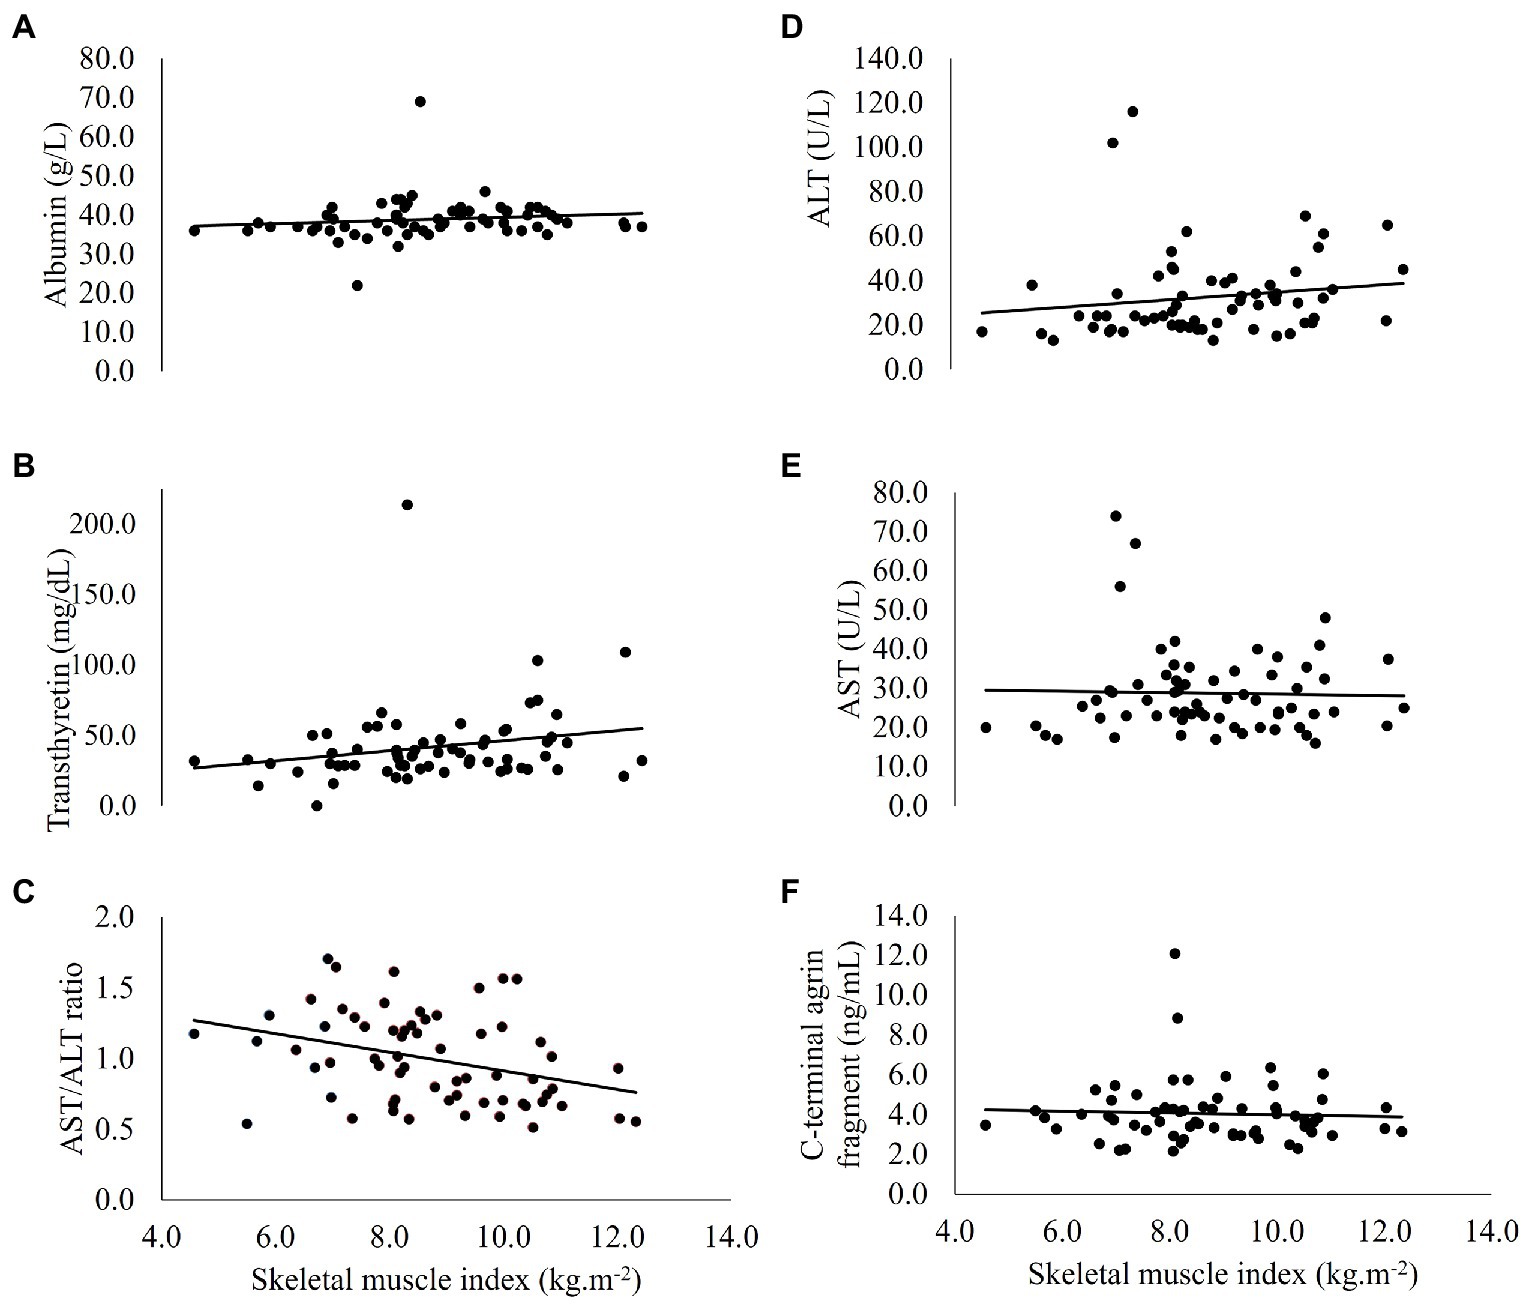
Figure 1. Correlations between skeletal muscle index and circulatory (A) albumin, (B) transthyretin, (C) AST/ALT ratio, (D) ALT, (E) AST, and (F) C-terminal agrin fragment, in people with coronary heart disease (n = 64). ALT, alanine aminotransferase; AST, aspartate aminotransferase.
The prognostic value of transthyretin, ALT, AST, and the AST/ALT ratio for identification of low SMM was assessed using ROC curve analysis. Including all participants, transthyretin (AUC 0.739, 95% CI 0.601, 0.876, p = 0.007) and ALT (AUC 0.731, 95% CI 0.576, 0.887, p = 0.009) had the greatest predictive capacity to identify low SMM. The AUC for AST level was 0.684 (95% CI 0.516, 0.851, p = 0.037) and non-significant for the AST/ALT ratio (AUC 0.636, 95% CI 0.482, 0.790, p = 0.123). The optimal cut-off points to indicate risk of low SMM were: a transthyretin value of ≤37.7654 mg/dl (sensitivity 0.857, specificity 0.520), an ALT value of ≤25.00 U/L (sensitivity 0.857, specificity 0.620), and an AST value of ≤24.50 U/L (sensitivity 0.714, specificity 0.620).
Including men only, ROC curve analyses showed the predictive capacity of transthyretin (AUC 0.773, 95% CI 0.603, 0.943, p = 0.002), ALT (AUC 0.699, 95% CI 0.509, 0.888, p = 0.040) and the AST/ALT ratio (AUC 0.693, 95% CI 0.538, 0.847, p = 0.014). The AUC for AST level was non-significant (AUC 0.560, 95% CI 0.357, 0.764, p = 0.562). In men, the optimal cut-off points to indicate risk of low SMM where: a transthyretin value of ≤30.3284 mg/dl (sensitivity 0.778, specificity 0.723), an ALT value of ≤25.00 U/L (sensitivity 0.889, specificity 0.660), and an AST/ALT ratio of ≥0.9347 (sensitivity 0.778, specificity 0.553).
This study aimed to report the association between DXA-estimated SMM and serum albumin, transthyretin, ALT, AST, and CAF in people with CHD. People with low SMM had lower serum transthyretin, AST and ALT levels compared to those with normal SMM, with small to moderate effect sizes. SMI was positively associated with ALT level and negatively associated with the AST/ALT ratio. We found no associations between albumin or CAF levels with any SMM index.
More than one-fifth of people had low SMM. Similarly, others report a prevalence of 25–30% for low SMM in people with CHD (5, 7, 42). Comparatively fewer (12%) apparently healthy, community-dwelling, older adults have low SMM (43). In the current study, presence of comorbidities associated with SMM loss, such as cancer (44) and COPD (45), likely contributed to the higher prevalence of low SMM. Importantly, in a previous CARE CR publication, ASM% was inversely associated with estimated all-cause mortality risk (r = −0.365, p = 0.006) in people with CHD (4). Thus, interventions to prevent or reverse low SMM should be offered to these people. To support the design and implementation of successful interventions, accurate and readily available methods to assess or monitor changes in SMM are needed.
Albumin is a marker of inflammation-related nutritional risk (20). In agreement with previous studies involving people with liver cirrhosis (46), end-stage renal disease (47) and heart failure (48), we found no association between albumin levels and SMM indices in people with CHD. Interestingly, others report both lower (49–51) and or higher (52) albumin concentrations in older adults with low SMM, compared to those with preserved SMM. The use of albumin levels to infer protein energy malnutrition was previously commonplace in clinical practise (53). Given that lean mass reflects the somatic protein store, the assumption followed that albumin might be useful as a marker of lean mass. However, the use of albumin as a biomarker of malnutrition or body composition has not been without criticism (20, 54). The literature lacks consensus on the existence and/ or direction of the association between albumin and SMM-related variables (46–49, 51, 52), likely due to the role of albumin as an acute-phase response protein.
The inflammation-induced reduction in albumin concentration is underpinned by: decreased albumin synthesis during stress response to prioritise synthesis of essential proteins, increased capillary permeability prompting a shift of albumin from the intravascular to the interstitial space, and a shortened albumin half-life resulting from tissue catabolism (20). In older adults, serum albumin is inversely associated with common inflammatory cytokine, CRP (55). We found no difference in hs-CRP between people with normal or low SMM (Table 2). This could explain the similar albumin levels between groups. Additionally, Chen et al. (56) speculated that sex-specific hormones levels might also impact the association between SMM and albumin levels, after finding these variables to be positively associated in men and negatively associated in women. However, our study included a small sample of women, and we were unable to investigate this hypothesis.
Transthyretin levels were significantly lower in people with low versus normal SMM. Similar to albumin, transthyretin is a marker of inflammation-related nutritional risk (20), a key component of malnutrition related to acute or chronic disease (57). Amino acid availability, from dietary protein intake, was proposed to mediate the relationship between transthyretin and lean mass (34). This is because amino acid ingestion promotes lean tissue accretion (58) and also modulates transthyretin synthesis in the liver (59). A strong, positive association (r = 0.58) between transthyretin levels and SMI was previously reported in people at a geriatric outpatient hospital (51). Around 40% of people in the study by Sergi et al. (51) were underweight (BMI <20 kg m−2). Poorer nutritional status likely contributed to a more pronounced inflammatory environment and lean mass loss in this study (51), potentially explaining the strong association between transthyretin and SMI, compared to a non-significant association in the present study (r = 0.246, p = 0.05). Nevertheless, our detection of significantly lower transthyretin levels in people with low compared to normal SMM is a promising finding, as it become increasingly apparent that transthyretin assessment might have clinical utility as part of a comprehensive medical evaluation (60).
Assessment of liver enzymes ALT and AST is routine in clinical practise (61). As a catalyst in the alanine-glucose cycle, ALT converts pyruvate to amino acid alanine in skeletal muscle and converts alanine back to pyruvate (for glucose production) in the liver (62, 63). A similar cycle is catalysed by AST, where the amino acid and product are aspartate and oxaloacetate, respectively (63). Circulatory levels of ALT and AST are elevated in Type 2 diabetes (24) and metabolic syndrome (25), conditions characterised by insulin resistance and hepatic steatosis. We, and others, demonstrate that ALT levels appear to be lower in the presence of low SMM (26, 50). Contrastingly, in a cross-section of >12,000 adults without liver-related disorders, ALT levels were elevated in those with low SMM compared to normal SMM (64). The direction of the relationship between AST and SMM is similarly contested. We found lower AST concentrations in people with low SMM compared to normal SMM. Others report that low SMM coincided with higher AST concentrations in people with (65, 66) and without (64) liver disease.
Multiple factors likely influence the inconsistency in these findings. First, damaged liver cells release ALT and AST into circulation, explaining their higher serum concentrations in people with liver disorders (67). Secondly, participants with low SMM in the study by Yoo et al. (64) were more often obese with higher fasting blood glucose and insulin levels compared to the normal SMM group, consistent with the theory that aminotransferase levels are elevated in the presence of higher metabolic risk. In the present study, people with reduced SMM had higher average body fat and comparable BMI to people with normal SMM. It could be speculated that differences in intra-abdominal and intra-hepatic steatosis, together with diet quality/alcohol consumption might have influenced aminotransferase concentrations.
Additionally, both ALT and AST require vitamin B6 as a cofactor, meaning that vitamin B6 deficiency might contribute to low circulatory ALT and AST (68). Furthermore, vitamin B6 is mostly stored in striated muscle (69); thus, where lean mass is reduced a smaller pool of vitamin B6 is available to act as a cofactor for AST and ALT. An estimated 31 and 24% of community-dwelling men and women (≥65 years) are at risk of inadequate vitamin B6 dietary intake (70). Although not assessed in this study, addressing any dietary deficiencies in people with CHD and low SMM should be prioritised.
Studies involving older adults (17, 71, 72), people with lung disease (72, 73) and with heart failure (19, 73) have reported an association between high circulatory CAF levels and low SMM. This association is proposed to originate from degeneration of the neuromuscular junction with ageing. Agrin is cleaved by neurotrypsin during normal neural development (15). Excessive agrin cleavage from over-expression of neurotrypsin causes agrin to become deactivated and the neuromuscular junction to break down (16). The product of this breakdown, CAF, is released into the circulation (74). However, the effect of degeneration and remodelling of the neuromuscular junction on SMM loss is debated, with polarising studies arguing that this process contributes to (75) or is protective against (76) muscle atrophy.
We found no association between CAF levels and SMM indices in people with CHD. Others have reported similar non-significant findings when assessing possible associations between CAF and presence of frailty in people with CHD, although an assessment of SMM was not included in their definition of frailty (77). Sánchez-Castellano et al. (78) found no difference in CAF levels between low and normal SMM groups with hip fracture and suggested that elevated CAF levels in both groups indicated neuromuscular degeneration was present in both. In contrast, median CAF values in the low and normal SMM groups were within the normal limits in the present study (0.86–4.66 ng/ml; 17), suggesting that circulatory CAF has limited utility as biomarker for low SMM in this cohort.
We assessed, in a secondary analysis, multiple proposed biomarkers for low SMM in people with CHD, contributing to our understanding of the factors influencing this complex and under-researched pathology. We included assessment of four biomarkers which are already commonly assessed in clinical practise (albumin, transthyretin, ALT, and AST), aiding the potential transition of our findings into practise.
This study is potentially limited by our use of DXA-derived lean mass to estimate SMM. DXA assessment is the current reference standard, but is limited by the production of variability related to different devices and software versions (79) and the absence of a universally agreed cut-off point for low SMM (80). Furthermore, DXA derived lean mass can be interpreted in several ways (i.e., corrected for stature, body mass or body fat percentage), which often produce conflicting findings when analysed in relation to circulatory biomarkers. This might limit the comparability of our findings with other, similar research. Finally, we included a small sample of women and there was no assessment of muscle strength or function.
Future research should evaluate the association between albumin, transthyretin, aminotransferases, CAF and measures of muscular strength alongside SMM. Whether these markers change with targeted lifestyle interventions also requires investigation. Additionally, there appears to be sex differences in median biomarker concentrations and their correlations with SMM indices, although our small sample of women limits the certainty of this finding. Future research might further investigate sex differences in SMM biomarkers in people with CHD.
This study aimed to identify associations between SMM indices and circulatory biomarkers in people with CHD. Lower levels of serum transthyretin, AST and ALT were present in people with CHD and low SMM, compared to those with normal SMM. To assist with practical application, we also identified the cut-off points below which transthyretin, ALT and AST indicate high likelihood of low SMM. We found no association between albumin, CAF and SMM indices, suggesting that these markers have limited utility as markers for low SMM in this cohort.
The raw data supporting the conclusions of this article will be made available by the authors, without undue reservation.
The studies involving human participants were reviewed and approved by Humber Bridge NHS Research Ethics Committee- Yorkshire and the Humber and Northumbria University Health and Life Sciences Ethics Committee. The patients/participants provided their written informed consent to participate in this study.
AO’D, EJ, SN, LI, SG, and SC: conceptualization. SN, AO’D, EJ, and KW: data collection. EJ: analysis and writing original draft. All authors contributed to the article and approved the submitted version.
Financial support for blood sample analysis was provided by Hull and East Riding Cardiac Trust Fund (Hull, East Yorkshire, United Kingdom) and Northumbria University (Newcastle upon Tyne, United Kingdom).
We would like to thank Hull and East Riding Cardiac Trust Fund and Northumbria University for providing financial support enabling blood sample analysis. We extend our gratitude to Wendy Summer, Lesley Richardson, and Emma Smith for their support recruiting people to this study. We would also like to thank Julie Davis, Joan Weston and Stella Rimmer for the support they provided during data collection.
The authors declare that the research was conducted in the absence of any commercial or financial relationships that could be construed as a potential conflict of interest.
All claims expressed in this article are solely those of the authors and do not necessarily represent those of their affiliated organizations, or those of the publisher, the editors and the reviewers. Any product that may be evaluated in this article, or claim that may be made by its manufacturer, is not guaranteed or endorsed by the publisher.
ALT, Alanine aminotransferase; ASM%, Appendicular skeletal muscle; AST, Aspartate aminotransferase; CAF, C-terminal agrin fragment; CHD, Coronary heart disease; DXA, Dual X-ray absorptiometry; Hs-CRP, High sensitivity C-reactive protein; SMI, Skeletal muscle index; SMM, Skeletal muscle mass.
1. Vancheri, F, Tate, AR, Henein, M, Backlund, L, Donfrancesco, C, Palmieri, L, et al. Time trends in ischaemic heart disease incidence and mortality over three decades (1990-2019) in 20 Western European countries: systematic analysis of the Global Burden of Disease Study 2019. Eur J Prev Cardiol. (2022) 29:396–403. doi: 10.1093/eurjpc/zwab134
2. Wang, DX, Yao, J, Zirek, Y, Reijnierse, EM, and Maier, AB. Muscle mass, strength, and physical performance predicting activities of daily living: a meta-analysis. J Cachexia Sarcopenia Muscle. (2020) 11:3–25. doi: 10.1002/jcsm.12502
3. Landi, F, Calvani, R, Picca, A, Tosato, M, Bernabei, R, and Marzetti, E. Emerging research on importance of muscle mass and function. J Gerontol Geriatr. (2019) 67:26–31.
4. Nichols, S, O'Doherty, AF, Taylor, C, Clark, AL, Carroll, S, and Ingle, L. Low skeletal muscle mass is associated with low aerobic capacity and increased mortality risk in patients with coronary heart disease–a CARE CR study. Clin Physiol Funct Imaging. (2019) 39:93–102. doi: 10.1111/cpf.12539
5. Sato, R, Akiyama, E, Konishi, M, Matsuzawa, Y, Suzuki, H, Kawashima, C, et al. Decreased appendicular skeletal muscle mass is associated with poor outcomes after ST-segment elevation myocardial infarction. J Atheroscler Thromb. (2020) 27:1278–87. doi: 10.5551/jat.52282
6. Xue, Q, Wu, J, Ren, Y, Hu, J, Yang, K, and Cao, J. Sarcopenia predicts adverse outcomes in an elderly population with coronary artery disease: a systematic review and meta-analysis. BMC Geriatr. (2021) 21:1–10. doi: 10.1186/s12877-021-02438-w
7. Kang, DO, Park, SY, Choi, BG, Na, JO, Choi, CU, Kim, EJ, et al. Prognostic impact of low skeletal muscle mass on major adverse cardiovascular events in coronary artery disease: a propensity score-matched analysis of a single center all-comer cohort. J Clin Med. (2019) 8:712. doi: 10.3390/jcm8050712
8. van Venrooij, LMW, Verberne, HJ, de Vos, R, Borgmeijer-Hoelen, MMMJ, van Leeuwen, PAM, and de Mol, BAJM. Postoperative loss of skeletal muscle mass, complications and quality of life in patients undergoing cardiac surgery. Nutrition. (2012) 28:40–5. doi: 10.1016/j.nut.2011.02.007
9. Aagaard, P, Suetta, C, Caserotti, P, Magnusson, SP, and Kjær, M. Role of the nervous system in sarcopenia and muscle atrophy with aging: strength training as a countermeasure. Scand J Med Sci Sports. (2010) 20:49–64. doi: 10.1111/j.1600-0838.2009.01084.x
10. Kwon, YN, and Yoon, SS. Sarcopenia: neurological point of view. J Bone Metab. (2017) 24:83–9. doi: 10.11005/jbm.2017.24.2.83
11. Jimenez-Gutierrez, GE, Martínez-Gómez, LE, Martínez-Armenta, C, Pineda, C, Martínez-Nava, GA, and Lopez-Reyes, A. Molecular mechanisms of inflammation in sarcopenia: diagnosis and therapeutic update. Cells. (2022) 11:2359. doi: 10.3390/cells11152359
12. Dalle, S, Rossmeislova, L, and Koppo, K. The role of inflammation in age-related sarcopenia. Front Physiol. (2017) 8:1045. doi: 10.3389/fphys.2017.01045
13. Abiri, B, and Vafa, M. The role of nutrition in attenuating age-related skeletal muscle atrophy. Rev New Drug Targets Age-Related Disord. (2020) 1260:297–318. doi: 10.1007/978-3-030-42667-5_12
14. Zhang, J, Yu, Y, and Wang, J. Protein nutritional support: the classical and potential new mechanisms in the prevention and therapy of sarcopenia. J Agric Food Chem. (2020) 68:4098–108. doi: 10.1021/acs.jafc.0c00688
15. Reif, R, Sales, S, Hettwer, S, Dreier, B, Gisler, C, Wölfel, J, et al. Specific cleavage of agrin by neurotrypsin, a synaptic protease linked to mental retardation. FASEB J. (2007) 21:3468–78. doi: 10.1096/fj.07-8800com
16. Bolliger, MF, Zurlinden, A, Lüscher, D, Bütikofer, L, Shakhova, O, Francolini, M, et al. Specific proteolytic cleavage of agrin regulates maturation of the neuromuscular junction. J Cell Sci. (2010) 123:3944–55. doi: 10.1242/jcs.072090
17. Hettwer, S, Dahinden, P, Kucsera, S, Farina, C, Ahmed, S, Fariello, R, et al. Elevated levels of a C-terminal agrin fragment identifies a new subset of sarcopenia patients. Exp Gerontol. (2013) 48:69–75. doi: 10.1016/j.exger.2012.03.002
18. Landi, F, Calvani, R, Lorenzi, M, Martone, AM, Tosato, M, Drey, M, et al. Serum levels of C-terminal agrin fragment (CAF) are associated with sarcopenia in older multimorbid community-dwellers: results from the ilSIRENTE study. Exp Gerontol. (2016) 79:31–6. doi: 10.1016/j.exger.2016.03.012
19. Steinbeck, L, Ebner, N, Valentova, M, Bekfani, T, Elsner, S, Dahinden, P, et al. Detection of muscle wasting in patients with chronic heart failure using C-terminal agrin fragment: results from the Studies Investigating Co-morbidities Aggravating Heart Failure (SICA-HF). Eur J Heart Fail. (2015) 17:1283–93. doi: 10.1002/ejhf.400
20. Evans, DC, Corkins, MR, Malone, A, Miller, S, Mogensen, KM, Guenter, P, et al. The use of visceral proteins as nutrition markers: an ASPEN position paper. Nutr Clin Pract. (2021) 36:22–8. doi: 10.1002/ncp.10588
21. Zhang, N, Zhu, WL, Liu, XH, Chen, W, Zhu, ML, Sun, XH, et al. Related factors of sarcopenia in hospitalized elderly patients with coronary heart disease. Zhonghua Xin Xue Guan Bing Za Zhi. (2019) 47:979–84. doi: 10.3760/cma.j.issn.0253-3758.2019.12.007
22. Cruz-Jentoft, AJ, Bahat, G, Bauer, J, Boirie, Y, Bruyère, O, Cederholm, T, et al. Sarcopenia: revised European consensus on definition and diagnosis. Age Ageing. (2019) 48:16–31. doi: 10.1093/ageing/afy169
23. Kalas, MA, Chavez, L, Leon, M, Taweesedt, PT, and Surani, S. Abnormal liver enzymes: a review for clinicians. World J Hepatol. (2021) 13:1688–98. doi: 10.4254/wjh.v13.i11.1688
24. Ko, S-H, Baeg, MK, Han, K-D, Ko, S-H, and Ahn, Y-B. Increased liver markers are associated with higher risk of type 2 diabetes. World J Gastroenterol. (2015) 21:7478–87. doi: 10.3748/wjg.v21.i24.7478
25. Hanley, AJG, Williams, K, Festa, A, Wagenknecht, LE, D’Agostino, RB Jr, and Haffner, SM. Liver markers and development of the metabolic syndrome: the insulin resistance atherosclerosis study. Diabetes. (2005) 54:3140–7. doi: 10.2337/diabetes.54.11.3140
26. Vespasiani-Gentilucci, U, De Vincentis, A, Ferrucci, L, Bandinelli, S, Antonelli Incalzi, R, and Picardi, A. Low alanine aminotransferase levels in the elderly population: frailty, disability, sarcopenia, and reduced survival. J Gerontol A Biol Sci Med Sci. (2018) 73:925–30. doi: 10.1093/gerona/glx126
27. He, Y, Ding, F, Yin, M, Zhang, H, Hou, L, Cui, T, et al. High serum AST/ALT ratio and low serum INS*PA product are risk factors and can diagnose sarcopenia in middle-aged and older adults. Front Endocrinol. (2022) 13:843610. doi: 10.3389/fendo.2022.843610
28. Yin, M, Zhang, H, Liu, Q, Ding, F, Deng, Y, Hou, L, et al. Diagnostic performance of clinical laboratory indicators with sarcopenia: results from the west China health and aging trend study. Front Endocrinol. (2021) 12:785045. doi: 10.3389/fendo.2021.785045
29. Nichols, S, Nation, F, Goodman, T, Clark, AL, Carroll, S, and Ingle, L. CARE CR-Cardiovascular and cardiorespiratory Adaptations to Routine Exercise-based Cardiac Rehabilitation: a study protocol for a community-based controlled study with criterion methods. BMJ Open. (2018) 8:e019216. doi: 10.1136/bmjopen-2017-019216
30. Nichols, S, Taylor, C, Goodman, T, Page, R, Kallvikbacka-Bennett, A, Nation, F, et al. Routine exercise-based cardiac rehabilitation does not increase aerobic fitness: a CARE CR study. Int J Cardiol. (2020) 305:25–34. doi: 10.1016/j.ijcard.2020.01.044
31. Levine, ME, and Crimmins, EM. The impact of insulin resistance and inflammation on the association between sarcopenic obesity and physical functioning. Obesity. (2012) 20:2101–6. doi: 10.1038/oby.2012.20
32. Bruce, RA, Kusumi, F, and Hosmer, D. Maximal oxygen intake and nomographic assessment of functional aerobic impairment in cardiovascular disease. Am Heart J. (1973) 85:546–62. doi: 10.1016/0002-8703(73)90502-4
33. Busher, J. Serum albumin and globulin In: HK Walker, WD Hall, and JW Hurst, editors. Clinical Methods: The History, Physical, and Laboratory Examinations. 3rd ed. Boston: Butterworths (1990)
34. Ingenbleek, Y, and Bernstein, LH. Plasma transthyretin as a biomarker of lean body mass and catabolic states. Adv Nutr. (2015) 6:572–80. doi: 10.3945/an.115.008508
35. Ceriotti, F, Henny, J, Queraltó, J, Ziyu, S, Özarda, Y, Chen, B, et al. Common reference intervals for aspartate aminotransferase (AST), alanine aminotransferase (ALT) and γ-glutamyl transferase (GGT) in serum: results from an IFCC multicenter study. Clin Chem Lab Med. (2010) 48:1593–601. doi: 10.1515/CCLM.2010.315
36. Tomczak, M, and Tomczak, E. The need to report effect size estimates revisited. An overview of some recommended measures of effect size. Trends Sport Sci. (2014) 21:19–25.
37. Coolican, H. Research Methods and Statistics in Psychology. London, UK: Psychology Press (2017).
38. Nichols, S, O’Doherty, A, Carroll, S, and Ingle, L. Influence of appendicular skeletal muscle mass on resting metabolic equivalents in patients with cardiovascular disease: Implications for exercise training and prescription. Eur J Prev Cardiol. (2020) 27:1001–3. doi: 10.1177/2047487319856432
39. Epstein, FH. Acute-phase proteins and other systemic responses to inflammation. Complement. (1999) 3:C9.
41. Carter, JV, Pan, J, Rai, SN, and Galandiuk, S. ROC-ing along: Evaluation and interpretation of receiver operating characteristic curves. Surgery. (2016) 159:1638–45. doi: 10.1016/j.surg.2015.12.029
42. Harada, H, Kai, H, Niiyama, H, Nishiyama, Y, Katoh, A, Yoshida, N, et al. Effectiveness of cardiac rehabilitation for prevention and treatment of sarcopenia in patients with cardiovascular disease-a retrospective cross-sectional analysis. J Nutr Health Aging. (2017) 21:449–56. doi: 10.1007/s12603-016-0743-9
43. Peng, LN, Lee, WJ, Liu, LK, Lin, MH, and Chen, LK. Healthy community-living older men differ from women in associations between myostatin levels and skeletal muscle mass. J Cachexia Sarcopenia Muscle. (2018) 9:635–42. doi: 10.1002/jcsm.12302
44. Rausch, V, Sala, V, Penna, F, Porporato, PE, and Ghigo, A. Understanding the common mechanisms of heart and skeletal muscle wasting in cancer cachexia. Oncogenesis. (2021) 10:1. doi: 10.1038/s41389-020-00288-6
45. Barreiro, E, and Jaitovich, A. Muscle atrophy in chronic obstructive pulmonary disease: molecular basis and potential therapeutic targets. J Thorac Dis. (2018) 10:S1415–24. doi: 10.21037/jtd.2018.04.168
46. Zhao, M, Zhou, X, Yuan, C, Li, R, Ma, Y, and Tang, X. Association between serum irisin concentrations and sarcopenia in patients with liver cirrhosis: a cross-sectional study. Sci Rep. (2020) 10:16093. doi: 10.1038/s41598-020-73176-z
47. Dong, J, Li Yj, LX, Hp, G, Zuo, L, and Hy, W. Correlations of lean body mass with nutritional indicators and mortality in patients on peritoneal dialysis. Kidney Int. (2008) 73:334–40. doi: 10.1038/sj.ki.5002644
48. Prenner, SB, Pillutla, R, Yenigalla, S, Gaddam, S, Lee, J, Obeid, MJ, et al. Serum albumin is a marker of myocardial fibrosis, adverse pulsatile aortic hemodynamics, and prognosis in heart failure with preserved ejection fraction. J Am Heart Assoc. (2020) 9:e014716. doi: 10.1161/JAHA.119.014716
49. Baumgartner, RN, Koehler, KM, Romero, L, and Garry, PJ. Serum albumin is associated with skeletal muscle in elderly men and women. Am J Clin Nutr. (1996) 64:552–8. doi: 10.1093/ajcn/64.4.552
50. Portal, D, Hofstetter, L, Eshed, I, Dan-Lantsman, C, Sella, T, Urban, D, et al. L3 skeletal muscle index (L3SMI) is a surrogate marker of sarcopenia and frailty in non-small cell lung cancer patients. Cancer Manag Res. (2019) 11:2579–88. doi: 10.2147/CMAR.S195869
51. Sergi, G, Coin, A, Enzi, G, Volpato, S, Inelmen, EM, Buttarello, M, et al. Role of visceral proteins in detecting malnutrition in the elderly. Eur J Clin Nutr. (2006) 60:203–9. doi: 10.1038/sj.ejcn.1602289
52. Tachi, Y, Kozuka, A, Hirai, T, Ishizu, Y, Honda, T, Kuzuya, T, et al. Impact of myosteatosis on skeletal muscle volume loss in patients with chronic liver disease. J Gastroenterol Hepatol. (2018) 33:1659–66. doi: 10.1111/jgh.14133
53. Spiekeman, AM. Nutritional assessment (protein nutriture). Anal Chem. (1995) 67:429–36. doi: 10.1021/ac00108a026
54. Bouillanne, O, Hay, P, Liabaud, B, Duché, C, Cynober, L, and Aussel, C. Evidence that albumin is not a suitable marker of body composition-related nutritional status in elderly patients. Nutrition. (2011) 27:165–9. doi: 10.1016/j.nut.2009.12.007
55. Sullivan, DH, Johnson, LE, Dennis, RA, Roberson, PK, Heif, M, Garner, KK, et al. The Interrelationships among albumin, nutrient intake, and inflammation in elderly recuperative care patients. J Nutr Health Aging. (2011) 15:311–5. doi: 10.1007/s12603-010-0297-1
56. Chen, Z, Song, C, Yao, Z, et al. Associations between albumin, globulin, albumin to globulin ratio and muscle mass in adults: results from the national health and nutrition examination survey 2011–2014. BMC Geriatr. (2022) 22:383. doi: 10.1186/s12877-022-03094-4
57. White, JV, Guenter, P, Jensen, G, Malone, A, and Schofield, M. Consensus Statement of the Academy of Nutrition and Dietetics/American Society for Parenteral and Enteral Nutrition: characteristics recommended for the identification and documentation of adult malnutrition (undernutrition). J Acad Nutr Diet. (2012) 112:730–8. doi: 10.1016/j.jand.2012.03.012
58. Pennings, B, Groen, B, de Lange, A, Gijsen, AP, Zorenc, AH, Senden, JMG, et al. Amino acid absorption and subsequent muscle protein accretion following graded intakes of whey protein in elderly men. Am J Physiol Endocrinol Metab. (2012) 302:E992–9. doi: 10.1152/ajpendo.00517.2011
59. de Jong, FA, and Schreiber, G. Messenger RNA levels of plasma proteins in rat liver during protein depletion and refeeding. J Nutr. (1987) 117:1795–800. doi: 10.1093/jn/117.10.1795
60. Ranasinghe, RN, Biswas, M, and Vincent, RP. Prealbumin: the clinical utility and analytical methodologies. Ann Clin Biochem. (2022) 59:7–14. doi: 10.1177/0004563220931885
61. Kwo, PY, Cohen, SM, and Lim, JK. ACG clinical guideline: evaluation of abnormal liver chemistries. Am J Gastroenterol. (2017) 112:18–35. doi: 10.1038/ajg.2016.517
62. Felig, P. The glucose-alanine cycle. Metabolism. (1973) 22:179–207. doi: 10.1016/0026-0495(73)90269-2
63. McGill, MR. The past and present of serum aminotransferases and the future of liver injury biomarkers. EXCLI J. (2016) 15:817–28. doi: 10.17179/excli2016-800
64. Yoo, KD, Jun, DW, Lee, KN, Lee, HL, Lee, OY, Yoon, BC, et al. Sarcopenia is a risk factor for elevated aminotransferase in men independently of body mass index, dietary habits, and physical activity. Dig Liver Dis. (2015) 47:303–8. doi: 10.1016/j.dld.2014.12.014
65. Mizuno, N, Seko, Y, Kataoka, S, Okuda, K, Furuta, M, Takemura, M, et al. Increase in the skeletal muscle mass to body fat mass ratio predicts the decline in transaminase in patients with nonalcoholic fatty liver disease. J Gastroenterol. (2019) 54:160–70. doi: 10.1007/s00535-018-1485-8
66. Takata, R, Nishikawa, H, Enomoto, H, Iwata, Y, Ishii, A, Miyamoto, Y, et al. Relationship between skeletal muscle mass and liver fibrosis markers for patients with hepatitis C virus related liver disease. Medicine. (2017) 96:e8761. doi: 10.1097/MD.0000000000008761
67. Ramaiah, SK. A toxicologist guide to the diagnostic interpretation of hepatic biochemical parameters. Food Chem Toxicol. (2007) 45:1551–7. doi: 10.1016/j.fct.2007.06.007
68. Vanderlinde, RE. Review of pyridoxal phosphate and the transaminases in liver disease. Ann Clin Lab Sci. (1986) 16:79–93.
69. van den Berg, H. Vitamin B6 status and requirements in older adults. Br J Nutr. (1999) 81:175–6. doi: 10.1017/S0007114599000355
70. ter Borg, S, Verlaan, S, Hemsworth, J, Mijnarends, DM, Schols, JM, Luiking, YC, et al. Micronutrient intakes and potential inadequacies of community-dwelling older adults: a systematic review. Br J Nutr. (2015) 113:1195–206. doi: 10.1017/S0007114515000203
71. Drey, M, Sieber, C, Bauer, J, Uter, W, Dahinden, P, Fariello, R, et al. C-terminal agrin fragment as a potential marker for sarcopenia caused by degeneration of the neuromuscular junction. Exp Gerontol. (2013) 48:76–80. doi: 10.1016/j.exger.2012.05.021
72. Qaisar, R, Karim, A, Muhammad, T, and Shah, I. Circulating biomarkers of accelerated sarcopenia in respiratory diseases. Biology. (2020) 9:322. doi: 10.3390/biology9100322
73. Qaisar, R, Karim, A, Muhammad, T, Shah, I, and Khan, J. Prediction of sarcopenia using a battery of circulating biomarkers. Sci Rep. (2021) 11:8632. doi: 10.1038/s41598-021-87974-6
74. Stephan, A, Mateos, JM, Kozlov, SV, Cinelli, P, Kistler, AD, Hettwer, S, et al. Neurotrypsin cleaves agrin locally at the synapse. FASEB J. (2008) 22:1861–73. doi: 10.1096/fj.07-100008
75. Rowan, SL, Rygiel, K, Purves-Smith, FM, Solbak, NM, Turnbull, DM, and Hepple, RT. Denervation causes fiber atrophy and myosin heavy chain co-expression in senescent skeletal muscle. PLoS One. (2012) 7:e29082. doi: 10.1371/journal.pone.0029082
76. Willadt, S, Nash, M, and Slater, CR. Age-related fragmentation of the motor endplate is not associated with impaired neuromuscular transmission in the mouse diaphragm. Sci Rep. (2016) 6:1–8. doi: 10.1038/srep24849
77. de Souza Ramos, JTG, Ferrari, FS, Andrade, MF, de Melo, CS, Boas, PJFV, Costa, NA, et al. Association between frailty and C-terminal agrin fragment with 3-month mortality following ST-elevation myocardial infarction. Exp Gerontol. (2022) 158:111658. doi: 10.1016/j.exger.2021.111658
78. Sánchez-Castellano, C, Martín-Aragón, S, Bermejo-Bescós, P, Vaquero-Pinto, N, Miret-Corchado, C, Merello de Miguel, A, et al. Biomarkers of sarcopenia in very old patients with hip fracture. J Cachexia Sarcopenia Muscle. (2020) 11:478–86. doi: 10.1002/jcsm.12508
79. Buckinx, F, Landi, F, Cesari, M, Fielding, RA, Visser, M, Engelke, K, et al. Pitfalls in the measurement of muscle mass: a need for a reference standard. J Cachexia Sarcopenia Muscle. (2018) 9:269–78. doi: 10.1002/jcsm.12268
Keywords: agrin, albumin, aminotransferases, biomarkers, coronary heart disease, muscle, sarcopenia, transthyretin
Citation: James E, Goodall S, Nichols S, Walker K, Carroll S, O’Doherty AF and Ingle L (2023) Serum transthyretin and aminotransferases are associated with lean mass in people with coronary heart disease: Further insights from the CARE-CR study. Front. Med. 10:1094733. doi: 10.3389/fmed.2023.1094733
Edited by:
Marco Vincenzo Narici, University of Padua, ItalyReviewed by:
Adriana Caldo-Silva, University of Coimbra, PortugalCopyright © 2023 James, Goodall, Nichols, Walker, Carroll, O’Doherty and Ingle. This is an open-access article distributed under the terms of the Creative Commons Attribution License (CC BY). The use, distribution or reproduction in other forums is permitted, provided the original author(s) and the copyright owner(s) are credited and that the original publication in this journal is cited, in accordance with accepted academic practice. No use, distribution or reproduction is permitted which does not comply with these terms.
*Correspondence: Emily James, ✉ RW1pbHkuai5jLmphbWVzQG5vcnRodW1icmlhLmFjLnVr
Disclaimer: All claims expressed in this article are solely those of the authors and do not necessarily represent those of their affiliated organizations, or those of the publisher, the editors and the reviewers. Any product that may be evaluated in this article or claim that may be made by its manufacturer is not guaranteed or endorsed by the publisher.
Research integrity at Frontiers
Learn more about the work of our research integrity team to safeguard the quality of each article we publish.