 Sally Ji Who Kim1,2*†
 Janine M. Lupo1
 Yicheng Chen1
 Miguel H. Pampaloni1
 Henry F. VanBrocklin1
 Jared Narvid1
 Helen Kim3
 Youngho Seo1
- 1Department of Radiology and Biomedical Imaging, University of California, San Francisco, San Francisco, CA, United States
- 2Cardiovascular Research Center, Cardiology Division, Massachusetts General Hospital, Harvard Medical School, Boston, MA, United States
- 3Department of Anesthesia and Perioperative Care, Center for Cerebrovascular Research, University of California, San Francisco, San Francisco, CA, United States
Aim: Neuroinflammation plays a key role in both the pathogenesis and the progression of cerebral cavernous malformations (CCM). Flutriciclamide ([18F]GE-180) is a translocator protein (TSPO) targeting positron emission tomography (PET) tracer, developed for imaging neuroinflammation. The objectives of this study were to describe characteristics of flutriciclamide uptake in different brain tissue regions in CCM patients compared to controls, and to evaluate flutriciclamide uptake and iron deposition within CCM lesions.
Materials and methods: Five patients with CCM and six controls underwent a 60 or 90 min continuous PET/MRI scan following 315 ± 68.9 MBq flutriciclamide administration. Standardized uptake value (SUV) and standardized uptake value ratio (SUVr) were obtained using the striatum as a pseudo-reference. Quantitative susceptibility maps (QSM) were used to define the location of the vascular malformation and calculate the amount of iron deposition in each lesion.
Results: Increased flutriciclamide uptake was observed in all CCM lesions. The temporal pole demonstrated the highest radiotracer uptake; the paracentral lobule, cuneus and hippocampus exhibited moderate uptake; while the striatum had the lowest uptake, with average SUVs of 0.66, 0.55, 0.63, 0.55, and 0.33 for patient with CCM and 0.57, 0.50, 0.48, 0.42, and 0.32 for controls, respectively. Regional SUVr showed similar trends. The average SUV and QSM values in CCM lesions were 0.58 ± 0.23 g/ml and 0.30 ± 0.10 ppm. SUVs and QSM were positively correlated in CCM lesions (r = 0.53, p = 0.03).
Conclusion: The distribution of flutriciclamide ([18F]GE-180) in the human brain and CCM lesions demonstrated the potential of this TSPO PET tracer as a marker of neuroinflammation that may be relevant for characterizing CCM disease progression along with QSM.
Introduction
Cerebral cavernous malformations (CCM) are abnormal clusters of leaky, enlarged capillaries in the brain or spinal cord that can occur as a sporadic or inherited rare disease in approximately 0.5% of the population (1–4). Approximately 75% of patients with these cerebrovascular malformations have a high risk of intracranial hemorrhages, seizures, focal neurological deficits, and severe headaches secondary to CCM (5). Currently, surgery or radiosurgery of are possible interventional treatment options for patients with symptomatic CCM (6). Although genetic mutations in KRIT1/CCM1, CCM2, and PDCD10/CCM3 are known causes of CCM (7), factors influencing rates of disease severity and progression of CCM remain unknown. Quantitative parameters are needed to better understand the evolution of CCM and predict the onset of symptoms for early intervention.
In recent studies, neuroinflammation has been raised as a novel marker of CCM-related vascular injury (1, 2, 8, 9) along with the number, size, and location of CCM lesions. Repetitive microhemorrhages induce lesion malformation growth and attract macrophages and other inflammatory cells for vascular repair. It has been shown that inflammation is highly correlated with the rupture of the malformation (2). Aside from macrophages, there is also significant evidence of other immune cells (polymorphonuclear cells, macrophages, antibodies producing B-lymphocytes, and plasma cells) inside the CCM lesion (10–13). Macrophages were also found to be present in newly formed CCM lesions in transgenic mice (14).
Translocator protein (TSPO) is a transmembrane protein located in the outer membrane of the mitochondria in the central and peripheral nervous system (15–18). For more than three decades, in vivo TSPO positron emission tomography (PET) imaging has been widely applied for detecting brain neuroinflammatory processes and associated microglial disease, with limited success initially using earlier TSPO agents (15, 18–24). The third generation of TSPO receptor-ligand for PET imaging, flutriciclamide ([18F]GE-180), has improved affinity, permeability, and target to background contrast (25–27) with a longer half-life (109.7 min) than that of 11C (20.4 min), which has been used extensively for TSPO PET imaging previously. Flutriciclamide has shown promise as a biomarker for multiple sclerosis, glioma, and other neuroinflammatory diseases, with significant uptake in the target lesion (24, 28–39). By taking advantage of the low expression of TSPO in the brain under normal physiologic conditions, activation of microglial cells caused by inflammatory stimuli results in significant upregulation of TSPO expression (19, 40, 41).
The purpose of this study was to quantify flutriciclamide’s uptake patterns in the brains of control subjects and patients with CCM using TSPO PET and compare these uptake levels caused by neuroinflammation with iron deposition assessed via quantitative susceptibility mapping (QSM) (22, 42–44). We hypothesize that the 18 kDa TSPO PET would identify biologically active regions of CCM lesions due to microglia activation and the presence of macrophages that would correlate with iron deposition.
Materials and methods
CCM participants and controls
PET/MR imaging was performed on five patients with cerebral cavernous malformations (CCM) and six control participants with human immunodeficiency virus (HIV). Eligible participants for this imaging study were age 18 or older. Patients were excluded from the study if they (1) had a contraindication to the administration of a radiotracer or gadolinium MRI contrast, or (2) were women who were pregnant or lactating at the time of screening due to increased potential risk. All patients provided informed consent to enroll in this study that was approved by our institutional review board.
Genotyping
A known functional polymorphism of TSPO (Ala147Thr polymorphism) affects binding of several high-affinity TSPO radioligands. The TSPO genotype is comprised of high-affinity binders (HAB), mixed-affinity binders (MAB), and low-affinity binders (LAB). Thus, all participants were genotyped and those with the LAB genotype were additionally excluded. Blood or saliva was collected from enrolled participants for TSPO genotyping. DNA was extracted from blood samples using a Qiagen QIAmp DNA blood mini kit or from saliva samples using Oragene kits at UCSF laboratories using standard protocols. Genotyping was performed using a TaqMan allelic discrimination assay (Applied Biosystems C__2512465_20) and control samples of all three genotypes (HAB, MAB, and LAB) were included in each run.
Synthesis of flutriciclamide
Flutriciclamide was prepared for human use under a protocol approved by the local radioactive drug research committee (RDRC). Flutriciclamide was synthesized in the Neptis® automated synthesizer in our current good manufacturing practice (cGMP) radiopharmaceutical facility using a commercially available mesylate precursor (GE Healthcare, UK) (45). The flutriciclamide was purified by high performance liquid chromatography, concentrated, and filtered into sterile product vials. The final product passed all quality testing before being released for injection.
PET/MR imaging acquisition and reconstruction
Participants underwent 60- or 90- min long (30) simultaneous PET and MR scans in a hybrid PET/MRI scanner (SIGNA PET/MR, GE Healthcare, Waukesha, WI, USA) equipped with an 8-channel head coil array. Single intravenous bolus injections of 315 ± 68.9 MBq of flutriciclamide ([18F]GE-180) were administered to all participants. Multiple clinical MR sequences including gradient- and spin-echo T1-weighted images pre- and post-gadolinium contrast injection, diffusion weighted imaging (DWI), arterial spin labeling (ASL), MR-angiography, in-phase T1, and a T2*-weighted, multi-echo susceptibility-weighted angiography (SWAN) scan (6 echoes with TEs = 13, 17.3, 21.6, 25.9, 30.2, 34.5 ms, TR = 50.7 ms, flip angle = 20°, FOV = 24 cm, ARC with R = 2 and a reconstructed image matrix of 512 × 512 × 108 with the voxel size of 0.47 mm× 0.47 mm× 1.50 mm) that was used for QSM map generation. A manufacturer-provided time-of-flight-enabled [approximately 400 ps (33)] iterative reconstruction algorithm (28 subsets, 5 iterations, 2 mm full-width at half-maximum post-reconstruction filter) was used for PET image reconstruction, resulting in a volumetric matrix of 256 × 256 × 89 with the voxel size of 1.17 mm× 1.17 mm× 2.78 mm. Atlas-based attenuation correction was applied to the PET images.
PET image processing and regional analyses
As flutriciclamide uptake plateaus at 60 min (46), all brain PET images were summed over 50–60 min or 60–90 min when the total scan duration was 60 min (29, 30) or 90 min, respectively, to generate consistent standardized uptake values (SUVs) (29, 30, 46–48) between control and CCM participants. The difference in the total scan time (60 min vs. 90 min) was due to logistical issues that truncated the total scan time in a subset of exams. To compare regional SUVs of the tracer in different brain regions between the CCM and control subjects, each static PET image was co-registered and realigned to an automated anatomical labeling (AAL)-region of interest (ROI) atlas using PMOD (version 3.3, PMOD Technologies, Zurich, Switzerland). Each transformation matrix from an in-phase T1 MR to a T1 MR template was used for PET normalization. We chose the striatum as a pseudo-reference region for the evaluation of the SUV ratio (SUVr) in the absence of any true non-specific reference region for TSPO binding (33, 46). Differences in flutriciclamide uptake between control and CCM participant groups were analyzed using unpaired t-test, and a p-value < 0.05 was considered statistically significant.
QSM generation and lesion-specific value
The reconstruction pipeline for the multi-echo QSM is as follows. Missing phase-encoding lines were filled in using the auto-calibrating reconstruction for Cartesian sampling (ARC) method for each individual coil (49) and then a channel-wise inverse Fourier transform was applied to obtain the coil magnitude and phase images. MCPC-3D-S (50) was applied to obtain combined magnitude and raw phase images from each coil for every echo. Skull stripping and brain mask extraction were applied to the magnitude images from each echo using FMRIB Software Library (FSL) Brain Extraction Tool (BET) (51) and the final brain mask was generated by calculating the intersection of all the masks. 3D Laplacian phase unwrapping (52) was subsequently applied on the masked phase images to create unwrapped phase images for QSM processing. Sophisticated Harmonic Artifact Reduction for Phase data with varying spherical kernel (VSHARP) (53, 54) was applied on the unwrapped phase images using the STI Suite toolbox in Matlab to remove the background field before performing the dipole inversion step with iLSQR that generated the final QSM maps (55).
CCM lesion-specific quantification
Cerebral cavernous malformations lesion location, lesion-specific flutriciclamide uptake, and the amount of iron deposition within each lesion were quantified from patients with CCM. CCM ROIs were manually delineated on QSM as hyperintense regions (46, 56) greater than 5 mm in diameter. QSM maps were then resampled to the resolution of the co-registered PET data in order to compare mean SUV to mean QSM value within each CCM lesion.
Statistical analysis
The GraphPad Prism was used for all statistical analyses. The unpaired t-test (p < 0.05) of normal non-CCM brain regions in both the CCM patient and control groups was performed. The mean flutriciclamide SUV and mean QSM value in all 17 CCM lesions were compared using the Pearson correlation.
Results
Patient characteristics
The average age of the CCM participant group (four males and one female) was 48 ± 15, while the average age of the control group (six males) was 57 ± 5. Among the CCM group, both 60 min (n = 2) and 90 min (n = 3) PET scans were acquired. Among the controls, both 60 min (n = 1) and 90 min (n = 5) PET scans were acquired. Four patients with CCM had multiple lesions, while one patient had a sporadic CCM. Patients presented with either focal deficits (n = 3), acute hemorrhage (n = 1) or seizure (n = 1). Three of the patients with multiple CCM had a surgical resection of hemorrhagic lesion prior to the study.
Tracer uptake patterns in different brain regions
For all participants, the visual distribution of flutriciclamide in brain tissue was found to be globally low, with hotspots denoting specific CCM lesion-uptake of flutriciclamide. The temporal pole demonstrated the highest radiotracer uptake (mean SUV = 0.66 ± 0.23); the paracentral lobule, cuneus, and hippocampus exhibited moderate uptake (0.55 ± 0.19, 0.63 ± 0.25, 0.55 ± 0.16, and, respectively); and the striatum had the lowest uptake 0.33 ± 0.12 in the CCM cohort, as indicated in Figure 1A and Table 1. The regional pseudo-SUVr measurements followed a similar trend (Table 2). Although the controls consistently exhibited reduced SUV across all brain regions, the same trends existed between regions for both SUV and SUVr, with the temporal pole likewise demonstrating the highest radiotracer uptake, followed by the paracentral lobule, cuneus, and hippocampus exhibiting moderate uptake, and the striatum having the lowest uptake (average SUVs of 0.57 ± 0.09, 0.50 ± 0.09, 0.48 ± 0.08, 0.42 ± 0.06 and 0.32 ± 0.08, respectively; Table 1). Similarly, regional pseudo-SUVr’s were 1.81 ± 0.34, 1.59 ± 0.34, 1.53 ± 0.24, and 1.34 ± 0.16, respectively (Table 2). The global distribution of SUVs between patients with CCM and controls were within a similar range, with no statistically significant differences found between groups in all normal brain regions analyzed, as illustrated in Figure 1B. All non-CCM brain tissue comparisons between the two groups excluded CCM lesions, hemorrhage, and surgery areas.
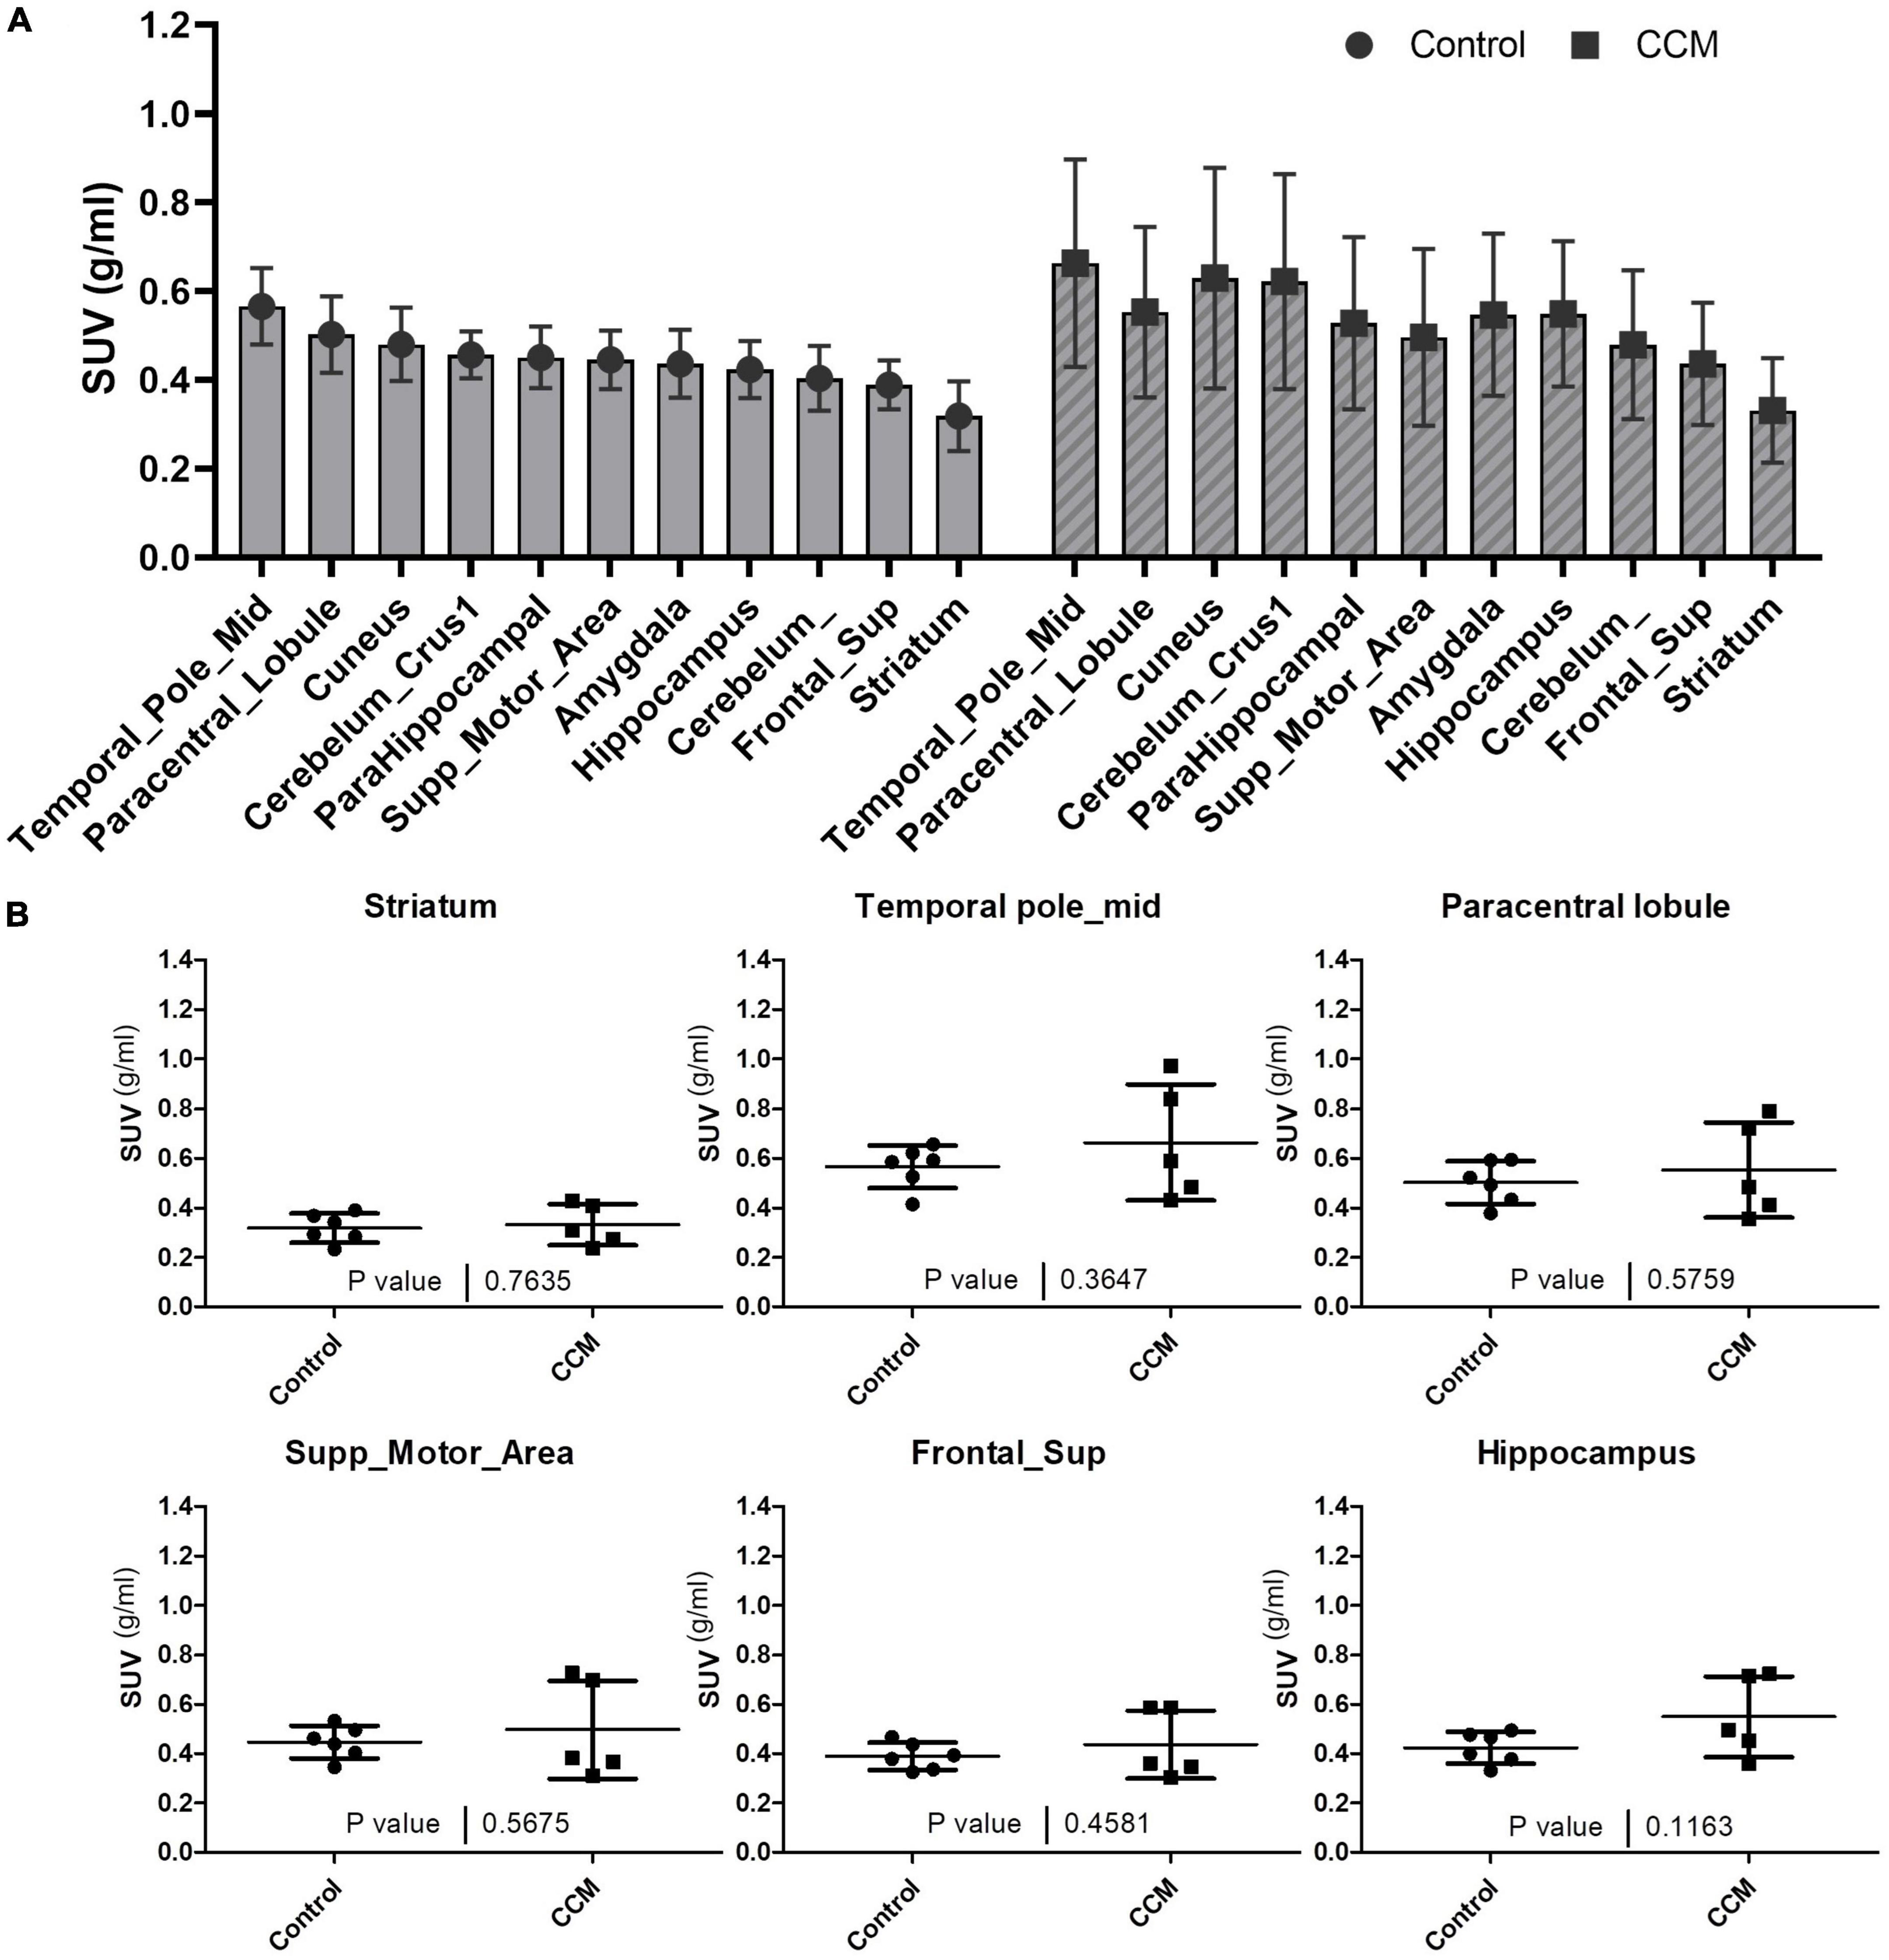
Figure 1. (A) Average SUVs with standard deviation of global brain tissue flutriciclamide uptake in control (gray) and CCM groups (striped). The temporal pole indicates the highest uptake, and the striatum indicates the lowest uptake among all the brain tissue regions. (B) Comparison of flutriciclamide uptake in representative brain tissue of control and CCM groups. The AAL template was used as a predefined ROI. P < 0.05.
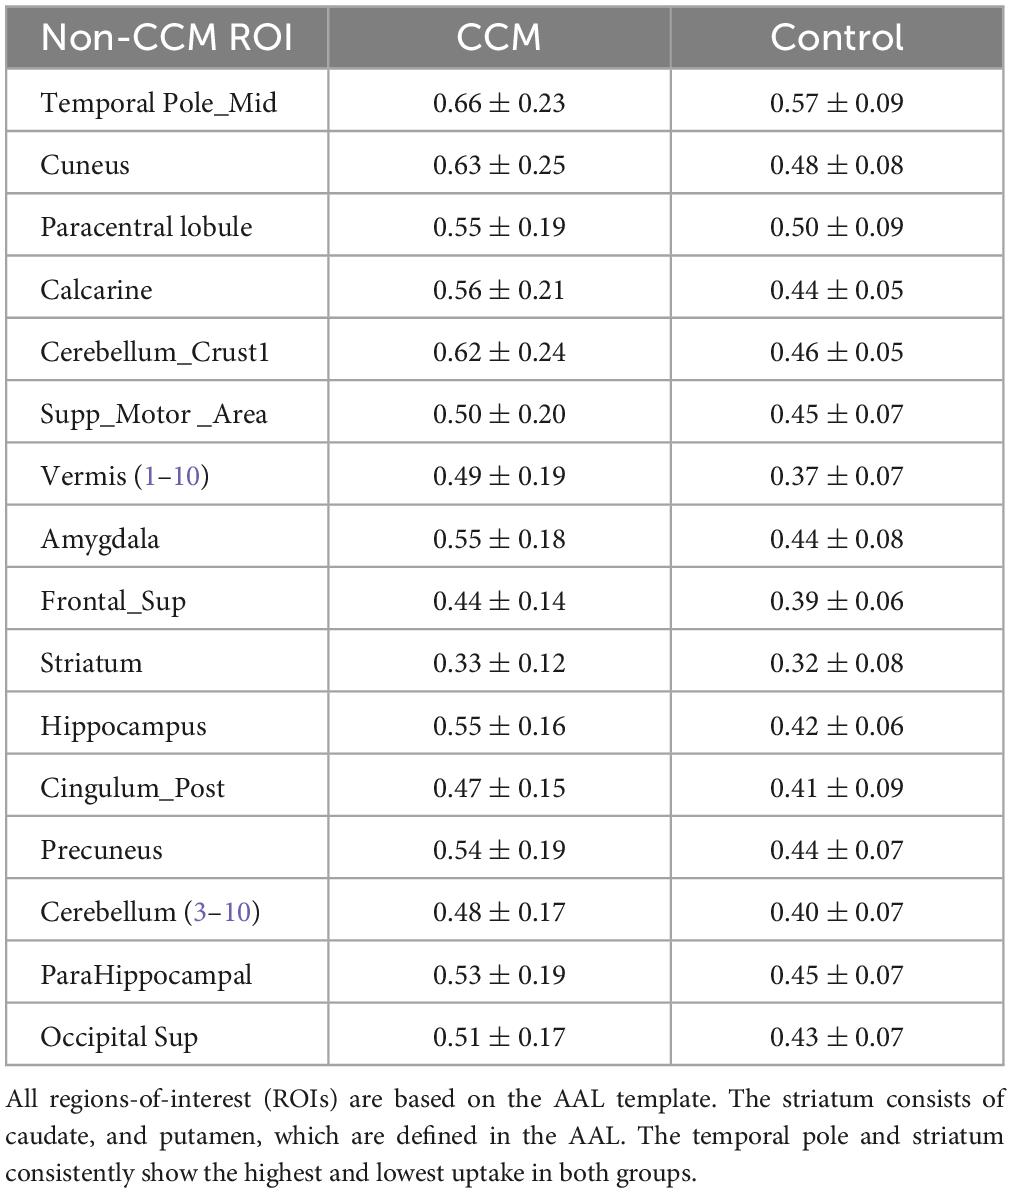
Table 1. Regional flutriciclamide SUVs (g/ml) in the global brain tissue region for both the CCM and control group.
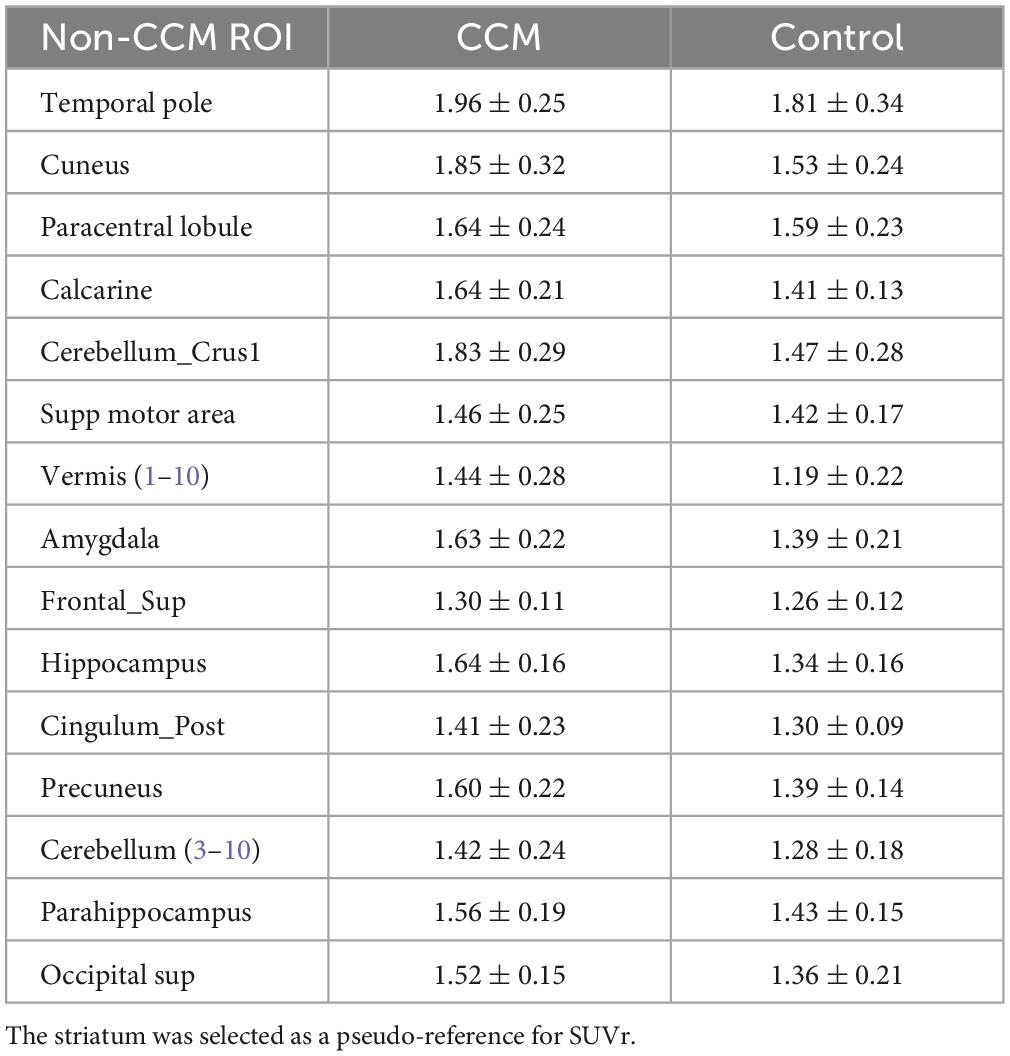
Table 2. Regional pseudo-SUVr of flutriciclamide in brain tissue regions for both the CCM and control group.
Tracer uptake and iron deposition within CCM lesions
Among the multiple acquired MR sequences, QSM demonstrated the highest level of sensitivity for CCM (Figure 2). Average CCM lesion sizes measured on QSM ranged from 68.0 mm3 to 2.3 cm3. CCM lesion location and each patient’s average within-lesion flutriciclamide SUVs are presented in Table 3. The average flutriciclamide SUV and QSM values were 0.58 ± 0.23 g/ml and 0.30 ± 0.10 ppm, respectively, among 17 CCM lesions. The average image contrast ratio of the flutriciclamide uptake in the CCM lesion over the remainder of the non-CCM brain tissue region in the vicinity was 6-7-fold high, as observed in the cross-section profile in Figure 3. Figure 4A shows the increased flutriciclamide uptake within two CCM lesions. Qualitatively, flutriciclamide uptake in CCM lesions was heterogeneous while CCM lesions were overall larger and could appear either heterogenous or uniformly hyperintense on QSM (Figures 4A, 5). SUV of flutriciclamide was positively correlated with QSM values within CCM lesions (r = 0.53, p = 0.03) as indicated in Figure 4B.
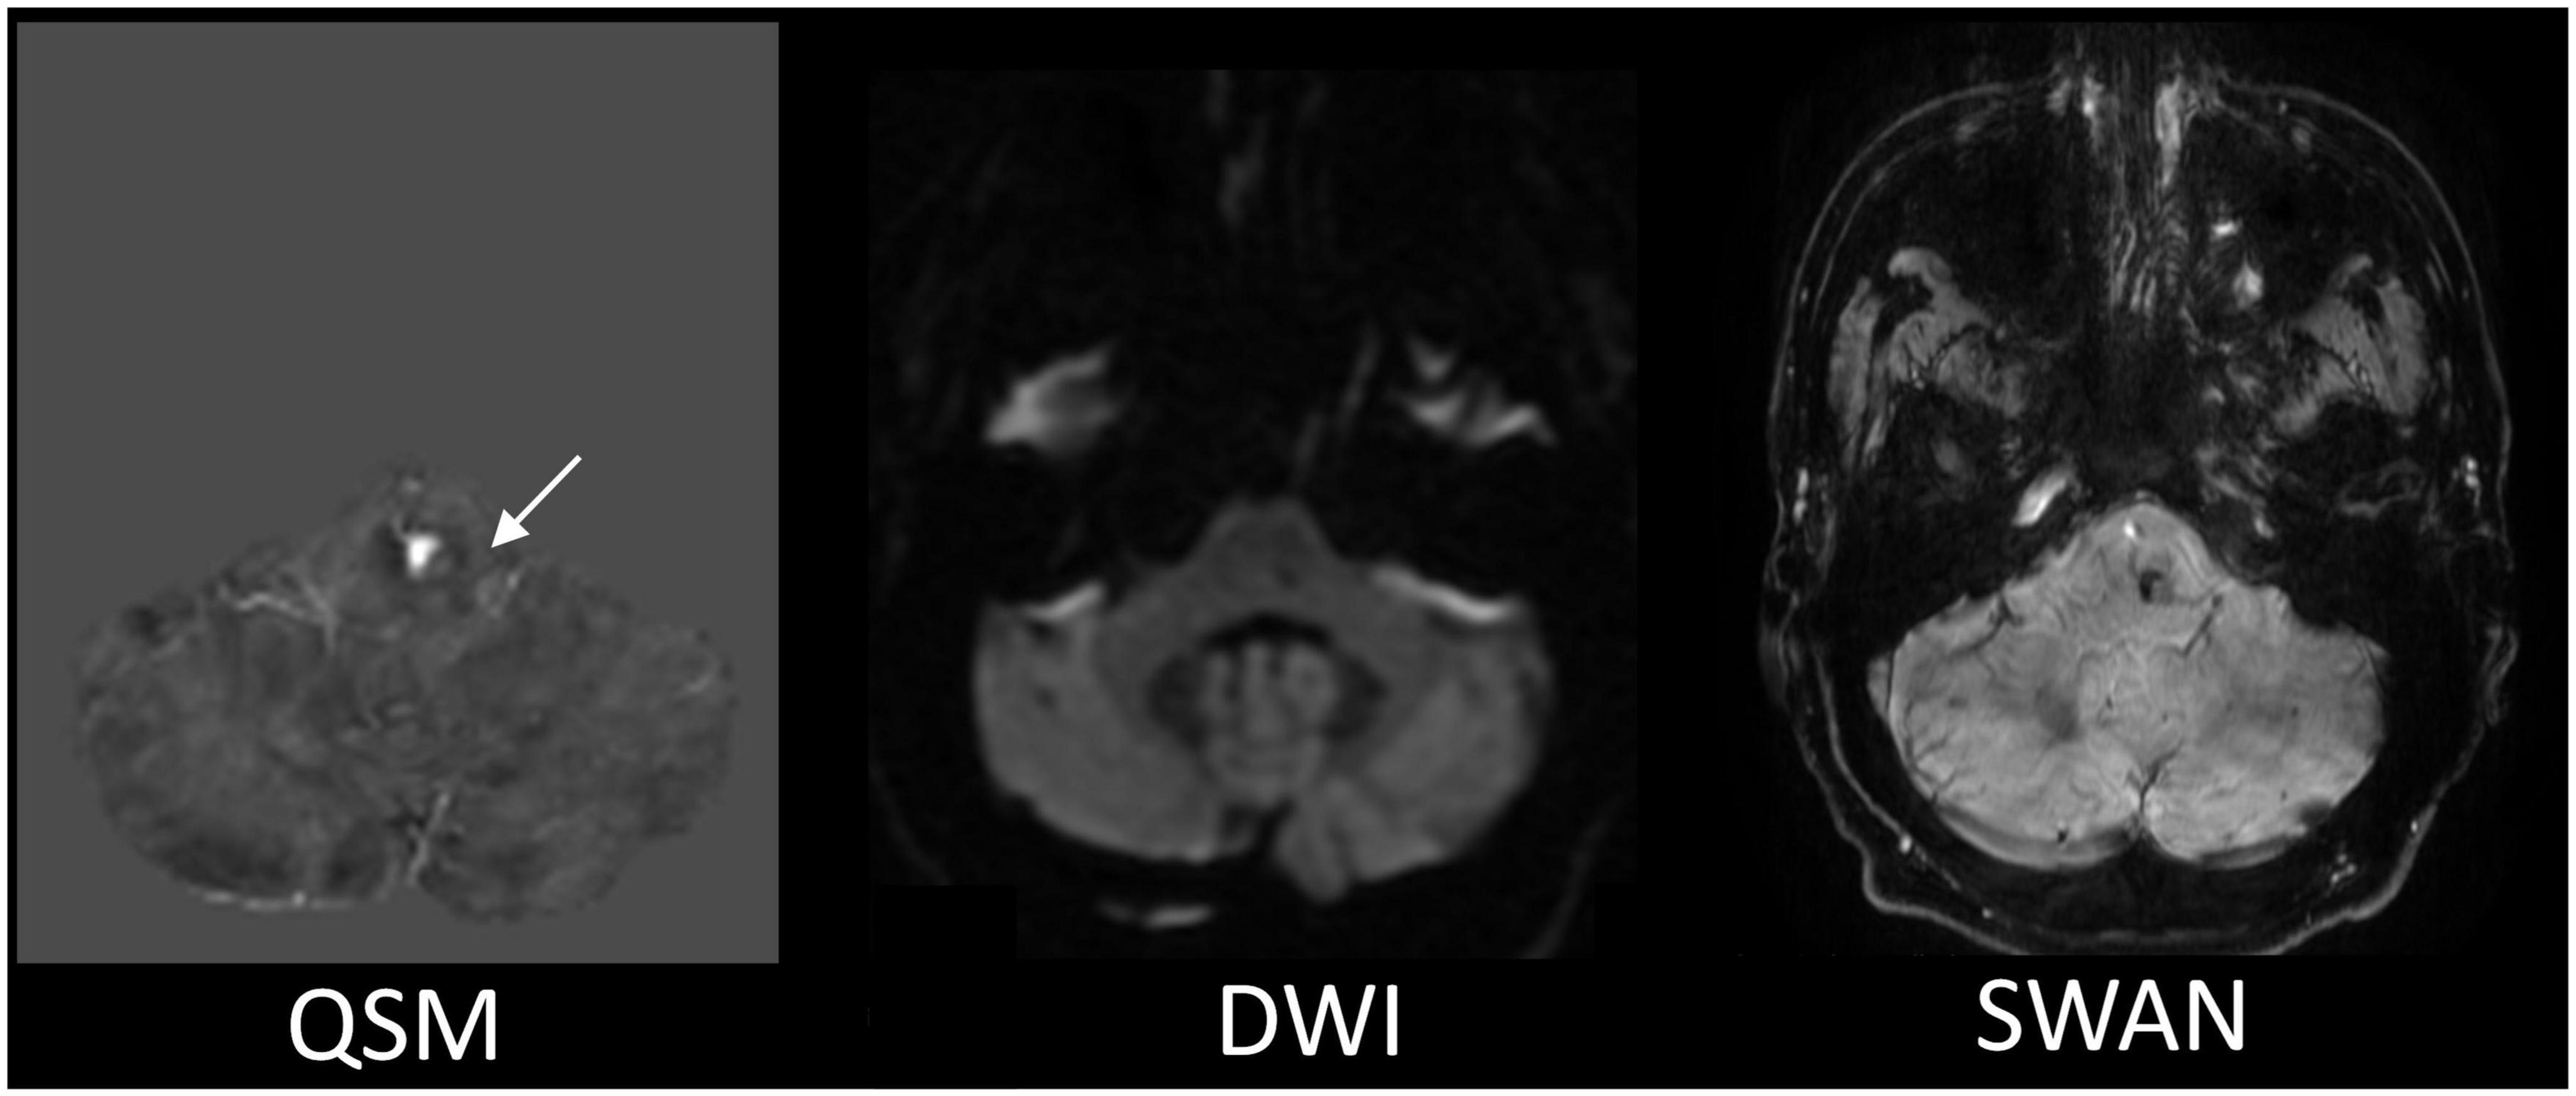
Figure 2. The representative MR images comparison for the CCM detection. The QSM displays the most apparent boundary of the CCM from among all the MR images we acquired. The white arrow is pointing to the location of the CCM.
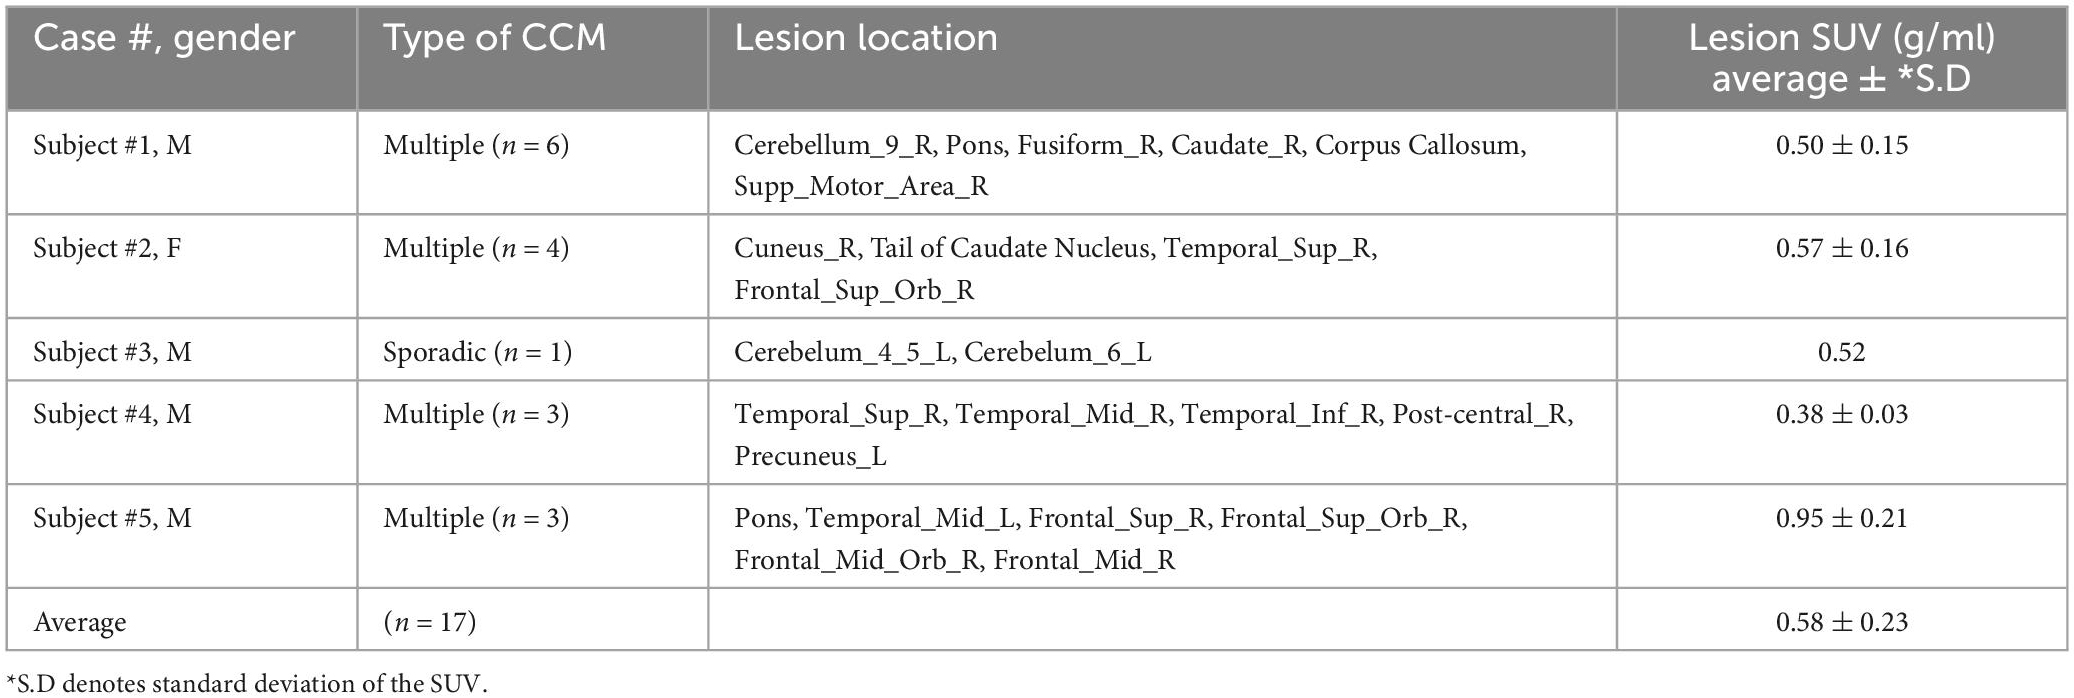
Table 3. Each CCM subject’s lesion type, CCM location, flutriciclamide uptake, and SUVs.
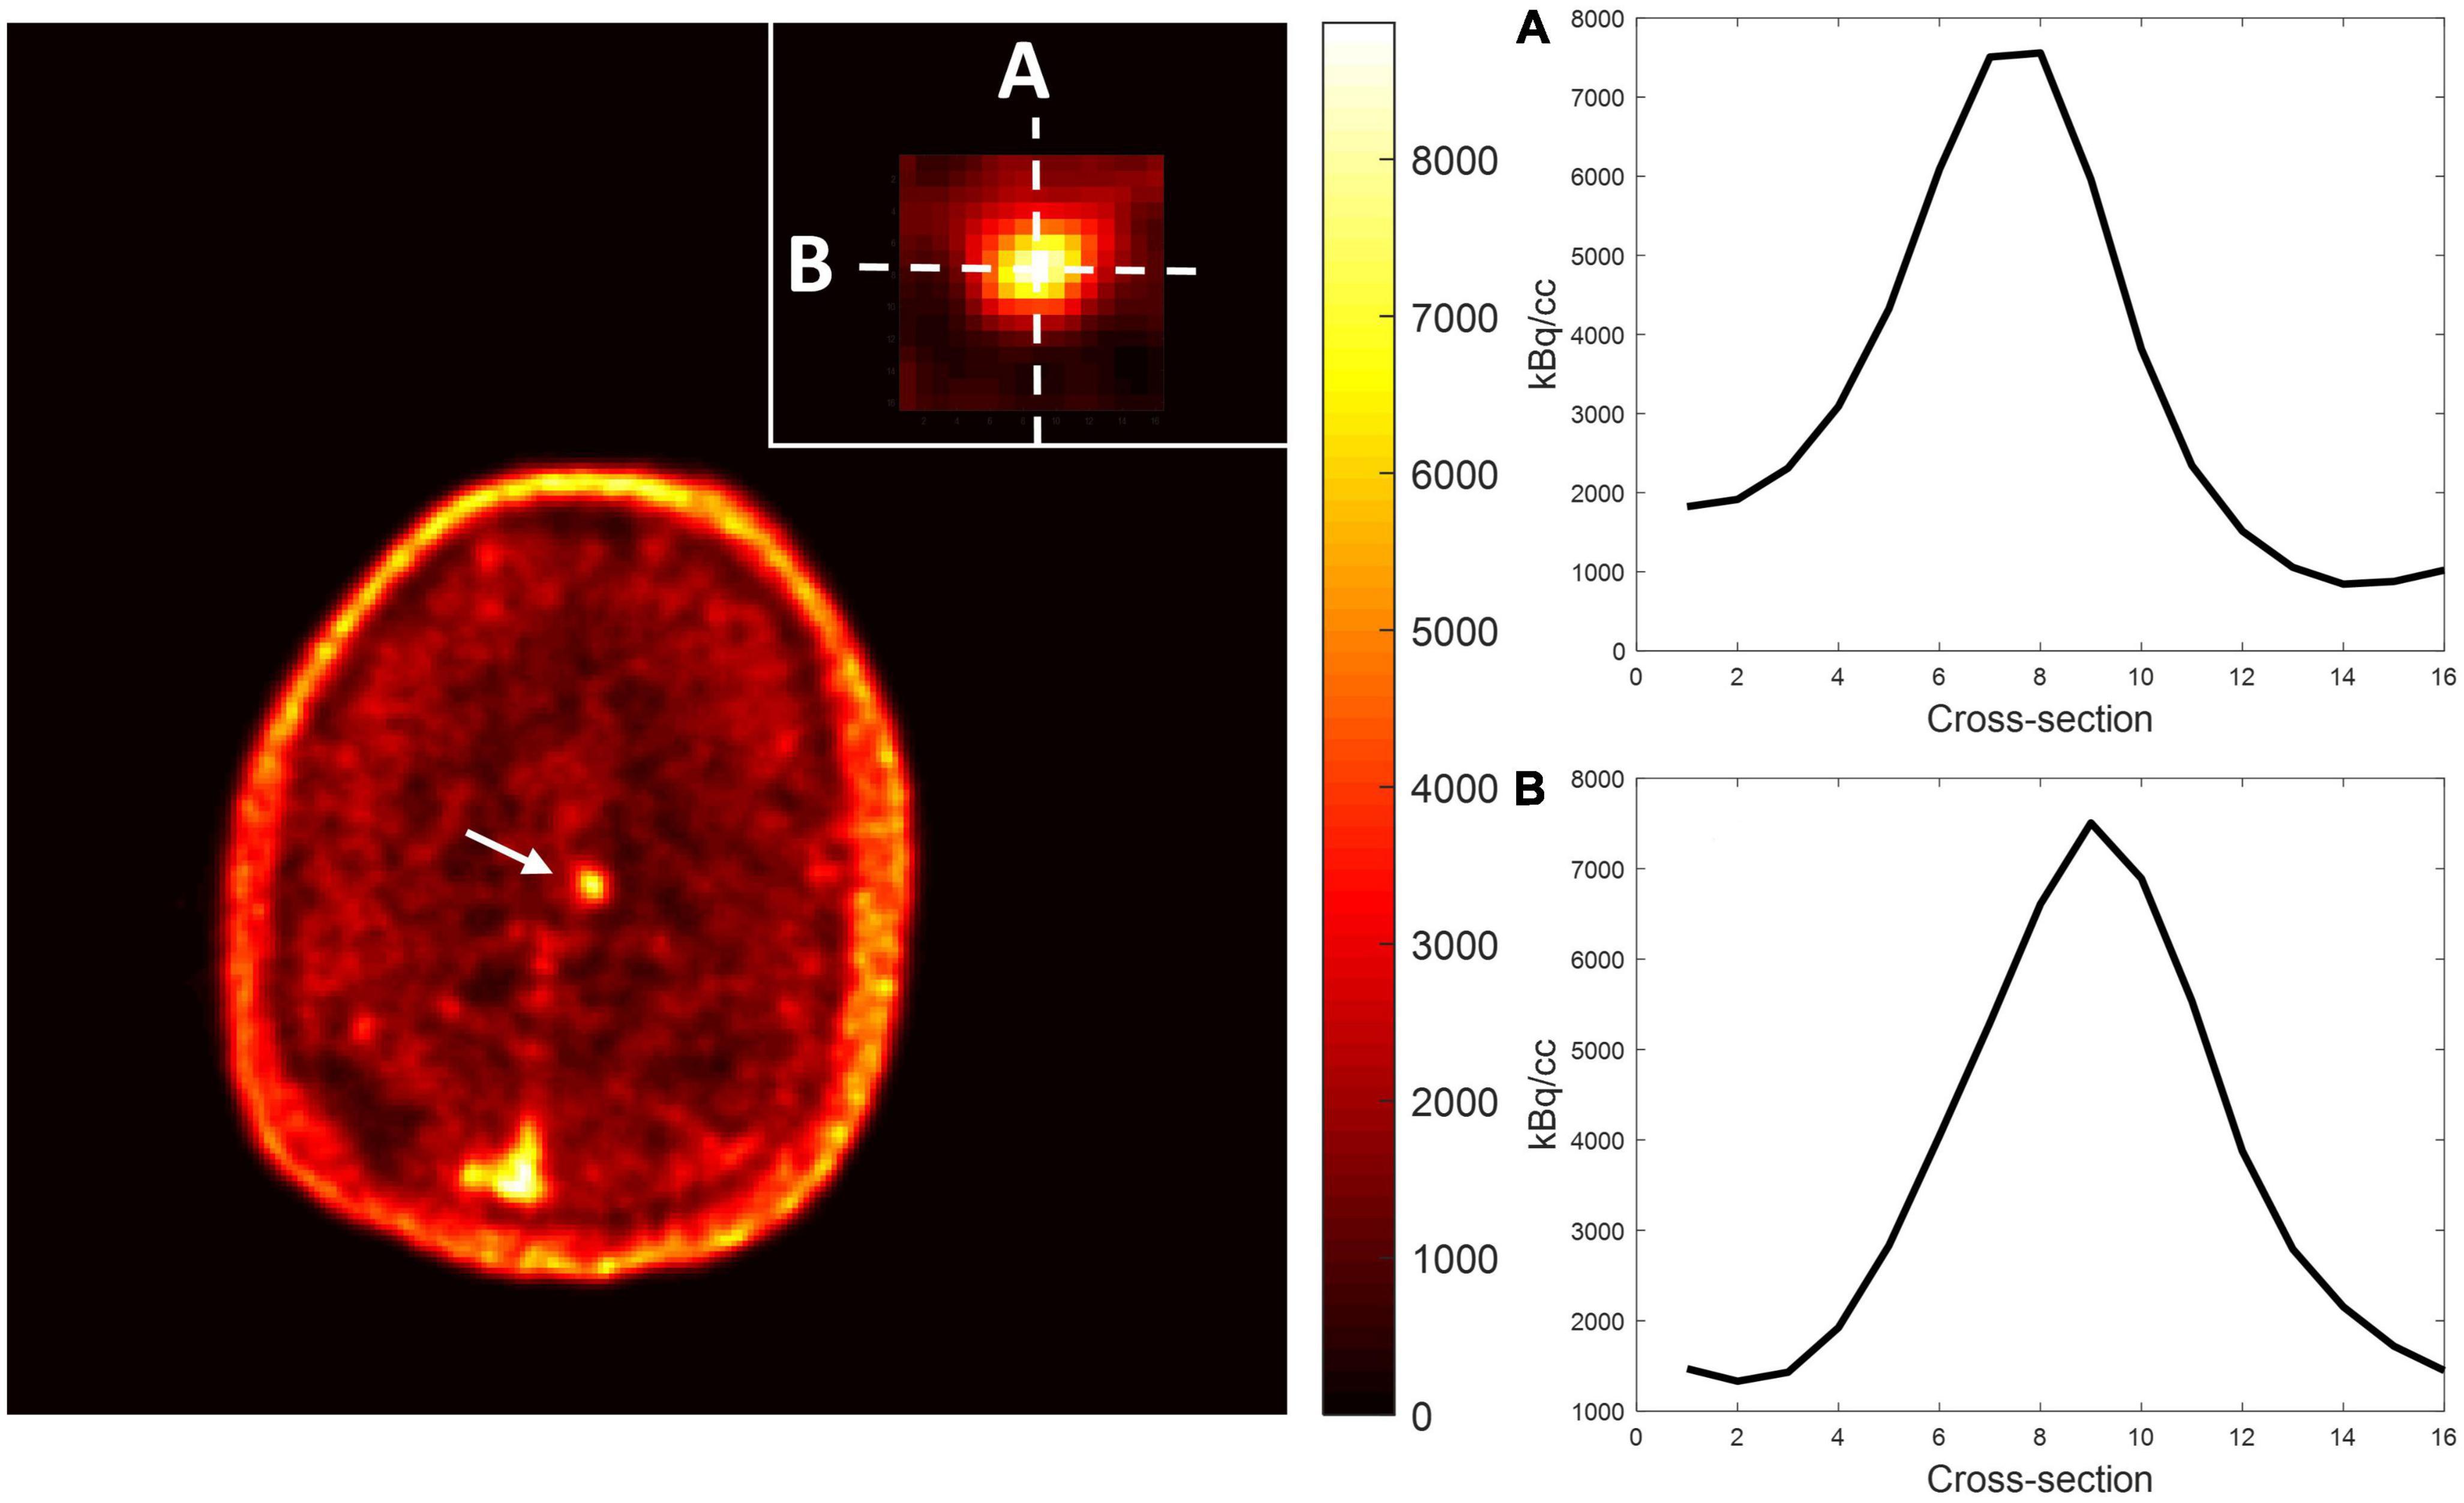
Figure 3. Representative image contrast of flutriciclamide PET across the CCM lesion. Display vertical (A) and horizontal (B) cross-sections of CCM and nearby brain tissue areas.
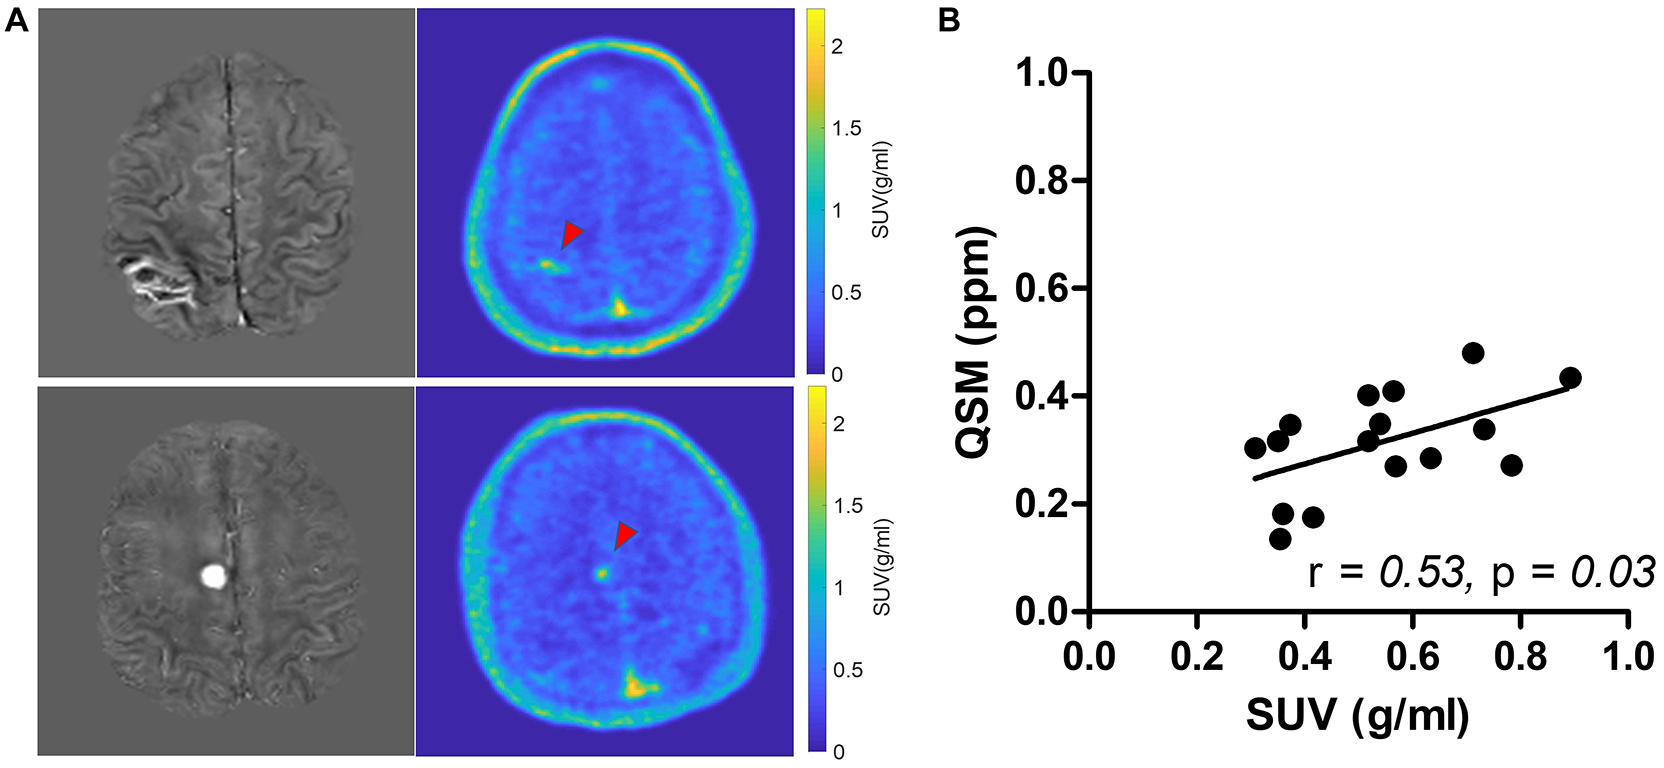
Figure 4. (A) Comparison of QSM (left) and SUV map of flutriciclamide (right) of two representative cerebral cavernous malformations (CCM) cases. The red arrow points at the CCM lesion in the brain. (B) Correlation of flutriciclamide SUV and QSM in CCM lesion.
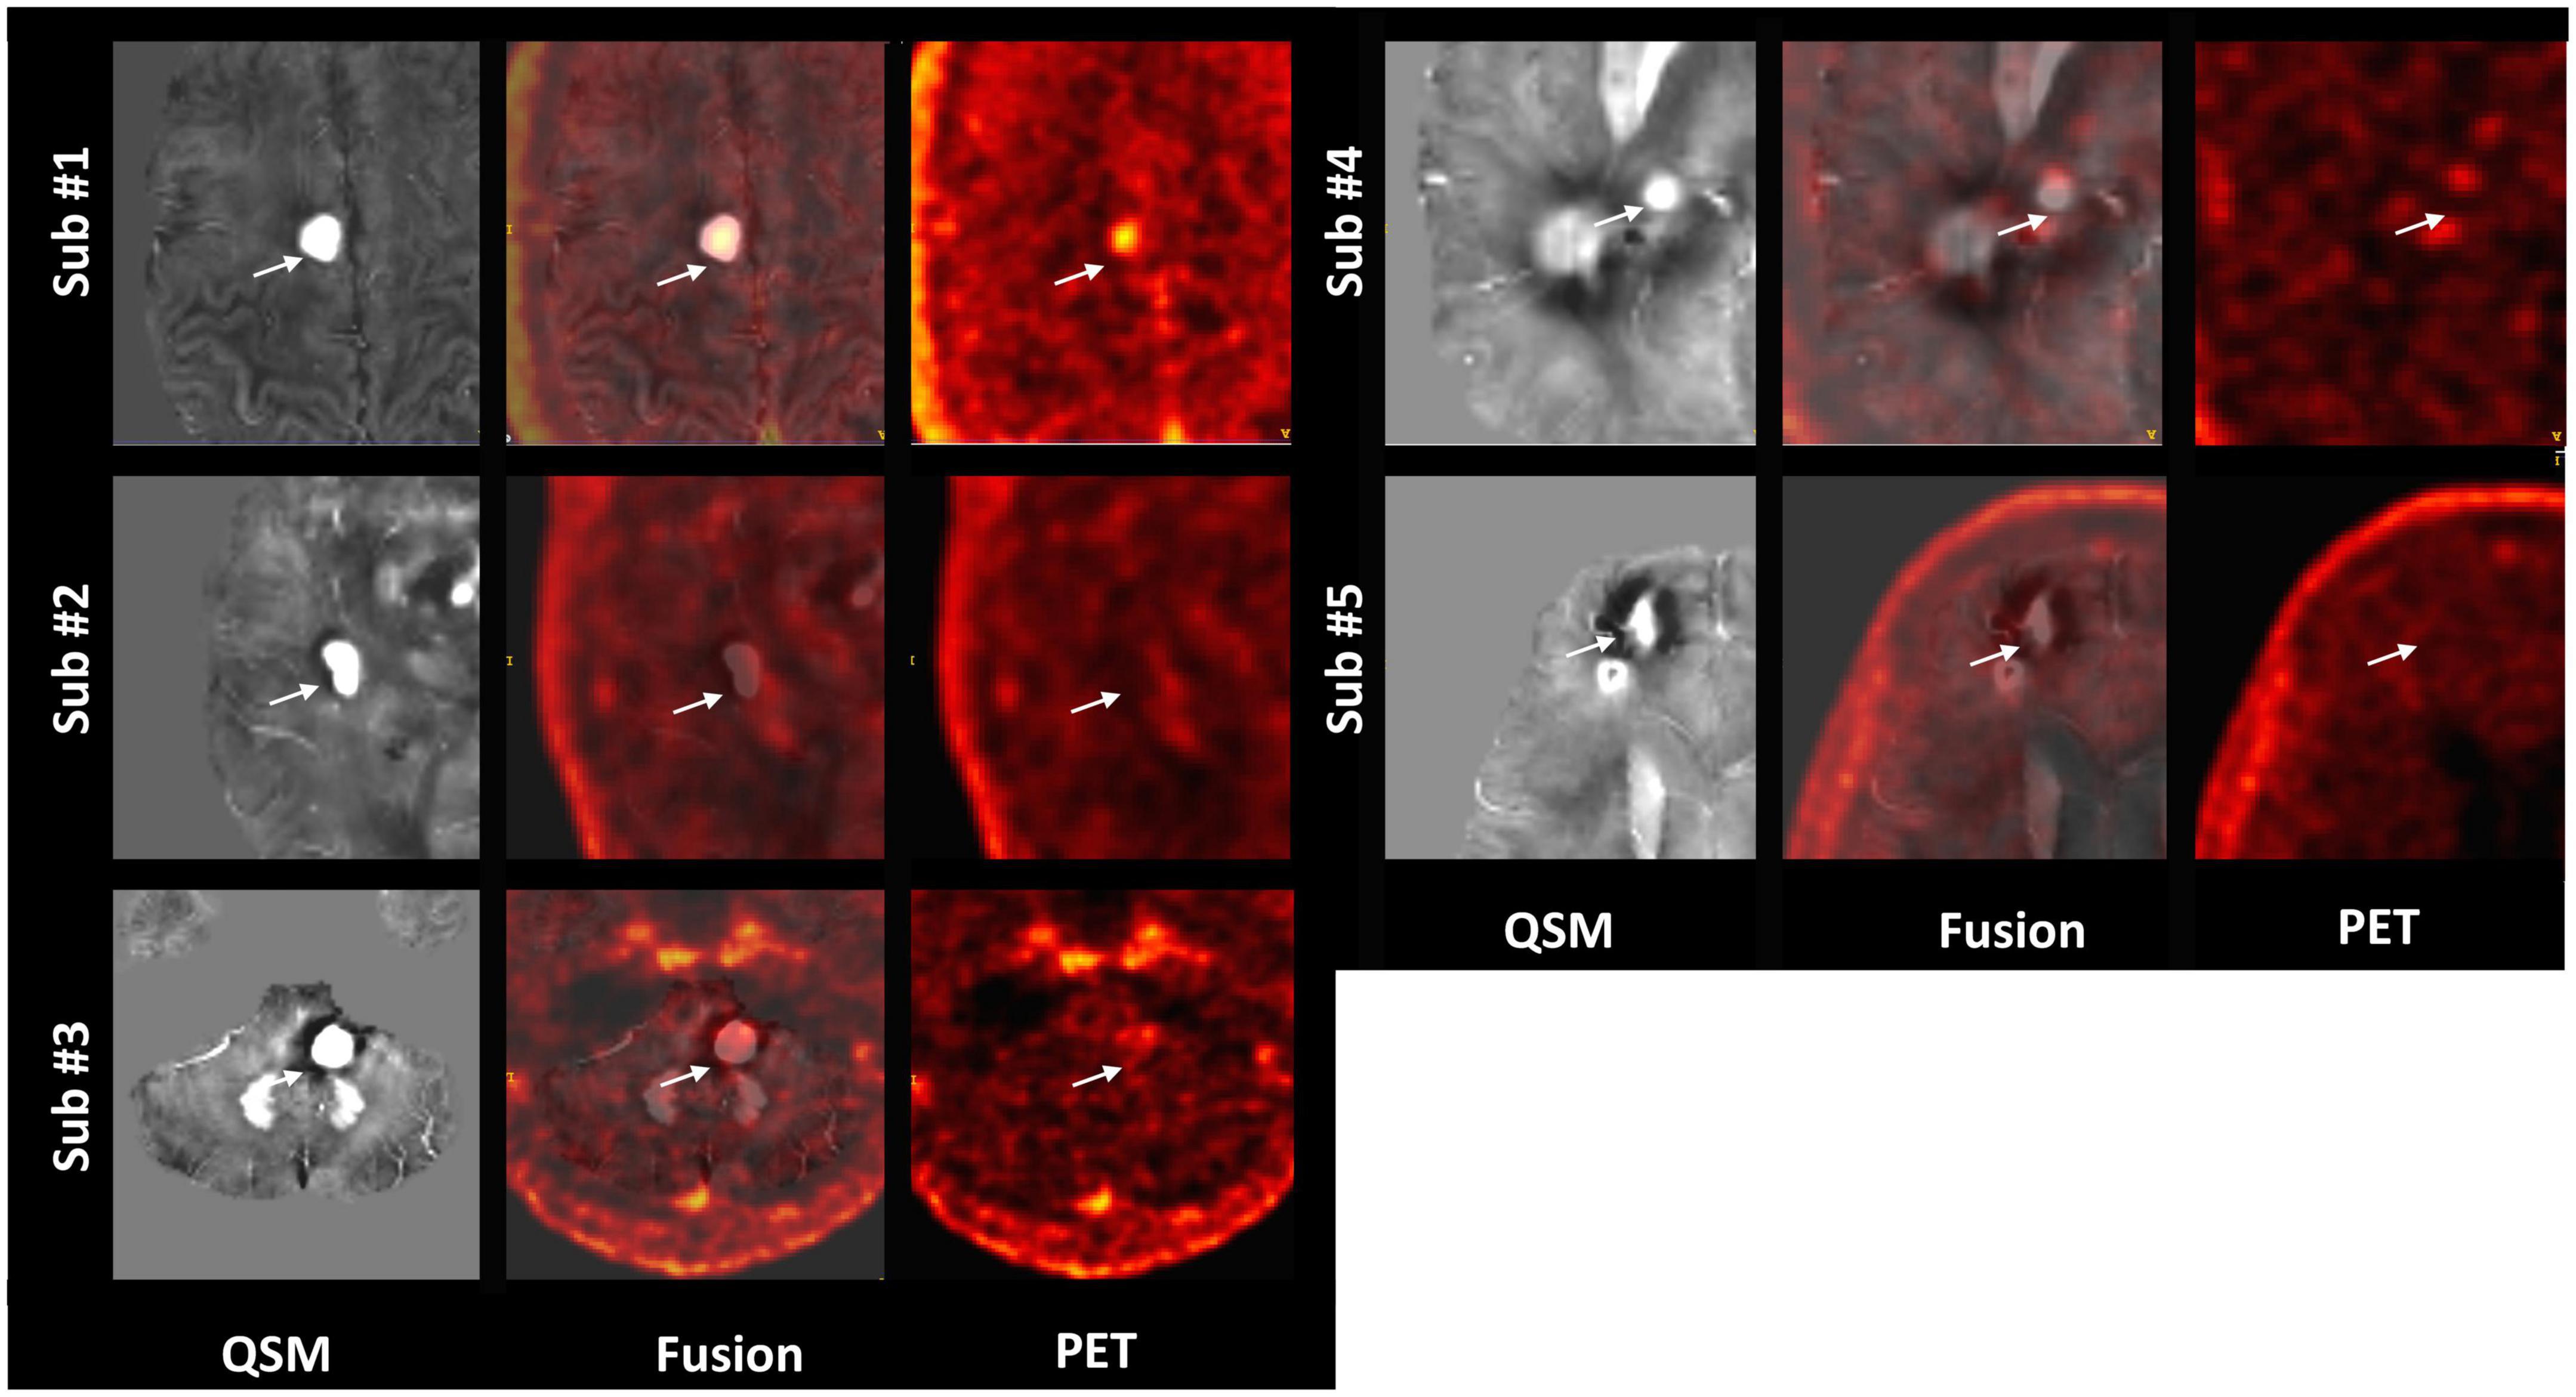
Figure 5. Representative QSM and matched flutriciclamide PET images demonstrate the heterogeneity of the CCM lesions for all CCM patients. The white arrow is pointing to the location of the CCM.
Discussion
Our study aimed to explore neuroinflammation using multimodal TSPO PET/MRI imaging for flutriciclamide quantification in cases with cerebral cavernous malformations. Flutriciclamide uptake indicates the level of neuroinflammation of a particular brain region. Neuroinflammation in the physiology and clinical course of CCM disease has been reported in recent years (1, 2, 57). A CCM-associated proinflammatory cytokine, IL-1 β, was reported to increase endothelial permeability, promoting leukocyte transmigration and resulting in imminent symptomatic lesional bleeding in the brain (58). In addition, the highly inflammatory state was associated with seizure activity, more than one hemorrhagic event, and a higher rate of new CCM formation and lesion growth (2). Therefore, neuroinflammation quantification is promising for diagnosing the risk of CCM rupture and screening patients for brain surgery non-invasively. Our approach fully incorporated the merits of PET/MRI in not only delineating CCM lesion location but also quantifying both neuroinflammation and iron deposition simultaneously. Iron deposition from QSM indicates hemoglobin concentrations in the region, and a threshold increase of 6% or more in QSM has been shown to reflect new symptomatic hemorrhage in previously stable lesions (59). QSM has thus been proposed as a monitoring biomarker for CCM (60). However, neuroinflammation also plays an important role in CCM pathogenesis and severity, with immune cell infiltration (B-lymphocytes and plasma cells) in CCM lesions and abnormally high levels of inflammatory cytokines and immunoglobulins expressed both in tissue and blood of CCM patients (9). Patients with a high inflammatory state based on 4 plasma inflammatory markers had a higher rate of new hemorrhage, lesion growth, or new lesion formation during prospective follow-up (2). Thus, these two imaging indicators, namely, iron deposition and neuroinflammation, may prove useful for identifying lesions at higher risk for rupture. To our knowledge, this is the first study examining the characteristics of flutriciclamide and its applicability for CCM.
We observed that flutriciclamide is a CCM lesion-specific indicator reflecting neuroinflammation in CCMs. The SUVs in various normal brain regions exhibited a range comparable to those reported in other flutriciclamide studies (46). Flutriciclamide uptake was only visible in CCM lesions for the CCM group, and a heterogeneous distribution was observed within lesions (Figures 4A, 5). The SUVs of all lesions were higher than those of normal brain tissue. Although it remains unclear what the most appropriate reference region is for flutriciclamide (31), we chose the striatum as a pseudo-reference region because of its relatively low-TSPO uptake.
Among the multiple MR images we obtained, QSM was the superior imaging technique for delineating CCM lesions (Figure 2). Our results aligned with those of previous studies (3, 21, 61), further substantiating QSM as an important surrogate marker for evaluating lesions in patients with CCM. Both neuroinflammation and iron deposition were observed simultaneously within CCM lesions, resulting in a moderate but significant correlation between these parameters. This suggests that ruptured CCM vasculature results in inflammation. As seen in Figures 4A, 5, the fact that respective distributions of neuroinflammation and iron deposition are spatially distinct, suggests that they provide separate but complementary information for future studies in CCM.
This study has several limitations. First, the small sample size precluded our ability to adequately compare regional differences in tracer uptake between groups. Although a few individual patients with CCM had increased uptake in the temporal pole, paracentral lobule, SMA, and hippocampus, compared to the control group, no definitive conclusions could be made. The small sample size also prevented adjustments or additional subgroup analyses comparing groups categorized by sporadic or familial disease, gender, recurrence rate, year of first hemorrhage, age, or clinical symptoms. In addition, previous studies used different protocols that featured two scanning durations comparing the most similar status at around 60 min (50–60 min and 60–90 min), which is the equilibrium state period (46). Our use of patients with HIV as a control group could also be viewed as a limitation since HIV is an inflammatory disease. However, flutriciclamide did not reflect the potential risk as a neuroinflammation reservoir, possibly because TSPO binding, or expression is disease-specific (18). Despite these limitations, this study still provided evidence that warrants future studies with this tracer in a larger population of patients with CCM.
In conclusion, flutriciclamide, a TSPO imaging tracer, is a potential marker of neuroinflammation in CCM and may detect CCM lesions with adequate contrast. When combined with QSM for lesion delineation, complementary information is obtained spatially, demonstrating lesion heterogeneity. This combined TSPO PET/MRI scanning approach could be used for longitudinal monitoring of disease progression and evaluating the effectiveness of potential drug therapies in future clinical trials.
Data availability statement
The volunteer datasets generated for this study are available upon request to the corresponding author.
Ethics statement
The studies involving human participants were reviewed and approved by the University of California, San Francisco (UCSF) IRB. The patients/participants provided their written informed consent to participate in this study. All procedures performed in studies involving human participants were in accordance with the ethical standards of the local Institutional Review Board (IRB) and with the 1964 Helsinki Declaration and its later amendments or comparable ethical standards.
Author contributions
SK: data analysis, concept, design of study, and manuscript writing. JL: design of study, contribution to a specific section of the manuscript, and proofreading. YC: data generation. MP: concept and data acquisition. HV: tracer production and proofreading. JN: data acquisition. HK: concept, design of study, data acquisition, and proofreading. YS: concept, design of study, and proofreading. All authors contributed to the article and approved the submitted version.
Funding
The authors would like to acknowledge funding from the following sources: National Institutes of Health (NIH) R01 NS034949 and U54 NS065705, UCSF Research Evaluation and Allocation Committee (REAC) Funding, UCSF Research Allocation Program (RAP) Funding (2014919), and the American Foundation for AIDS Research (amfAR) 109301-59-RSRL.
Conflict of interest
JL has research funding from GE HealthCare.
The remaining authors declare that the research was conducted in the absence of any commercial or financial relationships that could be construed as a potential conflict of interest.
Publisher’s note
All claims expressed in this article are solely those of the authors and do not necessarily represent those of their affiliated organizations, or those of the publisher, the editors and the reviewers. Any product that may be evaluated in this article, or claim that may be made by its manufacturer, is not guaranteed or endorsed by the publisher.
References
1. Retta S, Glading A. Oxidative stress and inflammation in cerebral cavernous malformation disease pathogenesis: two sides of the same coin. Int J Biochem Cell Biol. (2016) 81:254–70. doi: 10.1016/j.biocel.2016.09.011
2. Girard R, Zeineddine H, Fam M, Mayampurath A, Cao Y, Shi C, et al. Plasma biomarkers of inflammation reflect seizures and hemorrhagic activity of cerebral cavernous malformations. Transl Stroke Res. (2018) 9:34–43. doi: 10.1007/s12975-017-0561-3
3. Al-Shahi Salman R, Hall J, Horne M, Moultrie F, Josephson C, Bhattacharya J, et al. Untreated clinical course of cerebral cavernous malformations: a prospective, population-based cohort study. Lancet Neurol. (2012) 11:217–24. doi: 10.1016/S1474-4422(12)70004-2
4. Al-Shahi Salman R, Berg M, Morrison L, Awad I. Hemorrhage from cavernous malformations of the brain: definition and reporting standards. Angioma alliance scientific advisory board. Stroke. (2008) 39:3222–30. doi: 10.1161/STROKEAHA.108.515544
5. Zafar A, Quadri S, Farooqui M, Ikram A, Robinson M, Hart B, et al. Familial cerebral cavernous malformations. Stroke. (2019) 50:1294–301. doi: 10.1161/STROKEAHA.118.022314
6. Bubenikova A, Skalicky P, Benes V Jr, Benes V Sr, Bradac O. Overview of cerebral cavernous malformations: comparison of treatment approaches. J Neurol Neurosurg Psychiatry. (2022) 93:475–80. doi: 10.1136/jnnp-2021-328658
7. McDonald D, Shi C, Shenkar R, Gallione C, Akers A, Li S, et al. Lesions from patients with sporadic cerebral cavernous malformations harbor somatic mutations in the CCM genes: evidence for a common biochemical pathway for CCM pathogenesis. Hum Mol Genet. (2014) 23:4357–70. doi: 10.1093/hmg/ddu153
8. Koskimäki J, Zhang D, Li Y, Saadat L, Moore T, Lightle R, et al. Transcriptome clarifies mechanisms of lesion genesis versus progression in models of Ccm3 cerebral cavernous malformations. Acta Neuropathol Commun. (2019) 7:132. doi: 10.1186/s40478-019-0789-0
9. Castro C, Oyamada H, Cafasso M, Lopes L, Monteiro C, Sacramento P, et al. Elevated proportion of TLR2- and TLR4-expressing Th17-like cells and activated memory B cells was associated with clinical activity of cerebral cavernous malformations. J Neuroinflammation. (2022) 19:28. doi: 10.1186/s12974-022-02385-2
10. Shi C, Shenkar R, Du H, Duckworth E, Raja H, Batjer H, et al. Immune response in human cerebral cavernous malformations. Stroke. (2009) 40:1659–65. doi: 10.1161/STROKEAHA.108.538769
11. Shi C, Shenkar R, Batjer H, Check I, Awad I. Oligoclonal immune response in cerebral cavernous malformations. Laboratory investigation. J Neurosurg. (2007) 107:1023–6. doi: 10.3171/JNS-07/11/1023
12. Shenkar R, Shi C, Check I, Lipton H, Awad I. Concepts and hypotheses: inflammatory hypothesis in the pathogenesis of cerebral cavernous malformations. Neurosurgery. (2007) 61:693–703. doi: 10.1227/01.NEU.0000298897.38979.07
13. Chen Y, Zhu W, Bollen A, Lawton M, Barbaro N, Dowd C, et al. Evidence for inflammatory cell involvement in brain arteriovenous malformations. Neurosurgery. (2008) 62:1340–50. doi: 10.1227/01.neu.0000333306.64683.b5
14. Plummer N, Gallione C, Srinivasan S, Zawistowski J, Louis D, Marchuk D. Loss of p53 sensitizes mice with a mutation in Ccm1 (KRIT1) to development of cerebral vascular malformations. Am J Pathol. (2004) 165:1509–18. doi: 10.1016/S0002-9440(10)63409-8
15. Venneti S, Lopresti B, Wiley C. The peripheral benzodiazepine receptor (Translocator protein 18kDa) in microglia: from pathology to imaging. Prog Neurobiol. (2006) 80:308–22. doi: 10.1016/j.pneurobio.2006.10.002
16. Papadopoulos V, Baraldi M, Guilarte T, Knudsen T, Lacapère J, Lindermann P, et al. Translocator protein (18kDa): new nomenclature for the peripheral-type benzodiazepine receptor based on its structure and molecular function. Trends Pharmacol Sci. (2006) 27:402–9. doi: 10.1016/j.tips.2006.06.005
17. Rupprecht R, Papadopoulos V, Rammes G, Baghai T, Fan J, Akula N, et al. Translocator protein (18 kDa) (TSPO) as a therapeutic target for neurological and psychiatric disorders. Nat Rev Drug Discov. (2010) 9:971–88. doi: 10.1038/nrd3295
18. Notter T, Coughlin J, Gschwind T, Weber-Stadlbauer U, Wang Y, Kassiou M, et al. Translational evaluation of translocator protein as a marker of neuroinflammation in schizophrenia. Mol Psychiatry. (2018) 23:323–34. doi: 10.1038/mp.2016.248
19. Chen M, Guilarte T. Translocator protein 18 kDa (TSPO): molecular sensor of brain injury and repair. Pharmacol Ther. (2008) 118:1–17. doi: 10.1016/j.pharmthera.2007.12.004
20. Hafizi S, Guma E, Koppel A, Da Silva T, Kiang M, Houle S, et al. TSPO expression and brain structure in the psychosis spectrum. Brain Behav Immun. (2018) 74:79–85. doi: 10.1016/j.bbi.2018.06.009
21. Owen D, Matthews P. Imaging brain microglial activation using positron emission tomography and translocator protein-specific radioligands. Int Rev Neurobiol. (2011) 101:19–39. doi: 10.1016/B978-0-12-387718-5.00002-X
22. Turkheimer F, Rizzo G, Bloomfield P, Howes O, Zanotti-Fregonara P, Bertoldo A, et al. The methodology of TSPO imaging with positron emission tomography. Biochem Soc Trans. (2015) 43:586–92. doi: 10.1042/BST20150058
23. Vivash L, O’Brien T. Imaging microglial activation with TSPO PET: lighting up neurologic diseases? J Nucl Med. (2016) 57:165–8. doi: 10.2967/jnumed.114.141713
24. Albert N, Unterrainer M, Fleischmann D, Lindner S, Vettermann F, Brunegraf A, et al. TSPO PET for glioma imaging using the novel ligand 18F-GE-180: first results in patients with glioblastoma. Eur J Nucl Med Mol Imaging. (2017) 44:2230–8. doi: 10.1007/s00259-017-3799-9
25. Wadsworth H, Jones P, Chau W, Durrant C, Fouladi N, Passmore J, et al. [18F]GE-180: a novel fluorine-18 labelled PET tracer for imaging Translocator protein 18 kDa (TSPO). Bioorg Med Chem Lett. (2012) 22:1308–13. doi: 10.1016/j.bmcl.2011.12.084
26. Zatcepin A, Heindl S, Schillinger U, Kaiser L, Lindner S, Bartenstein P, et al. Reduced acquisition time [18F]GE-180 PET scanning protocol replaces gold-standard dynamic acquisition in a mouse ischemic stroke model. Front Med. (2022) 9:830020. doi: 10.3389/fmed.2022.830020
27. Mahler C, Schumacher A, Unterrainer M, Kaiser L, Höllbacher T, Lindner S, et al. TSPO PET imaging of natalizumab-associated progressive multifocal leukoencephalopathy. Brain. (2021) 144:2683–95. doi: 10.1093/brain/awab127
28. Brendel M, Probst F, Jaworska A, Overhoff F, Korzhova V, Albert N, et al. Glial activation and glucose metabolism in a transgenic amyloid mouse model: a triple-tracer PET study. J Nucl Med. (2016) 57:954–60. doi: 10.2967/jnumed.115.167858
29. Unterrainer M, Mahler C, Vomacka L, Lindner S, Havla J, Brendel M, et al. TSPO PET with [18F]GE-180 sensitively detects focal neuroinflammation in patients with relapsing-remitting multiple sclerosis. Eur J Nucl Med Mol Imaging. (2018) 45:1423–31. doi: 10.1007/s00259-018-3974-7
30. Fan Z, Calsolaro V, Atkinson R, Femminella G, Waldman A, Buckley C, et al. Flutriciclamide (18F-GE180) PET: first-in-human PET study of novel third-generation in vivo marker of human translocator protein. J Nucl Med. (2016) 57:1753–9. doi: 10.2967/jnumed.115.169078
31. Sridharan S, Raffel J, Nandoskar A, Record C, Brooks D, Owen D, et al. Confirmation of specific binding of the 18-kDa translocator protein (TSPO) radioligand [18F]GE-180: a blocking study using XBD173 in multiple sclerosis normal appearing white and grey matter. Mol Imaging Biol. (2019) 21:935–44. doi: 10.1007/s11307-019-01323-8
32. Owen D, Yeo A, Gunn R, Song K, Wadsworth G, Lewis A, et al. An 18-kDa translocator protein (TSPO) polymorphism explains differences in binding affinity of the PET radioligand PBR28. J Cereb Blood Flow Metab. (2012) 32:1–5. doi: 10.1038/jcbfm.2011.147
33. Vomacka L, Albert N, Lindner S, Unterrainer M, Mahler C, Brendel M, et al. TSPO imaging using the novel PET ligand [18F]GE-180: quantification approaches in patients with multiple sclerosis. EJNMMI Res. (2017) 7:89. doi: 10.1186/s13550-017-0340-x
34. Unterrainer M, Fleischmann D, Lindner S, Brendel M, Rupprecht R, Tonn J, et al. Detectionof cerebrospinal fluid dissemination of recurrent glioblastoma using TSPO-PET with 18F-GE-180. Clin Nucl Med. (2018) 43:518–9. doi: 10.1097/RLU.0000000000002113
35. Beyer L, Brendel M, Rohrer G, Sonnenfeld S, Nuebling G, Lindner S, et al. Translocator protein 18kDa (TSPO) expression in patients with clinically diagnosed progressive supranuclear palsy. J Nucl Med. (2018) 59:1700.
36. Schöberl F, Levin J, Remi J, Goldschagg N, Eren O, Okamura N, et al. IgLON5: a case with predominant cerebellar tau deposits and leptomeningeal inflammation. Neurology. (2018) 91:180–2. doi: 10.1212/WNL.0000000000005859
37. Mahler C, Unterrainer M, Muth C, Egensperger R, Vomacka L, Lindner S, et al. Imaging microglial activation in tacrolimusassociated CNS vasculitis with translocator protein PET. Neurology. (2018) 91:936–7. doi: 10.1212/WNL.0000000000006516
38. Zwergal A, Günther L, Brendel M, Beck R, Lindner S, Xiong G, et al. In vivo imaging of glial activation after unilateral labyrinthectomy in the rat: a [18F]GE180-PET study. Front Neurol. (2017) 8:665. doi: 10.3389/fneur.2017.00665
39. Bartos L, Kirchleitner S, Blobner J, Wind K, Kunze L, Holzgreve A, et al. 18 kDa translocator protein positron emission tomography facilitates early and robust tumor detection in the immunocompetent SB28 glioblastoma mouse model. Front Med. (2022) 9:992993. doi: 10.3389/fmed.2022.992993
40. Cosenza-Nashat M, Zhao M, Suh H, Morgan J, Natividad R, Morgello S, et al. Expression of the translocator protein of 18 kDa by microglia, macrophages and astrocytes based on immunohistochemical localization in abnormal human brain. Neuropathol Appl Neurobiol. (2009) 35:306–28. doi: 10.1111/j.1365-2990.2008.01006.x
41. Dickens A, Vainio S, Marjamaki P, Johansson J, Lehtiniemi P, Rokka J, et al. Detection of microglial activation in an acute model of neuroinflammation using PET and radiotracers 11C-(R)-PK11195 and 18F-GE-180. J Nucl Med. (2014) 55:466–72. doi: 10.2967/jnumed.113.125625
42. Acosta-Cabronero J, Williams G, Cardenas-Blanco A, Arnold R, Lupson V, Nestor P. In vivo quantitative susceptibility mapping (QSM) in Alzheimer’s disease. PLoS One. (2013) 8:e81093. doi: 10.1371/journal.pone.0081093
43. Gong N, Dibb R, Bulk M, van der Weerd L, Liu C. Imaging beta amyloid aggregation and iron accumulation in Alzheimer’s disease using quantitative susceptibility mapping MRI. Neuroimage. (2019) 191:176–85. doi: 10.1016/j.neuroimage.2019.02.019
44. Thomas G, Leyland L, Schrag A, Lees A, Acosta-Cabronero J, Weil R. Brain iron deposition is linked with cognitive severity in Parkinson’s disease. J Neurol Neurosurg Psychiatry. (2020) 91:418–25. doi: 10.1136/jnnp-2019-322042
45. Wickstrøm T, Clarke A, Gausemel I, Horn E, Jørgensen K, Khan I, et al. The development of an automated and GMP compliant FASTlab™ Synthesis of [(18)F]GE-180; a radiotracer for imaging translocator protein (TSPO). J Labelled Comp Radiopharm. (2014) 57:42–8. doi: 10.1002/jlcr.3112
46. Feeney C, Scott G, Raffel J, Roberts S, Coello C, Jolly A, et al. Kinetic analysis of the translocator protein positron emission tomography ligand [18F]GE-180 in the human brain. Eur J Nucl Med Mol Imaging. (2016) 43:2201–10. doi: 10.1007/s00259-016-3444-z
47. Kinahan P, Fletcher J. Positron emission tomography-computed tomography standardized uptake values in clinical practice and assessing response to therapy. Semin Ultrasound CT MR. (2010) 31:496–505. doi: 10.1053/j.sult.2010.10.001
48. Kim J, Lee J, Kim S, Hoigebazar L, Shin K, Yu K, et al. Compartmental modeling and simplified quantification of [11C]sertraline distribution in human brain. Arch Pharm Res. (2012) 35:1591–7. doi: 10.1007/s12272-012-0910-4
49. Beatty P, Chang S, Holmes J, Wang K, Brau A, Reeder S, et al. Design of k-space channel combination kernels and integration with parallel imaging. Magn Reson Med. (2014) 71:2139–54. doi: 10.1002/mrm.24883
50. Eckstein K, Dymerska B, Bachrata B, Bogner W, Poljanc K, Tratnig S, et al. Computationally efficient combination of multi-channel phase data from multi-echo acquisitions (ASPIRE). Magn Reson Med. (2018) 79:2996–3006. doi: 10.1002/mrm.26963
51. Jenkinson M, Beckmann C, Behrens T, Woolrich M, Smith S. FSL. Neuroimage. (2012) 62:782–90. doi: 10.1016/j.neuroimage.2011.09.015
52. Li W, Wu B, Liu C. Quantitative susceptibility mapping of human brain reflects spatial variation in tissue composition. NeuroImage. (2011) 55:1645–56. doi: 10.1016/j.neuroimage.2010.11.088
53. Schweser F, Deistung A, Lehr B, Reichenbach J. Quantitative imaging of intrinsic magnetic tissue properties using MRI signal phase: an approach to in vivo brain iron metabolism? Neuroimage. (2011) 54:2789–807. doi: 10.1016/j.neuroimage.2010.10.070
54. Wu B, Li W, Avram A, Gho S, Liu C. Fast and tissue-optimized mapping of magnetic susceptibility and T2* with multi-echo and multi-shot spirals. Neuroimage. (2012) 59:297–305. doi: 10.1016/j.neuroimage.2011.07.019
55. Li W, Wang N, Yu F, Han H, Cao W, Romero R, et al. A method for estimating and removing streaking artifacts in quantitative susceptibility mapping. Neuroimage. (2015) 108:111–22. doi: 10.1016/j.neuroimage.2014.12.043
56. Reichenbach J, Schweser F, Serres B, Deistung A. Quantitative susceptibility mapping: concepts and applications. Clin Neuroradiol. (2015) 25:225–30. doi: 10.1007/s00062-015-0432-9
57. Lai C, Nelsen B, Frias-Anaya E, Gallego-Gutierrez H, Orecchioni M, Herrera V, et al. Neuroinflammation plays a critical role in cerebral cavernous malformation disease. Circ Res. (2022) 131:909–25. doi: 10.1161/CIRCRESAHA.122.321129
58. Girard R, Zeineddine H, Koskimäki J, Fam M, Cao Y, Shi C, et al. Plasma biomarkers of inflammation and angiogenesis predict cerebral cavernous malformation symptomatic hemorrhage or lesional growth. Circ Res. (2018) 122:1716–21. doi: 10.1161/CIRCRESAHA.118.312680
59. Girard R, Fam M, Zeineddine H, Tan H, Mikati A, Shi C, et al. Vascular permeability and iron deposition biomarkers in longitudinal follow-up of cerebral cav-ernous malformations. J Neurosurg. (2017) 127:102–10. doi: 10.3171/2016.5.JNS16687
60. Zeineddine H, Girard R, Cao Y, Hobson N, Fam M, Stadnik A, et al. Quantitative susceptibility mapping as a monitoring biomarker in cerebral cavernous malformations with recent hemorrhage. J Magn Reson Imaging. (2018) 47:1133–8. doi: 10.1002/jmri.25831
Keywords: vascular malformation, CCM, PET/MRI, quantitative susceptibility mapping (QSM), flutriciclamide, GE-180, TSPO, neuroinflammation
Citation: Kim SJW, Lupo JM, Chen Y, Pampaloni MH, VanBrocklin HF, Narvid J, Kim H and Seo Y (2023) A feasibility study for quantitative assessment of cerebrovascular malformations using flutriciclamide ([18F]GE-180) PET/MRI. Front. Med. 10:1091463. doi: 10.3389/fmed.2023.1091463
Received: 07 November 2022; Accepted: 14 March 2023;
Published: 05 April 2023.
Edited by:
Domenico Albano, University of Brescia, ItalyReviewed by:
Janine Gote-Schniering, University of Bern, SwitzerlandJaesung Peter Choi, University of Technology Sydney, Australia
Copyright © 2023 Kim, Lupo, Chen, Pampaloni, VanBrocklin, Narvid, Kim and Seo. This is an open-access article distributed under the terms of the Creative Commons Attribution License (CC BY). The use, distribution or reproduction in other forums is permitted, provided the original author(s) and the copyright owner(s) are credited and that the original publication in this journal is cited, in accordance with accepted academic practice. No use, distribution or reproduction is permitted which does not comply with these terms.
*Correspondence: Sally Ji Who Kim, c2tpbTEzNEBtZ2guaGFydmFyZC5lZHU=
†Present address: Sally Ji Who Kim, UCSF Physics Research Laboratory, Department of Radiology and Biomedical Imaging, University of California, San Francisco, San Francisco, CA, United States