 Johnatan Torres-Torres1,2†
 Salvador Espino-y-Sosa1,2†
 Jose Rafael Villafan-Bernal2,3
 Luis Enrique Orozco-Guzman1
 Juan Mario Solis-Paredes1
 Guadalupe Estrada-Gutierrez1
 Romeo Adalid Martinez-Cisneros4
 Paloma Mateu-Rogell1,2
 Sandra Acevedo-Gallegos1
 Raigam Jafet Martinez-Portilla1,2*
- 1Clinical Research Branch, Instituto Nacional de Perinatología Isidro Espinosa de los Reyes, Mexico City, Mexico
- 2Iberoamerican Research Network in Obstetrics, Gynecology, and Translational Medicine, Mexico City, Mexico
- 3Laboratory of Immunogenomics and Metabolic Diseases, Instituto Nacional de Medicina Genómica (INMEGEN), Mexico City, Mexico
- 4Servicios de Salud Pública de La Ciudad de México, Mexico City, Mexico
Objective: To identify and quantify the effects of maternal characteristics and medical history on the distribution of Placental Growth Factor (PlGF), mean arterial pressure (MAP), and Uterine Artery Mean Pulsatility Index (UtA-PI); and to standardize the expected values for these biomarkers in the first trimester to create unique multiples of the median (MoMs) for Latin-American population.
Methods: This is a prospective cohort built exclusively for research purposes of consecutive pregnant women attending their first-trimester screening ultrasound at a primary care center for the general population in Mexico City between April 2019 and October 2021. We excluded fetuses with chromosomal abnormalities, major fetal malformations, and women delivering in another care center. Linear regression was used on log-transformed biomarkers to assess the influence of maternal characteristics on non-preeclamptic women to create MoM.
Results: Of a total of 2,820 pregnant women included in the final analysis, 118 (4.18%) developed PE, of which 22 (0.78%) delivered before 34 weeks of gestation, 74 (2.62%) before 37 weeks, and 44 (1.56%) from 37 weeks gestation. Characteristics that significantly influenced PLGF were fetal crown rump length (CRL), maternal age, nulliparity, body mass index (BMI), chronic hypertension, Lupus, spontaneous pregnancy, polycystic ovary syndrome (PCOS), hypothyroidism, preeclampsia (PE) in a previous pregnancy, and mother with PE. MAP had significant influence from CRL, maternal age, PE in a previous pregnancy, induction of ovulation, a mother with PE, chronic hypertension, BMI, and hypothyroidism. UtA-PI was influenced by CRL, maternal age, a mother with PE, chronic hypertension, and gestational diabetes mellitus (GDM) in a previous pregnancy.
Conclusion: Population-specific multiples of the median (MoMs) for PlGF, MAP, and UtA-PI in the first trimester adequately discriminate among women developing preeclampsia later in pregnancy.
Introduction
Preeclampsia (PE) is the result of an angiogenic disbalance (1), which remains one of the leading causes of maternal mortality and a public health challenge affecting 3–5% of all pregnancies (2, 3). Despite the huge amount of research regarding the prevention of preeclampsia, multivariate models have not been implemented worldwide, and Aspirin has not been adopted as a standard of care for all women at higher risk, especially in developing countries. Several prediction models have been created for the selection of patients at risk, achieving up to 82% of detection rate (4, 5). The most used models are the one from the Fetal Medicine Foundation, which uses a survival analysis called the competing risks model (6) for the prediction of women developing the diseases, while another widely known model comes from the Hospital Clinic of Barcelona that uses a Bayesian analysis under a logistic model (4). Although both models use different statistical techniques, they comprise a multiple analysis of maternal history and biomarkers such as uterine artery Doppler (UtA), placental growth factor (PlGF), and blood pressure, which have demonstrated better detection rates compared to maternal history alone (5, 7), however, biomarkers are still far from being robust enough to adequately discriminate those women developing preeclampsia, mainly due to the lack of robust methodology in their measurement and analysis (8). The ultimate goal for the detection of women at risk of developing preeclampsia is the prevention of the disease by using Aspirin before 16 weeks which has demonstrated in randomized trials a reduction of 62% of preeclampsia before 37 weeks of gestation and 82% before 34 weeks (9). However, there have been several attempts to validate FMF’s model in different populations failing to even achieve similar detection rates (10). Most validations use the same multiple of the median (MoM) equation for the calculation of expected values for each biomarker used for risk classification, which is an equation of how the distribution of the biomarker influenced the population’s characteristics. Medical history and anthropometric features have demonstrated a significant influence on each biomarker’s distribution, and this distribution depends on the characteristics of each population. An example of this is the demonstrated increased risk of preeclampsia in patients that underwent IVF treatments in case of freezing eggs after ovarian stimulation (11). It is then logical to think that failure to achieve similar detection rates to that of the original Fetal Medicine Foundation (FMF) model may arise from the lack of original MoMs created in each population, as differences in disease prevalence and anthropometric characteristics from population to population may significantly alter the distribution of each biomarker. Therefore, we hypothesize that the maternal characteristics of our population have a unique influence on the distribution of each biomarker different from that of the original FMF model.
Thus, the objective of this study is to identify and quantify the effects of maternal characteristics and medical history on the distribution of PlGF, MAP, and UtA-PI; and to standardize the expected values for these biomarkers in the first trimester to create unique MoMs for Latin-American population.
Materials and methods
Study design and participants
This is a prospective cohort of consecutive pregnant women attending their first-trimester screening ultrasound at a primary care center for the general population in Mexico City between April 2019 and October 2021.
Criteria for inclusion were pregnant women aged 18 years or older with a singleton pregnancy recruited at their first-trimester scan. Exclusion criteria were chromosomal abnormalities, major fetal malformations, and women delivering in another care center. The cohort was built exclusively for research purposes to ensure maximum quality on data acquirement and measurement. Ultrasounds were performed by two maternal-fetal medicine specialists with an FMF certification for first-trimester screening for preeclampsia. The protocol was approved by the Ethics and Research Internal Review Board of the National Institute of Perinatology (2021-1-38) and was conducted ethically under the World Medical Association Declaration of Helsinki. All enrolled women authorized its inclusion and provided signed informed consent.
Data collection
Data was acquired from secured electronic medical records. Ultrasounds were performed at first trimester screening for chromosomal abnormalities and preeclampsia (between 11 and 13 + 6 weeks). Maternal characteristics included those required by the FMF preeclampsia screening program, such as maternal age, spontaneous pregnancy or use of assisted reproduction techniques; parity (nulliparous or parous previous), cigarette smoking, drugs addiction (cocaine or heroin), alcohol intake during pregnancy, mother with PE, history of PE in previous pregnancy, fetal growth restriction in previous pregnancy, gestational diabetes, chronic hypertension, diabetes mellitus, systemic lupus erythematosus (SLE), antiphospholipid syndrome (APS). Additional information on maternal heart disease, polycystic ovary syndrome (PCOS), and hypothyroidism were included. Anthropometric biomarkers included: height, weight, body mass index (BMI), mean arterial pressure (MAP), and mean uterine artery pulsatility index (mUtA-PI). The serum biomarker was PlGF, and the blood samples for PlGF measurements were also drawn at the first trimester ultrasound.
Gestational age was determined from the measurement of the fetal crown-rum length. MAP and UtA-PI were measured according to standardized protocols by certified maternal-fetal medicine specialists (7, 12). Maternal serum concentrations of PlGF (Elecsys PlGF, Roche®) were measured using an automated analyzer (Cobas-e411, Roche®) according to the manufacturer’s instructions.
Outcome measures
Data on pregnancy outcomes were collected from hospital records. PE was defined according to American College of Obstetricians and Gynecologists (ACOG) criteria (13): hypertension (systolic blood pressure of ≥140 mmHg or diastolic blood pressure of ≥90 mmHg) developed after 20 weeks of gestation in previously normotensive women and at least one of the following: proteinuria (≥300 mg/24 h), renal insufficiency (serum creatinine ≥1.1 mg/dL or twofold increase in serum creatinine in the absence of underlying renal disease), liver involvement (blood concentration of transaminases to twice the normal level), neurological complications (cerebral o visual symptoms), or thrombocytopenia (platelet count < 100,000 U/L). Early preeclampsia (ePE) was defined as those presented before 34 weeks of gestation, preterm preeclampsia (pPE) was defined as PE that occurred before 37 weeks of gestation, and term preeclampsia (tPE) as PE occurred after 37 weeks of gestation.
Statistical analysis
First-trimester PlGF, MAP, and mUtA-PI values were log-transformed to normalize their distribution. The expected values for non-preeclamptic women were created by assessing the influence of maternal characteristics on each log-transformed biomarker in multiple linear regression. Backward elimination was used to identify potentially important terms in the model by sequentially removing non-significant (P > 0.05) variables. The effect sizes were assessed considering the standard deviation (SD), and a criterion of 0.1 SD was used to exclude terms that lack substantive impact on model predictions. Predicted model for statistically significant variables was used as the expected values. Multiples of the median (MoM) were created by the difference between the observed and expected values for all patients. The observed MoM value was divided by the expected value based on regression analysis of the controls, normalizing each observation. We also calculated the exponential of the standardized difference between the observed concentration and the population median for the gestational age divided by his standard error. Residual analyzes were used to assess the suitability of the model. Graphical displays of the relationship between head-rump length, maternal age, biomarkers, and the effects of maternal characteristics and medical history on the PlGF MoM, MAP MoM, and UAt-PI MoM values were produced for the final model (StataCorp., 2020, Stata Statistical Software: Release 17. College Station, TX: StataCorp LLC).
Results
Description of the cohort and characteristics of the study population
A total of 3,067 pregnant women were enrolled in the original cohort, and 247 women (8.05%) were excluded due to incomplete data. Among 2,820 pregnant women included in the final analysis, 118 (4.18%) developed PE, of which 22 (0.78%) were delivered before 34 weeks of gestation (ePE), 74 (2.62%) developed pPE, and 44 (1.56%) developed tPE. Table 1 describes the characteristics of the population by outcome measures.
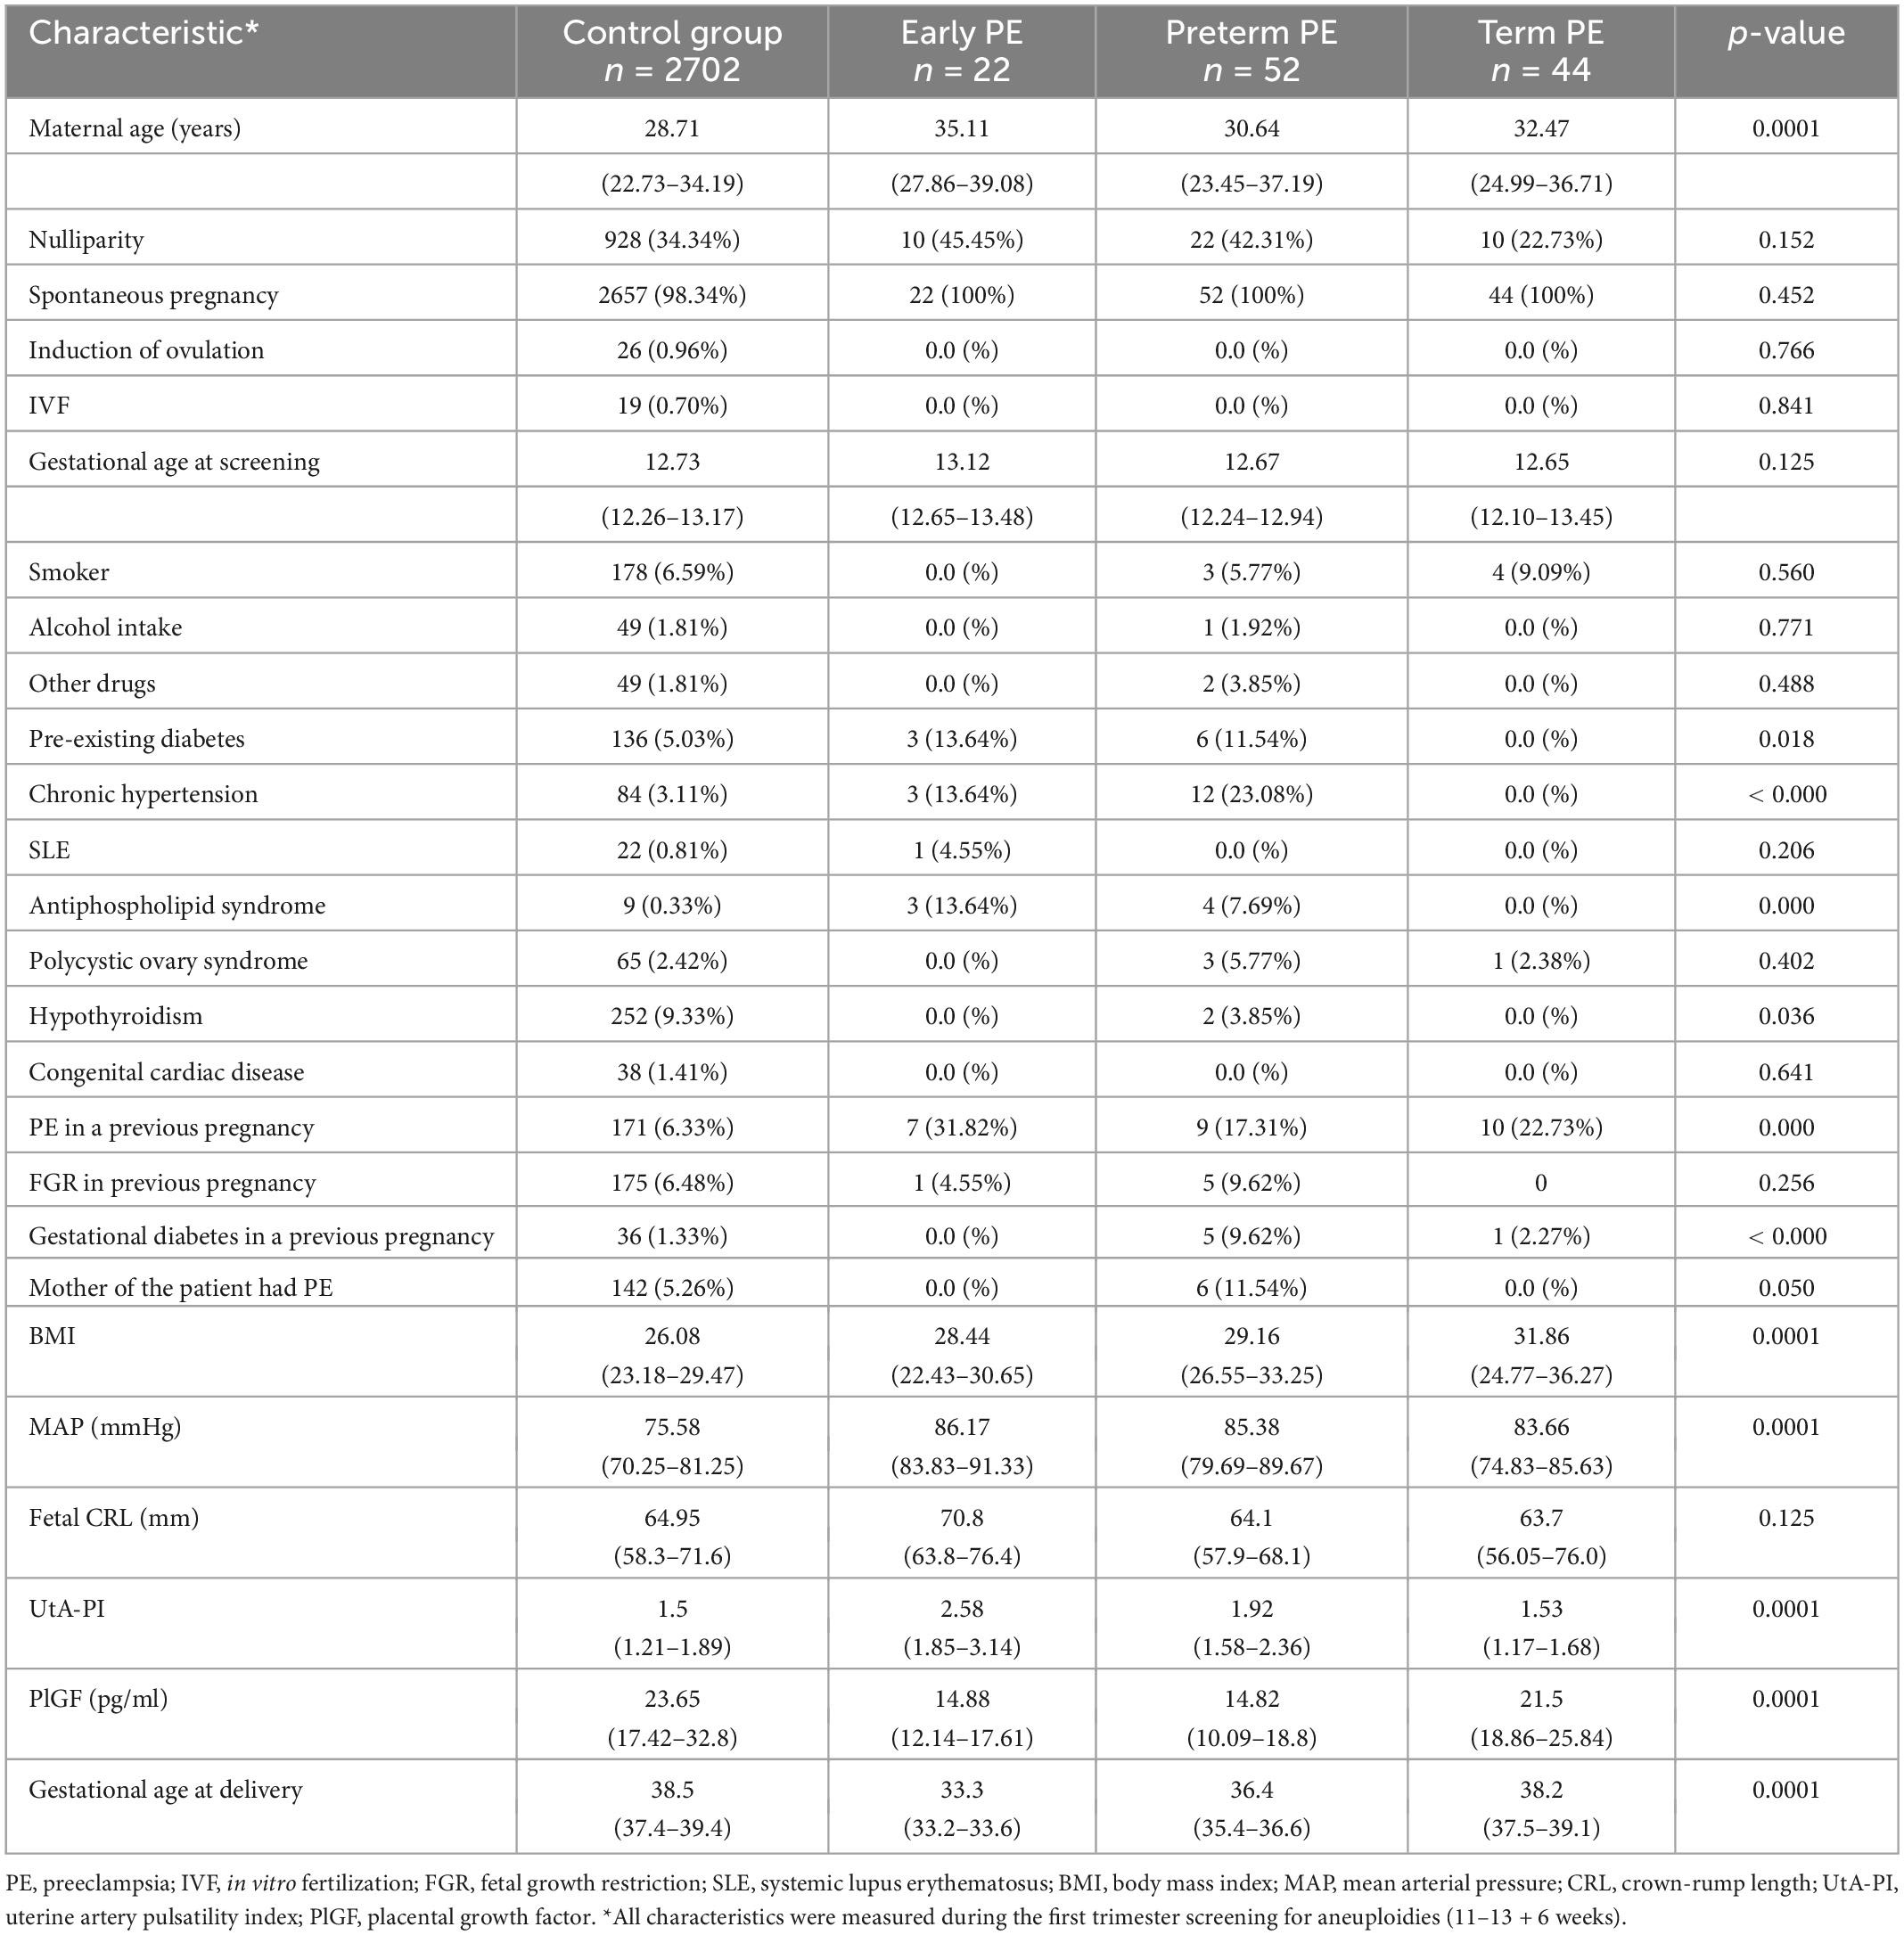
Table 1. Characteristics of the included population.
Maternal characteristics influencing first trimester biomarkers
After multiple regression analysis, independent contributions for the prediction of log10PlGF, log10MAP, and log10UAt-PI in the first trimester are shown in Table 2. The values of MoMs for PlGF, MAP, and UAt-PI are presented in Supplementary Tables 1–3 and Figure 1. Supplementary Tables 4–6 contain the values of PlGF, MAP, and UAt-PI MoM by categories of maternal characteristics and medical history in pregnant women with ePE, pPE, lPE, and without PE.
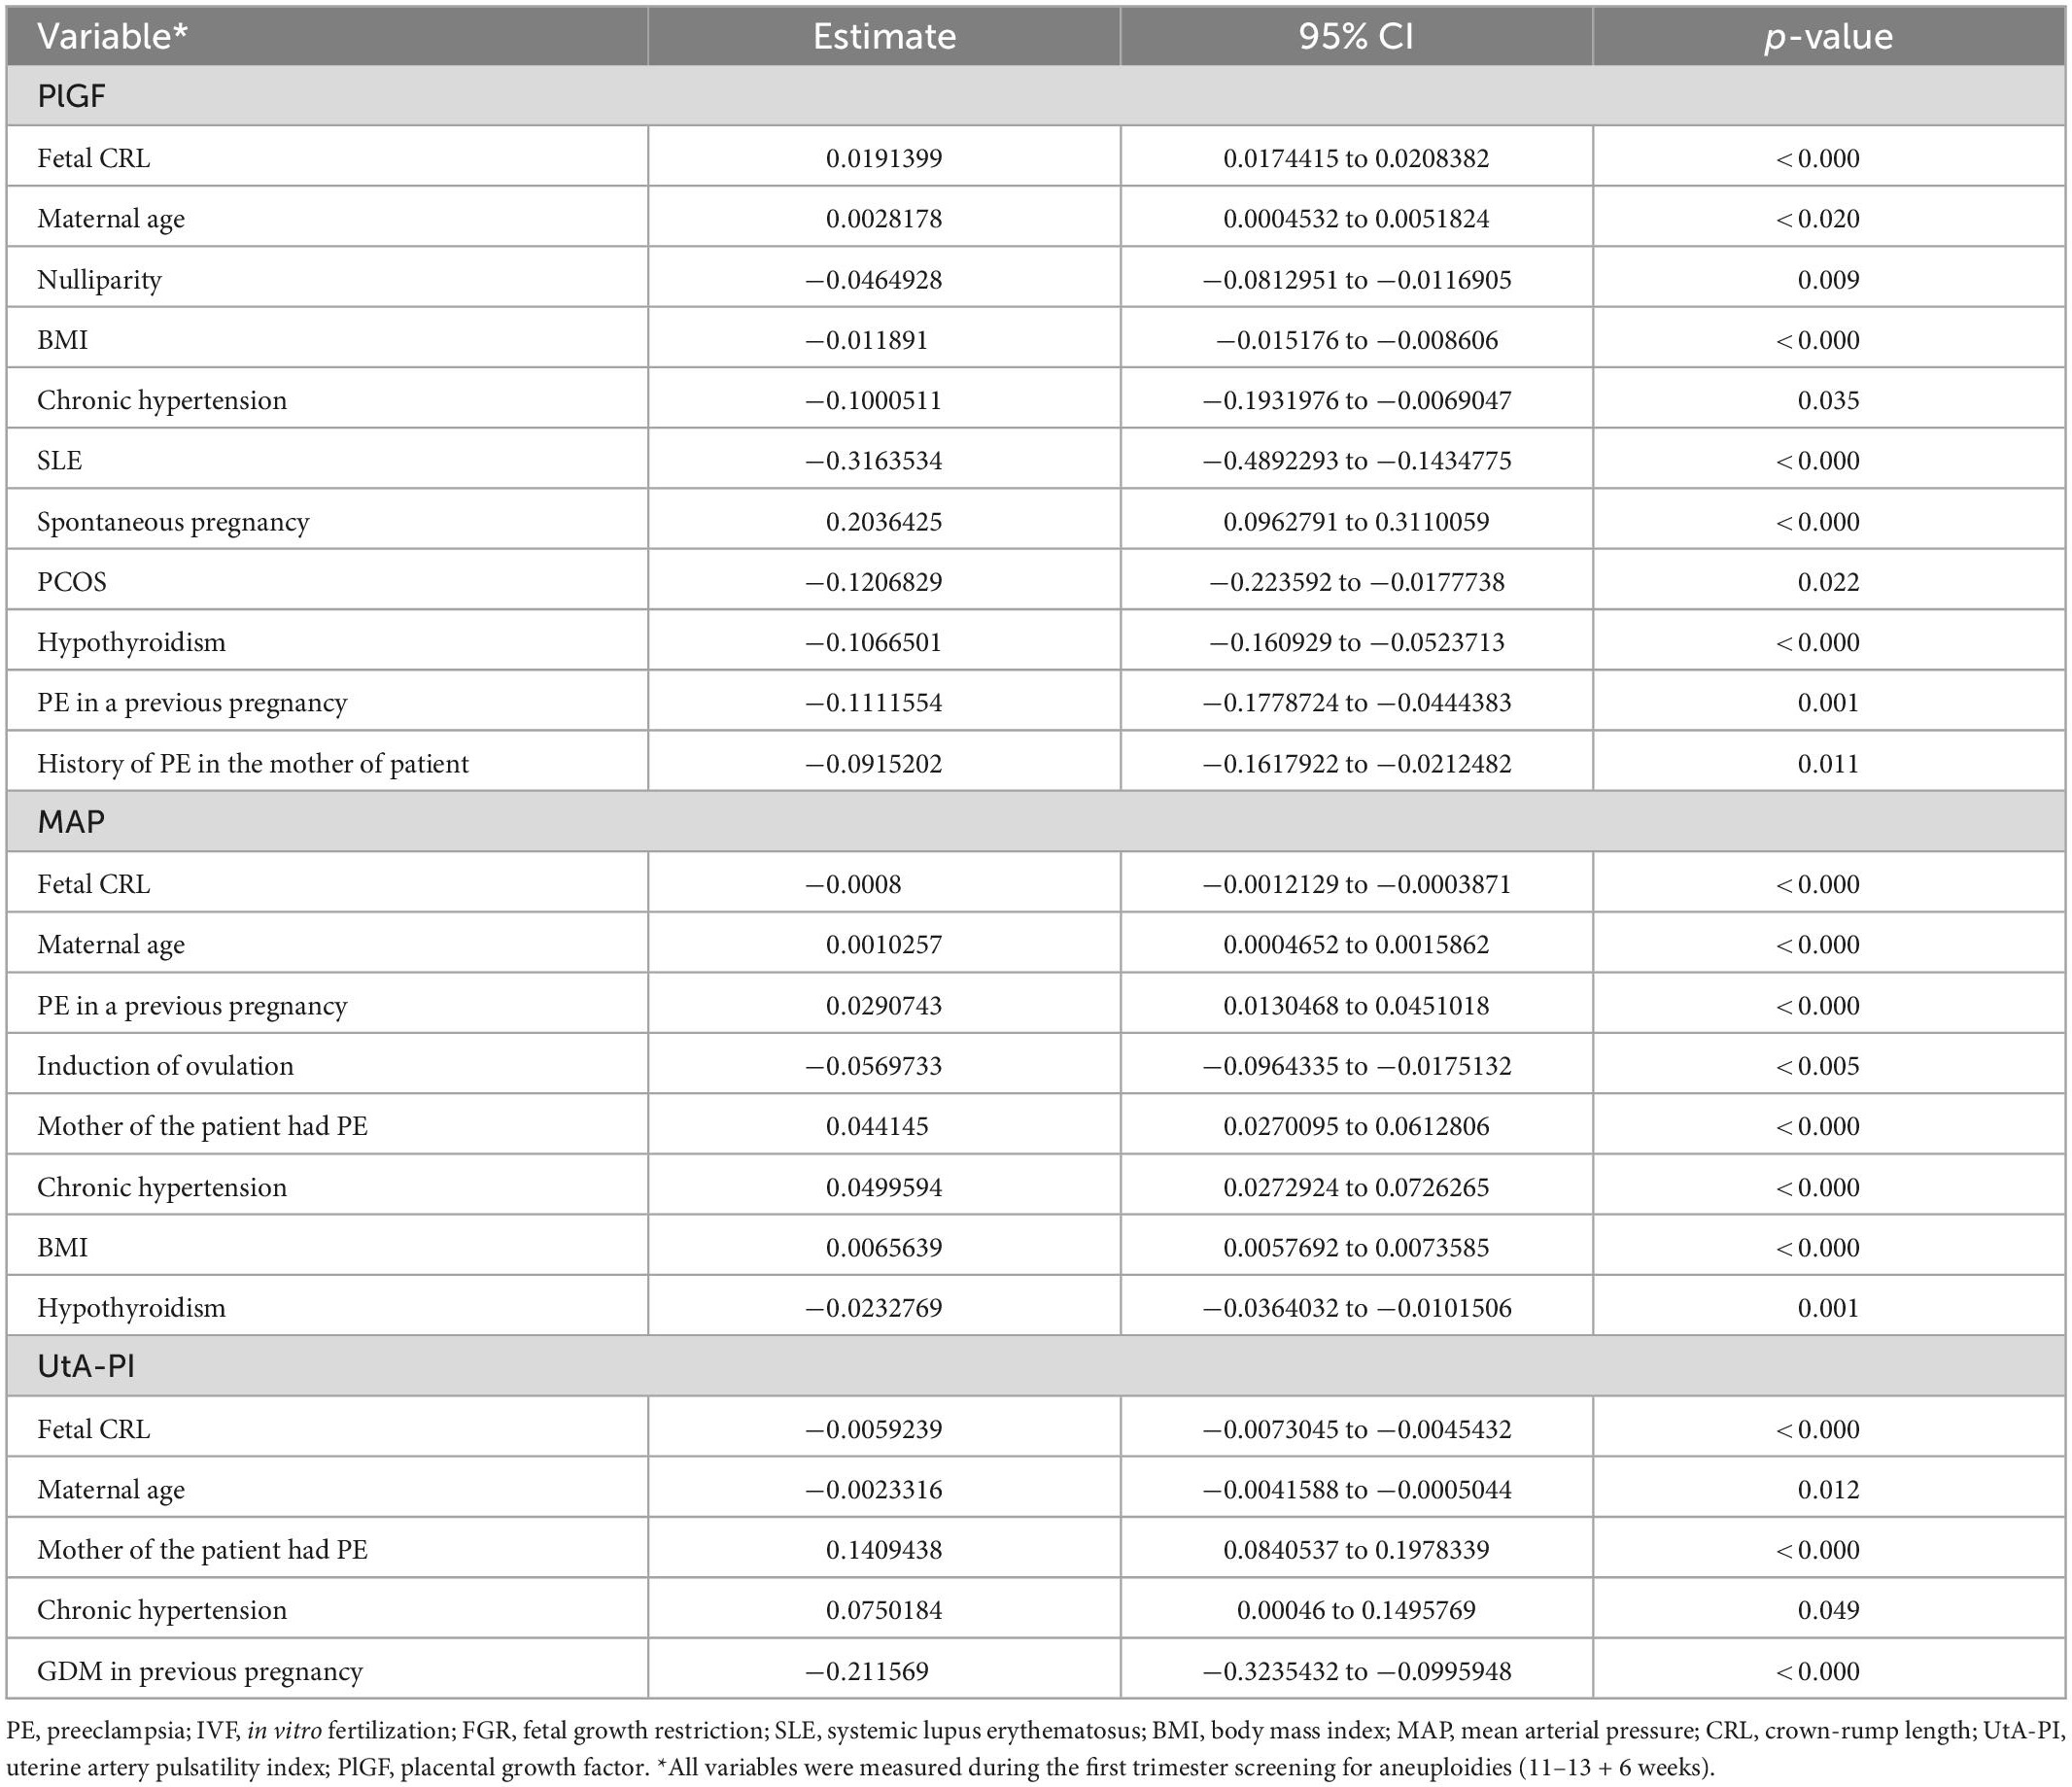
Table 2. Multiple regression analysis to identify significant independent contributors to first trimester biomarkers.
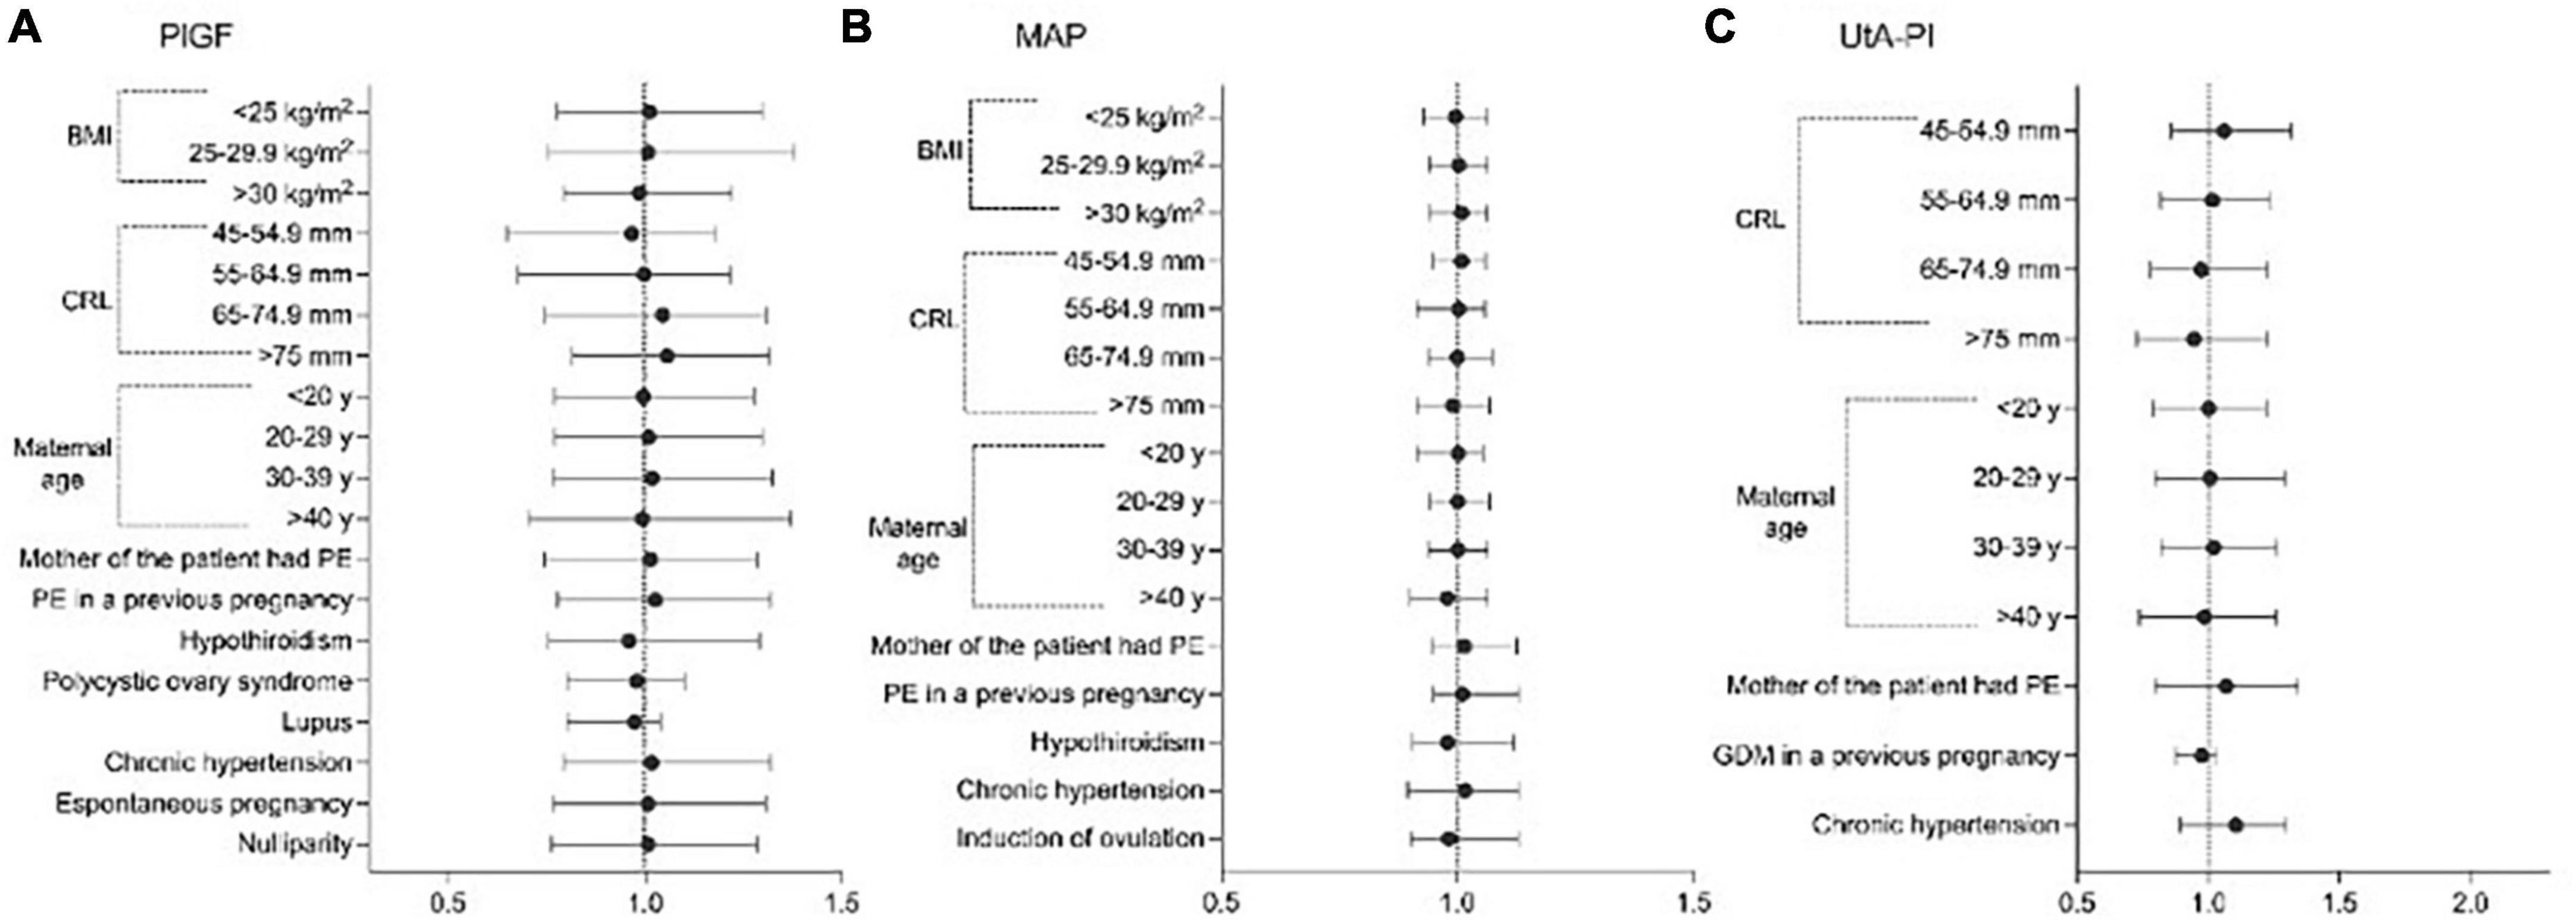
Figure 1. Significant variables affecting the distribution of Log values of; (A) placental growth factor (PlGF), (B) mean arterial pressure (MAP), and (C) uterine artery pulsatility index (UtA-PI), plotted on multiples of the median (MoM) scale among healthy pregnancies.
Distributional properties of the MoM values among non-pregnant women
Multiples of the median values of PlGF, MAP, and UtA-PI in the control group during the first- trimester are shown in Figure 2. The median, 5th, and 95th percentiles of PlGF were 1.000 (95% CI, 0.989–1.024), 0.498 (95% CI, 0.481–0.514), and 1.861 (95% CI, 1.843–1.877), respectively. For MAP, median, 5th, and 95th percentiles were 1.000 (95% CI, 0.962–1.039), 0.846 (95% CI, 0.807–0.884), and 1.175 (95% CI, 1.136–1.213). The median, 5th, and 95th percentiles for UAt-PI were 1.000 (95% CI, 0.996–1.021), 0.561 (95% CI, 0.547–0.574), and 1.699 (95% CI, 1.685–1.712).
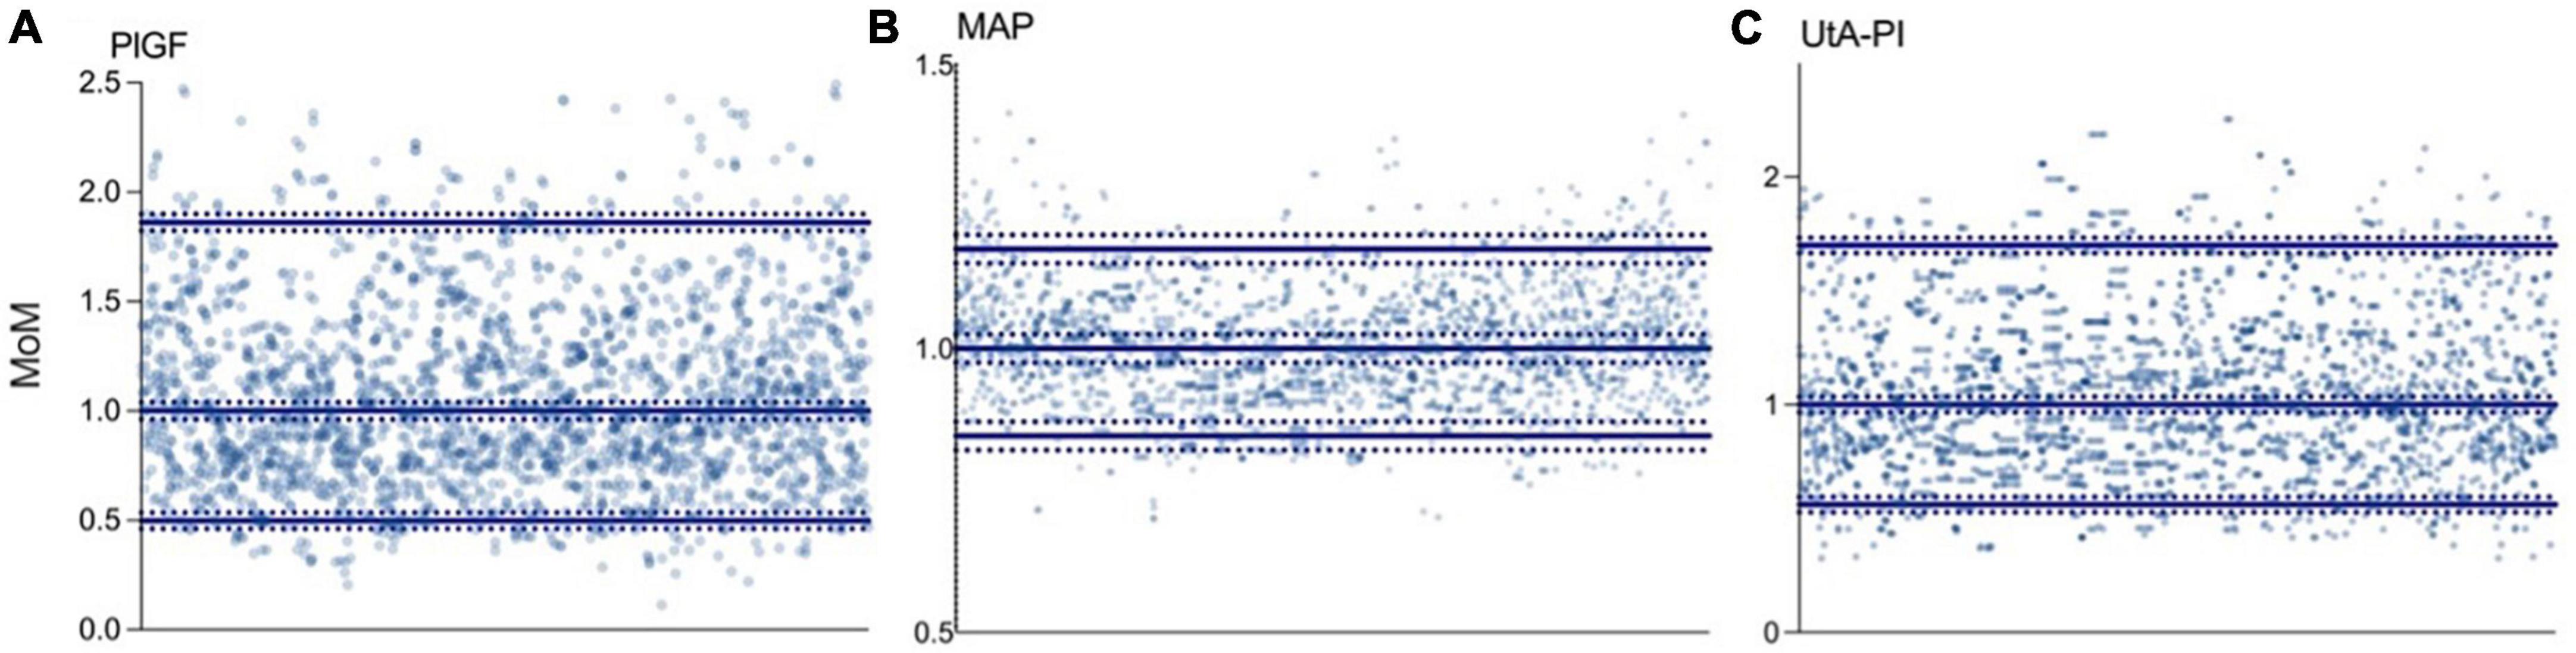
Figure 2. Distribution of biomarkers in the control group. (A) Placental growth factor (PlGF): median 1.000 (95% CI, 0.989–1.024), p5 0.498 (95% CI, 0.481–0.514), and p95 1.861 (95% CI, 1.843–1.877). (B) Mean arterial pressure (MAP): median 1.000 (95% CI, 0.962–1.039), p5 0.846 (95% CI, 0.807–0.884), and p95 1.175 (95% CI, 1.136–1.213). (C) Uterine artery pulsatility index (UtA-PI): median 1.000 (95% CI, 0.996–1.021), p5 0.561 (95% CI, 0.547–0.574), and p95 1.699 (95% CI, 1.685–1.712).
Comparison of first-trimester PlGF, MAP, and UtA-PA MoMs between controls and PE
There was a significant difference among MoMs of the different biomarkers between controls and women developing early, late, and term preeclampsia. There was a significant difference in lower MoMs for PlGF among ePE that increased among pPE, but there was no difference between controls and tPE. However, for MAP MoMs, values were higher among ePE and were lower for pPE and tPE; there was a significant difference in MAP MoMs among all women developing PE and controls. Regarding UtA-PI MoMs, there was a significant difference in higher MoMs among ePE and pPE but not of tPE compared to controls (Figure 3). Table 3 shows the median and 95% CI for each biomarker MoM according to PE status.
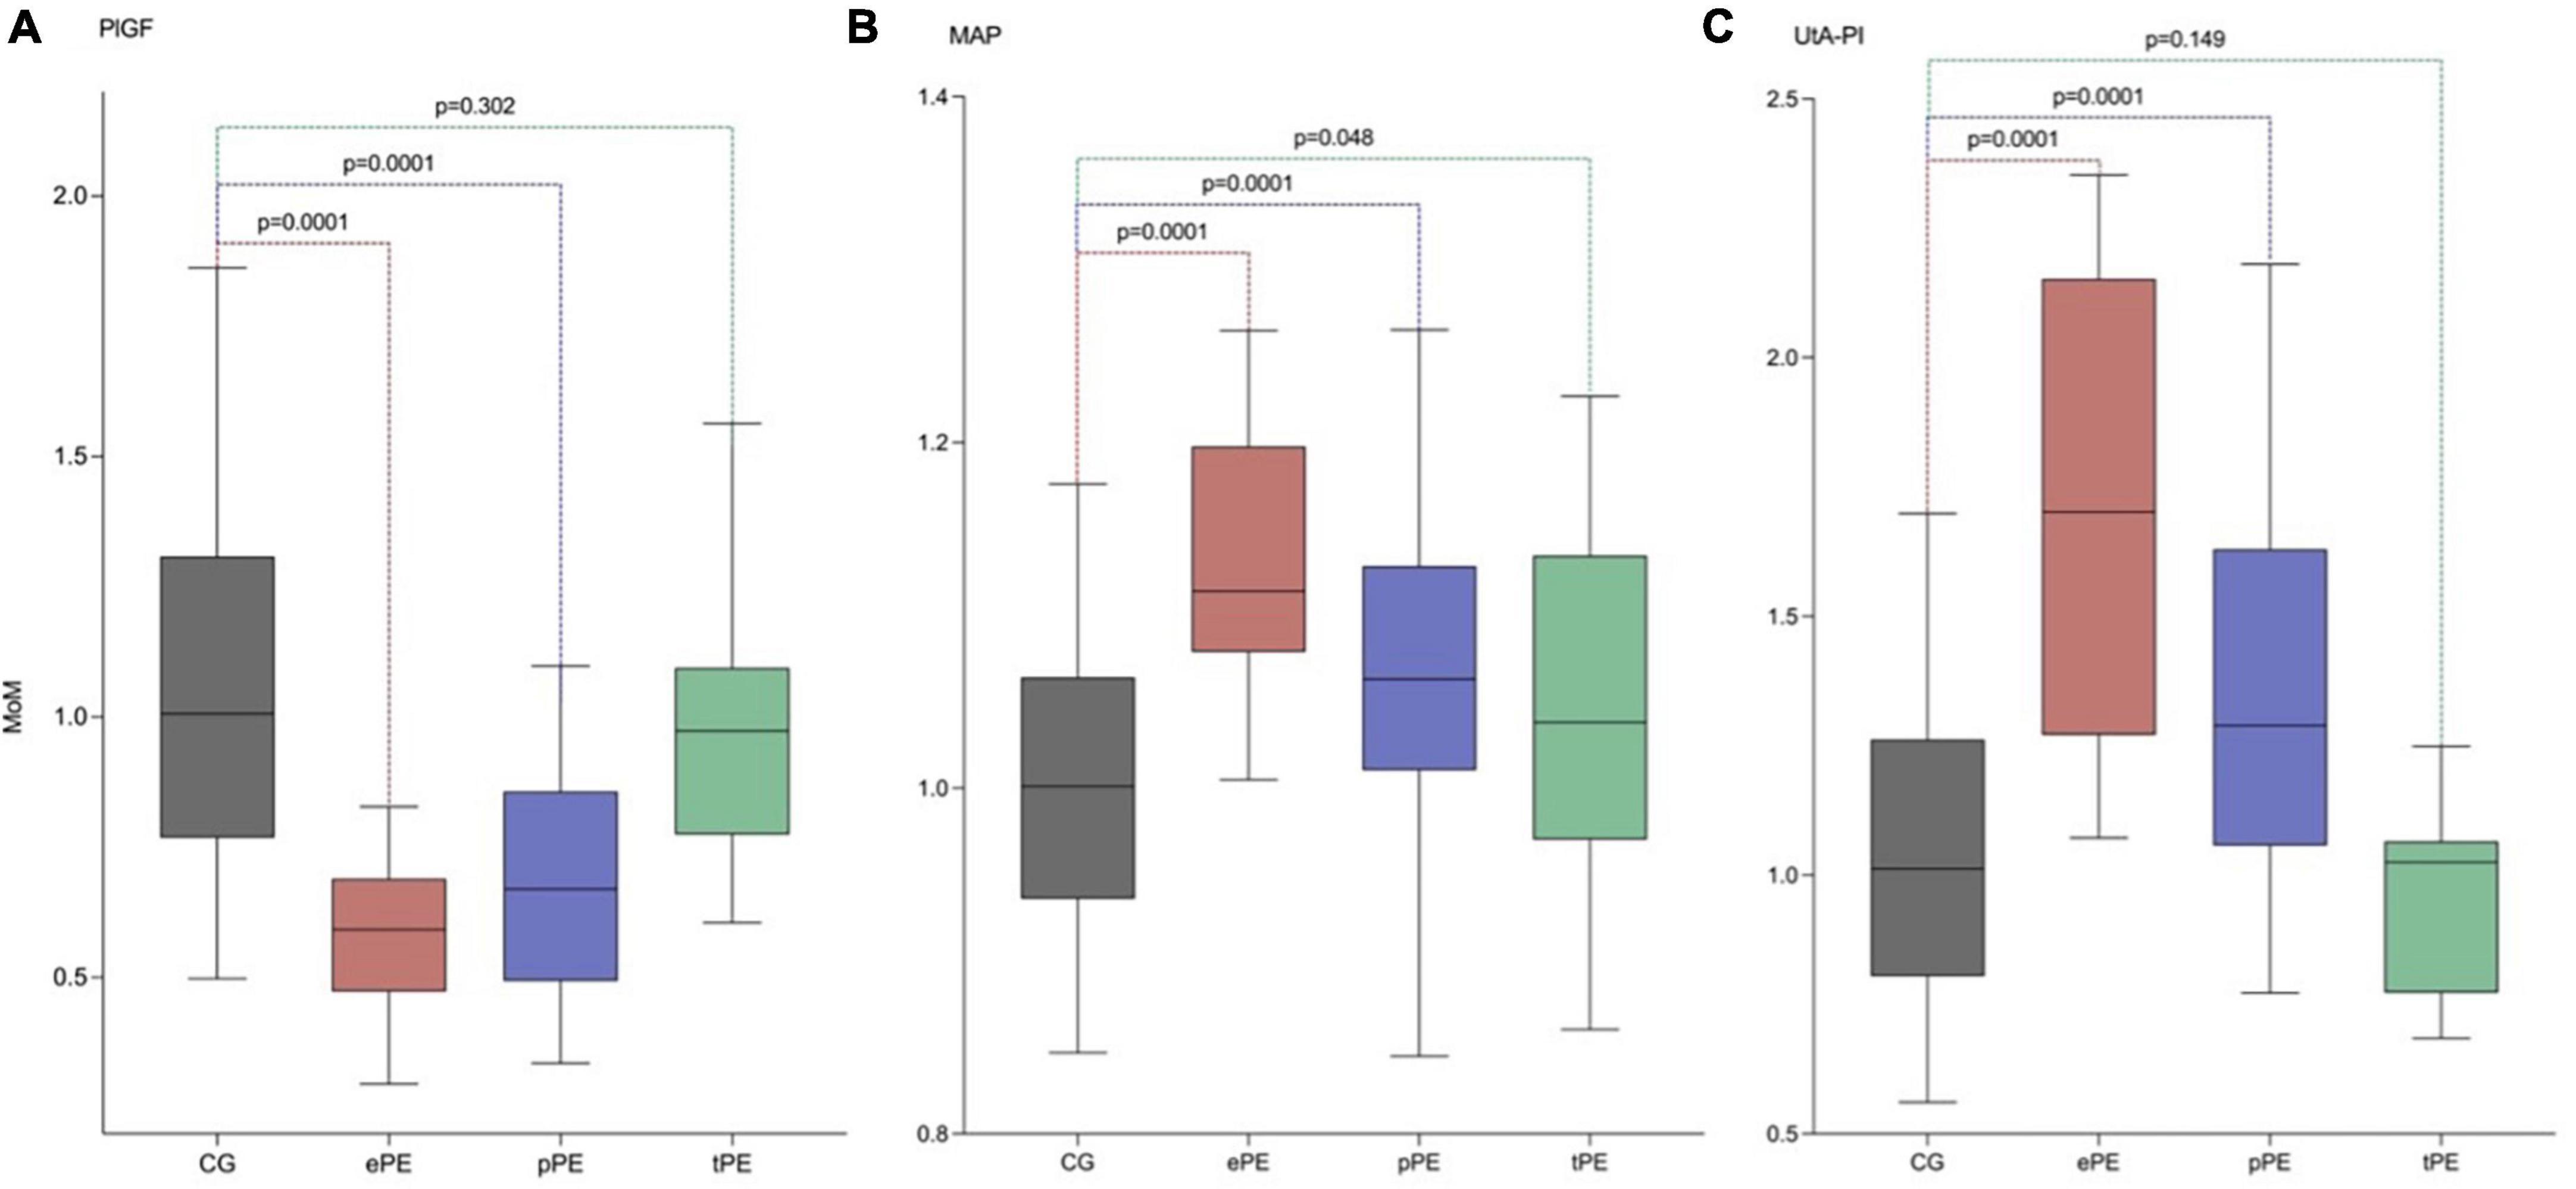
Figure 3. Adjusted median, p5, and p95 of PlGF, MAP, and UtA-PI in the control group (CG), early preeclampsia (ePE), preterm preeclampsia (pPE), and term preeclampsia (tPE) using our model of maternal characteristics and medical history. (A) Serum placental growth factor (PlGF). (B) Values of MoM of the mean arterial pressure (MAP). (C) Values of MoM of the uterine artery pulsatility index (UtA-PI).
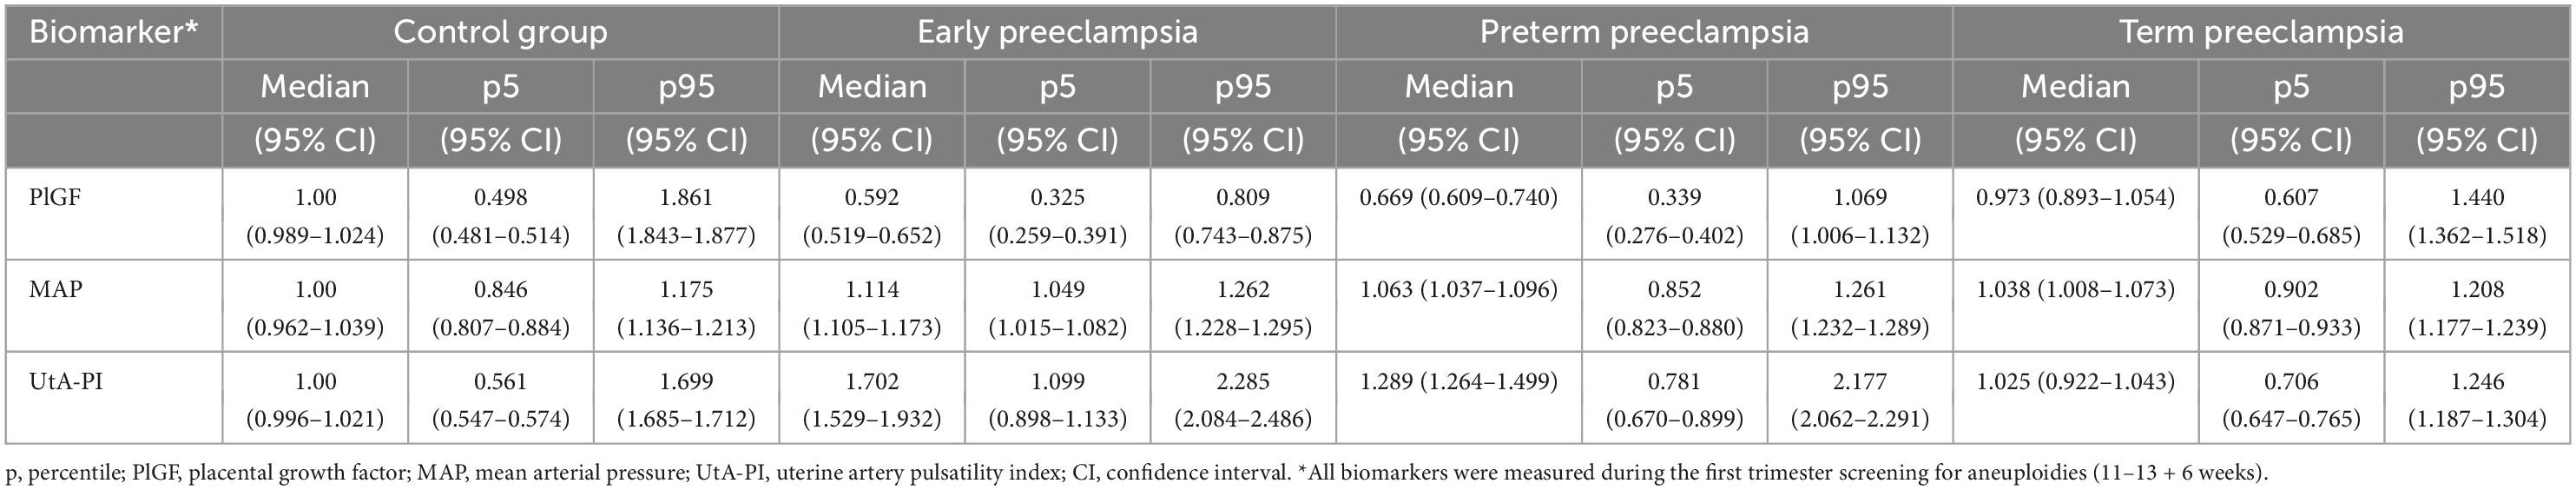
Table 3. Median, p5, and p95 of MoM according to PE status.
Discussion
Main findings
The findings of this study are first that there are maternal characteristics that significantly influence the distribution of the Log values for PlGF, MAP, and UtA-PI that are similar to other studies and some others that are unique for our population, such as PCOS, hypothyroidism, and gestational diabetes mellitus (GDM) in previous pregnancies. Second, the creation of MoMs using these new distributions can discriminate between women developing PE later in pregnancy with a trend toward more extreme values among ePE compared to controls.
Comparison with existing literature
Extensive studies in screening for preeclampsia have established that all biomarkers used for the prediction of this disease should be expressed as MoMs after adjustment for maternal characteristics in normal pregnancies (14–17). However, the employment of non-population-specific models for MoM calculation leads to an imprecise prediction of PE (18–21). We found that PlGF, MAP, and UtA-PI’s distribution are influenced by several maternal characteristics that are similar to other populations, such as the example of reproductive assisted techniques (11), anthropometric features, age, and crown rump length (CRL). However, there are other unique population features that have not been described in previous studies, such as PCOS. In this study, we found that pregnant women with a history of PCOS that did not develop preeclampsia have lower PlGF levels. An explanation of this may be the prevalence of hypothyroidism in females, which varies between 0.3 and 3.7% in the USA and between 0.2 and 6.4% in Europe (22–24). In Mexico, the prevalence of PCOS is 8% (25), and our data shows a prevalence of 9%, which emphasizes the importance of this disease in our population due to its high prevalence and the need for reproductive techniques that arise in these women that may appear as a confounder along PCOS.
Maternal hypothyroidism is another disease that has a higher prevalence in Latin America; this disease can lead to low levels of placental T4 and T3, resulting in a decreased expression of PlGF (26). We have observed lower PlGF MoMs in pregnant women with hypothyroidism that did not develop preeclampsia which goes hand to hand with a recent meta-analysis that showed that higher thyroid stimulating hormone (TSH) levels were associated with a higher risk of preeclampsia (27). Even though we did not find significant differences in the prevalence of hypothyroidism among the control group and preeclampsia groups, most patients are under control using levothyroxine therapy which has shown a decrease in MAP that is coherent with other studies that show a blood pressure-lowering effect of levothyroxine therapy in hypothyroidism (28, 29).
Another interesting finding of this study is that GDM influences UtA-PI among women who did not develop preeclampsia; this has also been supported by Sweeting et al. showing that GDM was associated with lower values of UtA-PI MoMs (30). However, there is no clear explanation of how GDM may directly influence placentation and UtA-PI values. However, evidence is consistent by showing the same results in other studies as previously described.
Our study shows that maternal characteristics and diseases such as PCOS, hypothyroidism, and GDM are more prevalent in our population and that these characteristics affect the distribution of the Log values of PlGF, MAP, and UtA-PI in women that did not develop preeclampsia. It is then coherent that the development of new expected values for these biomarkers is justified for our population, given the significant effect of diseases and maternal characteristics that are not present in Europeans or other populations.
Strengths and limitations
The strengths of our study were that pregnant women were consecutively recruited in a study with a specialized database built specifically for research purposes, minimizing potential biases; the use of a validated methodology and automated devices by trained doctors to measure PlGF, MAP, and UtA-IP; and application of multiple regression analysis to define the contributions and interrelationships of maternal variables that influence measured each biomarker in the first trimester. But as we have strengths, we also have limitations. Our main limitation is the small sample of ePE; nevertheless, for MoM creation, the importance lies in the control group from which we create the expected values for healthy pregnancies. Another limitation is the lack of severe COVID-19 as a risk factor in maternal history since COVID is an endothelial disease that could potentially have an increased risk on the development of PE in subsequent pregnancies. Also, it may be argued that there may be a confounding among several characteristics such as PCOS, assisted reproductive techniques, and PE; nevertheless, we used a multiple regression analysis to adjust for confounders to find which characteristics are significantly independent and how much they influence the distribution of all biomarkers in healthy women.
Clinical interpretation
Identifying population-specific characteristics that influence the distribution of PlGF, MAP, and UtA-PI in healthy pregnancies is the first step in creating new predictive models for PE in our region. Nevertheless, it is also possible that these new MoMs could help improve existing predictive models to help increase their detection rate for PE. In the end, under the law of parsimoniousness, it is not valid to aim for the most statistically complex or advance model as if we were competing for who develops the hardest prediction model; the simplest model with the better prediction is the one that we should use in our population.
Conclusion
Several maternal characteristics influence the expected log values for PlGf, MAP, and UtA-PI that are similar to other populations and some other features that are specific to our region, such as PCOS, hypothyroidism, and GDM. The development of population-specific MoMs can discriminate among women that will develop PE during pregnancy.
Data availability statement
The raw data supporting the conclusions of this article will be made available by the authors upon a reasonable request.
Ethics statement
This study was reviewed and approved by the Ethics and Research Internal Review Board of the National Institute of Perinatology. The patients/participants always provided their written informed consent to participate in this study.
Author contributions
JT-T conceived the idea and helped draft the manuscript. SE-y-S helped draft the manuscript. JV-B performed a critical review and helped in the statistical analysis. LO-G helped in the statistical analysis. JS-P, GE-G, RM-C, and SA-G performed a critical review. PM-R helped draft the manuscript. RM-P conceived the idea, helped draft the manuscript, and performed the critical review and statistical analysis. All authors contributed to the article and approved the submitted version.
Funding
ROCHE Diagnostics gave the PlGF kits for this study.
Conflict of interest
The authors declare that the research was conducted in the absence of any commercial or financial relationships that could be construed as a potential conflict of interest.
Publisher’s note
All claims expressed in this article are solely those of the authors and do not necessarily represent those of their affiliated organizations, or those of the publisher, the editors and the reviewers. Any product that may be evaluated in this article, or claim that may be made by its manufacturer, is not guaranteed or endorsed by the publisher.
Supplementary material
The Supplementary Material for this article can be found online at: https://www.frontiersin.org/articles/10.3389/fmed.2023.1050923/full#supplementary-material
References
1. Margioula-Siarkou G, Margioula-Siarkou C, Petousis S, Margaritis K, Vavoulidis E, Gullo G, et al. The role of endoglin and its soluble form in pathogenesis of preeclampsia. Mol Cell Biochem. (2022) 477:479–91.
3. Kuklina E, Ayala C, Callaghan W. Hypertensive disorders and severe obstetric morbidity in the United States. Obstet Gynecol. (2009) 113:1299–306.
4. Scazzocchio E, Crovetto F, Triunfo S, Gratacos E, Figueras F. Validation of a first-trimester screening model for pre-eclampsia in an unselected population. Ultrasound Obstet Gynecol. (2017) 49:188–93.
5. Tan M, Syngelaki A, Poon L, Rolnik D, O’Gorman N, Delgado J, et al. Screening for pre-eclampsia by maternal factors and biomarkers at 11-13?weeks’ gestation. Ultrasound Obstet Gynecol. (2018) 52:186–95.
6. O’Gorman N, Wright D, Poon L, Rolnik D, Syngelaki A, de Alvarado M, et al. Multicenter screening for pre-eclampsia by maternal factors and biomarkers at 11-13 weeks’ gestation: comparison with NICE guidelines and ACOG recommendations. Ultrasound Obstet Gynecol. (2017) 49:756–60. doi: 10.1002/uog.17455
7. Poon L, Zymeri N, Zamprakou A, Syngelaki A, Nicolaides K. Protocol for measurement of mean arterial pressure at 11-13 weeks’ gestation. Fetal Diagn Ther. (2012) 31:42–8.
8. Lagana A, Favilli A, Triolo O, Granese R, Gerli S. Early serum markers of pre-eclampsia: are we stepping forward? J Matern Fetal Neonatal Med. (2016) 29:3019–23. doi: 10.3109/14767058.2015.1113522
9. Rolnik D, Wright D, Poon L, O’Gorman N, Syngelaki A, de Paco Matallana C, et al. Aspirin versus placebo in pregnancies at high risk for preterm preeclampsia. N Engl J Med. (2017) 377:613–22.
10. Al-Rubaie Z, Askie L, Ray J, Hudson H, Lord S. The performance of risk prediction models for pre-eclampsia using routinely collected maternal characteristics and comparison with models that include specialised tests and with clinical guideline decision rules: a systematic review. BJOG. (2016) 123:1441–52. doi: 10.1111/1471-0528.14029
11. Gullo G, Scaglione M, Cucinella G, Chiantera V, Perino A, Greco M, et al. Neonatal outcomes and long-term follow-up of children born from frozen embryo, a narrative review of latest research findings. Medicina (Kaunas). (2022) 58:1218. doi: 10.3390/medicina58091218
12. Plasencia W, Maiz N, Bonino S, Kaihura C, Nicolaides K. Uterine artery Doppler at 11 + 0 to 13 + 6 weeks in the prediction of pre-eclampsia. Ultrasound Obstet Gynecol. (2007) 30:742–9.
13. American College of Obstetricians and Gynecologists. Gestational hypertension and preeclampsia: ACOG practice bulletin, number 222. Obstet Gynecol. (2020) 135:e237–60.
14. Akolekar R, Zaragoza E, Poon L, Pepes S, Nicolaides K. Maternal serum placental growth factor at 11 + 0 to 13 + 6 weeks of gestation in the prediction of pre-eclampsia. Ultrasound Obstet Gynecol. (2008) 32:732–9. doi: 10.1002/uog.6244
15. Akolekar R, Syngelaki A, Sarquis R, Zvanca M, Nicolaides K. Prediction of early, intermediate and late pre-eclampsia from maternal factors, biophysical and biochemical markers at 11-13 weeks. Prenat Diagn. (2011) 31:66–74. doi: 10.1002/pd.2660
16. Gallo D, Poon L, Fernandez M, Wright D, Nicolaides K. Prediction of preeclampsia by mean arterial pressure at 11-13 and 20-24 weeks’ gestation. Fetal Diagn Ther. (2014) 36:28–37. doi: 10.1159/000360287
17. O’Gorman N, Wright D, Syngelaki A, Akolekar R, Wright A, Poon L, et al. Competing risks model in screening for preeclampsia by maternal factors and biomarkers at 11-13 weeks gestation. Am J Obstet Gynecol. (2016) 214:.e1–12.
18. O’Gorman N, Wright D, Poon L, Rolnik D, Syngelaki A, Wright A, et al. Accuracy of competing-risks model in screening for pre-eclampsia by maternal factors and biomarkers at 11-13 weeks’ gestation. Ultrasound Obstet Gynecol. (2017) 49:751–5.
19. Guizani M, Valsamis J, Dutemeyer V, Kang X, Ceccotti V, Khalife J, et al. First-Trimester combined multimarker prospective study for the detection of pregnancies at a high risk of developing preeclampsia using the fetal medicine foundation-algorithm. Fetal Diagn Ther. (2018) 43:266–73. doi: 10.1159/000477934
20. Lobo G, Nowak P, Panigassi A, Lima A, Araujo Júnior E, Nardozza L, et al. Validation of Fetal Medicine Foundation algorithm for prediction of pre-eclampsia in the first trimester in an unselected Brazilian population. J Matern Fetal Neonatal Med. (2019) 32:286–92. doi: 10.1080/14767058.2017.1378332
21. Rezende K, Cunha A, Amim Junior J, Bornia R. External validation of the fetal medicine foundation algorithm for the prediction of preeclampsia in a brazilian population. Pregnancy Hypertens. (2019) 17:64–8. doi: 10.1016/j.preghy.2019.05.006
22. Garmendia Madariaga A, Santos Palacios S, Guillén-Grima F, Galofré J. The incidence and prevalence of thyroid dysfunction in Europe: a meta-analysis. J Clin Endocrinol Metab. (2014) 99:923–31.
23. Asvold B, Vatten L, Bjøro T. Changes in the prevalence of hypothyroidism: the HUNT Study in Norway. Eur J Endocrinol. (2013) 169:613–20. doi: 10.1530/EJE-13-0459
25. Sá,nchez-Romero LB, Campos I, García E, Arellano S, González A, Díaz E, et al. Concentraciones séricas de hormona estimulante de la tiroides (TSH) en niños, adolescentes y adultos mexicanos. (2012). Available online at: https://insp.mx/images/stories/Centros/cinys/Docs/concentraciones_sericas_TSH.pdf (accessed September 1, 2022).
26. Adu-Gyamfi E, Wang Y, Ding Y. The interplay between thyroid hormones and the placenta: a comprehensive review†. Biol Reprod. (2020) 102:8–17. doi: 10.1093/biolre/ioz182
27. Toloza F, Derakhshan A, Männistö T, Bliddal S, Popova P, Carty D, et al. Association between maternal thyroid function and risk of gestational hypertension and pre-eclampsia: a systematic review and individual-participant data meta-analysis. Lancet Diabetes Endocrinol. (2022) 10:243–52. doi: 10.1016/S2213-8587(22)00007-9
28. Feller M, Snel M, Moutzouri E, Bauer D, de Montmollin M, Aujesky D, et al. Association of thyroid hormone therapy with quality of life and thyroid-related symptoms in patients with subclinical hypothyroidism: A systematic review and meta-analysis. JAMA. (2018) 320:1349–59. doi: 10.1001/jama.2018.13770
29. He W, Li S, Zhang J, Zhang J, Mu K, Li X. Effect of levothyroxine on blood pressure in patients with subclinical hypothyroidism: A systematic review and meta-analysis. Front Endocrinol (Lausanne). (2018) 9:454. doi: 10.3389/fendo.2018.00454
Keywords: preeclampsia, multiples of the median (MoMs), first trimester prediction, Latin America, biomarkers
Citation: Torres-Torres J, Espino-y-Sosa S, Villafan-Bernal JR, Orozco-Guzman LE, Solis-Paredes JM, Estrada-Gutierrez G, Martinez-Cisneros RA, Mateu-Rogell P, Acevedo-Gallegos S and Martinez-Portilla RJ (2023) Effects of maternal characteristics and medical history on first trimester biomarkers for preeclampsia. Front. Med. 10:1050923. doi: 10.3389/fmed.2023.1050923
Received: 22 September 2022; Accepted: 05 January 2023;
Published: 24 January 2023.
Edited by:
Berthold Huppertz, Medical University of Graz, AustriaReviewed by:
Antonio Simone Laganà, University of Palermo, ItalyFederica Perelli, Santa Maria Annunziata Hospital, Italy
Emmanuel Bujold, Laval University, Canada
Copyright © 2023 Torres-Torres, Espino-y-Sosa, Villafan-Bernal, Orozco-Guzman, Solis-Paredes, Estrada-Gutierrez, Martinez-Cisneros, Mateu-Rogell, Acevedo-Gallegos and Martinez-Portilla. This is an open-access article distributed under the terms of the Creative Commons Attribution License (CC BY). The use, distribution or reproduction in other forums is permitted, provided the original author(s) and the copyright owner(s) are credited and that the original publication in this journal is cited, in accordance with accepted academic practice. No use, distribution or reproduction is permitted which does not comply with these terms.
*Correspondence: Raigam Jafet Martinez-Portilla,  cmFpZmV0QGhvdG1haWwuY29t
†These authors share first authorship