 Louis Kreitmann1,2*
 Maxime Bodinier1,2
 Aurore Fleurie1,2
 Katia Imhoff3
 Marie-Angelique Cazalis1,2
 Estelle Peronnet1,2Elisabeth Cerrato1,2Claire Tardiveau1,2
 Filippo Conti1,4Jean-François Llitjos1,2,5Julien Textoris6
 Guillaume Monneret1,4Sophie Blein3†
 Karen Brengel-Pesce1,2†
- 1EA 7426 “Pathophysiology of Injury-Induced Immunosuppression”, Joint Research Unit Université Claude Bernard Lyon 1 – Hospices Civils de Lyon – bioMérieux, Lyon, France
- 2Open Innovation and Partnerships (OIP), bioMérieux S.A., Marcy-l’Étoile, France
- 3Data Science, bioMérieux S.A., Marcy-l’Etoile, France
- 4Immunology Laboratory, Edouard Herriot Hospital – Hospices Civils de Lyon, Lyon, France
- 5Anaesthesia and Critical Care Medicine Department, Hospices Civils de Lyon, Edouard Herriot Hospital, Lyon, France
- 6Medical Affairs, bioMérieux S.A., Marcy-l’Etoile, France
Background: Novel biomarkers are needed to progress toward individualized patient care in sepsis. The immune profiling panel (IPP) prototype has been designed as a fully-automated multiplex tool measuring expression levels of 26 genes in sepsis patients to explore immune functions, determine sepsis endotypes and guide personalized clinical management. The performance of the IPP gene set to predict 30-day mortality has not been extensively characterized in heterogeneous cohorts of sepsis patients.
Methods: Publicly available microarray data of sepsis patients with widely variable demographics, clinical characteristics and ethnical background were co-normalized, and the performance of the IPP gene set to predict 30-day mortality was assessed using a combination of machine learning algorithms.
Results: We collected data from 1,801 arrays sampled on sepsis patients and 598 sampled on controls in 17 studies. When gene expression was assayed at day 1 following admission (1,437 arrays sampled on sepsis patients, of whom 1,161 were alive and 276 (19.2%) were dead at day 30), the IPP gene set showed good performance to predict 30-day mortality, with an area under the receiving operating characteristics curve (AUROC) of 0.710 (CI 0.652–0.768). Importantly, there was no statistically significant improvement in predictive performance when training the same models with all genes common to the 17 microarray studies (n = 7,122 genes), with an AUROC = 0.755 (CI 0.697–0.813, p = 0.286). In patients with gene expression data sampled at day 3 following admission or later, the IPP gene set had higher performance, with an AUROC = 0.804 (CI 0.643–0.964), while the total gene pool had an AUROC = 0.787 (CI 0.610–0.965, p = 0.811).
Conclusion: Using pooled publicly-available gene expression data from multiple cohorts, we showed that the IPP gene set, an immune-related transcriptomics signature conveys relevant information to predict 30-day mortality when sampled at day 1 following admission. Our data also suggests that higher predictive performance could be obtained when assaying gene expression at later time points during the course of sepsis. Prospective studies are needed to confirm these findings using the IPP gene set on its dedicated measurement platform.
Introduction
Sepsis – a dysregulated immune response to severe infection leading to acute organ dysfunction (1) – is the third leading cause of death worldwide and the main cause of in-hospital mortality (2, 3). Despite more than 100 randomized clinical trials attempting to manipulate the host response to improve sepsis outcomes, sepsis care remains mainly supportive, limited to hemodynamic support, early antibiotic treatment and source control (4). In contrast to what is seen in the treatment of cancer, the aim of delivering precision medicine in sepsis remains far from attained: new tools and strategies are urgently needed to progress toward individualized patient care in sepsis (5, 6).
Why have all clinical trials in sepsis failed? (7). One reason is that they have not taken into account the significant heterogeneity in the epidemiology, microbiology and immunology of this syndrome. The immune response in sepsis is highly complex and dynamic, involving both pro- and anti-inflammatory mechanisms, with substantial intra- and inter-individual variability (8, 9). While its initial phase is characterized by uncontrolled inflammation responsible for tissue injury, sepsis patients also display markers of a profound immunosuppression (10), linked to a high prevalence of secondary opportunistic infections (11, 12) and contributing to significant mortality in sepsis survivors (13). Thus, trials are investigating whether immune-suppressing therapies such as interleukine (IL) 1 receptor antagonist (IL-1Ra) and anti–IL-6 could dampen the early cytokine storm, and conversely whether immune-stimulatory agents such as IL-7, granulocyte macrophage-colony stimulating factor (GM-CSF), and interferon gamma (IFN-γ) could reverse sepsis-induced immunosuppression (14).
To identify sub-groups of patients with reduced heterogeneity and a higher likelihood to respond favorably to such targeted therapies, it is crucial to use appropriate biomarkers (15, 16). For example, a low expression of human leukocyte antigen–DR on monocytes (mHLA-DR) can be used as a surrogate marker for monocyte anergy and decreased antigen presentation (17), and has been used as an inclusion criterion in the GM-CSF trial (18). However, its dissemination at the point-of-care has been limited, mainly because its accurate measurement is time-consuming and requires dedicated specialized personnel and equipment, and also because – as a univariate biomarker – it may fail to capture the global complexity of sepsis immunology.
More recent biotechnological and analytical advances have prompted the use of -omics technologies - mostly transcriptomics - to probe the immune response in sepsis, hoping that this approach could uncover important mechanisms of immune regulation and help identify biomarkers to inform targeted therapeutic strategies in sepsis (16, 19). By assaying messenger RNA (mRNA) transcripts in peripheral blood leukocytes and using unsupervised machine learning (ML) methods, sub-groups of sepsis patients whose distinct patterns of gene expression (GE) can be linked to distinct immune states, so-called « endotypes », have been identified. For instance, the Dutch Molecular Diagnosis and Risk Stratification of Sepsis (MARS) project identified four distinct sepsis endotypes named MARS 1 to 4, with patients in the MARS 1 cluster showing a pronounced decrease in expression of genes corresponding to key innate and adaptive immune cell functions and a decreased 28-day survival (20); and the United Kingdom Genomic Advances in Sepsis (GAinS) study identified two distinct sepsis response signatures named SRS 1 and SRS 2, with SRS 1 patients having an immunosuppressed status and higher 14-day mortality (21).
Importantly, there is only partial overlap in differentially expressed genes of the MARS 1 and SRS 1 clusters, raising the question of the generalizability of these signatures. This could be explained by the limited sample size of both studies; the redundancy in the information carried by multiples genes belonging to common biological pathways; and the sampling of patients from restricted ethnic backgrounds and geographic areas. In order to increase the potential to generalize transcriptomics studies in sepsis, one strategy is to leverage biological and technical heterogeneity across a large number of studies taken from diverse clinical backgrounds and profiled using different platforms (22). To this end, Stanford-based investigators have collected publicly available GE data sets sampled from sepsis patients, implemented a modified type of array normalization that uses the ComBat empirical Bayes normalization method (an algorithm called COCONUT, for COmbat CO-normalization Using coNTrols) and used a supervised learning approach to identify a gene signature predictive of 30-day sepsis mortality (23).
However, while this approach has focused on finding a gene signature with the broadest generalizability across populations and the highest predictive performance, it does not provide a mechanistic insight into the pathways involved in disease trajectories. Further, none of the above-mentioned signatures have incorporated prior knowledge on immunological abnormalities in sepsis, nor was devised precisely to discriminate between sub-groups of sepsis patients that could be targeted by specific immunomodulatory agents. Finally, they were devised using microarray data, while a point-of-care device targeting these gene sets would most likely use another technology to measure gene expression, raising the question of the transferability across platforms.
To circumvent these obstacles, we are working on an Immune Profiling Panel (IPP) prototype, a multiplexed transcriptomic assay that uses the FilmArray technology to quantify mRNA expression in whole blood and deliver results in less than an hour (24, 25). This prototype test, which has not been submitted for regulatory review at the time of this writing, may someday be able to provide clinicians with timely information about the immune system of sepsis patients and potentially aid in providing appropriate care. Selection of the IPP gene set was based on existing knowledge on genes related to relevant outcomes in sepsis (mortality prediction, sepsis-associated immunosuppression, susceptibility to secondary infections); technical performance of the selected targets in multiplex quantitative polymerase chain reaction (qPCR); and the goal to attain a balanced representation of pathways involved in sepsis immunopathology (such as monocyte anergy, antigen presentation, lymphocyte exhaustion, etc.) (26–29).
However, the performance of the whole IPP gene set to predict 30-day mortality in sepsis has not been evaluated in a large heterogeneous cohort of sepsis patients. To this end, we decided to: 1) collect publicly available microarray data sets of sepsis patients with patient-level information on mortality; (2) co-normalize data sets using COCONUT; (3) optimize ML models using the expression of the IPP gene set on day 1 following admission as input and 30-day mortality as the outcome of interest to evaluate the predictive performance of the IPP signature. Additional objectives were to evaluate if better predictive performances could be attained either by using another gene signature, or by using GE data sampled more than 2 days after hospital admission.
Methods
Data Collection and Pre-processing
We searched NCBI GEO and EMBL-EBI ArrayExpress databases for studies with the following inclusion criteria: (1) publicly available GE data from micro-array experiments collected by whole blood sampling, with at least one sample collected at day 1 following hospital or intensive care unit (ICU) admission; (2) adult or pediatric patients with sepsis, according to Sepsis-1 (30), Sepsis-2 (31) or Sepsis-3 (32) definitions; (3) individual patient data on mortality (assessed between 28 and 30 days after blood sampling); (4) at least 5 control patients (healthy volunteers or patients with non-septic inflammation), which was mandatory for co-normalization across studies. Data sets using endotoxin or lipopolysaccharide infusion as a model for inflammation or sepsis, as well as datasets derived from sorted cells and RNAseq experiments were excluded.
We collected normalized GE data from selected studies when it was available, and inspected normalization visually by plotting individual patient data for each study. In case normalized data was not available, raw GE data was downloaded and normalized using the gcRMA method (R package affy) for Affymetrix chips, and normal-exponential background corrected and quantile normalized (R package limma) for Agilent and Illumina chips. When several microarray probe sets pointed toward one common gene under the HUGO gene nomenclature data base, we used the collapseRows function in the R package WGCNA to select the probe set with the highest mean value (MaxMean method) (33).
Individual patient data related to demographics and clinical characteristics were also extracted when available, including data on age, gender, ethnicity, clinical severity scores, and bacterial vs. viral origin of sepsis.
Co-normalization Using COCONUT
Comparison of GE data from different microarray studies is limited by different background measurements for each gene between microarrays, and potential batch effects among studies using the same types of microarrays. To analyze pooled data from different studies, co-normalization methods must be applied in such a way that: (1) no bias is introduced that could influence final classification; (2) there should be no change in the distribution of a gene within a study; and (3) a gene should show the same range of distributions between studies after normalization (34). To this end, we used the R package COCONUT (35), which implements a modified version of the ComBat empirical Bayes normalization method (36), using the assumption that all healthy/control patients from different studies come from the same distribution. All cohorts are split into healthy/control and diseased (sepsis) patients; the healthy components undergo parametric ComBat co-normalization without covariates; the ComBat estimated parameters are obtained for each data set for the healthy/control component and then applied to the diseased component.
Model Selection, Performance Metrics, Hyperparameter Tuning
Prior to model training, we randomly split the ComBat-corrected GE data into a discovery data set (70%) and a validation data set (30%). The discovery set was used to train several classification algorithms, taking GE data related to the IPP genes as input and 30-day mortality as outcome: logistic regression with L1 (lasso), L2 (ridge) and mixed (elastic net) regularization, random forest, support vector machines with linear and radial kernels and partial least squares-discriminant analysis. Mortality was considered as a binary variable because time-to-event data were not available in most public data sets.
Hyperparameter optimization was performed to select models with the highest mean area under the receiver operating characteristic (ROC) curve (AUROC) using 5 repetitions of 10-fold cross-validation. Alternatively, the area under the precision recall curve (AUPRC) was used as a performance scoring metric because our discovery data set had an imbalanced distribution of the outcome (with ∼19% mortality) (37). Furthermore, to mitigate the negative impact of data imbalance on model training, we used several oversampling strategies, including the Synthetic Minority Oversampling Technique (SMOTE) on the discovery data set prior to hyperparameter tuning (38).
For each optimized model, we evaluated performance by computing the AUROC and its confidence interval (DeLong method) on the validation set.
Models and Feature Sets Comparisons
The IPP gene set contains 26 immune-related genes and 3 genes used for normalization, and we used those the total of 29 as input in the IPP models (Supplementary Table 1). To compare the predictive performance of the IPP gene set to that of the best possible signature derived from the pooled data set assembled from publicly available microarray data, we trained the same machine learning (ML) models, taking all genes common to all included studies as input (“all genes” models, n = 7,122 genes). To see if improvement in predictive performance from the IPP gene set to the total gene pool was due to the fact that the IPP gene set did not contain the best set of predictors, or solely a consequence of it having a limited number of predictors, we selected the 29 genes with the highest feature importance in the best performing “total gene pool” model and re-ran ML models using the “top 29 genes” set as input. Finally, we compared the IPP gene set to the “all genes” and “top 29 genes” sets by comparing ROC curves obtained by prediction on the validation set.
To determine if gene expression data could yield different predictive information on mortality if mRNA is sampled at time points beyond patient admission, we trained models on 2 data sets: (1) the “day 1” data set was a subset of the whole co-normalized data set, restricted to cohorts with available GE data for all the IPP genes, sampled at day 1 following enrolment; (2) the “day > 2” data set was a subset of the whole co-normalized data set, restricted to cohorts with available GE data for all the IPP genes, sampled at time points 3 to 7 days following enrolment. Each of these 2 data sets were split in discovery and validation sets as described above.
Finally, we sought to assess how IPP could be used as a tool for prognostication at the patient level. We used IPP models and found optimal thresholds of sensitivity and specificity using the top-left method on the “day 1” and “day > 2” data sets, enabling us to define 2 groups based on the predicted probability of death (low- and high-risk groups). Finally we computed and compared observed 30-day mortality rates in the low- and high-risk groups using appropriate statistical tests (see below).
Statistical Analysis and Software
To compare demographics and clinical features in the discovery and validation data sets, we used the Wilcoxon rank sum test. To compare predictive performance between models, we compared ROC curves computed using the same test set with DeLong’s test for correlated data. To compare proportions of dead patients between different risk groups obtained with IPP genes, we used the chi-squared test or Fisher’s exact test, as appropriate. Significance levels for p-values were set at 0.05 and analyses were two-tailed. Statistical analyses were performed using R (v3.6.2) with packages from the BioConductor library, the tidyverse collection, caret and COCONUT, as well as on Python 3 with the scikit-learn machine learning library.
Results
Studies Included in the Analysis, Discovery and Validation Sets
Twenty studies fulfilled our inclusion criteria (20, 39–58). Of these, three studies (40, 48, 56) did not contain data on three genes included in the IPP gene set (TDRD9, CD274 and ARL14EP) because associated probes were not on the chip used in these studies (Affymetrix Human Genome U133A 2.0 Array), and were subsequently removed from analysis.
The remaining 17 studies included 2,399 arrays, with 1,801 arrays from sepsis patients and 598 arrays from controls (Table 1). The “day 1” data set included 1,437 arrays sampled on sepsis patients at day 1, of whom 1,161 were alive and 276 (19.2%) were deceased at day 30 following enrolment. As presented in Table 2, demographics and clinical characteristics were similar in the discovery (n = 1,007) and validation (n = 430) sets obtained after random splitting of the “day 1” data set.
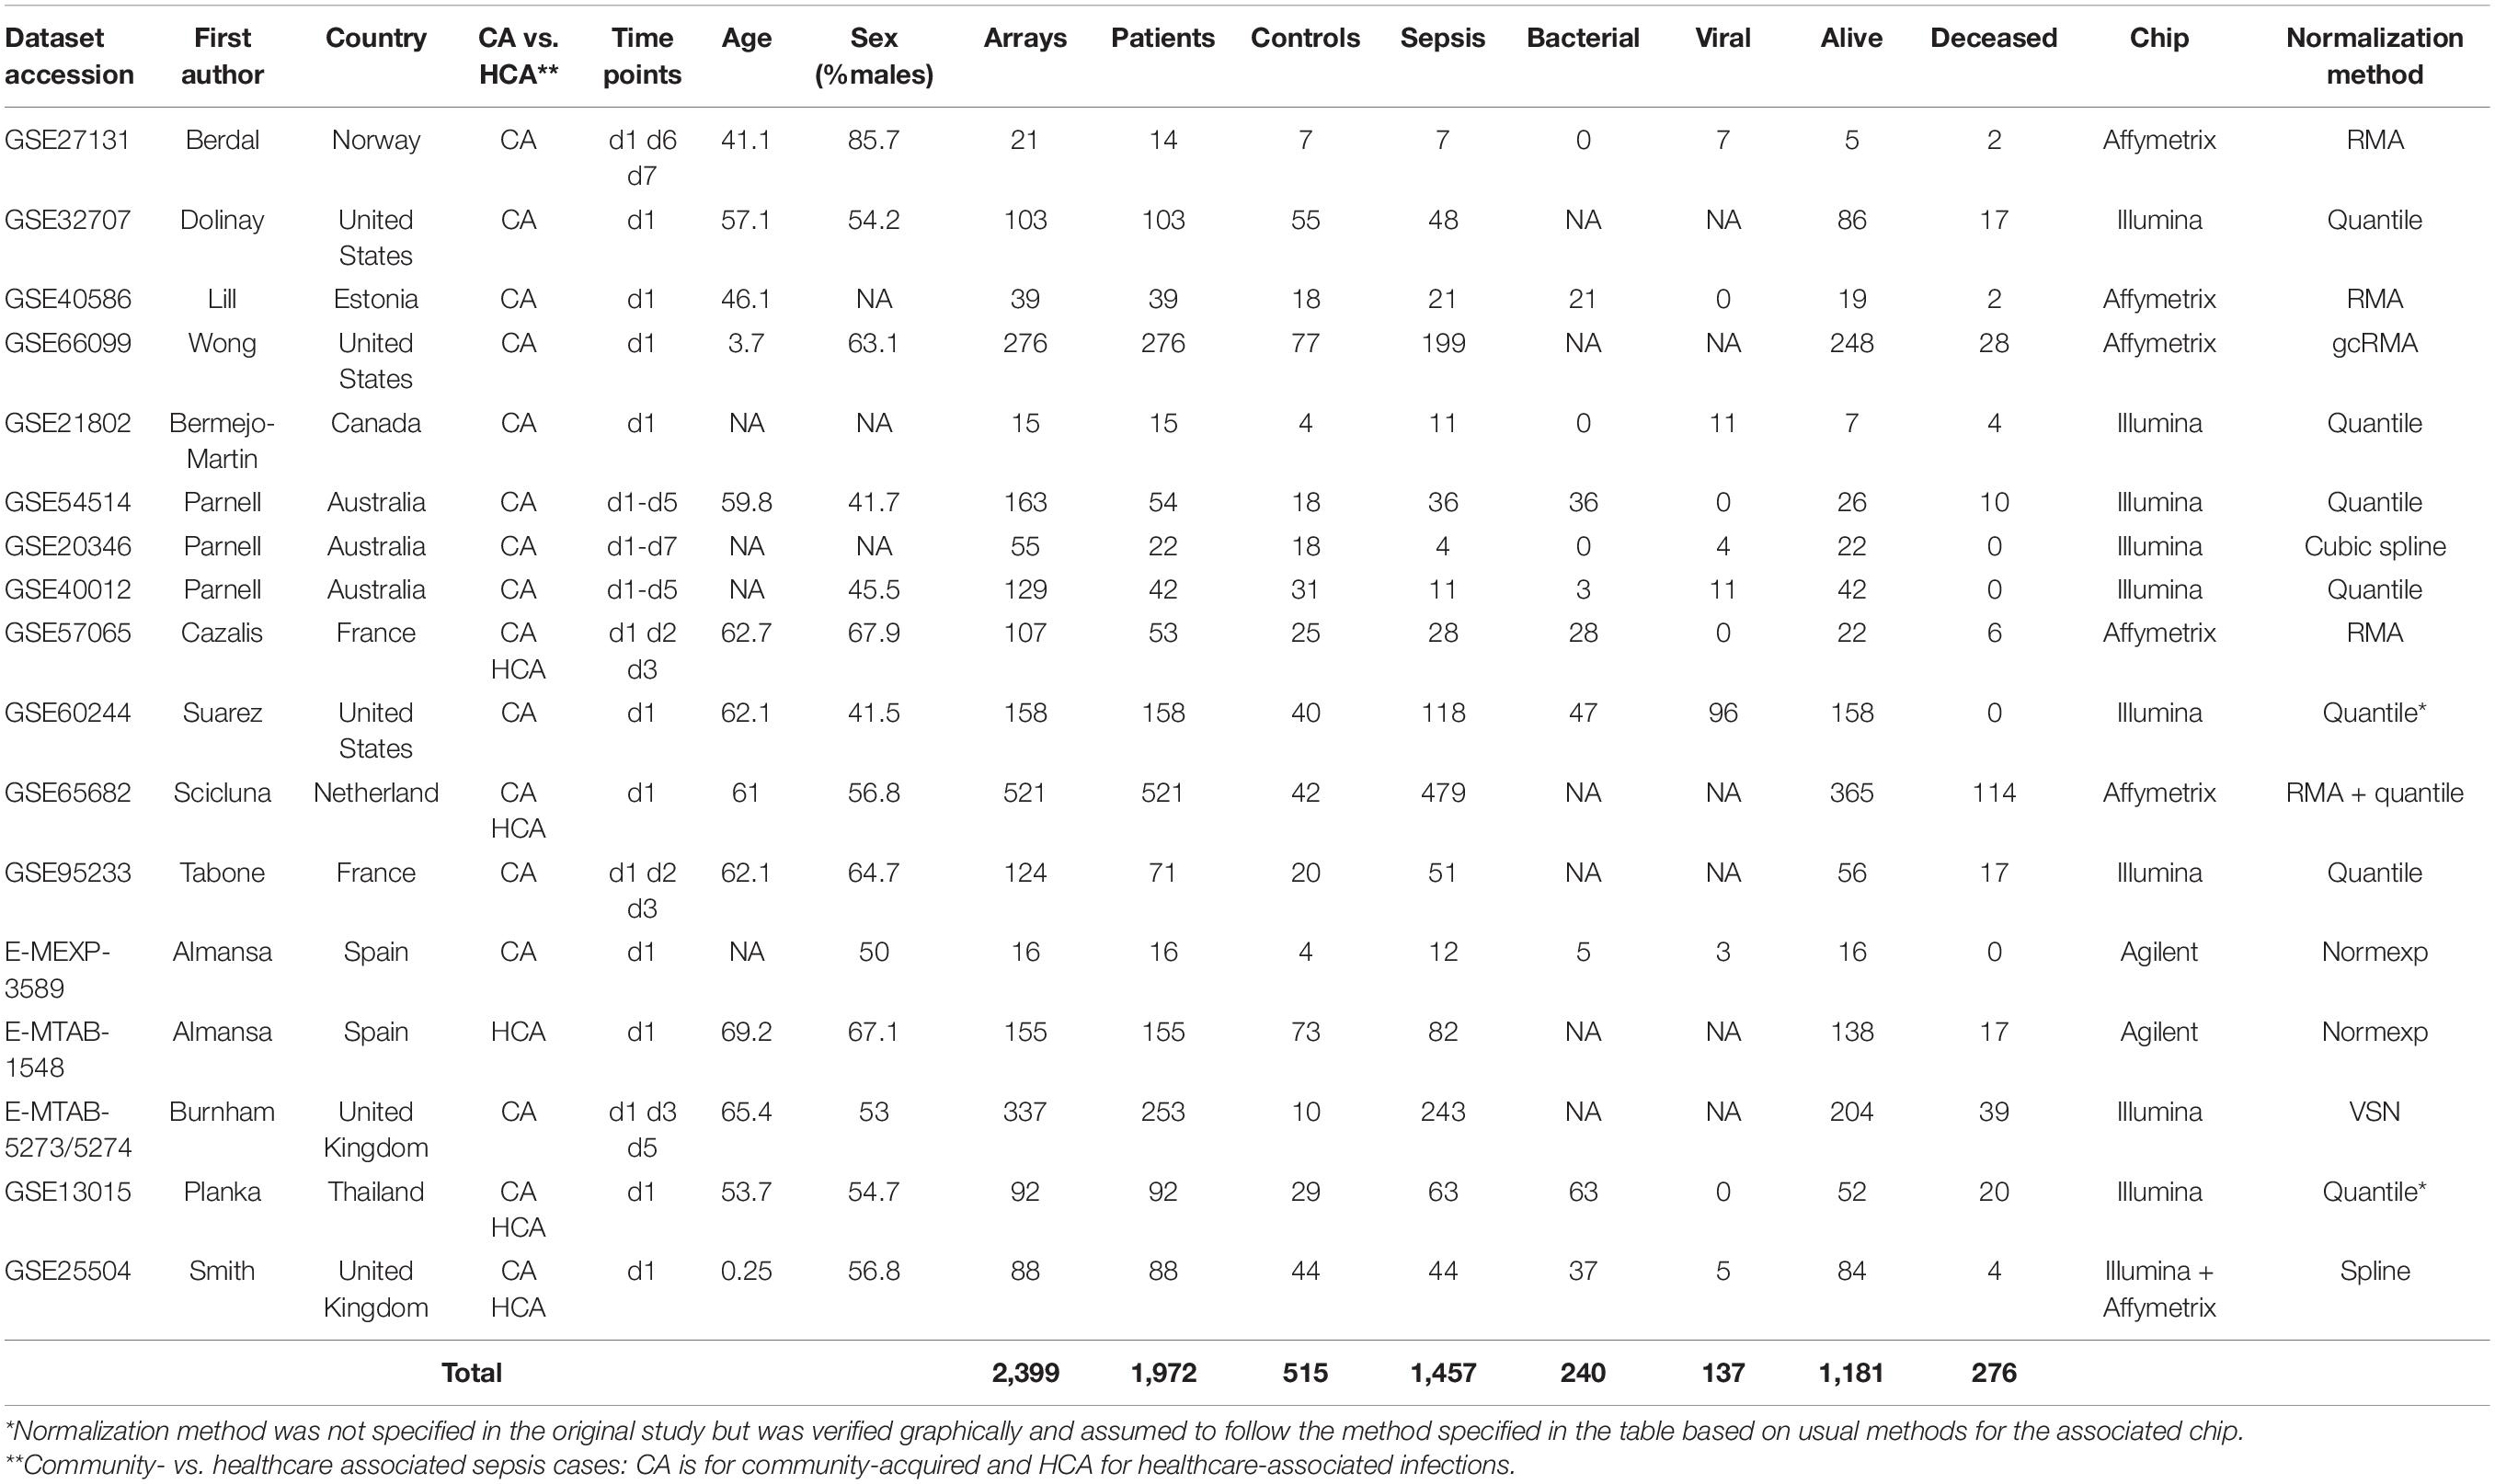
Table 1. Characteristics of the cohorts, patients and microarray data included in the study.
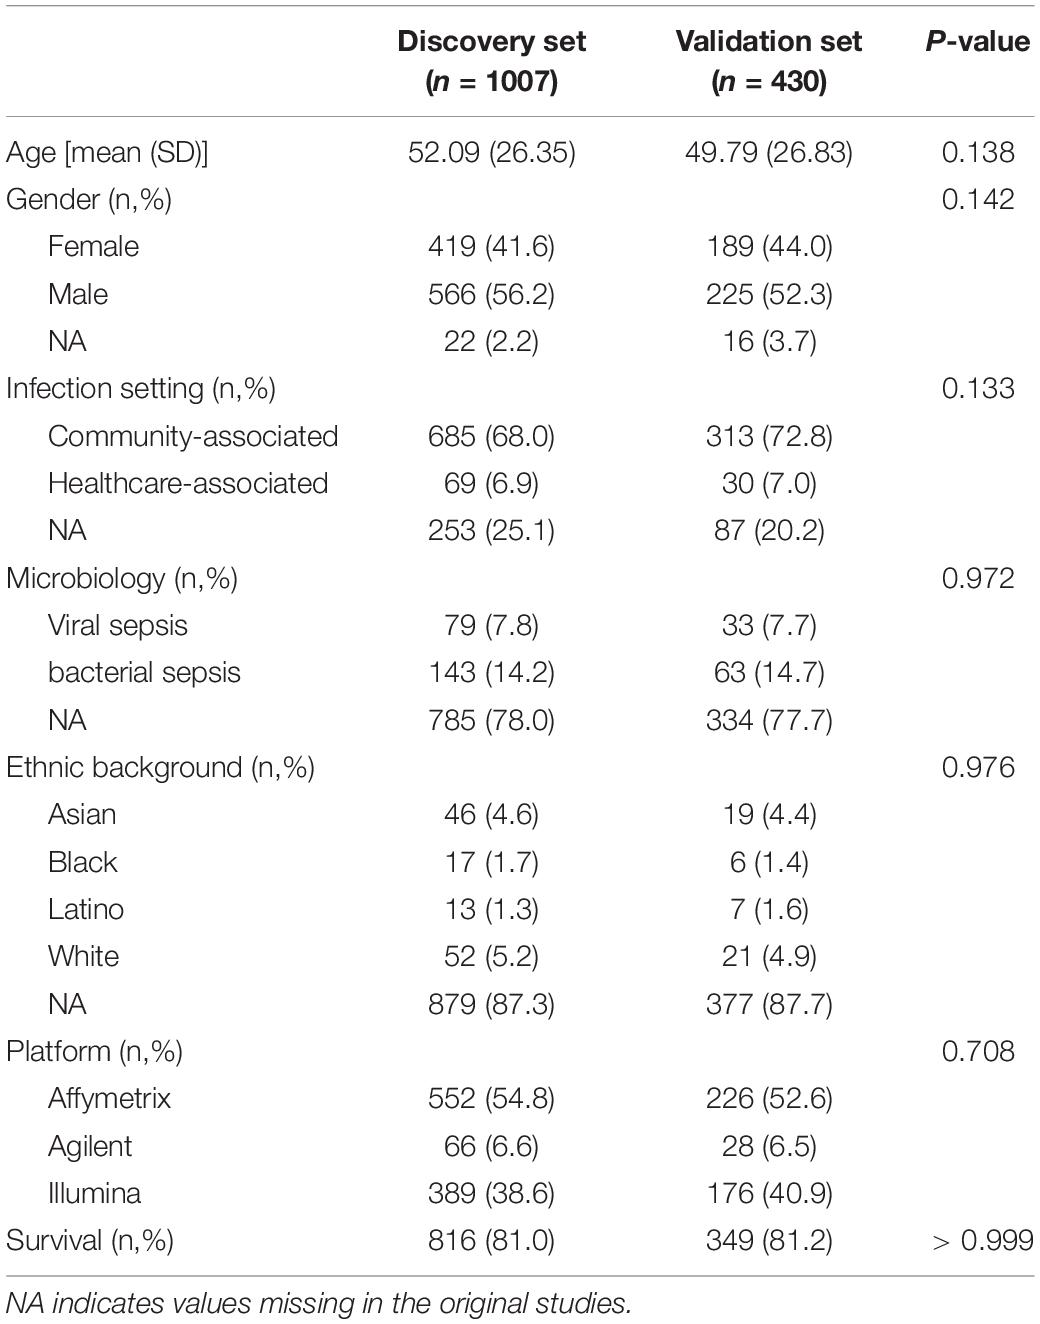
Table 2. Demographics and clinical characteristics in the discovery and validation sets computed with microarray data sampled at day 1 following study enrolment.
In the 7 studies (43, 45, 46, 51–53, 58) with GE data collected at time points 3 to 7, there were 270 arrays sampled on 173 patients, of whom 134 were alive and 39 (22.5%) deceased at day 30; 122 were used for training and 51 for testing models (Supplementary Tables 2, 3).
We ran the COCONUT algorithm on the 17 studies selected for analysis and assessed the effect of co-normalization: (1) on patient-level GE data across studies (Figure 1 and Supplementary Figure 1); (2) at the gene level in controls and cases (Supplementary Figure 2 presenting data for CD3D); (3) for 2 genes in controls and cases, here with CLDN8 (a housekeeping gene, with minimal difference in mean GE between controls and cases and minimal overall GE variance) and CEACAM1, up-regulated during sepsis (Supplementary Figure 3). As expected, visual inspection of these plots confirmed the effect of COCONUT to attenuate the “batch effect” across the selected 17 studies.
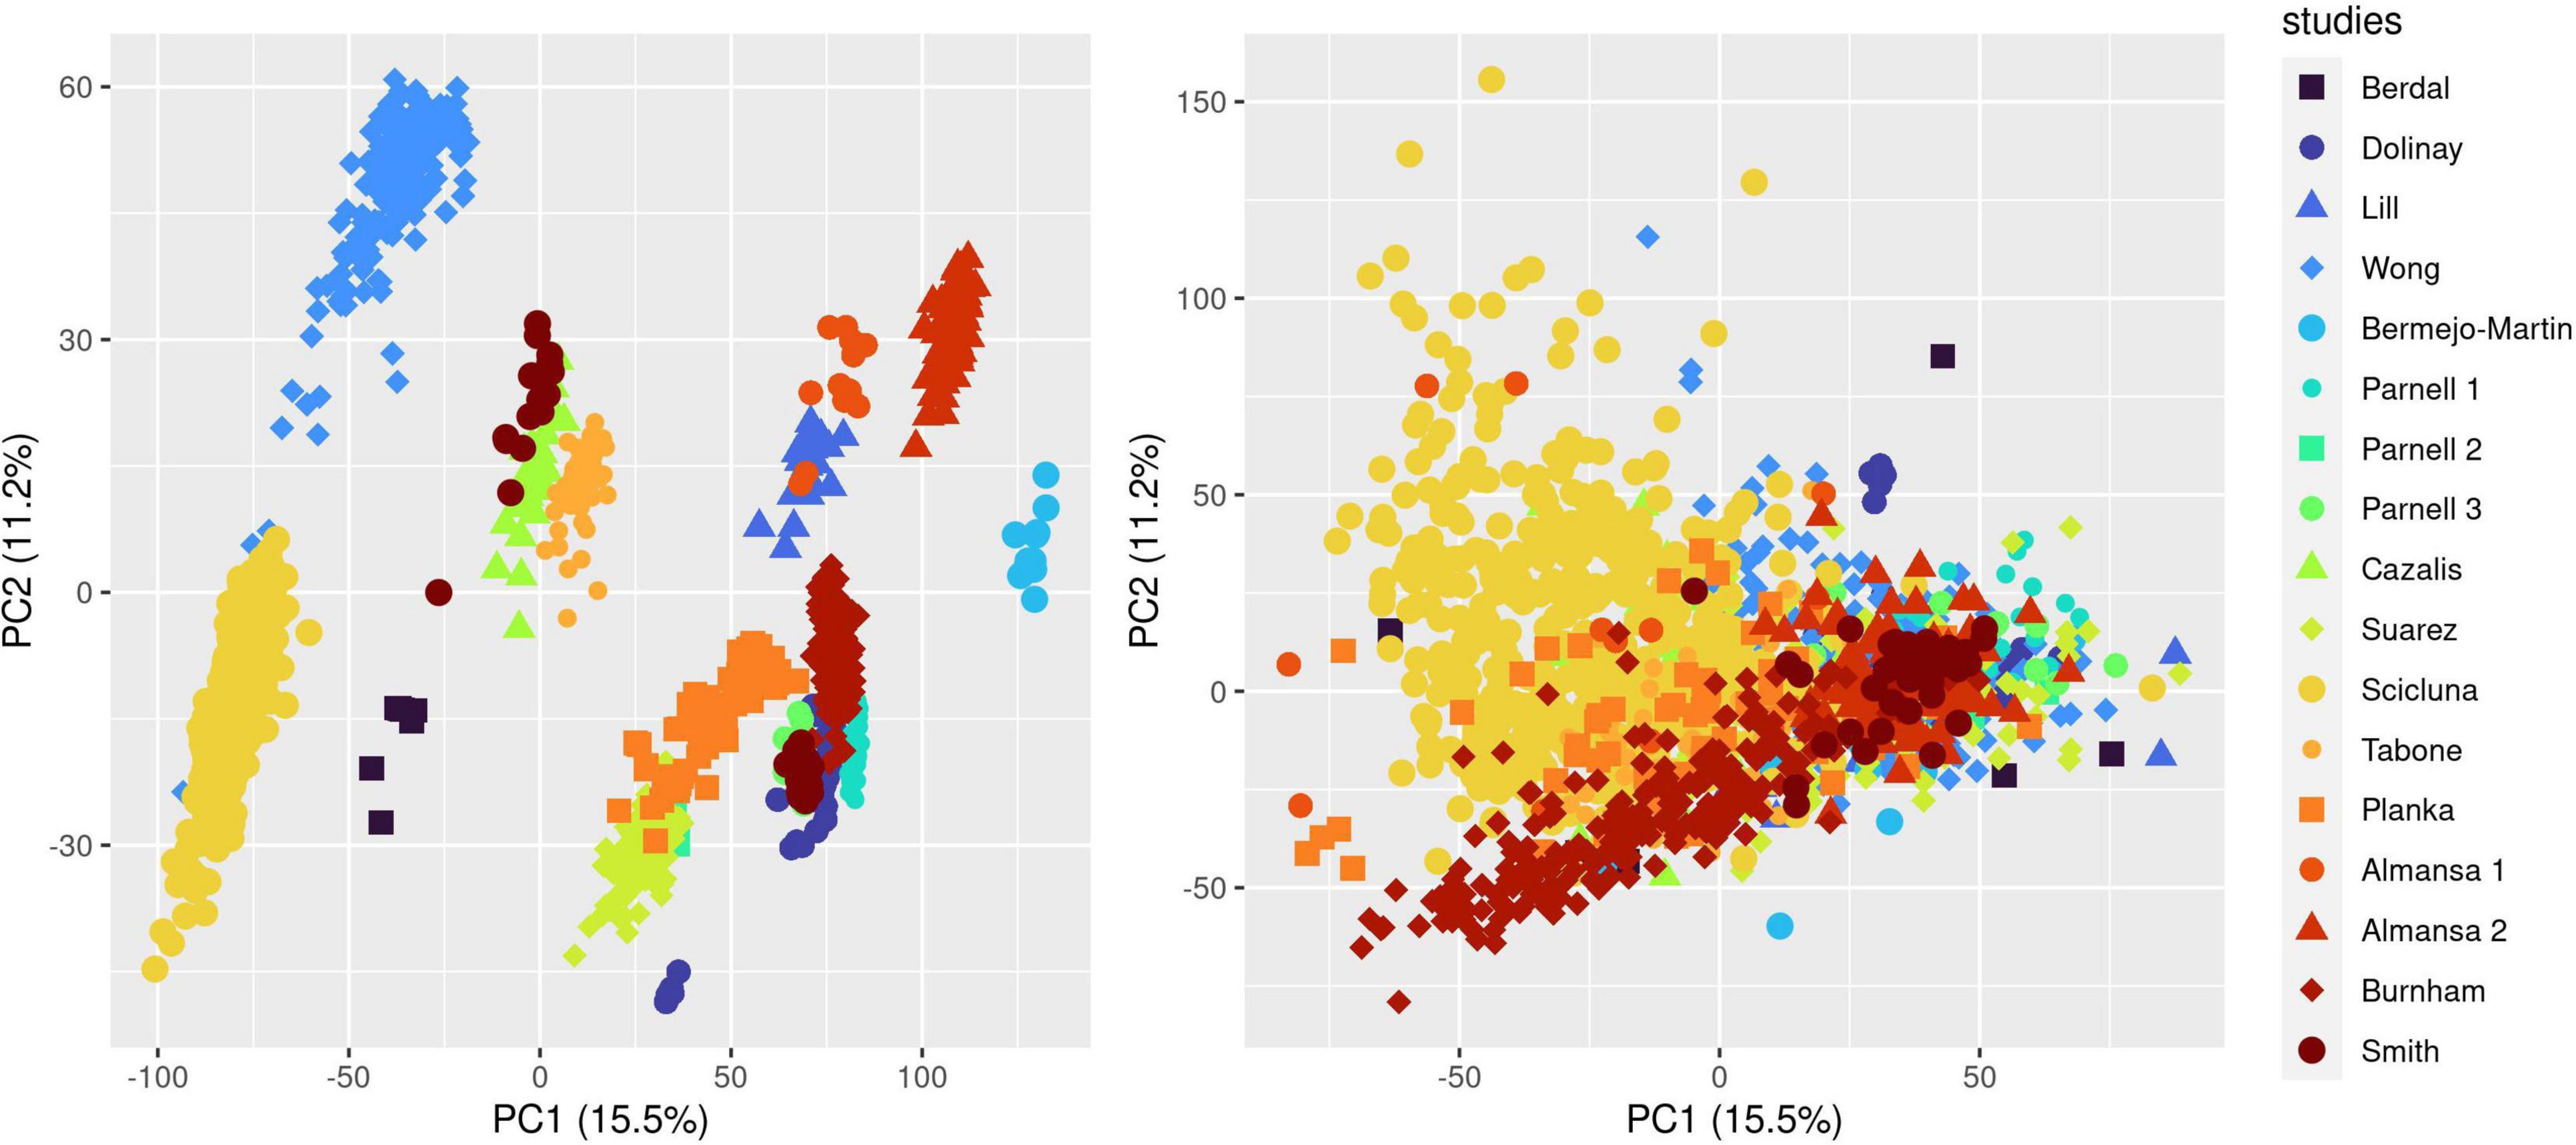
Figure 1. Effect of ComBat co-normalization on patient-level gene expression data assessed by principal component analysis (PCA) across 17 microarray studies. We computed a 2-dimensional PCA plot of individual gene expression data from sepsis patients at day 1 following admission (7,122 genes assessed on 1,437 arrays sampled on 1,437 patients) before (left panel) and after (right panel) ComBat co-normalization using controls with the COCONUT R package. Each of the 17 studies maps to one color, showing how co-normalization attenuates the segregation of individual data points in clusters determined by the study to which they belong.
Predictive Performances of the IPP Gene Set at Day 1 Following Admission
First, we sought to determine the performance of the IPP gene set to predict 30-day mortality using GE data sampled on the day of patient admission. As shown in Figures 2, 3, the highest predictive performance was obtained by training of a random forest classifier, with an AUROC computed on the validation set of 0.710 (CI 0.652–0.768). Next, to determine if better predictive performance could be extracted from other genes, we ran the same models using all the genes common to the 17 selected studies as input. We found that the highest predictive performance of the “all genes” set (n = 7,122 genes) was obtained by training of an L2-penalized logistic regression classifier, with an AUROC computed on the validation set of 0.755 (CI 0.697–0.813), which was not statistically different from the performance obtained with the IPP gene set (p = 0.286). In such a logistic regression classifier, it is possible to extract the genes with the highest absolute value of regression coefficients, indicative of the highest predictive performance. Thus, we subsequently trained ML algorithms with the 29 genes with the highest feature importance in the “all genes” model, and obtained an AUROC of 0.727 (CI 0.670–0.785, p = 0.610 in comparison to the IPP gene set). In conclusion, we found that the IPP gene set conveyed useful information to predict 30-day mortality with GE data assayed upon patient admission. Furthermore, we found evidence that the predictive power of the IPP gene set was equivalent to the best performing signature extracted from the 17 studies included in our multi-cohort ComBat-normalized data set.
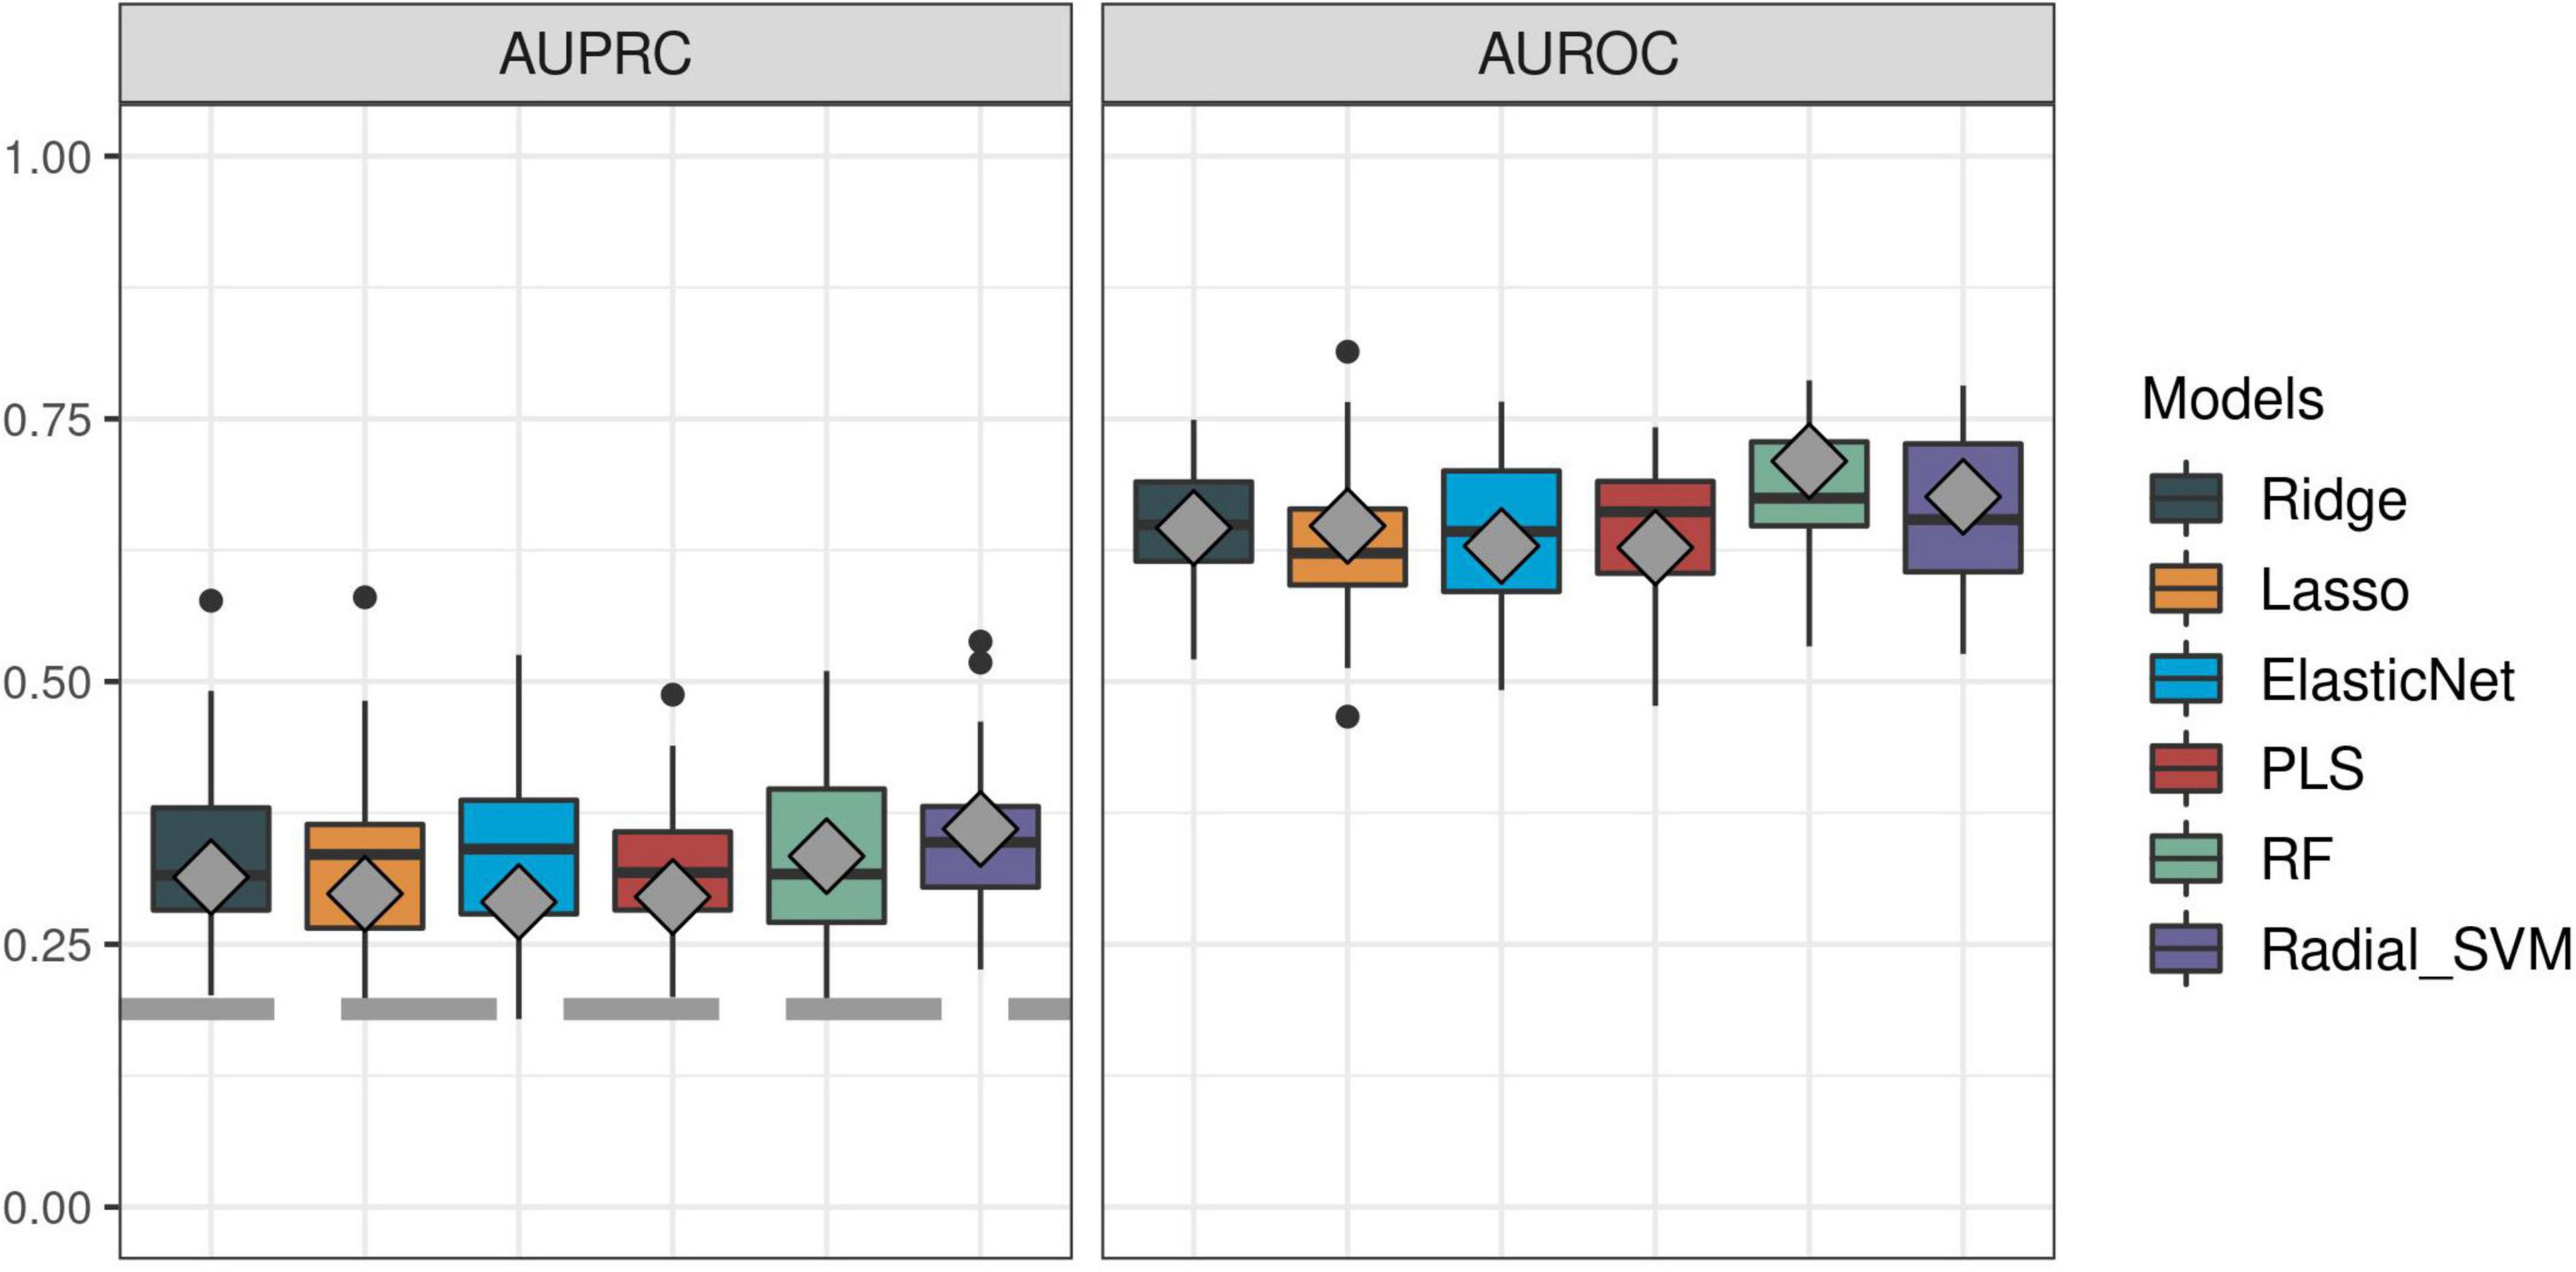
Figure 2. Predictive performance of the IPP gene set on “day 1” discovery and validation sets. We trained machine learning models on the “day 1” discovery (n = 1,007) and validation (n = 430) data sets by 5 repeats of 10-fold cross-validation, and computed areas under the receiver operating characteristic (AUROC, right panel) and precision-recall curves (AUPRC, left panel) on the resampled discovery set (box plots) and by prediction on the validation set (gray diamonds). Gray dashed line on the AUPRC facet indicates baseline probability of the outcome (death).
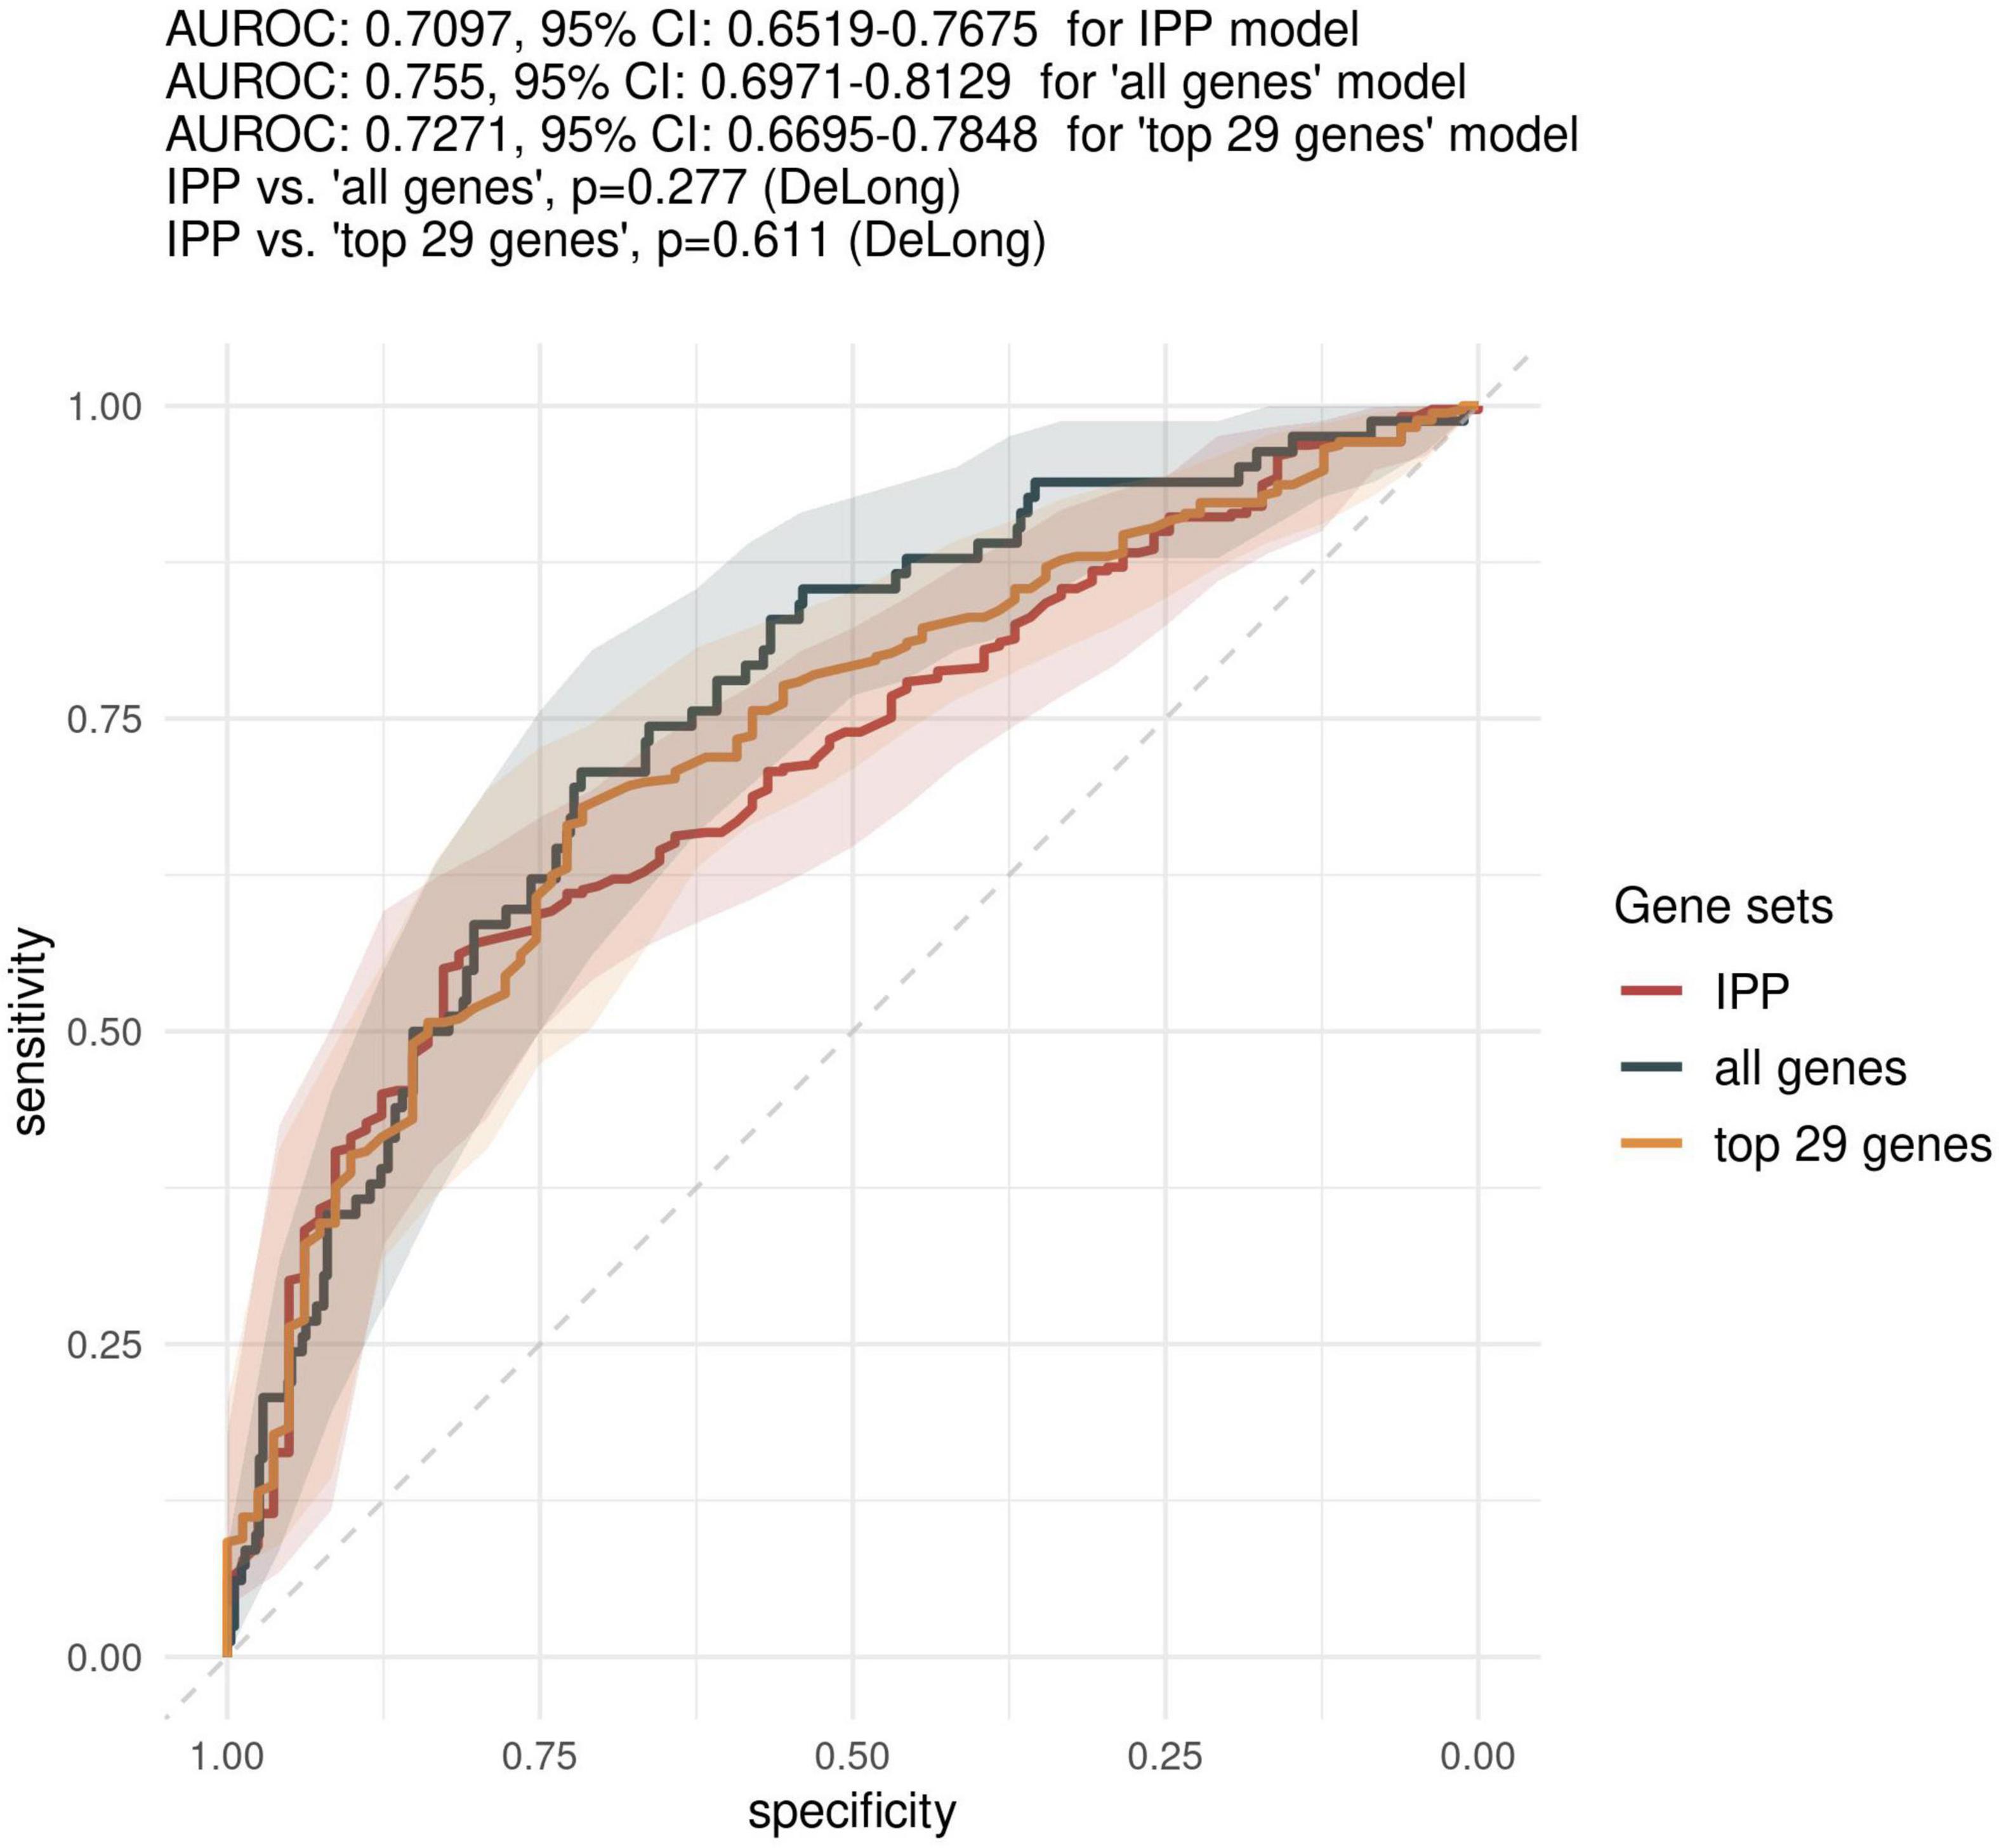
Figure 3. Comparison of predictive performances of the IPP gene set with that obtained with other genes on the “day 1” data set. We compared the predictive performance of the IPP gene set to that obtained with other genes common to the 17 microarray studies by computing ROC curves obtained by prediction on the validation set with IPP, “all genes” and “top 29 genes” models trained on GE data collected at day 1 following admission. Gray areas indicate 95% confidence intervals of corresponding AUROCs.
Predictive Performances at Time Points > Day 2 Following Admission
Because most of the existing literature on sepsis immunology has shown that more relevant information can be obtained when assessing biomarkers later in the course of disease, we sought to investigate the predictive performance of the IPP gene set when GE data is measured on day 3 following admission or later. As shown in Figure 4, the highest performance of the IPP gene set at days > 2 following admission to predict 30-day mortality was obtained by training of a random forest classifier, with an AUROC computed on the validation set of 0.804 (CI 0.643–0.964). Here again, we found that the IPP gene set yielded similar information to the total gene pool, as we obtained an AUROC on the validation set of 0.787 (CI 0.610–0.965, p = 0.811) in the “all genes” best model.
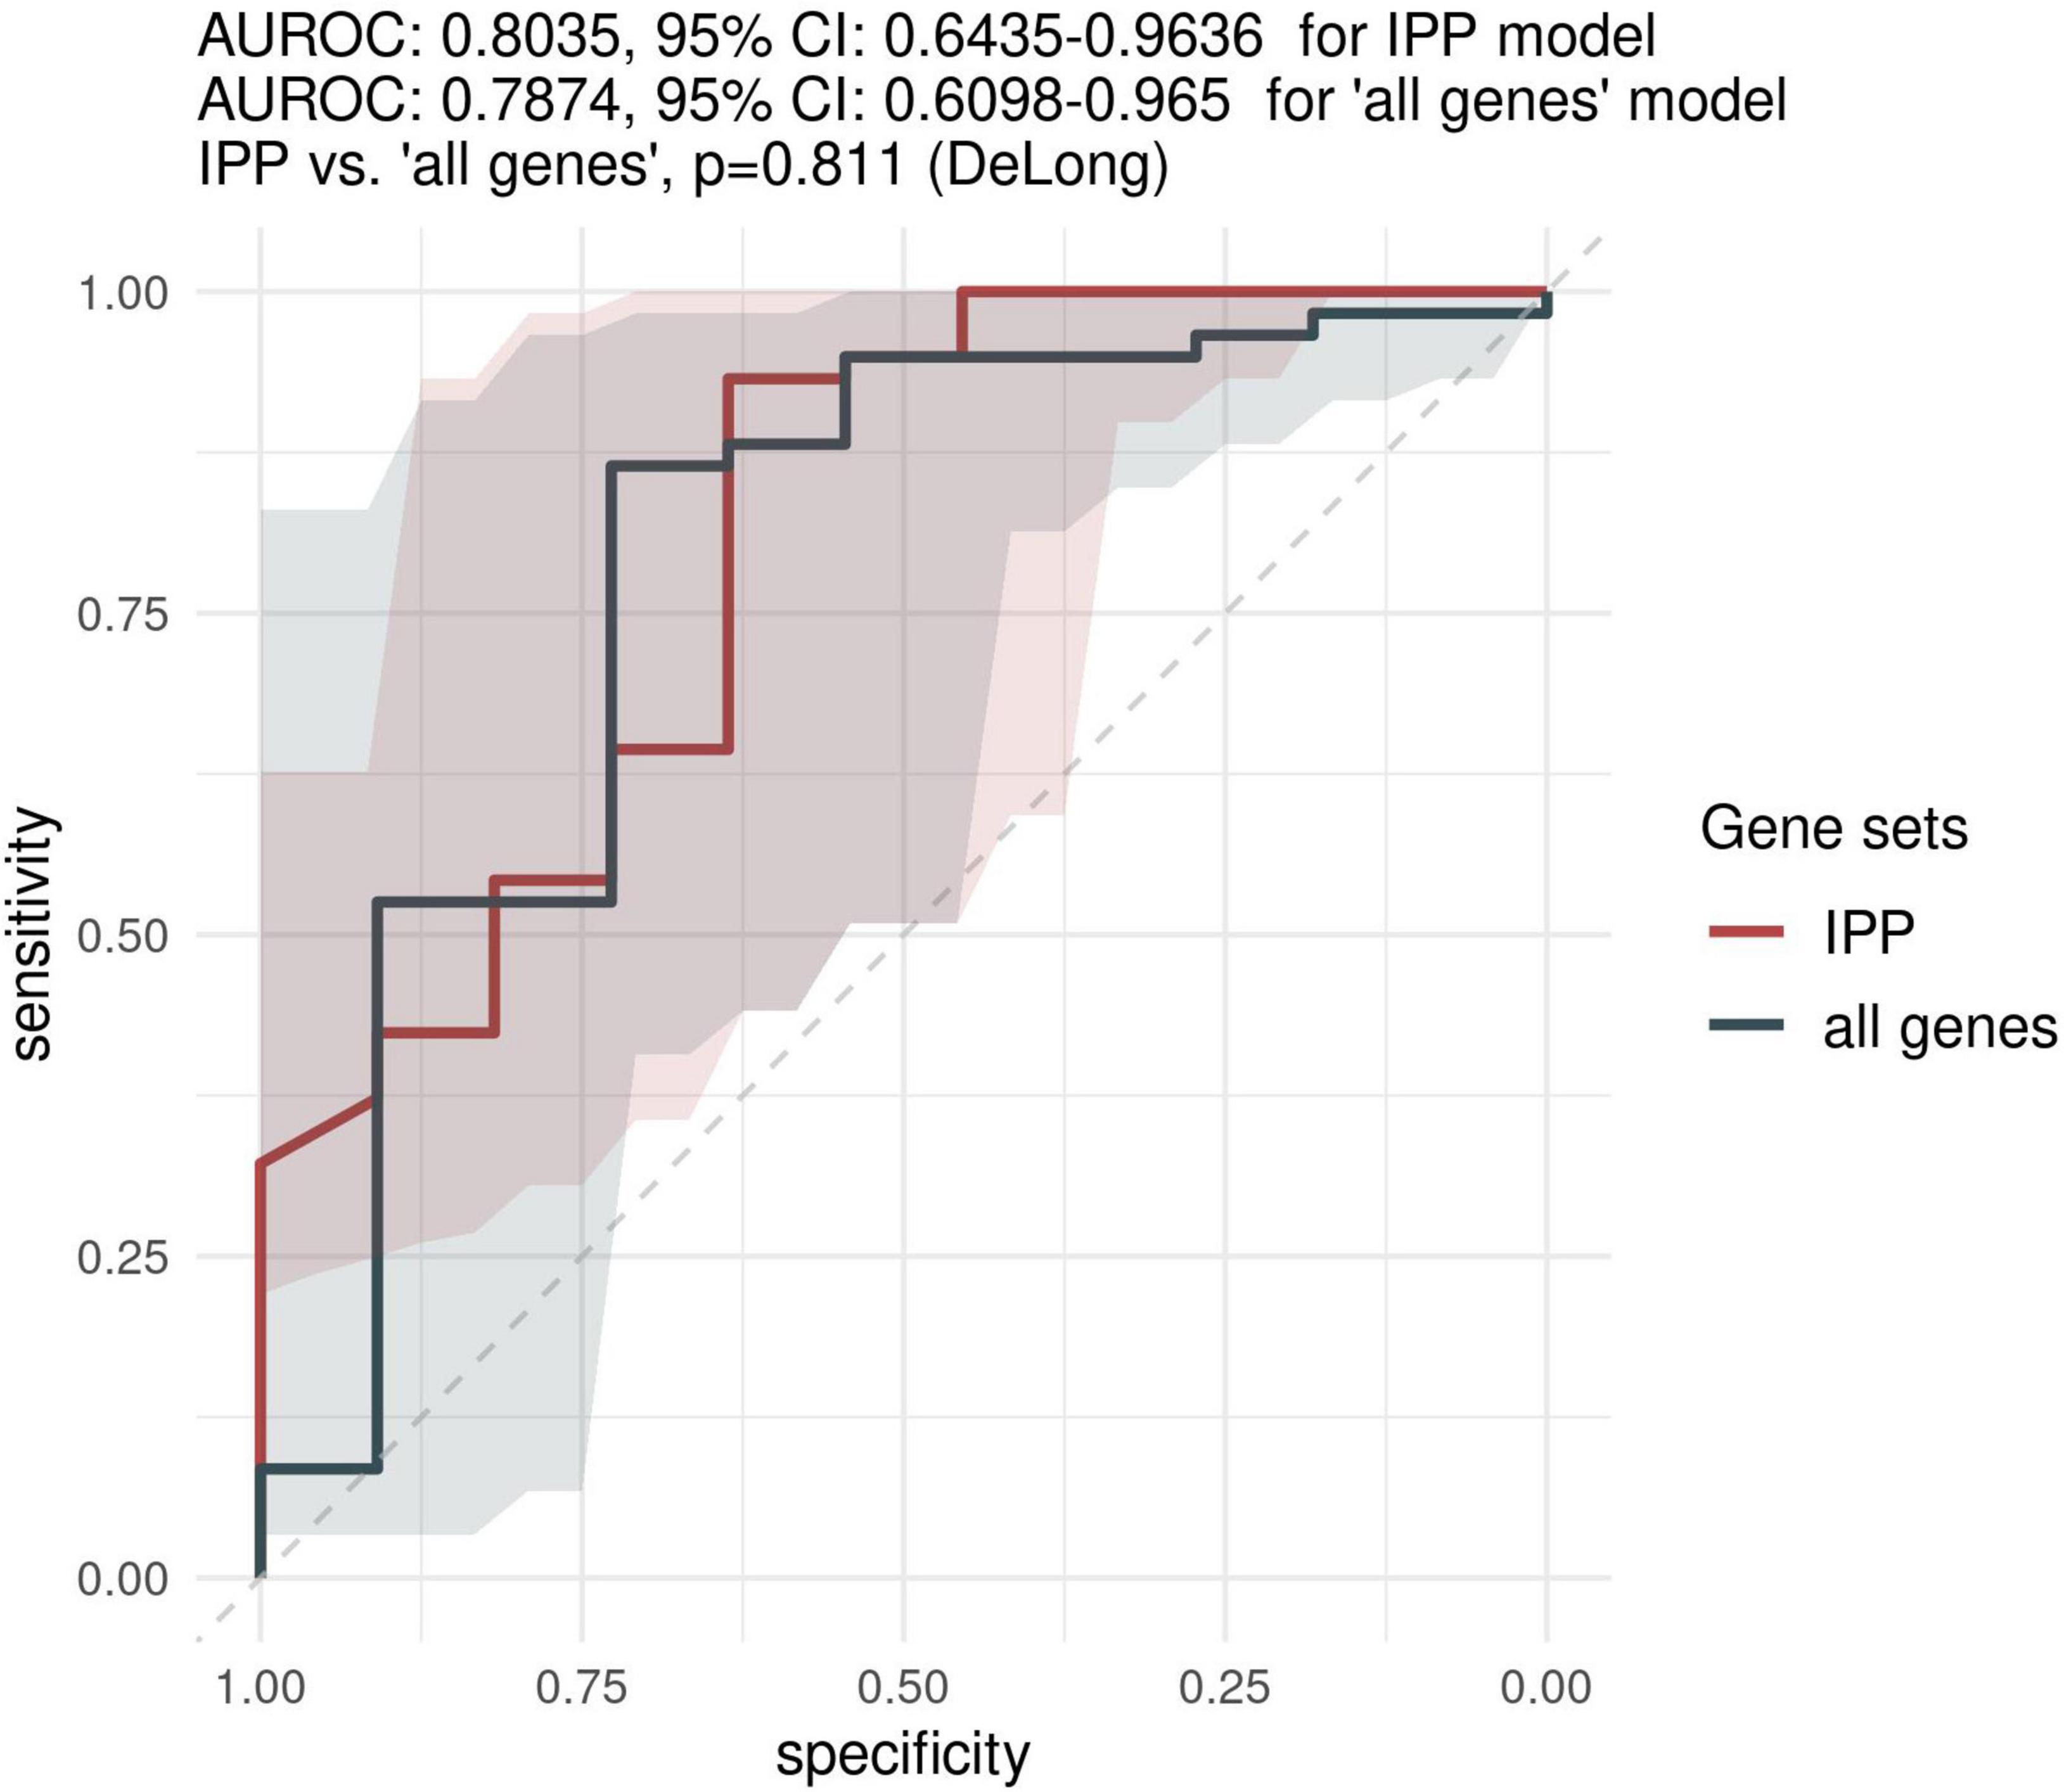
Figure 4. Predictive performance of the IPP gene set on the “days > 2” data set. We assessed the predictive performance of the IPP and “all genes” set by computing ROC curves on the validation set.
Interest of IPP for Prognostic Enrichment
The ROC curve provides generic information on the performance of a binary classifier over a range of possible thresholds, but this information might be of limited relevance to clinicians aiming to determine the probability of an event for a specific patient, given the result of the test. To investigate how IPP could be used for prognostic enrichment, we used the optimized ML models obtained with the “day 1” and “days > 2” discovery data sets, computed ROC curves based on predictions on the validation sets, extracted thresholds based on the closest top-left method, and calculated the mortality rates in patients of the validation sets below (low-risk group) and above (high-risk group) this threshold.
As shown in Figure 5, using gene expression data from the “day 1” data set, 30.2% (CI 24.2–36.8%) of patients in the high-risk group were dead at day 30, as compared to 7.4% (CI 4.3–11.8%, p-value < 10E-8) in the low-risk group. Furthermore, using gene expression data from the “days > 2” data set, we found that 63.6% (CI 30.8–89.1%) of patients in the high-risk group were dead at day 30, compared to 8.5% (CI 2.8–18.7%, p-value < 10E-4) in the low-risk group. This indicated that using IPP at the bedside could help clinicians identify a sub-group of patients with higher 30-day mortality early-on during the course of sepsis.
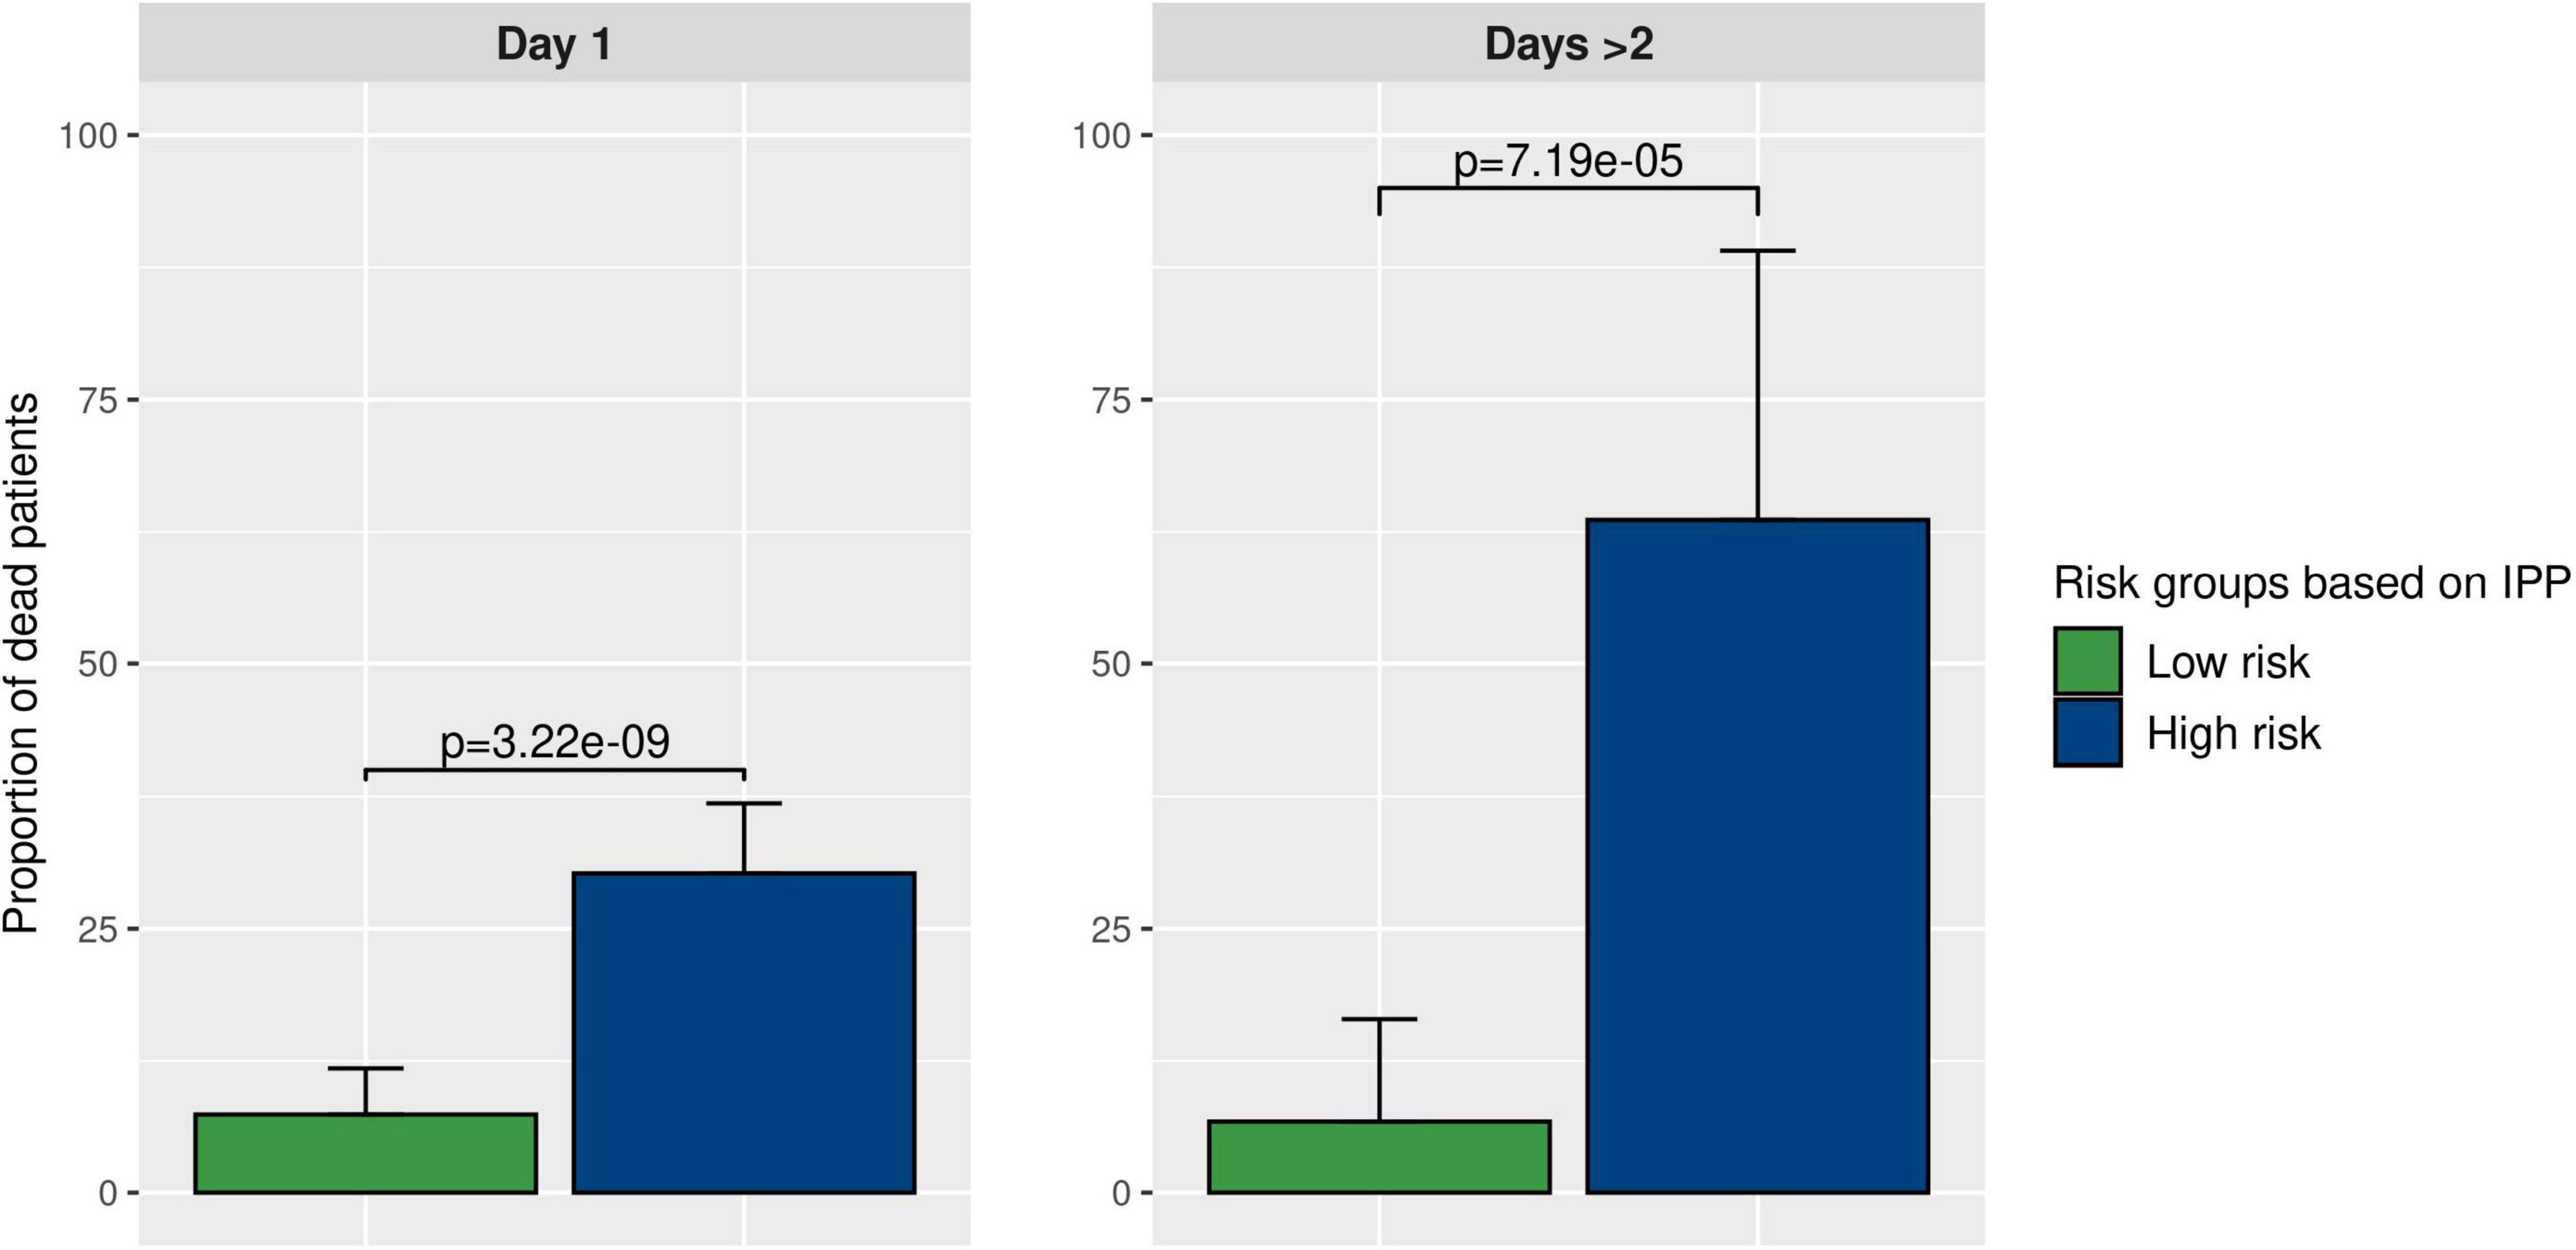
Figure 5. Prognostic enrichment with the IPP tool. We used the best IPP models (trained on the “day 1” and “days > 2” discovery sets) and computed a test threshold using the top-left method on corresponding validation sets. This enabled us to divide the validation sets in 2 sub-groups with a low and a high predicted risk of death. Then, we compared the actual proportion of sepsis patients deceased at day 30 in both sub-groups, to assess if IPP could be used for prognostic enrichment at the bedside.
Discussion
The main finding of our study is that the IPP gene set has good overall performance to predict 30-day mortality, as assessed using microarray data sampled at day 1 following admission in a large and heterogeneous cohort of sepsis patients, with best model showing an AUROC of 0.710 (95% CI 0.652–0.768). IPP was designed using existing knowledge on sepsis immunology and pathophysiology, with the aim to assess the immune system of sepsis patients in a multifaceted manner, and this study demonstrates that the selected immune-related genes also provide predictive information on all-cause mortality. Furthermore, this information can be captured using retrospective and highly heterogeneous data collected on microarrays, even though the IPP tool is based on a PCR assay.
Importantly, predictive performance obtained with all the genes common to all microarrays (>7,000 genes) was not statistically different from that obtained with the IPP genes. It is still possible that the IPP gene set does not capture all the information available in GE data to predict 30-day mortality, but for important technical reasons (e.g., the limited multiplexing capabilities of most commercially available PCR-based assays), models including a large feature set would not be easy to implement at the bedside. This would mandate finding the optimal trade-off between statistical performance and technical constraints to identify the best number of features to include in the assay. Furthermore, models with a high number of predictors are prone to overfitting, which could limit the prognostic accuracy of gene sets across different technological platforms or in different clinical settings. Overall, these results demonstrate that the IPP gene set can capture similar information on 30-day mortality in sepsis as the total gene pool common to 17 microarrays, but with the potential to deliver actionable results in less than an hour, directly at the point of care.
One key aspect of our analysis pipeline is the use of publicly available GE data and batch-effect correction using the ComBat algorithm, which follows a strategy developed by a group from Stanford University (22, 34, 39, 59). Conceptually, pooling together highly heterogeneous data collected in different clinical settings has the potential to increase the generalizability of gene signatures to populations with different ethnic backgrounds and disease phenotypes. However, one can question the relevance of this approach when looking in detail at the wide variability in the demographics and clinical characteristics of the patients included in our multi-cohort analysis. Whether or not there are in fact shared pathophysiological mechanisms and common immunological pathways in children vs. adults, in viral vs. bacterial sepsis, or in ICU vs. ward patients, remains to be fully investigated to demonstrate the usefulness of this strategy.
The IPP prototype has been designed to be run on a dedicated real-time multiplex PCR platform, whereas GE data used in our analysis was collected on microarrays, which raises the question of cross-platform transferability of transcriptomics assays. Given the sometimes weak correlation in expression levels of the same gene target measured on one given sample but different technology, it is highly possible that the real association between our gene signature (as measured with the IPP tool) and 30-day mortality might not be accurately recapitulated in our study. While many gene signatures have been devised for diagnosis and prediction in sepsis, none so far has been proven robust enough to be translated into a clinically usable tool, in part because good statistical performance seen during the conception phase was not reproduced on prospectively collected new patient data, especially if analyzed on a different platform (60). In recent studies for instance, a gene signature devised using microarray data did not show major improvement in predictive power compared to usual severity scores (SAPS 3 and APACHE II) when tested on prospectively collected patient samples processed on the NanoString nCounter platform (60, 61). In line with this, a prospective multicenter study [IMPACCT (62)] is currently enrolling sepsis patients to better evaluate the predictive performance of the IPP gene set when used on its dedicated platform.
Independent of the question of cross-platform transferability, transcriptomics-based diagnostic tools in sepsis might fail to take into account all the relevant information available to predict key outcomes. For instance, there are validated and widely-used clinical severity scores that can predict mortality in intensive care patients with moderate discrimination but wide generalizability and at virtually no added cost. Thus, when evaluating a transcriptomics-based tool, we should verify that GE data provide information independently of the clinical scores. This question was assessed in the Stanford multi-cohort analysis on mortality prediction by running models including both clinical and transcriptomics data, and evaluating the independent effect of GE data on mortality prediction. These analyses showed a consistent (yet not always large) improvement in AUROCs when using genes in addition to clinical data as input (23). Unfortunately, we were not able to run the same analyses, as the majority of publicly available data sets we used did not report patient-level clinical severity data (and because studies that did report data on clinical severity used a wide range of severity scores, limiting their use in our multi-cohort analysis framework). In the same line, it can be argued that for both, clinical and methodological considerations, it would be interesting to include in our prediction models patient-level data on demographics, clinical characteristics and therapeutics (such a steroids, which are known to influence shock severity and sepsis mortality (63), and are also potentially responsible for a change in immune-related GE profile). This argues in favor of prospectively collecting more high quality data on sepsis patients to refine prediction models that would include all relevant information, including clinical and biological, but also genetic, epigenetic, microbiological (etc.), data.
Another inherent limitation of this work is that even though mortality is widely considered an important patient-centered outcome, it is influenced by myriad factors, including many that are not easily modified through medical intervention, which makes it difficult to predict accurately using easily available patient data. Furthermore, it can be argued that even a perfectly calibrated mortality prediction model would fall short of having a positive impact on an individual patient’s care if not coupled with a set of clinical measures meant to improve patient outcomes. In line with this, models designed to predict healthcare-associated infections (HAIs) may be more valuable to clinicians, as they could enable identification of high-risk patients that could be targeted by preventive bundles of cares [e.g., early removal of invasive devices, which are associated with the occurrence of HAIs (12)]. Maybe even more importantly, models designed to identify sepsis endotypes could lead to targeted immune stimulating therapies (10, 64).
Finally, our study suggests that GE data has better performance to predict mortality when mRNA is sampled on day 3 or later following hospital admission. This finding is in line with numerous reports on sepsis biomarkers used to predict mortality or hospital-acquired infections, which consistently show higher performances when biomarkers are assayed after day 3–4 (17, 65). This is also consistent with accumulating data on sepsis immunology, indicating that sepsis-acquired immunosuppression develops in a subset of patients with a worse prognosis only after a few days of acute inflammation (10, 66, 67). Thus, our findings confirm that a transcriptomics tool assessing the host response of sepsis patients to predict mortality could yield more reliable information if assayed at later time points. However, our data must be interpreted with caution, as there were a limited number of patients with GE data available at time points > 2 days, with only 122 patients in the discovery set and 51 (including 11 deaths) in the validation set. In line with this, evaluating if serial measurements of biomarkers can be used to recapitulate disease trajectories in sepsis, and whether this information can be helpful in refining the definition of sepsis endotypes, is the subject of active research (68).
Conclusion
Through multi-cohort analysis using ComBat co-normalization on microarray data in a heterogeneous group of sepsis patients, we found that the IPP gene set, when assayed at day 1 following hospital admission, can reliably predict all-cause 30-day mortality. Our data also suggest that more information could be extracted from mRNA data if sampled at later time points, when immunological trajectories begin to diverge between sepsis survivors and patients who will eventually die. Since mortality prediction in sepsis is of limited interest to clinicians if not coupled with specific interventions meant to influence disease trajectory and prognosis, using IPP to identify sepsis endotypes or predict HAI is more likely to have a positive impact on the care of patients with sepsis.
Data Availability Statement
The raw and normalized gene expression data sets analyzed in this study, data on patient demographics, clinical characteristics and outcomes have been deposited publicly and are available from referenced studies and from Synapse (doi: 10.7303/syn5612563). The code written for co-normalization across studies and assessment of predictive performance of gene signatures is available at: https://github.com/lkreitmann-bmx/IPP_mortality_2022.
Ethics Statement
Ethical review and approval was not required for the study on human participants in accordance with the local legislation and institutional requirements. Written informed consent to participate in this study was provided by the participants’ legal guardian/next of kin.
Author Contributions
SB, KB-P, and LK: study conception and design. LK, MB, KI, and SB: statistical analysis. M-AC, EP, and EC: data curation. LK: manuscript drafting. AF, CT, FC, J-FL, JT, and GM: critical revision. All authors contributed to the article and approved the submitted version.
Funding
This study was funded through bioMérieux SA, Hospices Civils de Lyon and Université Claude Bernard Lyon 1. The funders had the following involvement with the study: study design, data collection and analysis, decision to publish, or preparation of the manuscript.
Conflict of Interest
The IPP gene set has been filed for patent protection. LK was employed by, and has received research funding by bioMérieux. MB, AF, KI, M-AC, EP, EC, CT, J-FL, JT, SB, and KB-P were employed by bioMérieux.
The remaining authors declare that the research was conducted in the absence of any commercial or financial relationships that could be construed as a potential conflict of interest.
Publisher’s Note
All claims expressed in this article are solely those of the authors and do not necessarily represent those of their affiliated organizations, or those of the publisher, the editors and the reviewers. Any product that may be evaluated in this article, or claim that may be made by its manufacturer, is not guaranteed or endorsed by the publisher.
Acknowledgments
We thank Amy J. Davis for reviewing of the manuscript.
Supplementary Material
The Supplementary Material for this article can be found online at: https://www.frontiersin.org/articles/10.3389/fmed.2022.930043/full#supplementary-material
Abbreviations
AUPRC, area under the precision recall curve; AUROC, area under the receiving operating characteristics curve; COCONUT, COmbat CO-normalization Using coNTrols; GE, gene expression; GM-CSF, granulocyte macrophage-colony stimulating factor; IFN- γ, interferon gamma; IL, interleukin; IPP, immune profiling panel; mHLA-DR, human leukocyte antigen–DR; ML, machine learning; PCR, polymerase chain reaction.
References
2. Vincent J-L, Marshall JC, Namendys-Silva SA, François B, Martin-Loeches I, Lipman J, et al. Assessment of the worldwide burden of critical illness: the intensive care over nations (ICON) audit. Lancet Respir Med. (2014) 2:380–6. doi: 10.1016/S2213-2600(14)70061-X
3. Quenot J-P, Binquet C, Kara F, Martinet O, Ganster F, Navellou J-C, et al. The epidemiology of septic shock in French intensive care units: the prospective multicenter cohort EPISS study. Crit Care Lond Engl. (2013) 17:R65. doi: 10.1186/cc12598
4. Alhazzani W, Møller MH, Arabi YM, Loeb M, Gong MN, Fan E, et al. Surviving sepsis campaign: guidelines on the management of critically ill adults with coronavirus disease 2019 (COVID-19). Intensive Care Med. (2020) 46:854–87.
5. Cohen J, Vincent J-L, Adhikari NKJ, Machado FR, Angus DC, Calandra T, et al. Sepsis: a roadmap for future research. Lancet Infect Dis. (2015) 15:581–614.
6. Rello J, van Engelen TSR, Alp E, Calandra T, Cattoir V, Kern WV, et al. Towards precision medicine in sepsis: a position paper from the European society of clinical microbiology and infectious diseases. Clin Microbiol Infect Off Publ Eur Soc Clin Microbiol Infect Dis. (2018) 24:1264–72. doi: 10.1016/j.cmi.2018.03.011
7. Marshall JC. Why have clinical trials in sepsis failed? Trends Mol Med. (2014) 20:195–203. doi: 10.1016/j.molmed.2014.01.007
8. Opal SM, Dellinger RP, Vincent J-L, Masur H, Angus DC. The next generation of sepsis trials: What’s next after the demise of recombinant human activated Protein C? Crit Care Med. (2014) 42:1714–21.
9. Hotchkiss RS, Moldawer LL, Opal SM, Reinhart K, Turnbull IR, Vincent J-L. Sepsis and septic shock. Nat Rev Dis Primer. (2016) 2:16045.
10. Hotchkiss RS, Monneret G, Payen D. Sepsis-induced immunosuppression: from cellular dysfunctions to immunotherapy. Nat Rev Immunol. (2013) 13:862–74. doi: 10.1038/nri3552
11. Hawkins RB, Raymond SL, Stortz JA, Horiguchi H, Brakenridge SC, Gardner A, et al. Chronic critical illness and the persistent inflammation, immunosuppression, and catabolism syndrome. Front Immunol. (2018) 9:1511. doi: 10.3389/fimmu.2018.01511
12. Vught LA, Klouwenberg PMCK, Spitoni C, Scicluna BP, Wiewel MA, Horn J, et al. Incidence, risk factors, and attributable mortality of secondary infections in the intensive care unit after admission for sepsis. JAMA. (2016) 315:1469–79. doi: 10.1001/jama.2016.2691
13. Prescott HC, Osterholzer JJ, Langa KM, Angus DC, Iwashyna TJ. Late mortality after sepsis: propensity matched cohort study. BMJ. (2016) 353:i2375. doi: 10.1136/bmj.i2375
14. Peters van Ton AM, Kox M, Abdo WF, Pickkers P. Precision immunotherapy for sepsis. Front Immunol. (2018) 9:1926. doi: 10.3389/fimmu.2018.01926
16. van Engelen TSR, Wiersinga WJ, Scicluna BP, van der Poll T. Biomarkers in sepsis. Crit Care Clin. (2018) 34:139–52.
17. Monneret G, Lepape A, Voirin N, Bohé J, Venet F, Debard A-L, et al. Persisting low monocyte human leukocyte antigen-DR expression predicts mortality in septic shock. Intensive Care Med. (2006) 32:1175–83. doi: 10.1007/s00134-006-0204-8
18. Meisel C, Schefold JC, Pschowski R, Baumann T, Hetzger K, Gregor J, et al. Granulocyte-macrophage colony-stimulating factor to reverse sepsis-associated immunosuppression: a double-blind, randomized, placebo-controlled multicenter trial. Am J Respir Crit Care Med. (2009) 180:640–8. doi: 10.1164/rccm.200903-0363OC
19. Maslove DM, Wong HR. Gene expression profiling in sepsis: timing, tissue, and translational considerations. Trends Mol Med. (2014) 20:204–13. doi: 10.1016/j.molmed.2014.01.006
20. Scicluna BP, van Vught LA, Zwinderman AH, Wiewel MA, Davenport EE, Burnham KL, et al. Classification of patients with sepsis according to blood genomic endotype: a prospective cohort study. Lancet Respir. (2017) 5:816–26. doi: 10.1016/S2213-2600(17)30294-1
21. Davenport EE, Burnham KL, Radhakrishnan J, Humburg P, Hutton P, Mills TC, et al. Genomic landscape of the individual host response and outcomes in sepsis: a prospective cohort study. Lancet Respir Med. (2016) 4:259–71. doi: 10.1016/S2213-2600(16)00046-1
22. Mayhew MB, Buturovic L, Luethy R, Midic U, Moore AR, Roque JA, et al. A generalizable 29-mRNA neural-network classifier for acute bacterial and viral infections. Nat Commun. (2020) 11:1177. doi: 10.1038/s41467-020-14975-w
23. Sweeney TE. A community approach to mortality prediction in sepsis via gene expression analysis. Nat Commun. (2018) 9:694. doi: 10.1038/s41467-018-03078-2
24. Tawfik DM, Vachot L, Bocquet A, Venet F, Rimmelé T, Monneret G, et al. Immune profiling panel: a proof-of-concept study of a new multiplex molecular tool to assess the immune status of critically ill patients. J Infect Dis. (2020) 222:S84–95. doi: 10.1093/infdis/jiaa248
25. Tawfik DM, Lankelma JM, Vachot L, Cerrato E, Pachot A, Wiersinga WJ, et al. Comparison of host immune responses to LPS in human using an immune profiling panel, in vivo endotoxemia versus ex vivo stimulation. Sci Rep. (2020) 10:9918. doi: 10.1038/s41598-020-66695-2
26. Cazalis M-A, Friggeri A, Cavé L, Demaret J, Barbalat V, Cerrato E, et al. Decreased HLA-DR antigen-associated invariant chain (CD74) mRNA expression predicts mortality after septic shock. Crit Care Lond Engl. (2013) 17:R287. doi: 10.1186/cc13150
27. Delwarde B, Peronnet E, Venet F, Cerrato E, Meunier B, Mouillaux J, et al. Low interleukin-7 receptor messenger RNA expression is independently associated with day 28 mortality in septic shock patients. Crit Care Med. (2018) 46:1739–46. doi: 10.1097/CCM.0000000000003281
28. Peronnet E, Venet F, Maucort-Boulch D, Friggeri A, Cour M, Argaud L, et al. Association between mRNA expression of CD74 and IL10 and risk of ICU-acquired infections: a multicenter cohort study. Intens Care Med. (2017) 43:1013–20. doi: 10.1007/s00134-017-4805-1
29. Friggeri A, Cazalis M-A, Pachot A, Cour M, Argaud L, Allaouchiche B, et al. Decreased CX3CR1 messenger RNA expression is an independent molecular biomarker of early and late mortality in critically ill patients. Crit Care Lond Engl. (2016) 20:204. doi: 10.1186/s13054-016-1362-x
30. Bone RC, Balk RA, Cerra FB, Dellinger RP, Fein AM, Knaus WA, et al. Definitions for sepsis and organ failure and guidelines for the use of innovative therapies in sepsis. Chest. (1992) 101:1644–55.
31. Levy MM, Fink MP, Marshall JC, Abraham E, Angus D, Cook D, et al. 2001 SCCM/ESICM/ACCP/ATS/SIS international sepsis definitions conference. Crit Care Med. (2003) 31:1250–6.
32. Singer M, Deutschman CS, Seymour CW, Shankar-Hari M, Annane D, Bauer M, et al. The third international consensus definitions for sepsis and septic shock (Sepsis-3). JAMA. (2016) 315:801–10.
33. Miller JA, Cai C, Langfelder P, Geschwind DH, Kurian SM, Salomon DR, et al. Strategies for aggregating gene expression data: the collapseRows R function. BMC Bioinformatics. (2011) 12:322. doi: 10.1186/1471-2105-12-322
34. Sweeney TE, Wong HR, Khatri P. Robust classification of bacterial and viral infections via integrated host gene expression diagnostics. Sci Transl Med. (2016) 8:ra91–346. doi: 10.1126/scitranslmed.aaf7165
35. Sweeney TE. COCONUT: COmbat CO-Normalization Using conTrols (COCONUT). (2017). Available online at: https://CRAN.R-project.org/package=COCONUT (accessed June 1, 2022).
36. Johnson WE, Li C, Rabinovic A. Adjusting batch effects in microarray expression data using empirical Bayes methods. Biostat Oxf Engl. (2007) 8:118–27. doi: 10.1093/biostatistics/kxj037
37. Davis J, Goadrich M. The Relationship Between Precision-Recall and ROC Curves. Proceedings of the 23rd International Conference on Machine Learning. Helsinki: ICML (2006).
38. Chawla NV, Bowyer KW, Hall LO, Kegelmeyer WP. SMOTE: synthetic Minority Over-sampling Technique. J Artif Intell Res. (2002) 16:321–57. doi: 10.1186/1756-0381-6-16
39. Sweeney TE, Shidham A, Wong HR, Khatri P. A comprehensive time-course–based multicohort analysis of sepsis and sterile inflammation reveals a robust diagnostic gene set. Sci Transl Med. (2015) 7:ra71–287. doi: 10.1126/scitranslmed.aaa5993
40. Ahn SH, Tsalik EL, Cyr DD, Zhang Y, van Velkinburgh JC, Langley RJ, et al. Gene expression-based classifiers identify Staphylococcus aureus infection in mice and humans. PLoS One. (2013) 8:e48979. doi: 10.1371/journal.pone.0048979
41. Almansa R, Heredia-Rodríguez M, Gomez-Sanchez E, Andaluz-Ojeda D, Iglesias V, Rico L, et al. Transcriptomic correlates of organ failure extent in sepsis. J Infect. (2015) 70:445–56. doi: 10.1016/j.jinf.2014.12.010
42. Almansa R, Socias L, Sanchez-Garcia M, Martín-Loeches I, del Olmo M, Andaluz-Ojeda D, et al. Critical COPD respiratory illness is linked to increased transcriptomic activity of neutrophil proteases genes. BMC Res Notes. (2012) 5:401. doi: 10.1186/1756-0500-5-401
43. Berdal J-E, Mollnes TE, Wæhre T, Olstad OK, Halvorsen B, Ueland T, et al. Excessive innate immune response and mutant D222G/N in severe A (H1N1) pandemic influenza. J Infect. (2011) 63:308–16. doi: 10.1016/j.jinf.2011.07.004
44. Bermejo-Martin JF, Martin-Loeches I, Rello J, Antón A, Almansa R, Xu L, et al. Host adaptive immunity deficiency in severe pandemic influenza. Crit Care. (2010) 14:R167. doi: 10.1186/cc9259
45. Burnham KL, Davenport EE, Radhakrishnan J, Humburg P, Gordon AC, Hutton P, et al. Shared and distinct aspects of the sepsis transcriptomic response to fecal peritonitis and pneumonia. Am J Respir Crit Care Med. (2016) 196:328–39. doi: 10.1164/rccm.201608-1685OC
46. Cazalis M-A, Lepape A, Venet F, Frager F, Mougin B, Vallin H, et al. Early and dynamic changes in gene expression in septic shock patients: a genome-wide approach. Intensive Care Med Exp. (2014) 2:20. doi: 10.1186/s40635-014-0020-3
47. Dolinay T, Kim YS, Howrylak J, Hunninghake GM, An CH, Fredenburgh L, et al. Inflammasome-regulated cytokines are critical mediators of acute lung injury. Am J Respir Crit Care Med. (2012) 185:1225–34. doi: 10.1164/rccm.201201-0003OC
48. Howrylak JA, Dolinay T, Lucht L, Wang Z, Christiani DC, Sethi JM, et al. Discovery of the gene signature for acute lung injury in patients with sepsis. Physiol Genomics. (2009) 37:133–9. doi: 10.1152/physiolgenomics.90275.2008
49. Lill M, Kõks S, Soomets U, Schalkwyk LC, Fernandes C, Lutsar I, et al. Peripheral blood RNA gene expression profiling in patients with bacterial meningitis. Front Neurosci. (2013) 7:33. doi: 10.3389/fnins.2013.00033
50. Pankla R, Buddhisa S, Berry M, Blankenship DM, Bancroft GJ, Banchereau J, et al. Genomic transcriptional profiling identifies a candidate blood biomarker signature for the diagnosis of septicemic melioidosis. Genome Biol. (2009) 10:R127. doi: 10.1186/gb-2009-10-11-r127
51. Parnell G, McLean A, Booth D, Huang S, Nalos M, Tang B. Aberrant cell cycle and apoptotic changes characterise severe influenza A infection–a meta-analysis of genomic signatures in circulating leukocytes. PLoS One. (2011) 6:e17186. doi: 10.1371/journal.pone.0017186
52. Parnell GP, McLean AS, Booth DR, Armstrong NJ, Nalos M, Huang SJ, et al. A distinct influenza infection signature in the blood transcriptome of patients with severe community-acquired pneumonia. Crit Care Lond Engl. (2012) 16:R157. doi: 10.1186/cc11477
53. Parnell GP, Tang BM, Nalos M, Armstrong NJ, Huang SJ, Booth DR, et al. Identifying key regulatory genes in the whole blood of septic patients to monitor underlying immune dysfunctions. Shock Augusta Ga. (2013) 40:166–74. doi: 10.1097/SHK.0b013e31829ee604
54. Suarez NM, Bunsow E, Falsey AR, Walsh EE, Mejias A, Ramilo O. Superiority of transcriptional profiling over procalcitonin for distinguishing bacterial from viral lower respiratory tract infections in hospitalized adults. J Infect Dis. (2015) 212:213–22. doi: 10.1093/infdis/jiv047
55. Tsalik EL, Henao R, Nichols M, Burke T, Ko ER, McClain MT, et al. Host gene expression classifiers diagnose acute respiratory illness etiology. Sci Transl Med. (2016) 8:ra11–322. doi: 10.1126/scitranslmed.aad6873
56. Tsalik EL, Langley RJ, Dinwiddie DL, Miller NA, Yoo B, van Velkinburgh JC, et al. An integrated transcriptome and expressed variant analysis of sepsis survival and death. Genome Med. (2014) 6:111. doi: 10.1186/s13073-014-0111-5
57. Smith CL, Dickinson P, Forster T, Craigon M, Ross A, Khondoker MR, et al. Identification of a human neonatal immune-metabolic network associated with bacterial infection. Nat Commun. (2014) 5:4649. doi: 10.1038/ncomms5649
58. Tabone O, Mommert M, Jourdan C, Cerrato E, Legrand M, Lepape A, et al. Endogenous retroviruses transcriptional modulation after severe infection, trauma and burn. Front Immunol. (2018) 9:3091. doi: 10.3389/fimmu.2018.03091
59. Sweeney TE, Azad TD, Donato M, Haynes WA, Perumal TM, Henao R, et al. Unsupervised analysis of transcriptomics in bacterial sepsis across multiple datasets reveals three robust clusters. Crit Care Med. (2018) 46:915–25. doi: 10.1097/CCM.0000000000003084
60. Brakenridge SC, Starostik P, Ghita G, Midic U, Darden D, Fenner B, et al. A transcriptomic severity metric that predicts clinical outcomes in critically ill surgical sepsis patients. Crit Care Explor. (2021) 3:e0554. doi: 10.1097/CCE.0000000000000554
61. Moore AR, Roque J, Shaller BT, Asuni T, Remmel M, Rawling D, et al. Prospective validation of an 11-gene mRNA host response score for mortality risk stratification in the intensive care unit. Sci Rep. (2021) 11:13062. doi: 10.1038/s41598-021-91201-7
62. European Union. IMPACCT Study. (2022). Available online at: https://eithealth.eu/product-service/impacct/ (accessed June 1, 2022).
63. Rochwerg B, Oczkowski SJ, Siemieniuk RAC, Agoritsas T, Belley-Cote E, D’Aragon F, et al. Corticosteroids in sepsis: an updated systematic review and meta-analysis. Crit Care Med. (2018) 46:1411–20.
64. Hotchkiss RS, Opal S. Immunotherapy for sepsis — a new approach against an ancient foe. N Engl J Med. (2010) 363:87–9. doi: 10.1056/NEJMcibr1004371
65. Lukaszewicz A-C, Grienay M, Resche-Rigon M, Pirracchio R, Faivre V, Boval B, et al. Monocytic HLA-DR expression in intensive care patients: interest for prognosis and secondary infection prediction. Crit Care Med. (2009) 37:2746–52. doi: 10.1097/CCM.0b013e3181ab858a
66. Hotchkiss RS, Monneret G, Payen D. Immunosuppression in sepsis: a novel understanding of the disorder and a new therapeutic approach. Lancet Infect Dis. (2013) 13:260–8. doi: 10.1016/S1473-3099(13)70001-X
67. Venet F, Monneret G. Advances in the understanding and treatment of sepsis-induced immunosuppression. Nat Rev Nephrol. (2018) 14:121–37. doi: 10.1038/nrneph.2017.165
Keywords: sepsis, transcriptomics, predictive modeling, gene expression analysis, mortality, biomarker discovery
Citation: Kreitmann L, Bodinier M, Fleurie A, Imhoff K, Cazalis M-A, Peronnet E, Cerrato E, Tardiveau C, Conti F, Llitjos J-F, Textoris J, Monneret G, Blein S and Brengel-Pesce K (2022) Mortality Prediction in Sepsis With an Immune-Related Transcriptomics Signature: A Multi-Cohort Analysis. Front. Med. 9:930043. doi: 10.3389/fmed.2022.930043
Received: 27 April 2022; Accepted: 08 June 2022;
Published: 30 June 2022.
Edited by:
Marcos Ferreira Minicucci, São Paulo State University, BrazilReviewed by:
Theogene Twagirumugabe, University of Rwanda, RwandaJesus Rico-Feijoo, Hospital Universitario Río Hortega, Spain
Copyright © 2022 Kreitmann, Bodinier, Fleurie, Imhoff, Cazalis, Peronnet, Cerrato, Tardiveau, Conti, Llitjos, Textoris, Monneret, Blein and Brengel-Pesce. This is an open-access article distributed under the terms of the Creative Commons Attribution License (CC BY). The use, distribution or reproduction in other forums is permitted, provided the original author(s) and the copyright owner(s) are credited and that the original publication in this journal is cited, in accordance with accepted academic practice. No use, distribution or reproduction is permitted which does not comply with these terms.
*Correspondence: Louis Kreitmann, bG91aXMua3JlaXRtYW5uQGV4dC5iaW9tZXJpZXV4LmNvbQ==
†These authors have contributed equally to this work