 Jiahui Xu1†
 Hao Lu
94% of researchers rate our articles as excellent or good
Learn more about the work of our research integrity team to safeguard the quality of each article we publish.
Find out more
ORIGINAL RESEARCH article
Front. Med., 20 June 2022
Sec. Family Medicine and Primary Care
Volume 9 - 2022 | https://doi.org/10.3389/fmed.2022.928825
This article is part of the Research TopicArtificial Intelligence and Big Data for Value-Based CareView all 14 articles
Background: It is widely recognized that glycated hemoglobin (HbA1c) and systolic blood pressure (SBP) are two key risk factors for albuminuria and renal function impairment in patients with type 2 diabetes mellitus (T2DM). Our study aimed to identify the specific numerical relationship of albumin/creatinine ratio (ACR) with HbA1c and SBP among a large population of adults with T2DM.
Method: A total of 8,626 patients with T2DM were included in the data analysis from the National Health and Nutrition Examination Surveys (NHANES) (1999-2018). The multiple linear regressions were used to examine the associations of ACR with HbA1c and SBP. Generalized additive models with smooth functions were performed to identify the non-linear relations between variables and interactions were also tested.
Results: Significantly threshold effects were observed between ACR and HbA1c or SBP after multivariable adjustment, with the risk threshold values HbA1c = 6.4% and SBP = 127 mmHg, respectively. Once above thresholds were exceeded, the lnACR increased dramatically with higher levels of HbA1c (β = 0.23, 95 CI%:0.14, 0.32, P < 0.001) and SBP (β = 0.03, 95 CI%:0.03, 0.04, P < 0.001). Subgroup analysis showed high protein diet was related to higher ACR. In addition, a higher risk of ACR progression was observed in central obesity participants with HbA1C ≥ 6.4% or hyperuricemia participants with SBP ≥ 127 mmHg among patients withT2DM.
Conclusion: We identified thresholds of HbA1c and SBP to stratify patients with T2DM through rapid albuminuria progression. These might provide a clinical reference value for preventing and controlling diabetes kidney disease.
Progression of albuminuria in diabetic patients is associated with impaired renal function and indicative of an increased risk of cardiovascular disease (CVD). Studies have demonstrated that in patients with type 2 diabetes mellitus (T2DM), microalbuminuria is considered an early marker for renal function decline, and elevated albuminuria was consistently correlated with the risk of end-stage kidney disease (1, 2). In addition, as an indicator of the systemic endothelial dysfunction response (3), increased albuminuria also predicts higher risks of myocardial infarction, heart failure, stroke, and cardiac death (4–6). Therefore, it is essential to assess albuminuria in diabetic patients. Since the albumin/creatinine ratio (ACR) is a reliable and sensitive index reflecting early kidney damage as well as relatively stable and convenient, ACR is commonly used to estimate the degree of urinary protein excretion clinically (7).
Although various risk factors could affect the development of albuminuria, abundant studies have confirmed that raised blood pressure and dysglycaemia are two critical risk factors for albuminuria (8–11). Cumulative evidence emphasizes that control of glycated hemoglobin (HbA1c) and systolic blood pressure (SBP) are significant in decreased ACR for both T2DM and Diabetic kidney disease (DKD) patients (12, 13). Previously, a study identified a 5.5% HbA1c level as the risk threshold for albuminuria prevalence in a large Chinese population over the age of 40 (14). Another study found a significantly increased risk of albuminuria in participants with HbA1c ≥ 7% compared with the normal urinary protein population. The above results remained stable in diabetic and non-diabetic populations (15). This might suggest a threshold effect between HbA1c and ACR levels, but a lack of large-scale population studies targeting patients with T2DM. In addition, the studies on the risk relationship between SBP and ACR have also been extensively reported. A meta-analysis included 31 cohorts in the world and demonstrated that each 20 mmHg increase in SBP was associated with a 1.5-fold higher prevalence of albuminuria (ACR ≥ 30 mg/g) in diabetes (11). It was also reported that only SBP ≤ 120 mmHg was associated with the lowest risk of new-onset microalbuminuria (16). However, almost all the above studies use a recommended cut-off point of 30 mg/g for ACR to explore the effects of HbA1c and SBP on the risk of albuminuria. Notably, A cohort study with an up to11-year follow-up period found that protein excretion levels, even with normal at baseline, are pronouncedly associated with increased mortality risk from CVD (17). A recent study also confirmed that a normal ACR range (≤30 mg/g) was related to left ventricular hypertrophy in patients with T2DM (18). This suggested that the specific numerical changes of ACR and the risk thresholds might not be fully reflected when we simply treated ACR as a categorical variable with a 30 mg/g cut-off.
Thus, in this study, we treated ACR as a continuous variable and included a large-scale T2DM population to explore the specific association of ACR with SBP and HbA1c simultaneously.
In this cross-sectional study, we merged all the National Health and Nutrition Examination Surveys (NHANES) data from 1999 to 2018. A total of 10,170 diabetes patients were identified according to the definition. We further identified 9,901 patients with T2DM after excluding pregnant woman (n = 47) and possible individuals with type 1 diabetes (n = 369). All the missing data for key variables, including ACR (n = 674), HbA1c (n = 251), and SBP (n = 369), were removed from the dataset. Eventually, 8,626 patients with T2DM were included in the final data analyses. The flow chart of the included study population is shown in Figure 1.
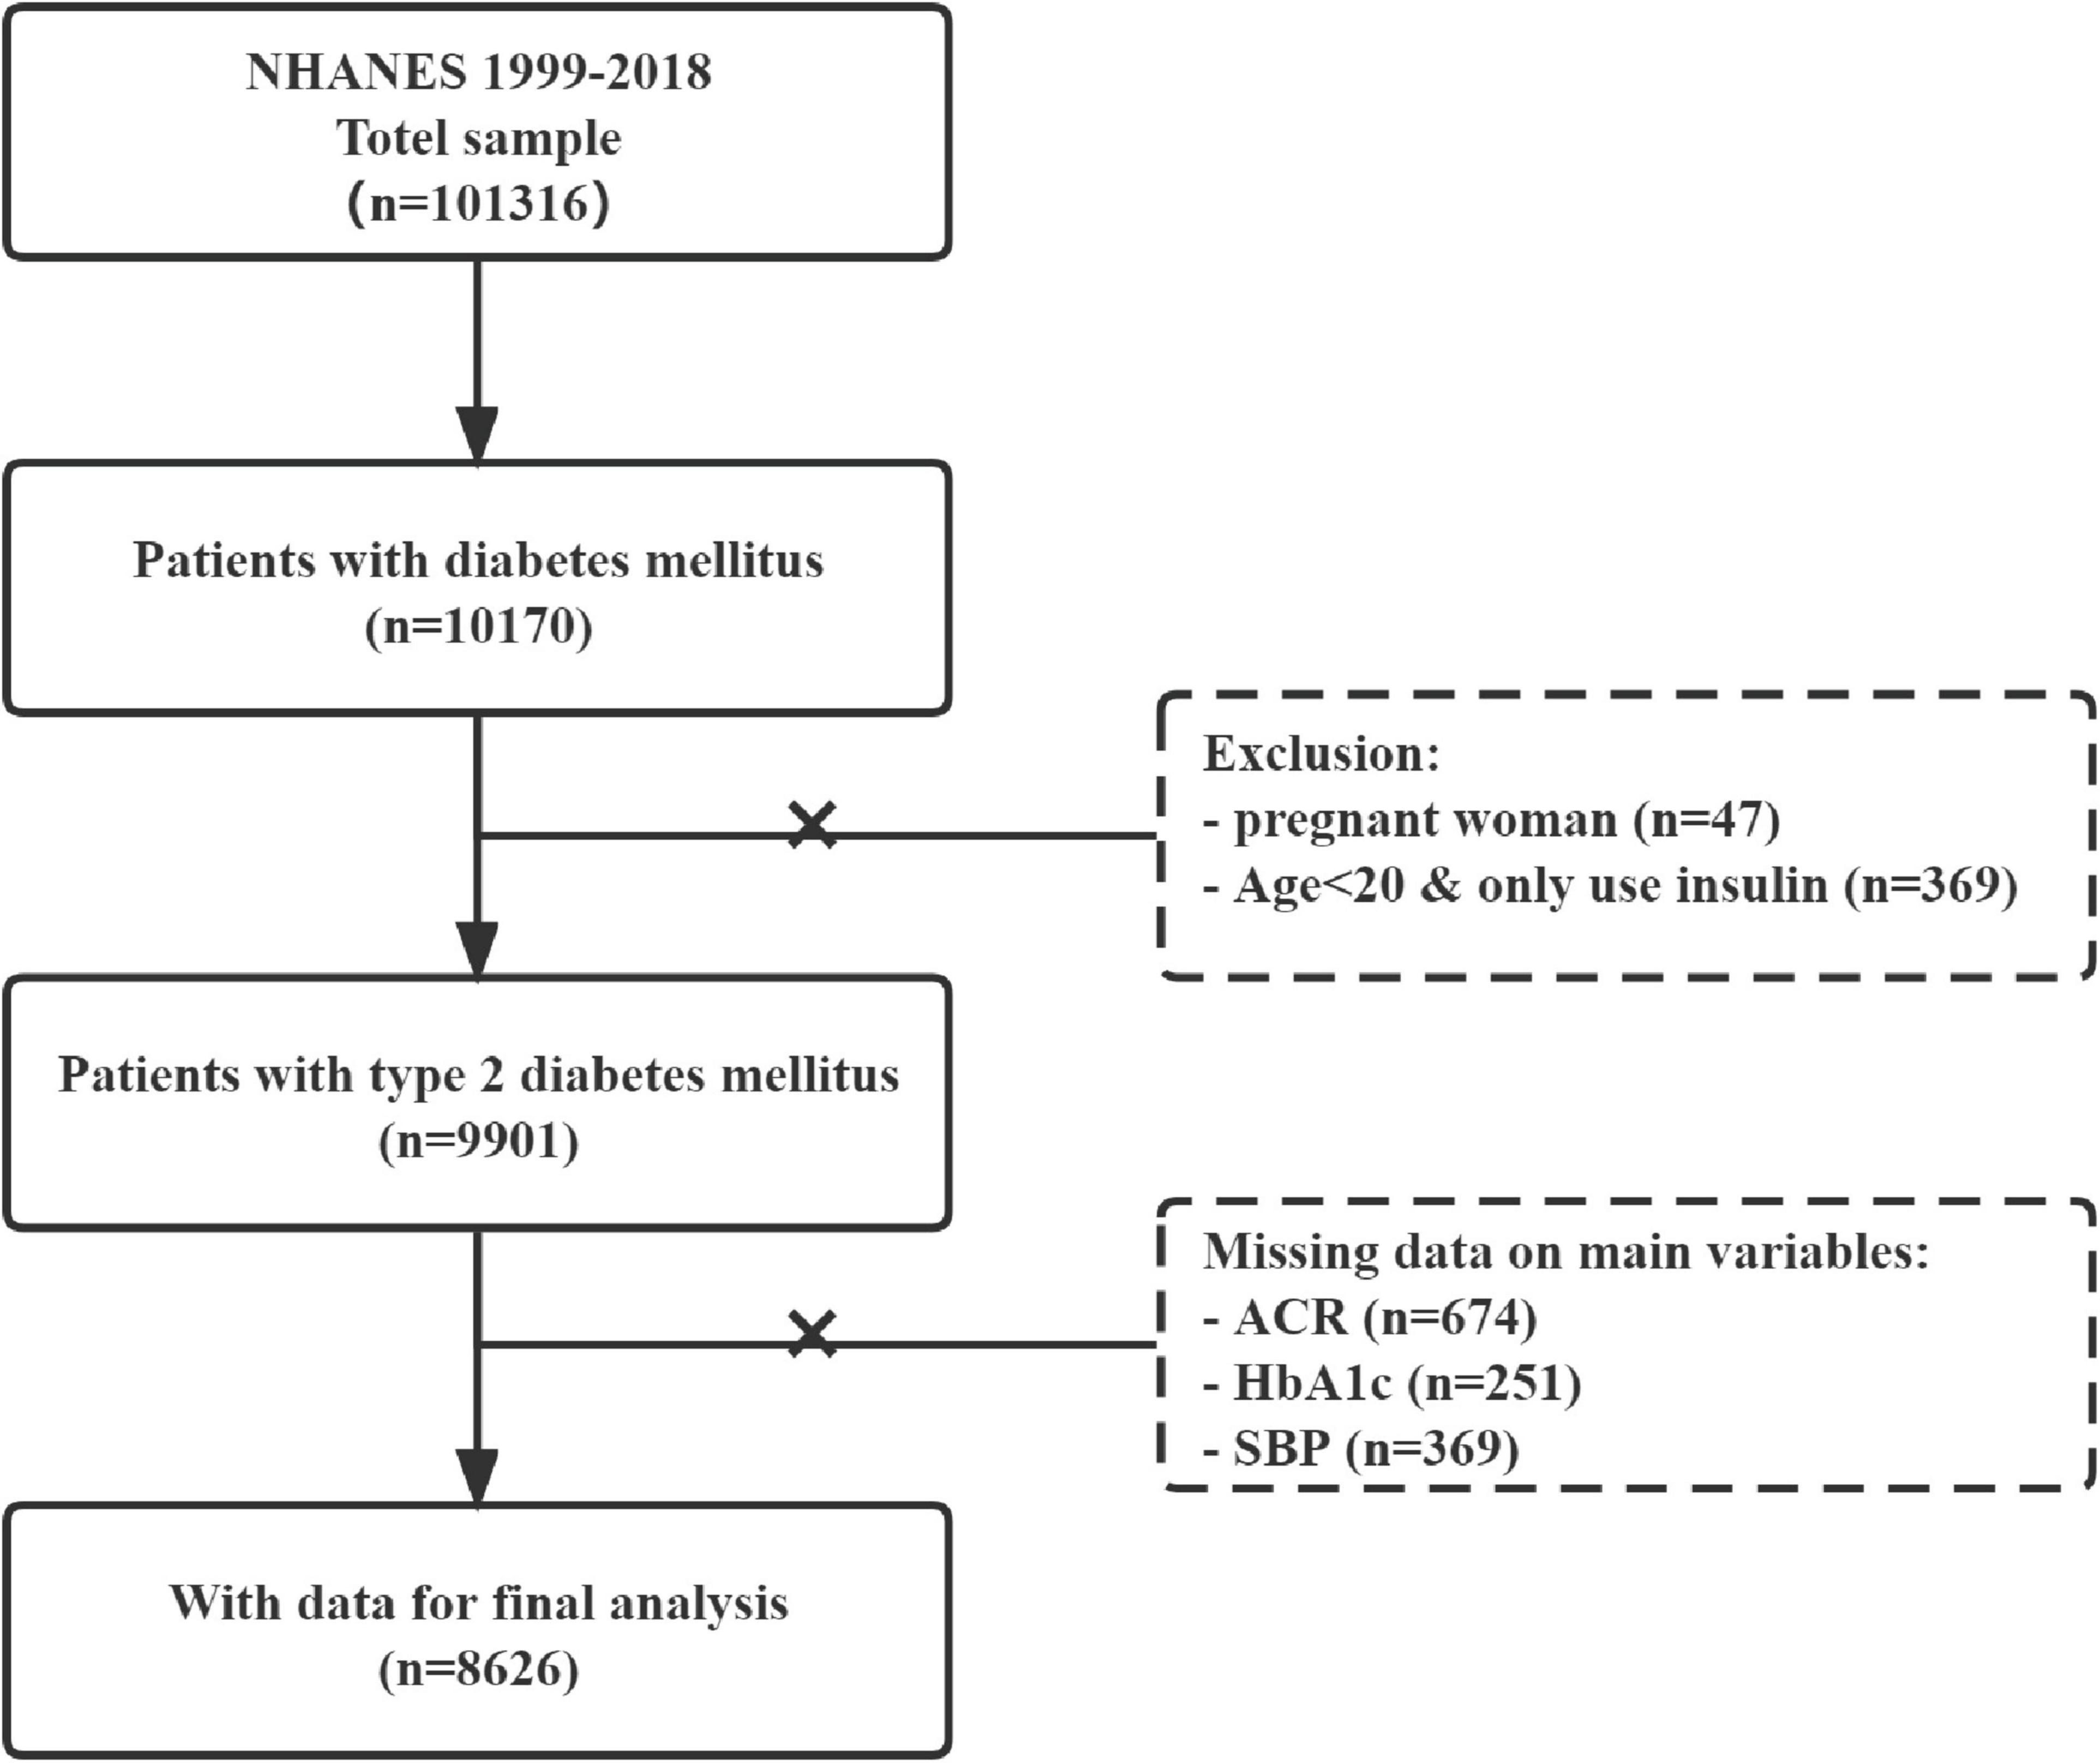
Figure 1. Flow diagram of study population selection.
Diabetes was defined if each condition was satisfied in the following items according to the recent American Diabetes Association (ADA) recommendation (19): (1) Previous diagnosis of type 2 diabetes by doctors (2) Fasting blood glucose levels greater than or equal to 7.0 mmol/L (126 mg/dL) (3) Postprandial 2 h plasma glucose levels greater than or equal to 11.1 mmol/L (200 mg/dL) after a standard 75-g oral glucose tolerance test (4) HbA1c levels were 6.5% (48 mmol/mol) or higher (5) The use of insulin or hypoglycemic drugs. Possible type 1 diabetes patients were defined as those aged <20 years who were only treated with insulin (20).
The albumin/creatinine ratio was calculated from random urine spot collections and reported as mg/g. Therein, the fluorescent immunoassay was employed to measure human urinary albumin and proved to be a reliable and accurate method. The Jaffé method was used to measure urine creatinine (period 1999–2007), and then the enzymatic method was used (period 2008–2018). HbA1c was tested by high-performance liquid chromatography after collecting venous whole blood specimens in EDTA. Above detection, operations were completed in the laboratory at the University of Minnesota and Columbia. More information on sample collection, transport, and processing was available in the NHANES manual. Blood pressure (BP) was measured by trained survey personnel when participants had rested for at least 5 min in a seated position. BP values included in the final analysis were the average of the three consecutive readings obtained with a standard mercury sphygmomanometer (interrupted or incomplete reading was replaced with fourth BP reading). Pulse pressure (PP) was calculated as systolic minus diastolic pressure.
Among the demographic parameters, marital status was divided into living with a partner and live without a partner; education level was divided into less than high school, high school, and more than high school. Cigarette smoking status was classified as current smokers (average cigarettes ≥ 1/day), past smokers (average cigarettes <1/day or ≥ 100-lifetime cigarettes but currently non-smoking), and never smokers (<100-lifetime cigarettes or never smoked). The consumption of alcohol was divided into two categories according to whether respondents had at least 12 drinks a year (21). Dietary intake, including dietary protein, sodium intake, and potassium intake, was assessed by two 24 h recalls (one in person and another by telephone 3–10 days later). Meanwhile, the sodium/potassium (Na/K) ratio was calculated for further analysis since the Na/K ratio was proved to have a stronger association with BP than either electrolyte examined alone (22). When obesity indicators were determined as categorical variables, body mass index (BMI, kg/m2) was grouped into normal weight (<25), overweight (≥25, <30), and obese (≥30). A waist circumference ≥102 cm for men and ≥88 cm for women indicates central obesity (23). Diabetes duration was analyzed as a categorical variable with <5 years, ≥5, <10 years, ≥10 years, and not recorded (missing data). The homeostasis model assessment of insulin resistance (HOMA-IR) was calculated with the formula [fasting glucose (mmol/L) × fasting insulin (μU/L)]/22.5. Estimate glomerular filtration rate (eGFR) was calculated based on the chronic kidney disease epidemiology collaboration (CKD-EPI) formula (24).
To minimize bias brought by missing data, missing categorical covariates were coded as a separate category as appropriate, and missing continuous covariates were replaced by group means. In addition, allowing for the complex sampling design, all analyses were performed incorporating the sampling weights according to NHANES guidelines (25). First, new multi-year sample weights were calculated using ten survey cycles (using 4-year weights when combining the 1999–2000 and 2001–2002 survey cycles). Then the weights of the smallest subpopulation that includes all the variables were selected for final analysis. Finally, to estimate variance, Taylor series linearization was applied, and all estimates were weighted.
In the baseline data assessment, the study population was stratified into four groups according to ACR quartiles. Continuous variables are presented as means ± SDs, and categorical variables are reported as frequencies and percentages. ACR was transformed with the natural logarithm function (LnACR) to stabilize variance prior to analysis. Comparison of continuous variables among groups was analyzed by one-way ANOVA or non-parametric test. The counting variables were analyzed by the chi-square test. Multiple linear regression models were performed to estimate the crude association of ACR with HbA1c and SBP after varying degrees of covariates adjustments. The fully adjusted model included covariates for age, sex, education level, marital status, smoking, alcohol consumption, diabetes duration, BMI, waist circumference, fasting plasma glucose (FPG), diastolic blood pressure (DBP), triglyceride (TG), uric acid (UA), eGFR, SBP/HbA1c, and dietary protein. Covariates listed above were screened based on their regression coefficients relative to ACR with a P-value of less than 0.1 (26). There was no multicollinearity effect among the covariates (variance inflation factor (VIF) = 1–4.7). It should be noted that PP was not included as a covariate because of strong collinearity among PP and SBP (VIF > 10). Also, SBP was more positively correlated to ACR than PP, which was consistent with previous studies (27, 28) and demonstrated a stronger relationship between SBP and risk of ACR. Generalized additive models with smooth functions captured the non-linear relationships of ACR with HbA1c and SBP. Then, the threshold levels of HbA1c and SBP were determined using a recursive approach. Likelihood ratio tests were used to assess the difference in fit between the one-line linear regression model with the two-piecewise linear regression model, and P < 0.05 was considered significant. Finally, interaction tests were performed between subgroups. Data were analyzed using statistical packages R (The R Foundation; version 3.4.3)1 and EmpowerStats software (X&Y Solutions, Inc., Boston, MA, United States).2
The detailed clinical characteristics of the 8,626 patients with T2DM included in our study were listed in Table 1. When the study population was stratified into four groups according to ACR quartiles. Age, the percentage of participants living with a partner, proportion of participants with an educational level less than high school, the number of current smokers, the proportions of participants with a long diabetes duration (≥10 years), the proportions of participants taking antihypertensive medication, FPG, HbA1c, TG, SBP, PP, and UA levels all showed increased tendency between the four groups with elevated ACR level. BMI was significantly different across groups after being transformed into a categorical variable. No significant differences were observed in Na/K ratio, waist circumference, DBP, total cholesterol (TC), and alanine aminotransferase (ALT).
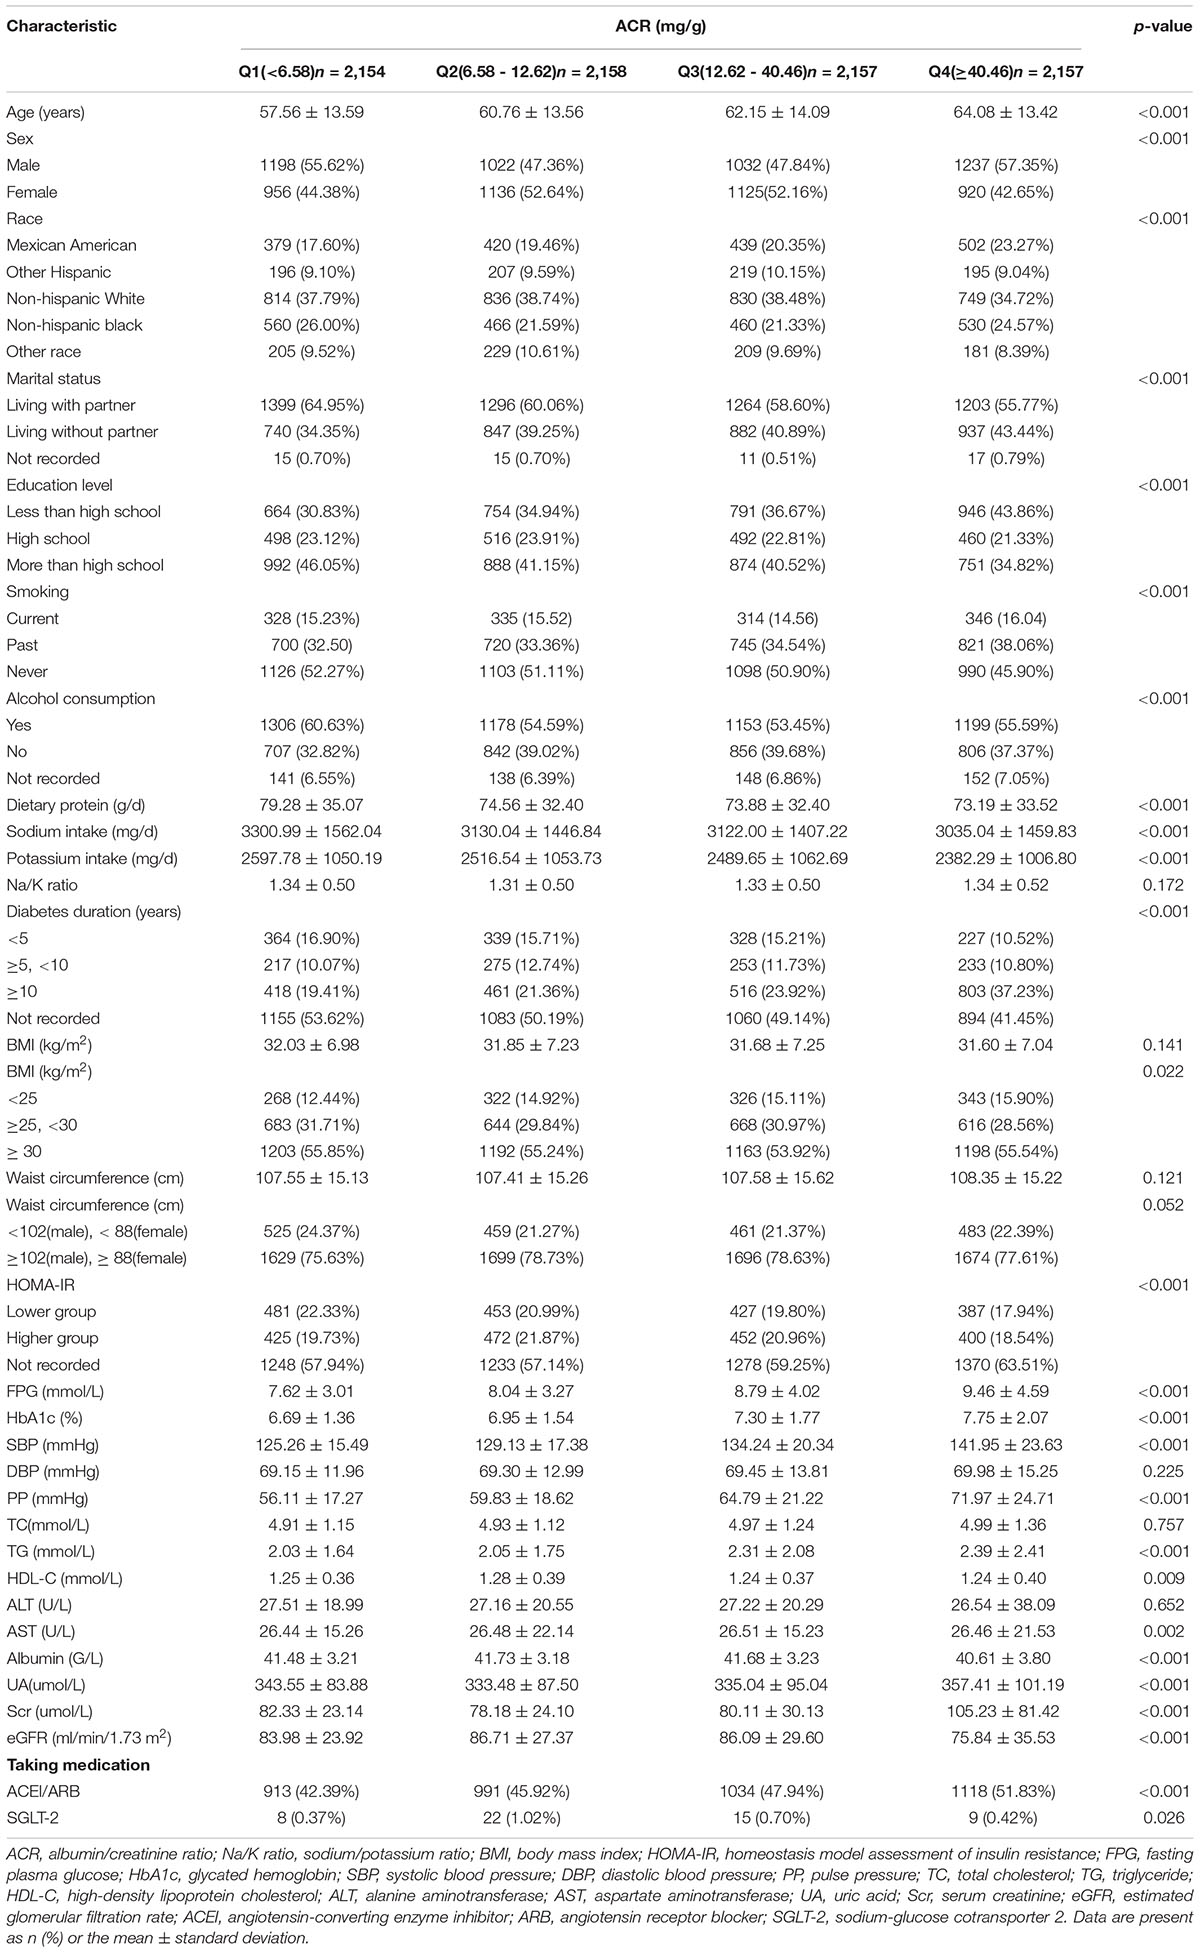
Table 1. The clinical characteristics of enrolled participants were stratified by albumin/creatinine ratio (ACR) quartiles.
To comprehensively explore the relationship of ACR with HbA1c and SBP, we conducted different linear regression models when the independent variables were both treated as continuous and categorical variables. Increased HbA1c and SBP levels (continuous variable) have consistently shown an association with increased lnACR level (P < 0.001) whether in the non-adjusted model, the multivariate-adjusted model I and II (Table 2). HbA1c and SBP were then transformed into categorical variables by fixed intervals. In the fully adjusted multivariable model II, compared with the reference group of HbA1c (HbA1c < 6), no significant elevated lnACR levels were observed in the second HbA1c group (β = 0.05, 95 CI%: −0.02, 0.12, P = 0.156), but the positive association became statistically significant from the third group (β = 0.18, 95 CI%:0.09, 0.27, P < 0.001) to highest HbA1c group (β = 0.81, 95 CI%:0.68, 0.94, P < 0.001) (Table 2). The Changes in SBP also displayed similar trends. Compared to the first group of SBP in multiple linear regression models, only the second group of SBP levels had no relationship with an increased level of lnACR (β = 0.02, 95 CI%: −0.09, 0.12, P = 0.771) (Table 2). The above results suggested that the positive linear relationships were not always consistent between ACR and HbA1c or SBP. Potential threshold effects might exist in the lower groups of HbA1c and SBP.
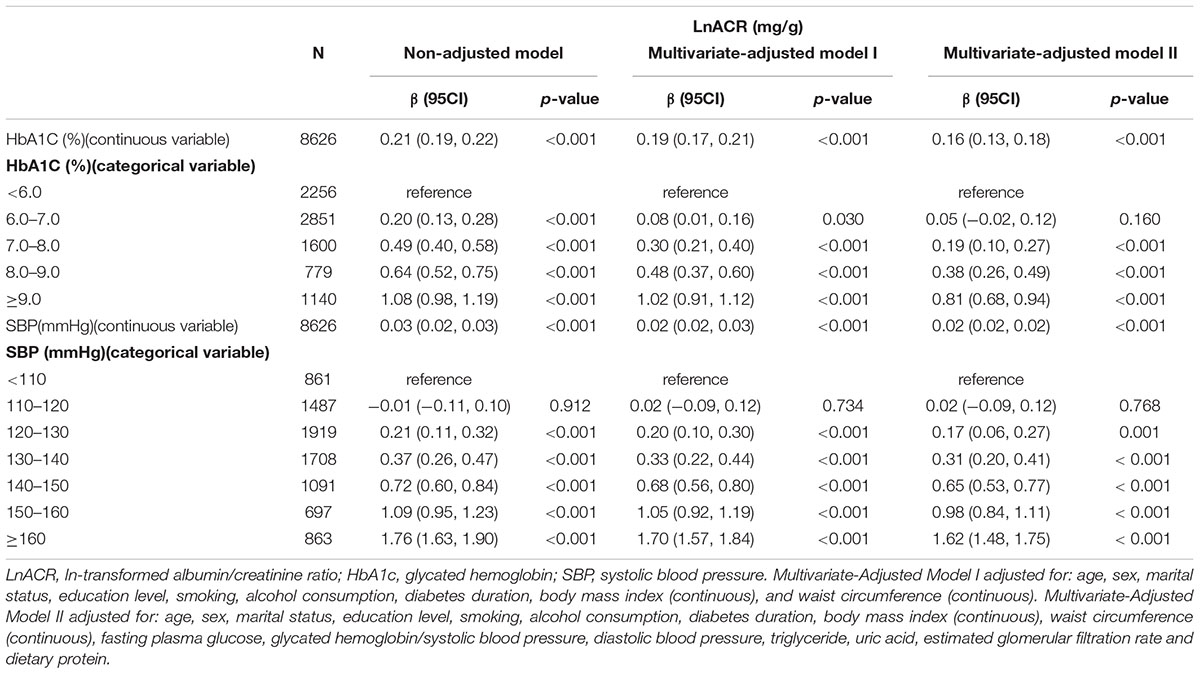
Table 2. The relationship between ACR and HbA1c or SBP using linear regression analysis.
Generalized additive models with smooth functions further revealed the non-linear relationships between lnACR and HbA1c or SBP (Figure 2). Data were fitted with the segmented linear models, and two turning points were determined (HbA1c: 6.4%, SBP: 127 mmHg). The likelihood-ratio tests demonstrated that the two-piecewise linear regression models had a better fit (P < 0.001) (Table 3). However, the threshold effect of HbA1c became significant only after adjustment for confounders, while the threshold effect of SBP remained throughout whether or not the confounders were adjusted. After multivariate adjustment in model II, below the thresholds, no significant correlations were observed between lnACR and HbA1c or SBP. Above the thresholds, lnACR was increased significantly with the increment of HbA1c (β = 0.19, 95 CI%:0.16, 0.22, P < 0.001) and SBP (β = 0.03, 95 CI%:0.03, 0.04, P < 0.001) (Table 3). Notably, the corresponding ACR (mg/g) values for thresholds of HbA1c and SBP were 15.03 (14.44–15.8) and 12.55 (11.94–13.2), respectively, both values being in the normoalbuminuric range (ACR < 30 mg/g).
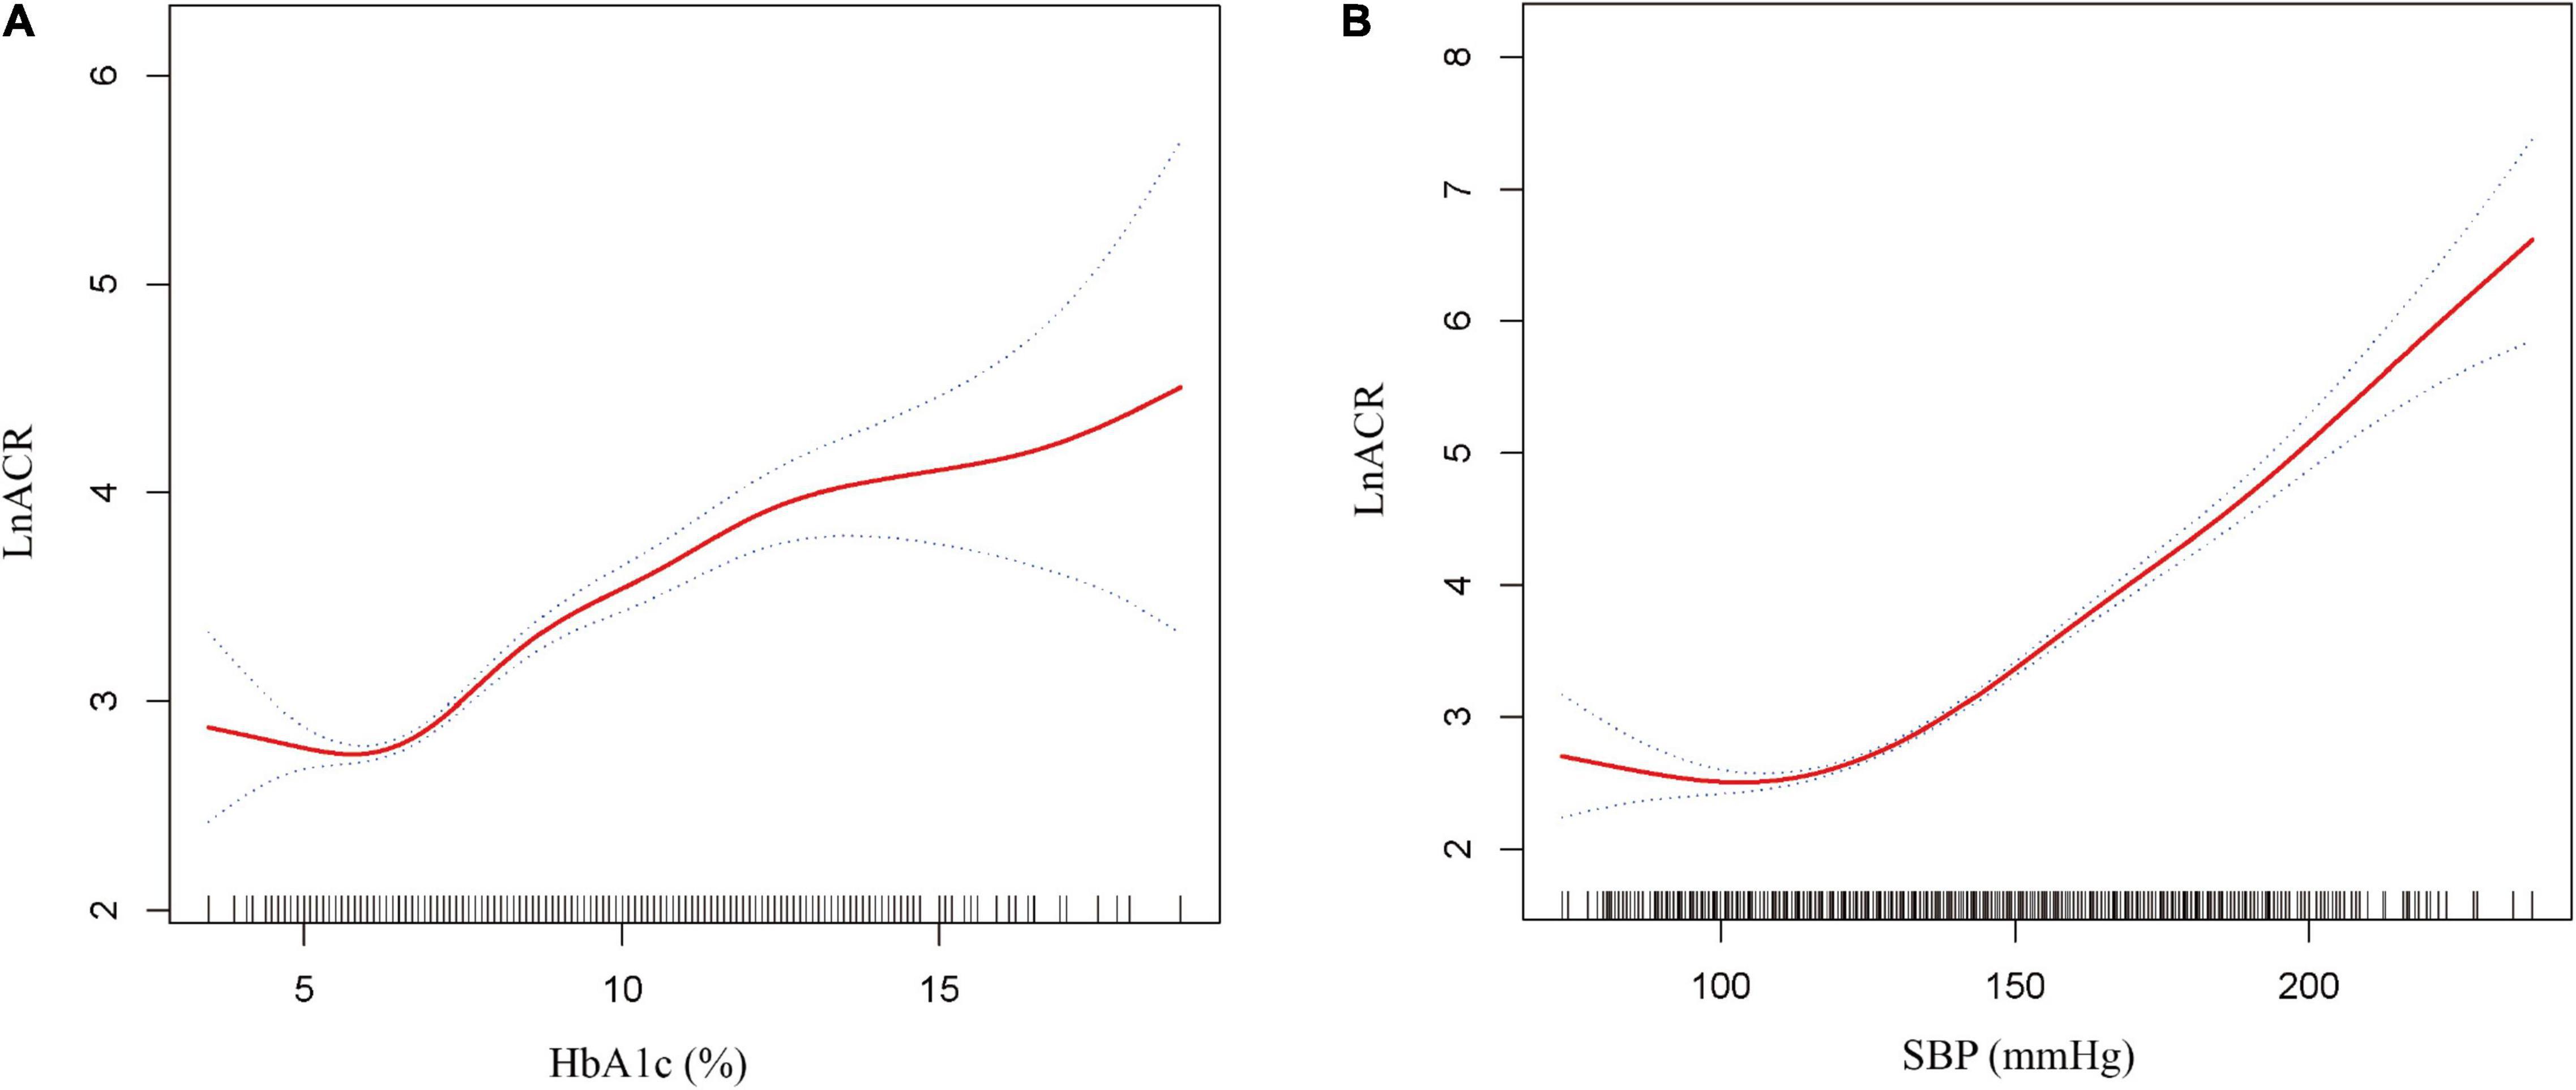
Figure 2. Non-linear relationship between ACR and HbA1c or SBP. (A) lnACR with HbA1c (B) lnACR with SBP. The solid red line is the fitted curves and the dotted curves are the 95 CI of the fit. All analyses were adjusted for age, sex, marital status, education level, smoking, alcohol consumption, diabetes duration, body mass index (continuous), waist circumference (continuous), fasting plasma glucose, glycated hemoglobin/systolic blood pressure, diastolic blood pressure, triglyceride, uric acid, estimated glomerular filtration rate and dietary protein.
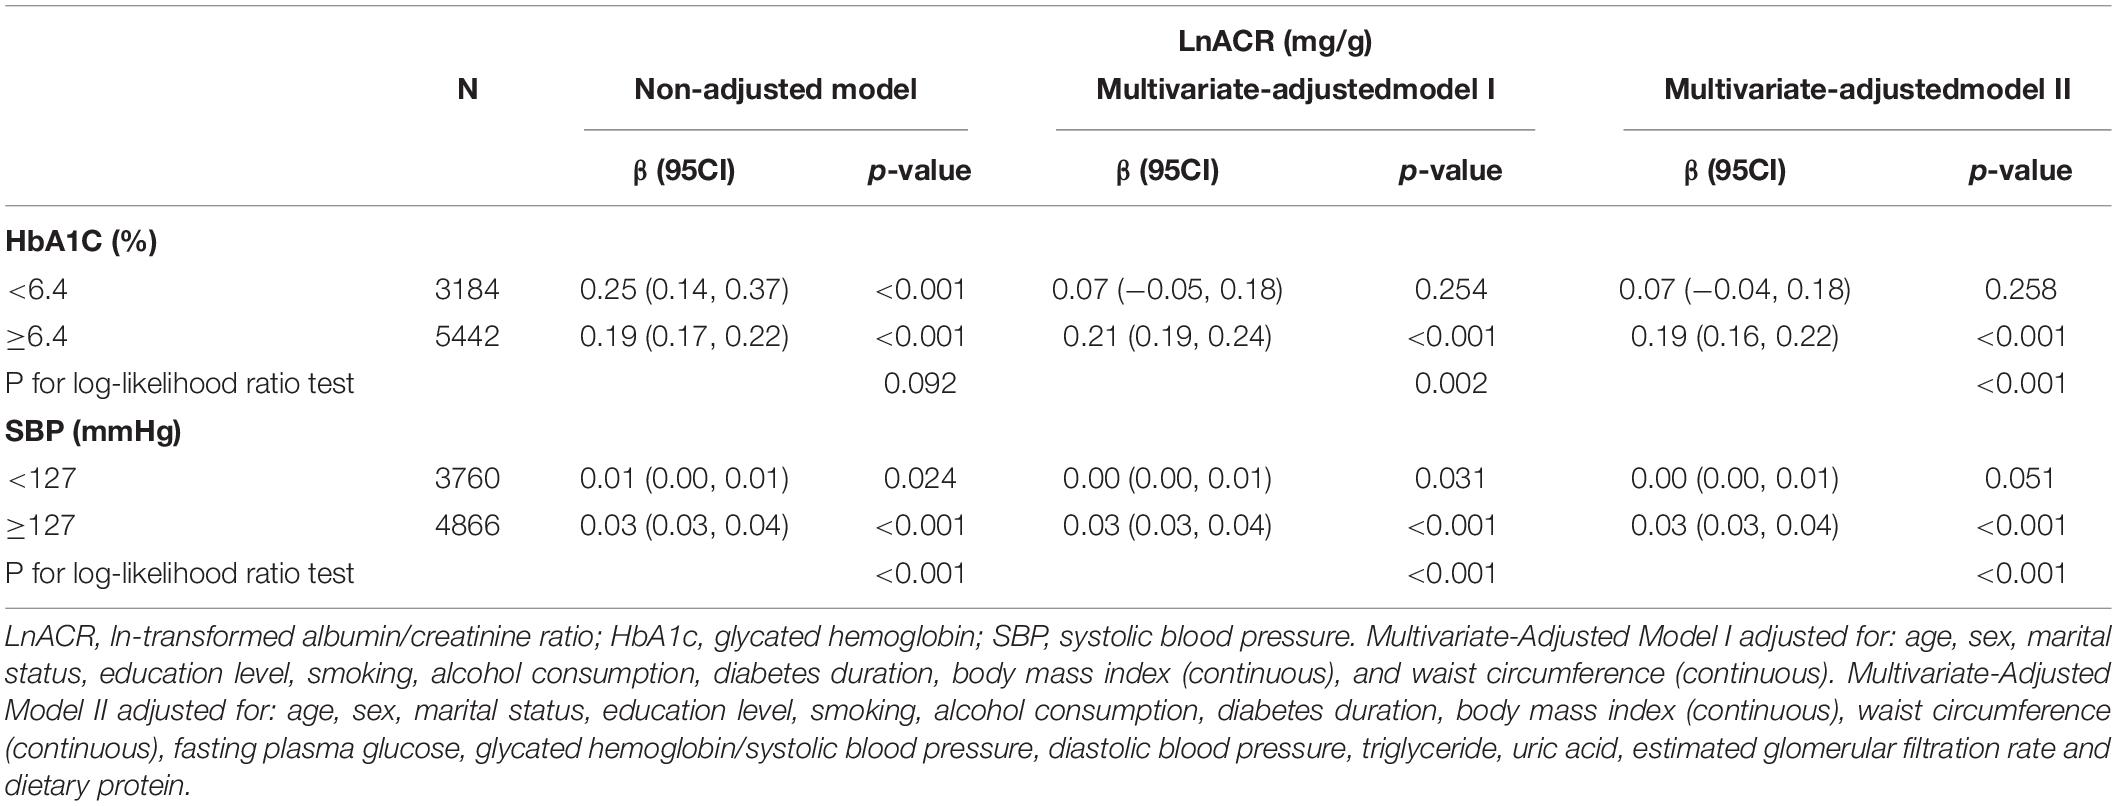
Table 3. Threshold effect analysis of HbA1c or SBP on ACR using two-piecewise linear regression.
We combined discovered thresholds and explored the comprehensive effect of HbA1c and SBP levels on changes in ACR. In parallel, subgroups analyses were performed separately based on different thresholds. When the study population was divided into four groups based on two thresholds, we discovered that the dose-dependent positive relationship between the groups and the risk of elevated lnACR levels was consistently present whether adjusted for covariates (Table 4). Compared with the population who had both HbA1c and SBP levels below the thresholds, the population simultaneous above the thresholds had the fastest increase in lnACR (β = 0.67, 95 CI%:0.58, 0.76, P < 0.001). A rapid increase in lnACR level was more relevant to higher SBP levels above the threshold (≥127 mmHg) (Table 4). When subgroup analyses were carried out for patients with HbA1c ≥ 6.4%, significant interactions were observed both in the diabetes duration subgroup (interaction P < 0.001), waist circumference subgroup (interaction P = 0.029), dietary protein subgroup (interaction P = 0.043) and Na/K ratio subgroup (interaction P = 0.02) (Figure 3). In addition, there were also interaction effects between SBP with diabetes duration group (interaction P < 0.001), dietary protein subgroup (interaction P < 0.001), UA group (interaction P < 0.001), ACR group (interaction P < 0.001), and eGFR group (interaction P < 0.001) among the patients with T2DM who had a SBP level above 127 mmHg (Figure 3).
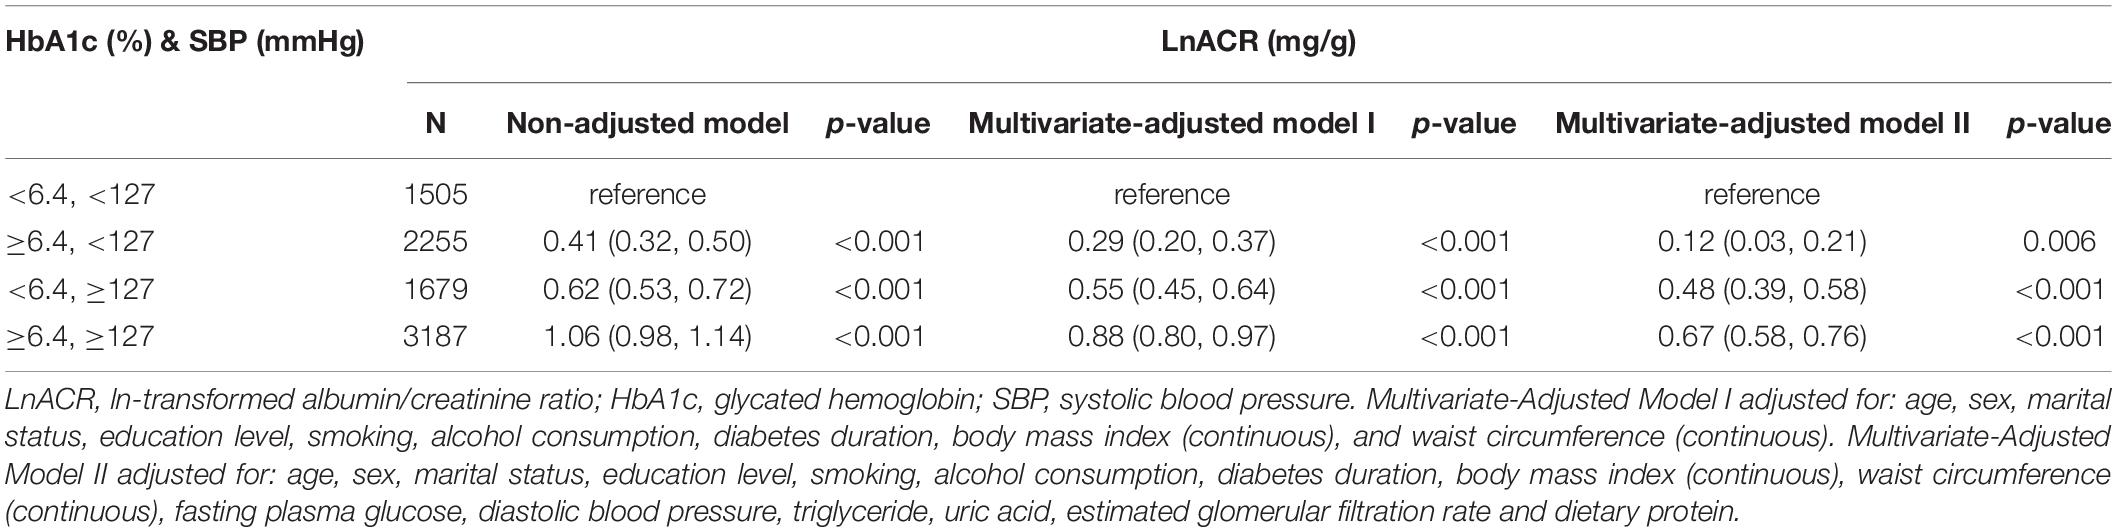
Table 4. Analysis of the combined threshold effect of both HbA1and SBP on ACR.
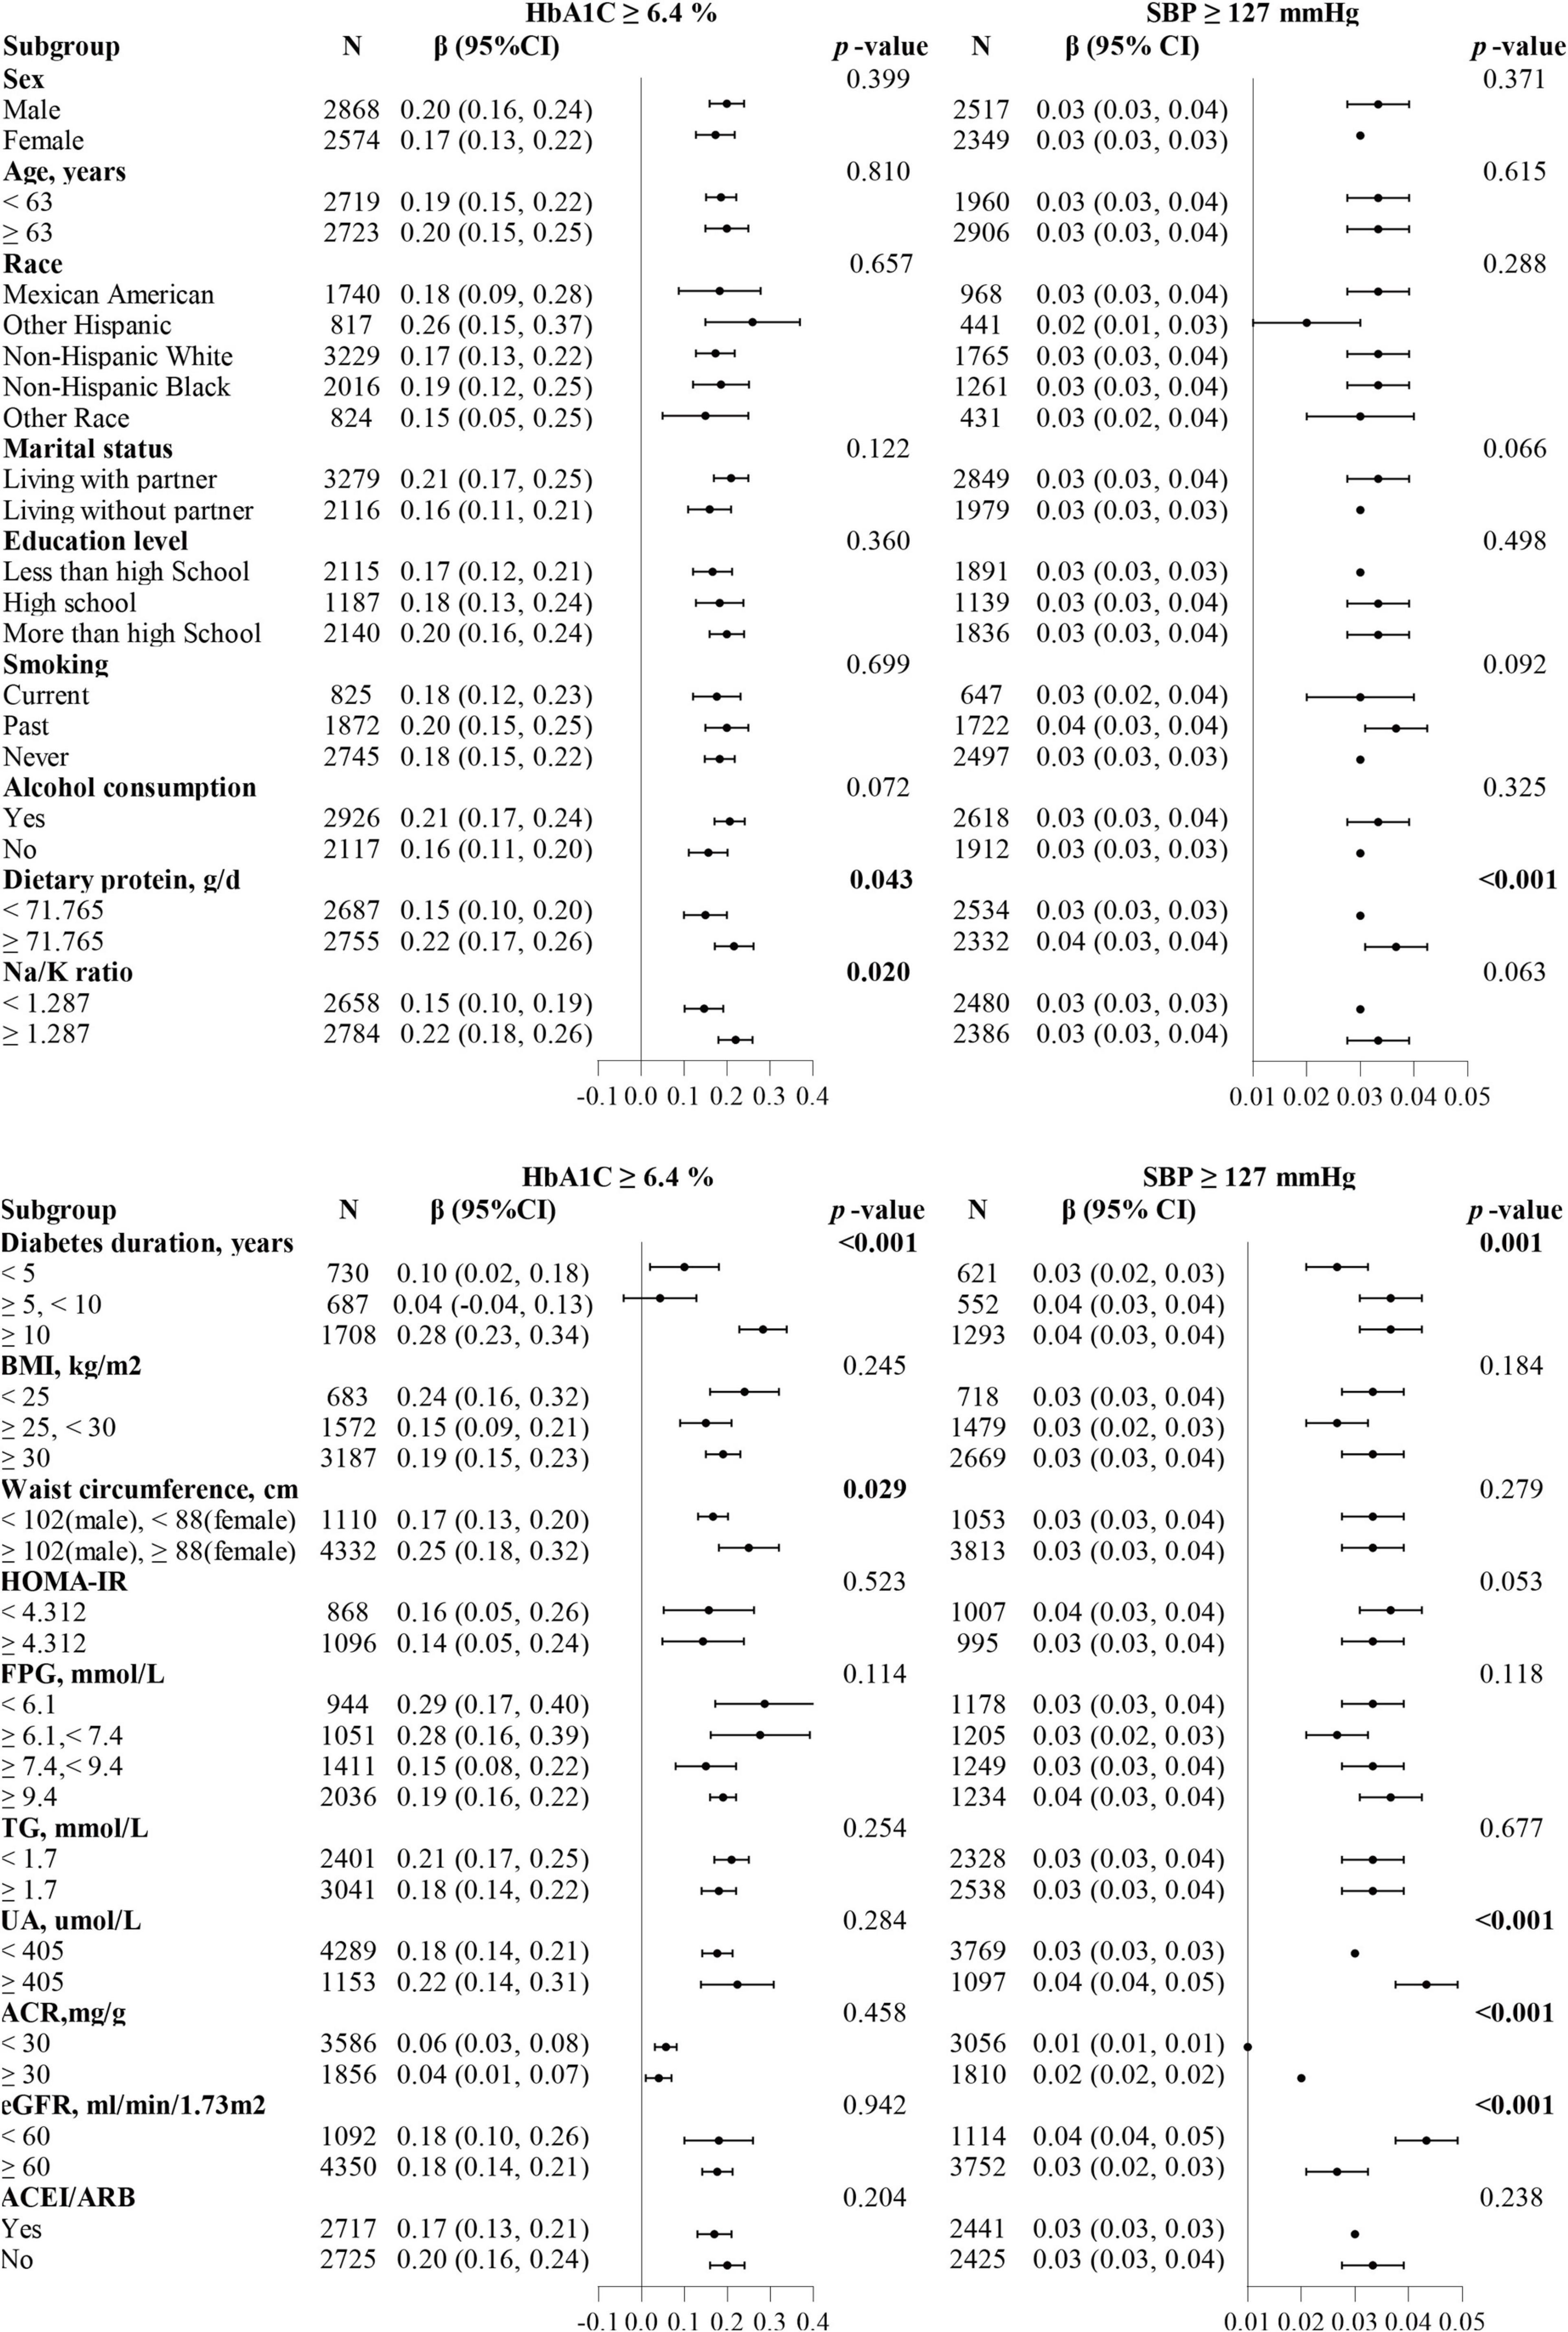
Figure 3. Forest plots summarizing the subgroups analyses for ACR with HbA1c or SBP divided by thresholds (HbA1c ≥ 6.4%, SBP ≥ 127 mmHg). The dietary protein, Na/K ratio, and HOMA-IR subgroups were divided based on the median. Each subgroup analysis adjusted for age, sex, marital status, education level, smoking, alcohol consumption, diabetes duration, body mass index (continuous), waist circumference (continuous), fasting plasma glucose, glycated hemoglobin/systolic blood pressure, diastolic blood pressure, triglyceride, uric acid, estimated glomerular filtration rate and dietary protein, except the subgrouping variables.
Our study elaborated on the relationship curves between ACR and HbA1c or SBP in patients with T2DM and discovered the different risk thresholds of HbA1c and SBP (HbA1c = 6.4% and SBP = 127 mmHg) above which the risk of ACR increases significantly. Additionally, more pronounced risk relationships were detected in participants with longer-duration diabetes, central obesity, or hyperuricemia.
Previously, one study discovered the threshold effect between HbA1C and ACR among a Chinese population, but it has not been studied in diabetic people (14). We first confirmed a similar association in patients with T2DM, which suggested that there exists an obvious ACR rising period that we are easy to ignore before progression to microalbuminuria. The gap between the risk threshold of HbA1c obtained in our study (6.4%) and recommended HbA1c targets (7%) (29) might be related to the early control of the above period. Notably, to define target HbA1c control levels, not only the risk of ACR progression should be taken into account, but the incidence of renal endpoints, the ultimate risk of death, and the occurrence of adverse events. Appropriate glucose control (HbA1c < 7%) recommended by the guidelines was based on a famous landmark UKPDS study (30), while the ACCORD research highlighted that intensive glucose control (HbA1c < 6%) could not reduce microvascular outcome events (31). In addition, a large-scale study with up to 13 years of follow-up reported that strict control of glucose (HbA1c < 6.5%) in the first year after newly diagnosed type 2 diabetes was associated with lower risks of diabetic vascular complications and reduced mortality (32). The aforementioned studies implied that it might be reasonable to control the HbA1c level within 6–7%, and some newly diagnosed patients would benefit more with HbA1c values < 6.5%. The threshold value (HbA1c = 6.4%) obtained in our study was also within the above range. Furthermore, a large prospective cohort study of older German adults demonstrated that increasing HbA1c (≥6.4%) was closely associated with a more than a 3-fold increased risk of decreased renal function (33). This result was generally consistent with our findings, Further, it demonstrated that there might have both short-term and long-term renal function protection when the HbA1c level was controlled below 6.4% in patients with T2DM.
As another crucial risk factor for ACR, SBP exhibited a similar threshold effect to HbA1c. However, all extensive studies emphasized the approximate range of SBP control and did not reveal the specific threshold, nor did they evaluate the risky situations under continuous changes in SBP. The existing authoritative research (34–37) results showed that patients with T2DM had a relative positive benefit-risk balance with SBP control between 120 and 140 mmHg. A prospective study on T2DM veterans discovered a significant protective benefit from lowering SBP below 130 mmHg (38), which suggested that a tighter range (120–130 mmHg) for SBP control may be required. The 127 mmHg threshold of SBP obtained in our study is also within this range. Crucially, the risk threshold detected in our study could be instrumental in the future experiment design of SBP control levels to assess long-term effects.
Combined analyses of thresholds showed the lowest ACR levels when both HbA1c and SBP control levels were below the thresholds. This was in accordance with most other studies (39, 40). Of additional concern, compared to patients with T2DM with HbA1c ≥ 6.4% and SBP < 127 mmHg, a stronger association with elevated ACR was observed in subjects with HbA1c < 6.4% and SBP ≥ 127 mmHg. These findings implied that well-controlled SBP was likely to play a more significant role in reducing urine protein levels and should be elucidated by further studies. Finally, after complete adjustment for confounding factors, the results of the subgroup analysis partially explained the heterogeneity. Our results found that longer diabetes duration and higher protein intake had interacted with HbA1c (≥6.4%) and SBP (≥127 mmHg) in the risk of ACR progression. These, too, were in keeping with previous findings. Duration of diabetes was an unmodifiable risk factor of ACR in patients with T2DM (41) while a high protein diet can exacerbate hypertension and expedite glomerular damage (42). Additionally, our results showed central obesity and a higher Na/K intake ratio could impose an extra burden on the kidney in patients with T2DM who had HbA1c ≥ 6.4%. It has been reported that central obesity could aggravate insulin resistance (43), and lead to the progression of abnormal renal hemodynamics and podocyte injury (44). The higher Na/K intake ratio might cause endothelial insult and elevate urinary protein levels (45). When SBP ≥ 127 mmHg, a more rapid rise in ACR was observed in patients with T2DM with renal insufficiency or hyperuricemia. This may be closely related to compromised kidney regulation and marked glomerular hypertension caused by the combined effects of diabetes status, hypertension, and impaired kidney function (46). Hyperuricemia is recognized as one of the risk factors for the development and progression of diabetic kidney disease. It could activate the RAAS system, further increasing blood pressure levels to promote ACR progression in patients with T2DM (47). No significant differences were identified in the subgroup analyses of age, gender, education levels, marital status, smoking and alcohol consumption, and blood lipids, which indicated that our results remain stable across most subsamples.
There are two significant clinical implications in our study. First, we identified the risk thresholds of rapid ACR progression and provided valuable references for both early blockades of DKD occurrence and development. Different from the conventional studies dividing population-based on ACR ≥ 30 mg/g to explore the potential risk factors, we described consecutive changes in ACR and observed the risk thresholds of HbA1c and SBP at an earlier level of ACR. As for patients with T2DM with normal urine protein levels, tightly controlling HbA1c and SBP within the threshold levels emphasize no proteinuria and the maintenance of long-term stable normal urine protein levels. For patients with T2DM along with proteinuria, the same control below the threshold levels may have positive significance in delaying the progression of DKD and even reversing to normal urinary protein levels (48). Second, our study further explored high-risk populations with rapid proteinuria progression, which provided partial references for individualized prevention and targeted intervention. For example, patients with T2DM diagnosed with unsatisfactory HbA1c level control should pay attention to weight management and moderately limit their protein and salt intake; patients with high SBP levels should not only reduce blood pressure reasonably but also need to check renal function regularly to prevent hyperuricemia.
Of course, our study has the following limitations. This study is cross-sectional and lacks longitudinal follow-up assessments, including primary endpoint and adverse events. More prospective studies based on our thresholds are needed in the future. In addition, it remains uncertain whether our results are generally applicable to other populations, such as Asian populations, since the enrolled participants are all from the United States.
In type 2 diabetic population, we identified distinct thresholds of HbA1c and SBP (HbA1c = 6.4% and SBP = 127 mmHg) beyond which an elevated albuminuria risk would become significant. Additionally, central obesity and higher Na/K intake ratio could further increase the albuminuria risk in patients with T2DM who had HbA1c ≥ 6.4% while hyperuricemia and higher protein intake have similar effects in patients with T2DM who had SBP ≥ 127 mmHg. Our findings might have important clinical implications for the early prevention and control of DKD.
The original contributions presented in this study are included in the article, further inquiries can be directed to the corresponding author/s.
The studies involving human participants were reviewed and approved by the National Center for Health Statistics (NCHS) of the Centers for Disease Control and Prevention (CDC). The patients/participants provided their written informed consent to participate in this study.
HL: conception and design. JX and YX: drafting of the manuscript and data analysis. QC and XH: reviewed/edited the manuscript. MC and JT: selection of literature and interpretation. SJ: making figures and tables. All authors contributed to the article and approved the submitted version.
This research was funded by the National Natural Science Foundation of China, grant numbers 81503552 and 81874434, the Shanghai Municipal Key Clinical Specialty, grant number shslczdzk05401, and the Shanghai Key Laboratory of Traditional Chinese Clinical Medicine, grant number 14DZ2273200.
The authors declare that the research was conducted in the absence of any commercial or financial relationships that could be construed as a potential conflict of interest.
All claims expressed in this article are solely those of the authors and do not necessarily represent those of their affiliated organizations, or those of the publisher, the editors and the reviewers. Any product that may be evaluated in this article, or claim that may be made by its manufacturer, is not guaranteed or endorsed by the publisher.
We appreciate the useful discussions with HL.
1. Coresh J, Heerspink HJL, Sang Y, Matsushita K, Arnlov J, Astor BC, et al. Change in albuminuria and subsequent risk of end-stage kidney disease: an individual participant-level consortium meta-analysis of observational studies. Lancet Diabetes Endocrinol. (2019) 7:115–27. doi: 10.1016/S2213-8587(18)30313-9
2. Neuen BL, Weldegiorgis M, Herrington WG, Ohkuma T, Smith M, Woodward M. Changes in GFR and albuminuria in routine clinical practice and the risk of kidney disease progression. Am J Kidney Dis. (2021) 78:350–360.e1. doi: 10.1053/j.ajkd.2021.02.335
3. Satchell SC, Tooke JE. What is the mechanism of microalbuminuria in diabetes: a role for the glomerular endothelium? Diabetologia. (2008) 51:714–25. doi: 10.1007/s00125-008-0961-8
4. Vaduganathan M, Pareek M, Kristensen AMD, Biering-Sorensen T, Byrne C, Almarzooq Z, et al. Prevention of heart failure events with intensive versus standard blood pressure lowering across the spectrum of kidney function and albuminuria: a sprint substudy. Eur J Heart Fail. (2021) 23:384–92. doi: 10.1002/ejhf.1971
5. Sacre JW, Magliano DJ, Shaw JE. Heart failure hospitalisation relative to major atherosclerotic events in type 2 diabetes with versus without chronic kidney disease: a meta-analysis of cardiovascular outcomes trials. Diabetes Metab. (2021) 47:101249. doi: 10.1016/j.diabet.2021.101249
6. Koo BK, Chung WY, Moon MK. Peripheral arterial endothelial dysfunction predicts future cardiovascular events in diabetic patients with albuminuria: a prospective cohort study. Cardiovasc Diabetol. (2020) 19:82. doi: 10.1186/s12933-020-01062-z
7. Sumida K, Nadkarni GN, Grams ME, Sang Y, Ballew SH, Coresh J, et al. Conversion of urine protein-creatinine ratio or urine dipstick protein to urine albumin-creatinine ratio for use in chronic kidney disease screening and prognosis : an individual participant-based meta-analysis. Ann Intern Med. (2020) 173:426–35. doi: 10.7326/M20-0529
8. Jiang W, Wang J, Shen X, Lu W, Wang Y, Li W, et al. Establishment and validation of a risk prediction model for early diabetic kidney disease based on a systematic review and meta-analysis of 20 cohorts. Diabetes Care. (2020) 43:925–33. doi: 10.2337/dc19-1897
9. Krolewski AS, Niewczas MA, Skupien J, Gohda T, Smiles A, Eckfeldt JH, et al. Early progressive renal decline precedes the onset of microalbuminuria and its progression to macroalbuminuria. Diabetes Care. (2014) 37:226–34. doi: 10.2337/dc13-0985
10. Elley CR, Robinson T, Moyes SA, Kenealy T, Collins J, Robinson E, et al. Derivation and validation of a renal risk score for people with type 2 diabetes. Diabetes Care. (2013) 36:3113–20. doi: 10.2337/dc13-0190
11. Shin JI, Chang AR, Grams ME, Coresh J, Ballew SH, Surapaneni A, et al. Albuminuria testing in hypertension and diabetes: an individual-participant data meta-analysis in a global consortium. Hypertension. (2021) 78:1042–52. doi: 10.1161/HYPERTENSIONAHA.121.17323
12. Kinguchi S, Wakui H, Ito Y, Kondo Y, Azushima K, Osada U, et al. Improved home BP profile with dapagliflozin is associated with amelioration of albuminuria in japanese patients with diabetic nephropathy: the yokohama add-on inhibitory efficacy of dapagliflozin on albuminuria in japanese patients with type 2 diabetes study (Y-Aida study). Cardiovasc Diabetol. (2019) 18:110. doi: 10.1186/s12933-019-0912-3
13. Nordwall M, Abrahamsson M, Dhir M, Fredrikson M, Ludvigsson J, Arnqvist HJ. Impact of Hba1c, followed from onset of type 1 diabetes, on the development of severe retinopathy and nephropathy: the viss study (vascular diabetic complications in Southeast Sweden). Diabetes Care. (2015) 38:308–15. doi: 10.2337/dc14-1203
14. Lian H, Wu H, Ning J, Lin D, Huang C, Li F, et al. The risk threshold for hemoglobin A1c associated with albuminuria: a population-based study in China. Front Endocrinol (Lausanne). (2021) 12:673976. doi: 10.3389/fendo.2021.673976
15. Atkin SL, Butler AE, Hunt SC, Kilpatrick ES. The retinopathy-derived Hba1c threshold of 6.5% for type 2 diabetes also captures the risk of diabetic nephropathy in Nhanes. Diabetes Obes Metab. (2021) 23:2109–15. doi: 10.1111/dom.14449
16. Bohm M, Schumacher H, Teo KK, Lonn EM, Mahfoud F, Emrich I, et al. Renal outcomes and blood pressure patterns in diabetic and nondiabetic individuals at high cardiovascular risk. J Hypertens. (2021) 39:766–74. doi: 10.1097/HJH.0000000000002697
17. Sung KC, Ryu S, Lee JY, Lee SH, Cheong E, Hyun YY, et al. Urine Albumin/Creatinine Ratio Below 30 Mg/G Is a Predictor of Incident Hypertension and Cardiovascular Mortality. J Am Heart Assoc. (2016) 5:e003245. doi: 10.1161/JAHA.116.003245
18. Xie X, Peng Z, Li H, Li D, Tu Y, Bai Y, et al. Association of urine albumin/creatinine ratio below 30 mg/g and left ventricular hypertrophy in patients with type 2 diabetes. Biomed Res Int. (2020) 2020:5240153. doi: 10.1155/2020/5240153
19. American Diabetes Association Professional Practice Committee, Draznin B, Aroda VR, Bakris G, Benson G. 2. Classification and diagnosis of diabetes: standards of medical care in diabetes-2022. Diabetes Care. (2022) 45(Suppl. 1):S17–38. doi: 10.2337/dc22-S002
20. Wang S, Wang Y, Wan X, Guo J, Zhang Y, Tian M, et al. Cobalamin intake and related biomarkers: examining associations with mortality risk among adults with type 2 diabetes in Nhanes. Diabetes Care. (2022) 45:276–84. doi: 10.2337/dc21-1674
21. Gong R, Luo G, Wang M, Ma L, Sun S, Wei X. Associations between Tg/Hdl ratio and insulin resistance in the us population: a cross-sectional study. Endocr Connect. (2021) 10:1502–12. doi: 10.1530/EC-21-0414
22. Va P, Dodd KW, Zhao L, Thompson-Paul AM, Mercado CI, Terry AL, et al. Evaluation of measurement error in 24-hour dietary recall for assessing sodium and potassium intake among US adults – national health and nutrition examination survey (Nhanes), 2014. Am J Clin Nutr. (2019) 109:1672–82. doi: 10.1093/ajcn/nqz044
23. Kushner RF, Ryan DH. Assessment and lifestyle management of patients with obesity: clinical recommendations from systematic reviews. JAMA. (2014) 312:943–52. doi: 10.1001/jama.2014.10432
24. Levey AS, Stevens LA, Schmid CH, Zhang YL, Castro AF III, Feldman HI, et al. A new equation to estimate glomerular filtration rate. Ann Intern Med. (2009) 150:604–12. doi: 10.7326/0003-4819-150-9-200905050-00006
25. Johnson CL, Paulose-Ram R, Ogden CL, Carroll MD, Kruszon-Moran D, Dohrmann SM, et al. National health and nutrition examination survey: analytic guidelines, 1999-2010. Vital Health Stat. (2013) 2:1–24.
26. Tang H, Liu N, Feng X, Yang Y, Fang Y, Zhuang S, et al. Circulating levels of Il-33 are elevated by obesity and positively correlated with metabolic disorders in Chinese adults. J Transl Med. (2021) 19:52. doi: 10.1186/s12967-021-02711-x
27. Sheen YJ, Lin JL, Li TC, Bau CT, Sheu WH. Systolic blood pressure as a predictor of incident albuminuria and rapid renal function decline in type 2 diabetic patients. J Diabetes Complications. (2014) 28:779–84. doi: 10.1016/j.jdiacomp.2014.08.002
28. Strandberg TE, Pitkala K. What is the most important component of blood pressure: systolic, diastolic or pulse pressure? Curr Opin Nephrol Hypertens. (2003) 12:293–7. doi: 10.1097/00041552-200305000-00011
29. American Diabetes Association. 6. Glycemic targets: standards of medical care in diabetes-2021. Diabetes Care. (2021) 44(Suppl. 1):S73–84. doi: 10.2337/dc21-S006
30. Turner R, Fox C, Matthews, Mcelroy H, Cull C, Holman R, et al. Intensive blood-glucose control with sulphonylureas or insulin compared with conventional treatment and risk of complications in patients with type 2 diabetes (Ukpds 33). UK prospective diabetes study (Ukpds) group. Lancet. (1998) 352:837–53.
31. Ismail-Beigi F, Craven T, Banerji MA, Basile J, Calles J, Cohen RM, et al. Effect of intensive treatment of hyperglycaemia on microvascular outcomes in type 2 diabetes: an analysis of the accord randomised trial. Lancet. (2010) 376:419–30. doi: 10.1016/S0140-6736(10)60576-4
32. Laiteerapong N, Ham SA, Gao Y, Moffet HH, Liu JY, Huang ES, et al. The legacy effect in type 2 diabetes: impact of early glycemic control on future complications (the diabetes & aging study). Diabetes Care. (2019) 42:416–26. doi: 10.2337/dc17-1144
33. Schottker B, Brenner H, Koenig W, Muller H, Rothenbacher D. Prognostic association of Hba1c and fasting plasma glucose with reduced kidney function in subjects with and without diabetes mellitus. results from a population-based cohort study from Germany. Prev Med. (2013) 57:596–600.
34. Szyndler A. [Commentary to the articles: kaplan nm. vascular outcome in type 2 diabetes: an advance? lancet 2007; 370:804-5; Patel a; advance collaborative group, Macmahon S, Chalmers J, Neal B I Wsp. Effects of a fixed combination of perindopril and indapamide on macrovascular and microvascular outcomes in patients with type 2 diabetes mellitus (the advance trial): a randomised controlled trial. lancet 2007; 370:829-40]. Kardiol Pol. (2007) 65:1527–9; discussion 30.
35. Group AS, Cushman WC, Evans GW, Byington RP, Goff DC Jr., Grimm RH Jr., et al. Effects of intensive blood-pressure control in type 2 diabetes mellitus. N Engl J Med. (2010) 362:1575–85. doi: 10.1056/NEJMoa1001286
36. Group SR, Wright JT Jr., Williamson JD, Whelton PK, Snyder JK, Sink KM, et al. A randomized trial of intensive versus standard blood-pressure control. N Engl J Med. (2015) 373:2103–16. doi: 10.1056/NEJMoa1511939
37. Beddhu S, Greene T, Boucher R, Cushman WC, Wei G, Stoddard G, et al. Intensive systolic blood pressure control and incident chronic kidney disease in people with and without diabetes mellitus: secondary analyses of two randomised controlled trials. Lancet Diabetes Endocrinol. (2018) 6:555–63. doi: 10.1016/S2213-8587(18)30099-8
38. Anderson RJ, Bahn GD, Emanuele NV, Marks JB, Duckworth WC, Group VS. Blood pressure and pulse pressure effects on renal outcomes in the veterans affairs diabetes trial (Vadt). Diabetes Care. (2014) 37:2782–8. doi: 10.2337/dc14-0284
39. Zoungas S, de Galan BE, Ninomiya T, Grobbee D, Hamet P, Heller S, et al. Combined effects of routine blood pressure lowering and intensive glucose control on macrovascular and microvascular outcomes in patients with type 2 diabetes: new results from the advance trial. Diabetes Care. (2009) 32:2068–74. doi: 10.2337/dc09-0959
40. Patel A, Group AC, MacMahon S, Chalmers J, Neal B, Woodward M, et al. Effects of a fixed combination of perindopril and indapamide on macrovascular and microvascular outcomes in patients with type 2 diabetes mellitus (the advance trial): a randomised controlled trial. Lancet. (2007) 370:829–40. doi: 10.1016/S0140-6736(07)61303-8
41. Khitan Z, Nath T, Santhanam P. Machine learning approach to predicting albuminuria in persons with type 2 diabetes: an analysis of the look ahead cohort. J Clin Hypertens (Greenwich). (2021) 23:2137–45. doi: 10.1111/jch.14397
42. De Miguel C, Lund H, Mattson DL. High dietary protein exacerbates hypertension and renal damage in dahl SS rats by increasing infiltrating immune cells in the kidney. Hypertension. (2011) 57:269–74. doi: 10.1161/HYPERTENSIONAHA.110.154302
43. Lee CM, Huxley RR, Wildman RP, Woodward M. Indices of abdominal obesity are better discriminators of cardiovascular risk factors than BMI: a meta-analysis. J Clin Epidemiol. (2008) 61:646–53. doi: 10.1016/j.jclinepi.2007.08.012
44. De Cosmo S, Menzaghi C, Prudente S, Trischitta V. Role of insulin resistance in kidney dysfunction: insights into the mechanism and epidemiological evidence. Nephrol Dial Transplant. (2013) 28:29–36. doi: 10.1093/ndt/gfs290
45. Aaron KJ, Campbell RC, Judd SE, Sanders PW, Muntner P. Association of dietary sodium and potassium intakes with albuminuria in normal-weight, overweight, and obese participants in the reasons for geographic and racial differences in stroke (regards) study. Am J Clin Nutr. (2011) 94:1071–8. doi: 10.3945/ajcn.111.013094
46. Thomas MC, Brownlee M, Susztak K, Sharma K, Jandeleit-Dahm KA, Zoungas S, et al. Diabetic kidney disease. Nat Rev Dis Prim. (2015) 1:15018. doi: 10.1038/nrdp.2015.18
47. Mortada I. Hyperuricemia, type 2 diabetes mellitus, and hypertension: an emerging association. Curr Hypertens Rep. (2017) 19:69. doi: 10.1007/s11906-017-0770-x
Keywords: risk thresholds, glycated hemoglobin, systolic blood pressure, albuminuria, type 2 diabetes, NHANES
Citation: Xu J, Xue Y, Chen Q, Han X, Cai M, Tian J, Jin S and Lu H (2022) Identifying Distinct Risk Thresholds of Glycated Hemoglobin and Systolic Blood Pressure for Rapid Albuminuria Progression in Type 2 Diabetes From NHANES (1999–2018). Front. Med. 9:928825. doi: 10.3389/fmed.2022.928825
Received: 26 April 2022; Accepted: 12 May 2022;
Published: 20 June 2022.
Edited by:
Md. Mohaimenul Islam, Aesop Technology, TaiwanReviewed by:
Noriyuki Kitagawa, Kameoka Municipal Hospital, JapanCopyright © 2022 Xu, Xue, Chen, Han, Cai, Tian, Jin and Lu. This is an open-access article distributed under the terms of the Creative Commons Attribution License (CC BY). The use, distribution or reproduction in other forums is permitted, provided the original author(s) and the copyright owner(s) are credited and that the original publication in this journal is cited, in accordance with accepted academic practice. No use, distribution or reproduction is permitted which does not comply with these terms.
*Correspondence: Hao Lu, bHVoYW80MDNAMTYzLmNvbQ==
†These authors have contributed equally to this work and share first authorship
Disclaimer: All claims expressed in this article are solely those of the authors and do not necessarily represent those of their affiliated organizations, or those of the publisher, the editors and the reviewers. Any product that may be evaluated in this article or claim that may be made by its manufacturer is not guaranteed or endorsed by the publisher.
Research integrity at Frontiers
Learn more about the work of our research integrity team to safeguard the quality of each article we publish.