 Peng Hu1,2†
 Murui Zheng3†Jun Huang4†Huan-Ying Fan5Chun-Jiang Fan6Hui-Hong Ruan7Yue-Shuang Yuan5Wenjing Zhao8*
 Harry H. X. Wang2,9Hai Deng10*
 Xudong Liu1*
- 1School of Public Health, Guangdong Pharmaceutical University, Guangzhou, China
- 2Department of Epidemiology, School of Public Health, Sun Yat-sen University, Guangzhou, China
- 3Guangzhou Center for Disease Control and Prevention, Guangzhou, China
- 4Department of Geriatrics, Guangdong Provincial People’s Hospital, Institute of Geriatrics, Guangdong Academy of Medical Science, Guangzhou, China
- 5Xinzao Hospital of Guangzhou Panyu District, Guangzhou, China
- 6Community Health Service Center of Nancun Town, Guangzhou, China
- 7Community Health Service Center of Hualong Town, Guangzhou, China
- 8School of Public Health and Emergency Management, Southern University of Science and Technology, Shenzhen, China
- 9JC School of Public Health and Primary Care, The Chinese University of Hong Kong, Hong Kong, Hong Kong SAR, China
- 10Department of Cardiology, Guangdong Provincial People’s Hospital, Guangdong Cardiovascular Institute, Guangdong Academy of Medical Science, Guangzhou, China
Background: Limited evidence was available on the association of the integrated effect of multidimensional lifestyle factors with mortality among Chinese populations. This cohort study was to examine the effect of combined lifestyle factors on the risk of mortality by highlighting the number of healthy lifestyles and their overall effects.
Methods: A total of 11,395 participants from the Guangzhou Heart Study (GZHS) were followed up until 1 January 2020. Individual causes of death were obtained from the platform of the National Death Registry of China. The healthy lifestyle index (HLI) was established from seven dimensions of lifestyle, and lifestyle patterns were extracted from eight dimensions of lifestyle using principal component analysis (PCA). Hazard ratios (HRs) and 95% confidence intervals (95% CIs) were estimated using the Cox proportional hazard regression model.
Results: During 35,837 person-years of follow-up, 184 deaths (1.61%) were observed, including 64 from cardiovascular disease. After adjustment for confounders, HLI was associated with a 50% (HR: 0.50, 95% CI: 0.25–0.99) reduced risk of all-cause mortality when comparing the high (6–7 lifestyle factors) with low (0–2 lifestyle factors) categories. Three lifestyle patterns were defined and labeled as pattern I, II, and III. Lifestyle pattern II with higher factor loadings of non-smoking and low-level alcohol drinking was associated with a decreased risk of all-cause mortality (HR: 0.63, 95% CI: 0.43–0.92, P–trend = 0.023) when comparing the high with low tertiles of pattern score, after adjustment for confounders. Every 1-unit increment of pattern II score was associated with a decreased risk (HR: 0.97, 95% CI: 0.95–0.99) of all-cause mortality. The other two patterns were not associated with all-cause mortality, and the association of cardiovascular mortality risk was observed with neither HLI nor any lifestyle pattern.
Conclusion: The results suggest that the more dimensions of the healthy lifestyle the lower the risk of death, and adherence to the lifestyle pattern characterized with heavier loading of non-smoking and low-level alcohol drinking reduces the risk of all-cause mortality. The findings highlight the need to consider multi-dimensional lifestyles rather than one when developing health promotion strategies.
Introduction
Non-communicable diseases (NCDs) have encroached on many low- and middle-income countries, and become the leading cause of death worldwide (1). Available evidence suggested that lifestyle factors were associated with multiple NCDs (2), and adherence to a healthy lifestyle was associated with a lower risk of NCDs and mortality (3–8). Meanwhile, multiple lifestyle risk factors may have a synergistic effect on adverse health outcomes (9, 10). Hence, reducing exposure to lifestyle risk factors is of great significance for public health prevention and medical resource allocation (11).
Many studies have constructed healthy lifestyle scores to reflect the combined impact of major lifestyle factors, including smoking, alcohol consumption, body mass index (BMI), unhealthy diet, and physical inactivity, on mortality (12–14). A systematic review and meta-analysis found that adherence to the healthiest lifestyles was associated with a 55 and 58% reduced risk of all-cause mortality and cardiovascular mortality, respectively, compared with the least-healthy lifestyles (15). However, other unmentioned factors may also play a significant role in mortality risk. For instance, sleep is a critical bodily function (16), and poor sleep quality has been identified as a risk factor for many adverse health outcomes, such as all-cause mortality, cardiovascular death, etc. (17–19). The mental state is also an important aspect of health, and people with mental disorders have a higher risk of death (20, 21). Pratt and colleagues found that people with anxiety and depression had significantly high mortality than people without such mental disorders (21). In addition, current research mainly reflected the overall impact of lifestyle through the number of lifestyle factors, while ignoring the possible interactions between each factor. Principal component analysis (PCA) is an effective approach to reflect the combined effect of different components by generating different patterns, and using such an approach can avoid ignoring the interaction between some components (22). The human lifestyle is a complex whole with multiple dimensions, and it is important to consider as many of these dimensions as possible when quantifying lifestyle and assessing its impact on health.
Therefore, this prospective cohort study aimed to examine the combined effect of major lifestyle factors, including leisure-time physical activity (LTPA), diet, BMI, smoking, alcohol drinking, sleep quality, and mental status (anxiety, and depression), on the risk of all-cause and cardiovascular mortality, by establishing a healthy lifestyle index (HLI) to reflect the number of healthy lifestyle components and generating the lifestyle patterns to reflect the whole lifestyle profile.
Materials and methods
Study population
Guangzhou Heart Study (GZHS) is an ongoing prospective population-based cohort study in South China. Details of GZHS can be seen in our previous reports (23–25). Briefly, a total of 12,013 permanent residents aged 35 years or more were enrolled using the multistage sampling method; the baseline survey was successfully conducted between July 2015 and August 2017. Participants included met the following criteria: permanent residents in Guangzhou, aged 35 years or older, and had lived in the selected communities for at least 6 months before the survey. Participants with incomplete information of covariates (19 participants) or with a history of cardiovascular diseases including atrial fibrillation, heart failure, myocardial infarction, and valvular heart disease (589 participants) were excluded. Finally, a total of 11,395 participants were available for further analysis.
This study was approved by the Guangzhou Medical Ethics Committee of the Chinese Medical Association and by the Ethical Review Committee for Biomedical Research, School of Public Health, Sun Yat-sen University. The study was performed in line with the Declaration of Helsinki and all participants provided informed consent.
Outcome ascertainment
The outcome of interest was all-cause mortality and cardiovascular mortality. Individual causes of death up to 1 January 2020 were collected from China’s National Death Registry, Guangzhou Center for Disease Control and Prevention. The follow-up time was defined as the time from participation in the GZHS to the date of the decedent’s death or to the censoring date (1 January 2020) for survivors. The causes of death were coded by professional medical workers according to the 10th revision of the International Classification of Disease and were further classified as all-cause death and death from cardiovascular diseases (I00-I99).
Assessment of lifestyle factors
Structured questionnaires were used to collect information on social demographics, lifestyle, and disease history by using face-to-face interviews. The social demographics included age (years), sex (male, female), education (<high school, high school, >high school), and marital status (married, others). The medical examination was performed on each participant; height and weight were measured to calculate BMI (kg/m2); a normal BMI was defined as BMI in the range of 18.5–23.9 kg/m2 according to the Chinese standard (26), otherwise as unhealthy BMI.
The exposure information on cigarette smoking and alcohol drinking was collected using a structured questionnaire. For cigarette smoking, participants who have never smoked or smoked < 100 cigarettes in their lifetime were classified as non-smokers, and those who have currently smoked or smoked ≥ 100 cigarettes in their lifetime were classified as smokers. For alcohol drinking, participants were asked to report their drinking status. Participants who reported “frequent drinking” were considered as high-level alcohol drinking, and those who reported “never drinking or alcohol cessation” or “occasional drinking” were considered as low-level alcohol drinking.
Dietary consumption from each participant was collected using a 22-item food frequency questionnaire (FFQ) (24). Participants were asked to report their intake frequency of each food item (<once per month, 1–3 times per month, 1–3 times per week, 4–6 times per week, and ≥ once per day) over the previous 12 months. A total of 12 major food items in FFQ (cereals, legumes, vegetables, fruit, dairy, nuts, fish and shrimps, poultry, red meat, fried foods, high-salt foods, and sugary beverages) were used to create a diet quality score based on the latest Chinese Dietary Guidelines (27). First, a point was assigned to each category of the intake frequency (Supplementary Table 1): for cereals, fruit, dairy, and nuts, 0, 2, 4, 6, and 8 points were assigned to < once a month, 1–3 times a month, 1–3 times a week, 4–6 times a week, and 1–6 times a day, respectively; for legumes, vegetables, fish and shrimps, and poultry, 0, 1, 2, 3, and 4 were assigned to < once a month, 1–3 times a month, 1–3 times a week, 4–6 times a week, and 1–6 times a day respectively; for red meat, fried food, high-salted food, and sugary beverages, 8, 6, 4, 2, and 0 points were assigned to < once a month, 1–3 times a month, 1–3 times a week, 4–6 times a week, and 1–6 times a day, respectively (6, 28). Then, the total score for the diet quality was equal to the sum of points of 12 selected food items. Accordingly, the diet quality score ranged from 0 (lowest) to 80 (highest). If the dietary quality score for a participant was 50 points or more (in the upper two-fifths of all participants), then this participant was considered to have a healthy diet, otherwise have an unhealthy diet.
LTPA was evaluated by a modified Global Physical Activity Questionnaire (29). The total volume of LTPA for each subject was calculated as the sum of volumes of eight categories of most common LTPA including Tai Chi/Qigong, housework, stroll, bicycling, brisk walking/exercises/Yangko, swimming, ball games (basketball, table tennis, badminton, etc.), long-distance running/aerobics dancing. The value of each LTPA was calculated by multiplying the duration of activity by its frequency and then by its intensity (quantified by the value of metabolic equivalent, MET). More details on the assessment of physical activity can be seen in our previous report (25). According to the guidelines on physical activity by World Health Organization (WHO), to attain substantial health benefits, adults should do at least 150–300 min of moderate-intensity aerobic physical activity, or at least 75–150 min of vigorous-intensity aerobic physical activity, or an equivalent combination of moderate- and vigorous-intensity activity throughout the week (30); this means that conducting activity with at least 10 MET-hours/week is suggested to reach the minimum level of the recommended standard (30).
Sleep quality was assessed with two questions (17). The participants were asked to answer the question “Did you feel tired after waking up in the morning?” If the response of a participant was “yes,” then the participant was further required to report the frequency of tiredness after waking up in the morning during the past year, with five choices of “every day,” “3–4 times per week,” “1–2 times per week,” “1–2 times per month,” and “never.” The participants were considered as having poor sleep quality if their choice were “every day” or “3–4 times per week”; otherwise, the participants were regarded as having good sleep quality.
Mental status including anxiety and depression were evaluated by the Self-Rating Anxiety Scale (SAS) and the Center for Epidemiologic Studies Depression Scale (CES-D) (31, 32). The SAS index score ranged from 25 to 100 and a participant with a SAS index score ≥ 45 was considered as having anxiety. The CES-D score ranges from 0 to 60 and a participant with ≥ 16 was considered as having depression. Because the number of participants with depression in our study was small, when establishing the HLI, the participants who had either anxiety neurosis or depression were classified as having an unhealthy mental status, otherwise as having a healthy mental status.
Healthy lifestyle index establishment
The detail of the definition of the HLI was shown in Table 1. The HLI was established by using seven dominant factors including BMI, cigarette smoking, alcohol drinking, dietary quality, LTPA, sleep quality, and mental status. These factors were shown as dichotomous variables, and the definitions of these variables were mentioned above. The score for each lifestyle factor was defined as follows: BMI (1 = normal BMI, 0 = unhealthy BMI), alcohol drinking (1 = low-level alcohol drinking, 0 = high-level alcohol drinking), cigarette smoking (1 = non-smoker, 0 = smoker), diet quality (1 = healthy diet, 0 = unhealthy diet), LTPA (1 = reach the minimum level of the recommended standard by WHO, 0 = not reach the minimum level of the recommended standard by WHO), sleep quality (1 = good sleep quality, 0 = poor sleep quality), and mental status (1 = unhealthy mental status, 0 = healthy mental status). The total score for HLI was calculated as the sum of the scores of seven selected factors. The score for HLI ranged from zero to seven (healthiest) points. The HLI was further transformed to the categorical variable: low (0–2 score), moderate (3–5 score), and high (6–7 score).
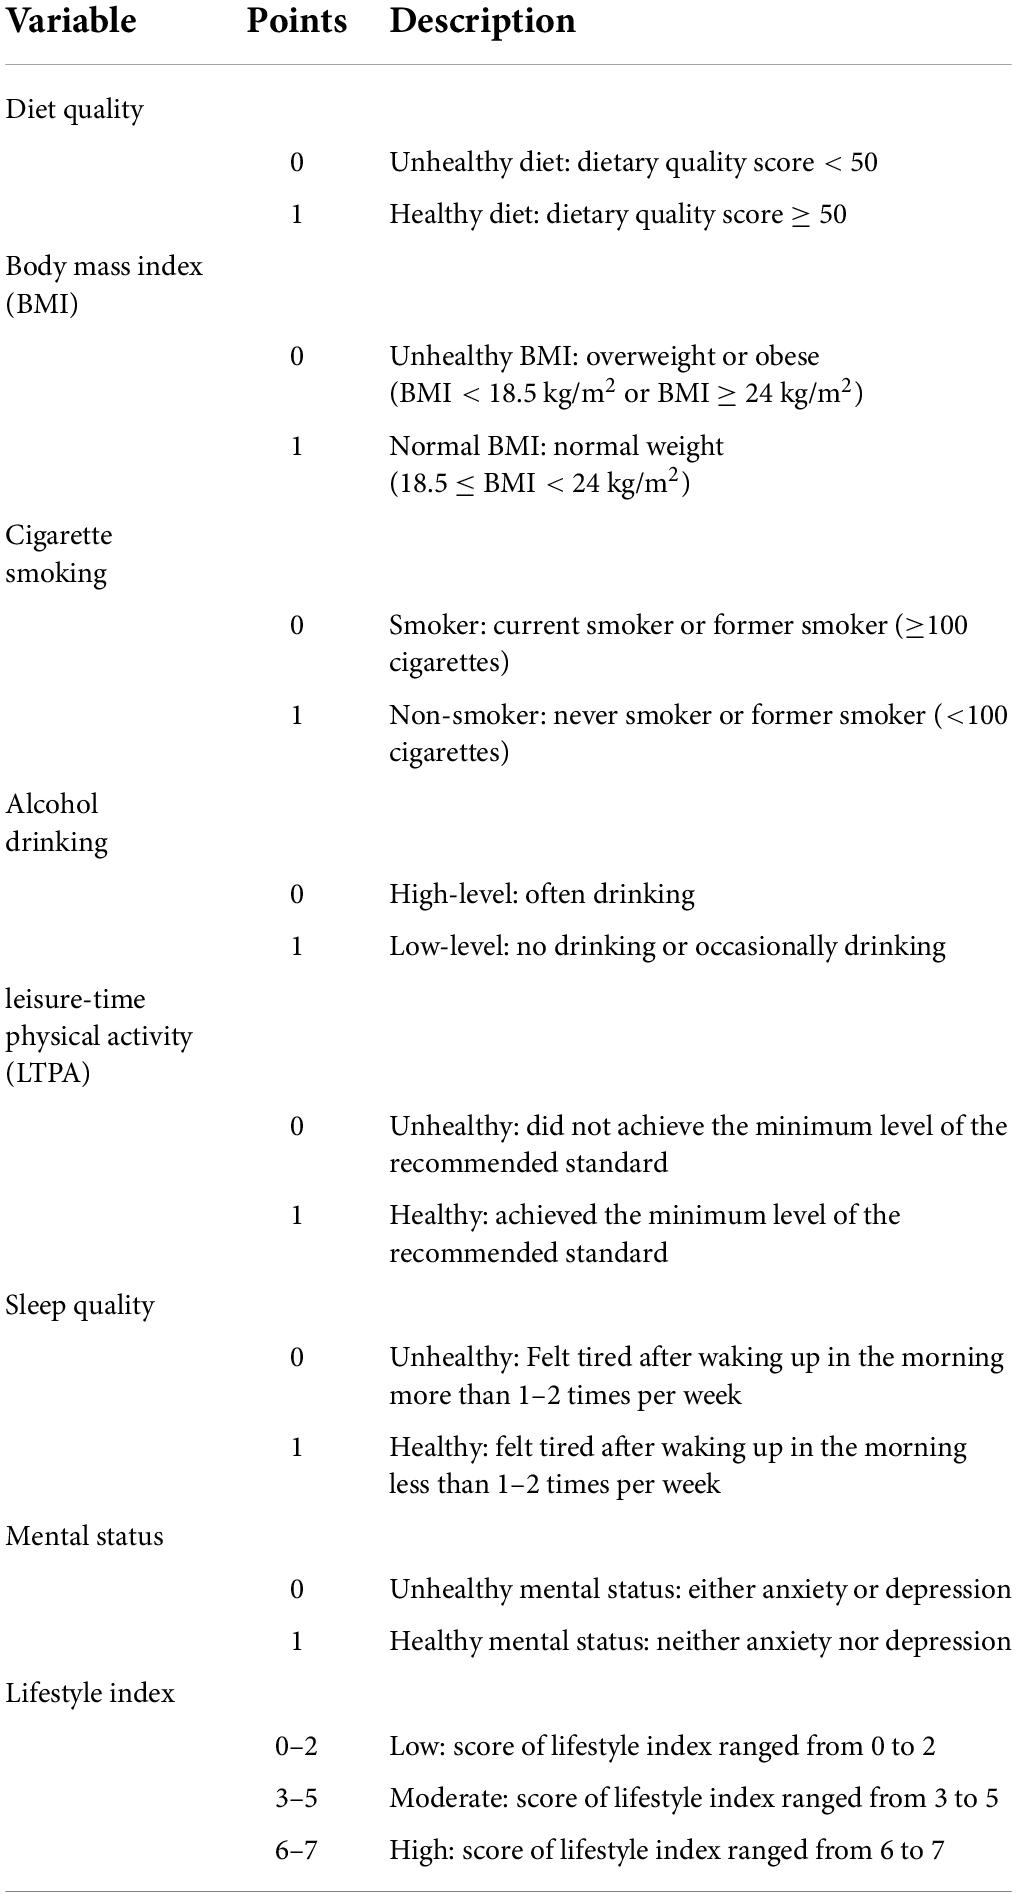
Table 1. The definition of the healthy lifestyle index.
Lifestyle pattern extraction
The lifestyle pattern was extracted by using the PCA with the varimax-rotated transformation from eight lifestyle components: BMI, diet quality, LTPA, depression (CES-D score), anxiety (SAS index score), cigarette smoking, alcohol drinking, and sleep quality. To perform the PCA, the categorical variables of cigarette smoking, alcohol drinking, and sleep quality were transformed into the continuous variable. For cigarette smoking, a score of 1 and 0 was assigned to the non-smoker and the smoker, respectively; for alcohol drinking, a score of 1 and 0 was assigned to the low-level alcohol drinking and the high-level alcohol drinking, respectively; for sleep quality, a simple score was assigned to each category of the frequency of tiredness after waking up in the morning during the past year: 1 = “every day,” 2 = “3–4 times per week,” 4 = “1–2 times per week,” 5 = “never.”
PCA used the correlation matrix of different lifestyle factors to identify common patterns of lifestyle factors within the data to account for the largest amount of variation in lifestyle. The varimax rotation is a statistical technique used to evaluate the relationship among individual factors (22). The Kaiser-Meyer-Olkin (KMO) criterion and Bartlett’s test of sphericity were used to evaluate the suitability of using the data for PCA (22). A positive loading for a lifestyle component indicated a direct association with the pattern, while a negative loading showed that this lifestyle component inversely contributed to the pattern. The components in each lifestyle pattern with absolute rotated factor loadings of ≥ 0.40 were referred to as “dominant components” hereafter.
Three lifestyle patterns were finally extracted and labeled as pattern I, pattern II, and pattern III (Supplementary Table 2). The pattern I was characterized with a higher loading of sleep quality, anxiety, and depression, explaining about 37.7% of total variance; Pattern II was characterized with a higher loading of low-level alcohol drinking and non-smoker, explaining about 32.8% of the total variance; Pattern III was characterized with a higher loading of LTPA, BMI, and diet quality, explaining about 29.5% of the total variance. The score of each pattern was calculated with the weighted approach by using rotated loadings as the weight (33): pattern score = ; variable represents each item; weight means the factor loading. Then the score of each pattern was transformed to categorical variables by using the tertile method.
Statistical analysis
The distribution of baseline social-demographics, lifestyle factors, and other covariables was depicted and the difference among different groups was examined by chi-square test for a categorical variable and t-test, or Wilcoxon rank-sum test, or Kruskal-Wallis rank-sum test, or one-way analysis of variance for a continuous variable.
Cox proportional hazard regression model was performed to estimate the hazard ratio (HR) and their 95% confidence interval (Cl) before and after adjustment for confounders, to demonstrate the effects of individual lifestyle factors, HLI, and three lifestyle patterns on all-cause mortality and cardiovascular mortality. The proportional hazard assumption was examined using the Schoenfeld residuals method, and no significant violation of the assumption was observed. The linear exposure-response trend was examined by using Wald statistic.
Two sensitivity analyses were conducted to test the robustness of the results. To eliminate the possible effect of weight loss secondary to preclinical diseases, we excluded the participants with a BMI below 18.5 kg/m2. To exclude the possibility of reverse causality, we excluded participants who died within the first year after they finished the baseline survey. A product term between sex and HLI or each lifestyle pattern was added in the model to evaluate the possible multiplicative interaction by using the likelihood ratio test; however, no significant interaction was observed. All analyses were performed with R 4.0.1 (R Development Core Team, Vienna, Austria); the tests were two-tailed, and a P-value of less than 0.05 was considered statistically significant.
Results
During 35,837 person-years of follow-up, 184 deaths (1.61%) were observed, including 64 deaths from cardiovascular disease. As shown in Table 2, of all subjects, the mean (SD) of age, BMI, diet quality, CES-D score, and SAS index score was 58.36 (11.70) years, 23.97 (3.53) kg/m2, 48.78 (7.55), 11.95 (2.42), and 43.91 (3.16), respectively. The median (IQR) value of LTPA was 34.65 (41.50) MET-h/week. Most participants were females (65.41%), with an education less than high school (63.0%), married (85.27%), non-smokers (79.61%), and never or occasion drinkers (94.01%).
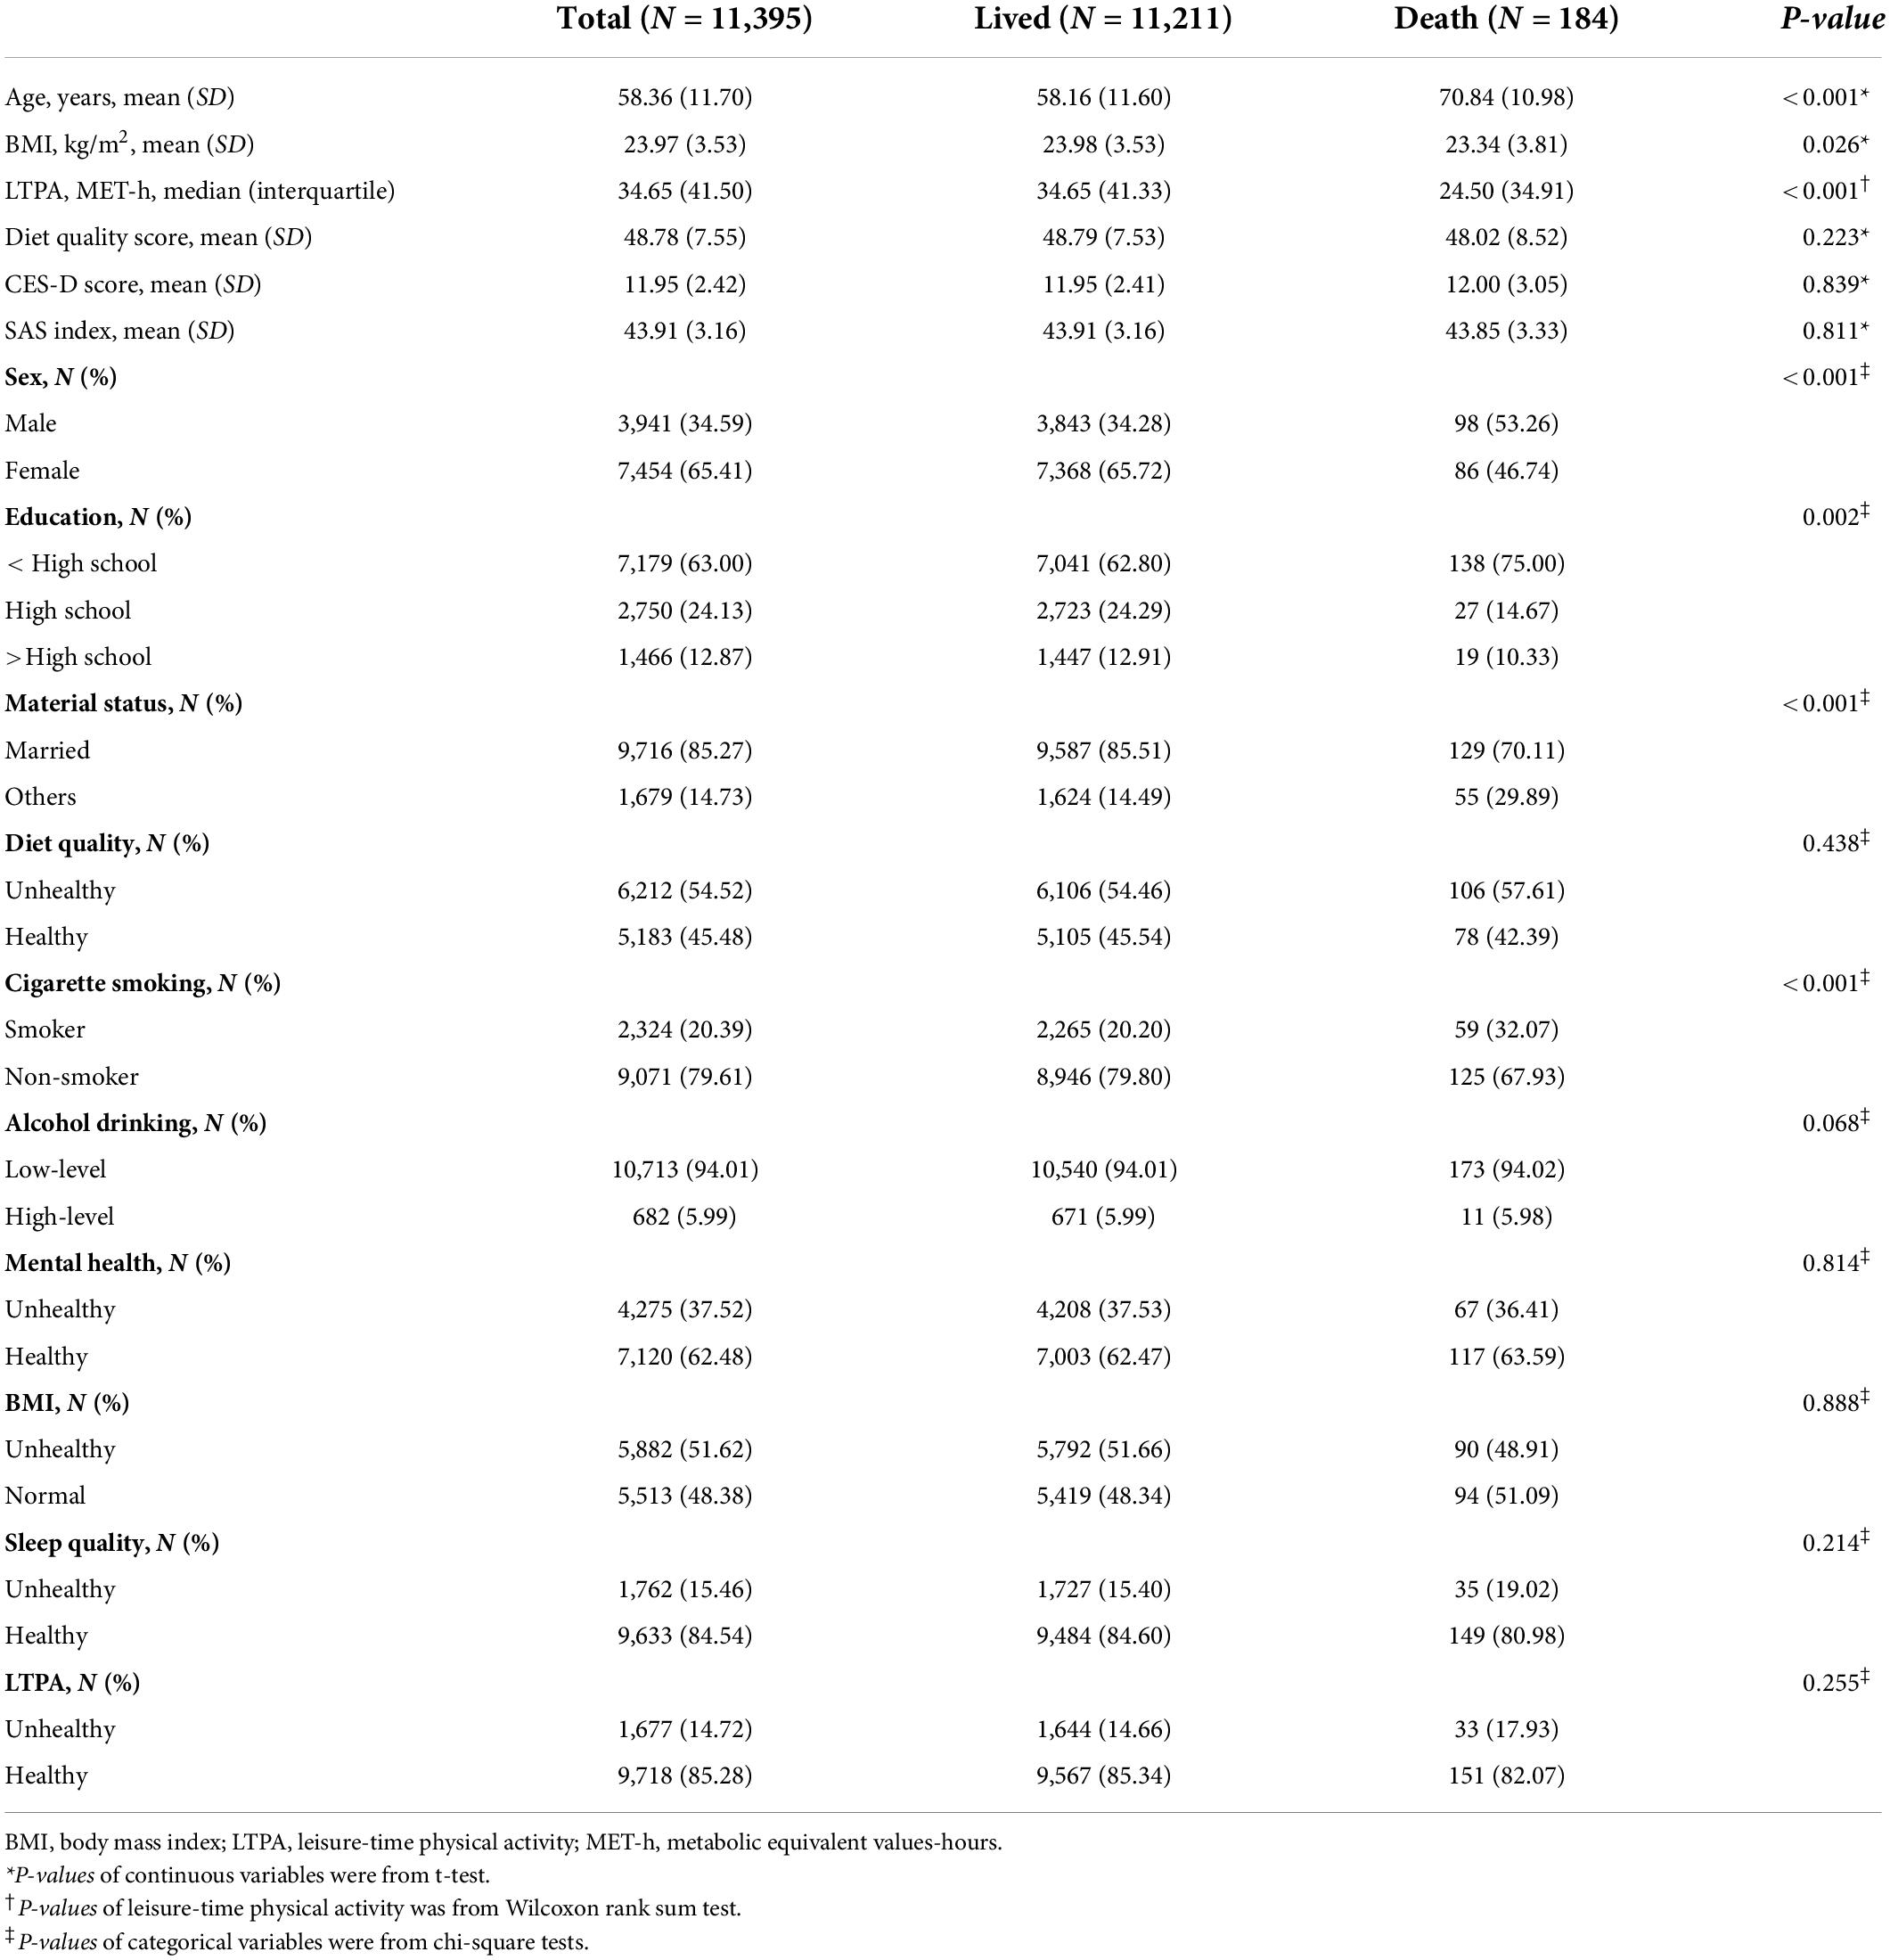
Table 2. The characteristics of participants.
Individuals with higher HLI were more likely to be female and married (Supplementary Table 3). The proportion of participants with the higher education level increased with the increase of the HLI. With the increase of the HLI, participants had a higher level of healthy diet quality, LTPA, sleep quality, and mental health, and a higher proportion of normal BMI, non-smoking, and non-drinking. The means of lifestyle pattern II score and pattern III score were significantly higher in the lived group (P < 0.05), while both lived and death groups had a similar score of lifestyle pattern I (P > 0.05) (Supplementary Table 4).
As shown in Table 3, participants with good sleep quality were associated with a 38% (HR: 0.62, 95% CI: 0.43–0.91) reduced risk of all-cause mortality after adjustment for confounders. No significant association was observed between sleep quality and cardiovascular mortality risk. Other individual factors were not observed to be associated with the risk of all-cause and cardiovascular mortality.
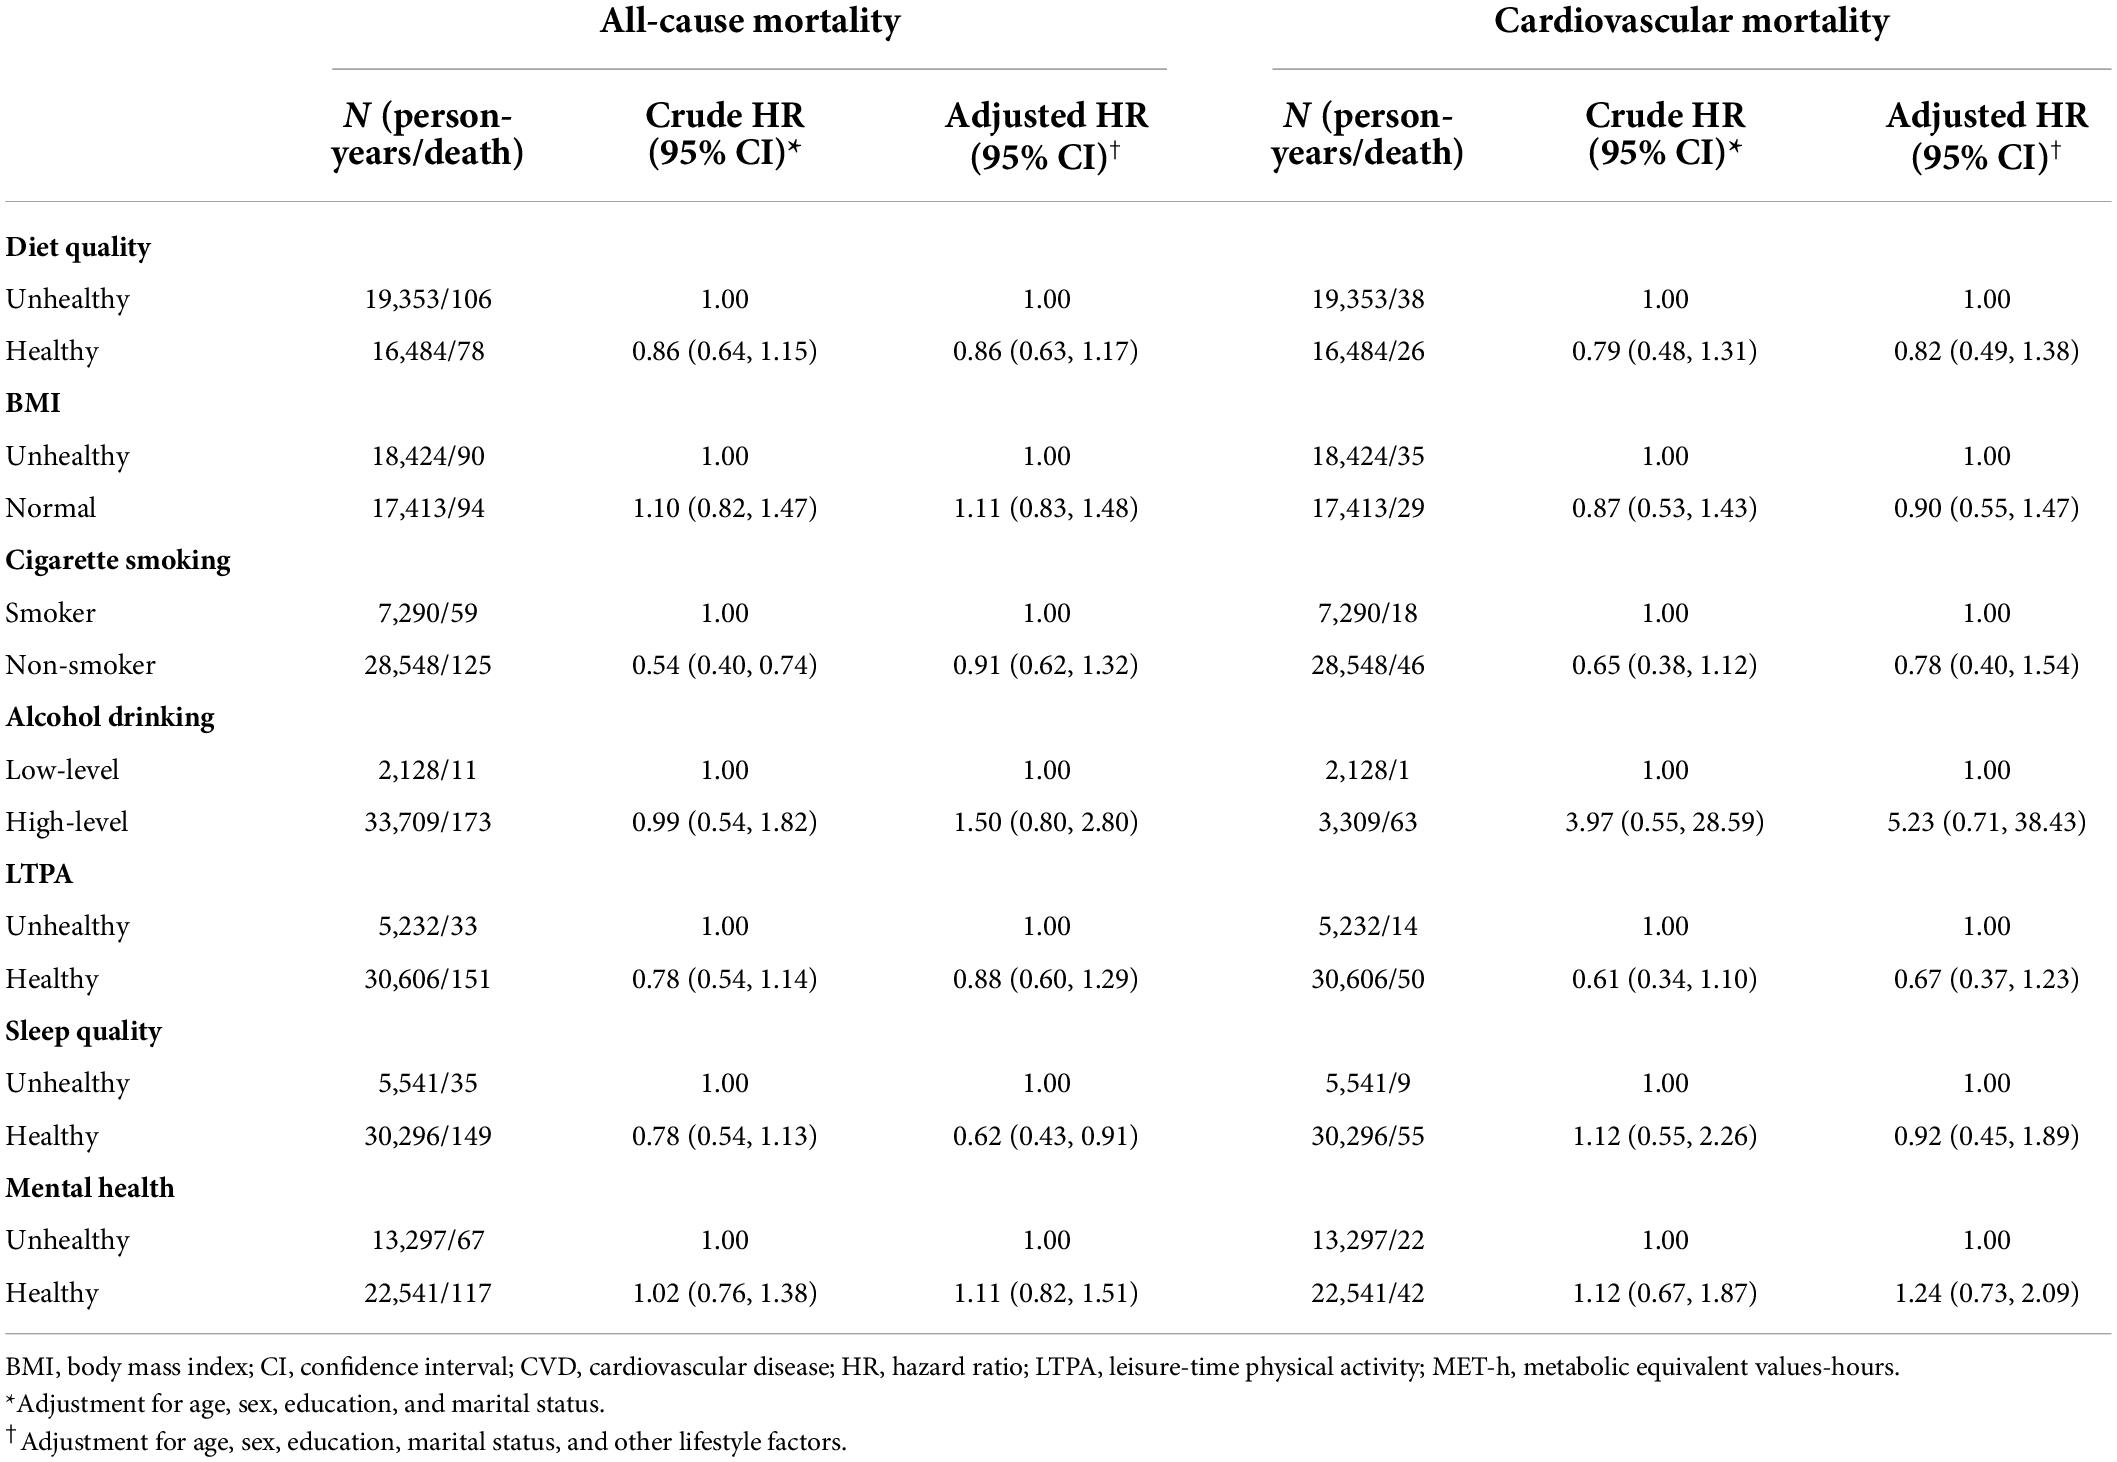
Table 3. Association of individual lifestyle factors with mortality.
Table 4 shows the association of HLI with mortality risk. In comparison to the subjects within the low category of the HLI, those within both the moderate category (HR: 0.48, 95% CI: 0.25–0.93) and the high category (HR: 0.50, 95% CI: 0.25–0.99) were associated with a reduced risk of all-cause mortality after adjustment for confounders. However, no significant association was observed between HLI and cardiovascular mortality risk.
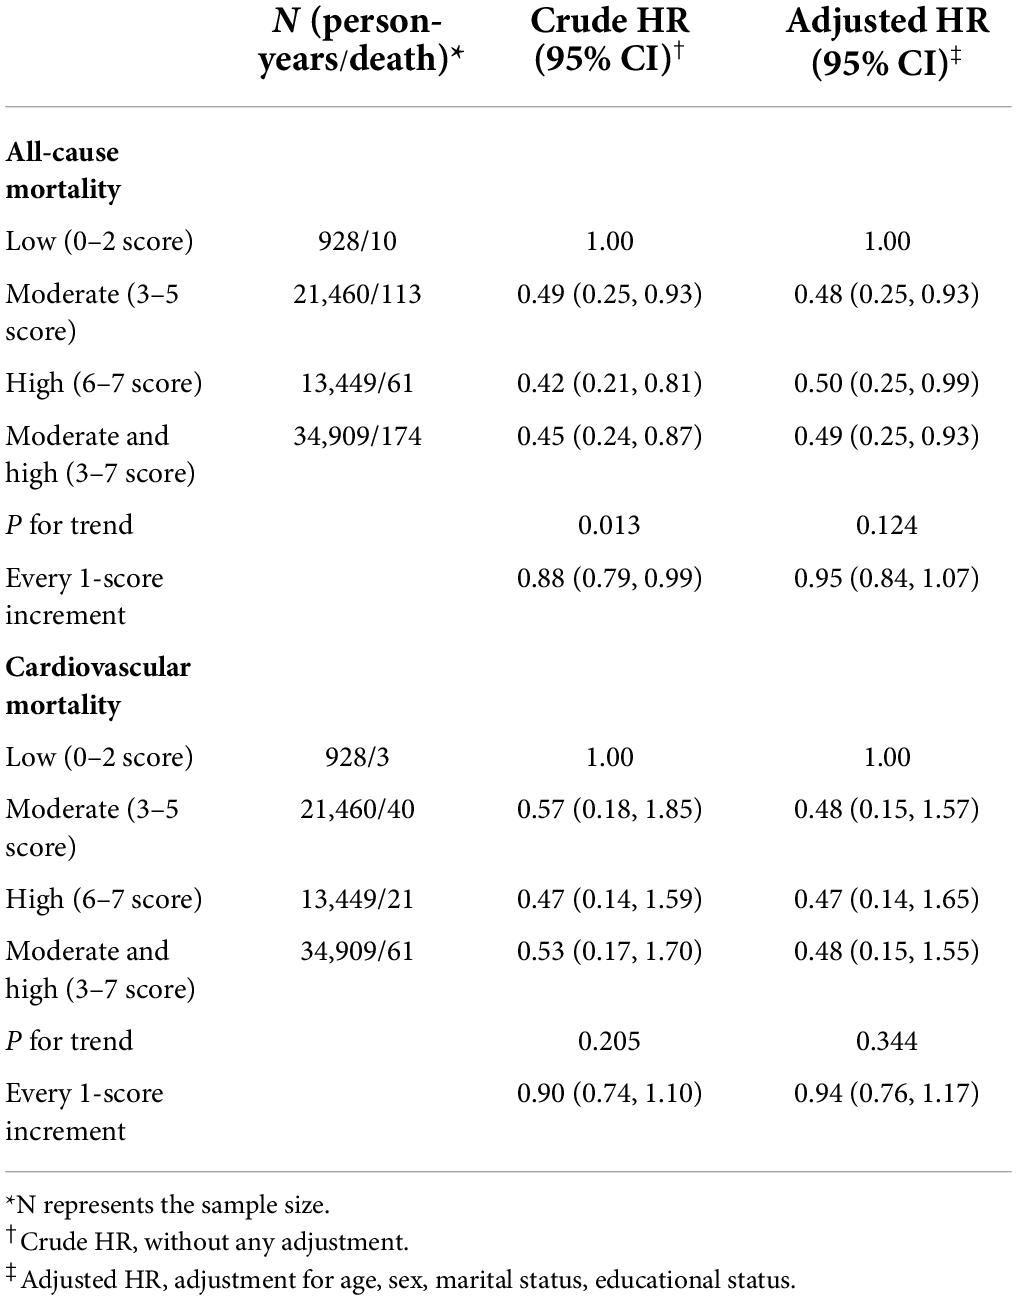
Table 4. Associations of healthy lifestyle index with mortality.
When comparing the highest with lowest tertiles of pattern score, lifestyle pattern II was associated with a 37% (HR: 0.63, 95% CI: 0.43–0.92, P–trend = 0.023) reduced risk of all-cause mortality after adjustment for confounders (Table 5). Every 1 score increment of the lifestyle pattern II was associated with a 3% (HR: 0.97, 95% CI: 0.95–0.99) reduced risk of all-cause mortality. No significant association was observed between the other two lifestyle patterns and the risk of all-cause mortality, and between three lifestyle patterns and the risk of cardiovascular mortality.
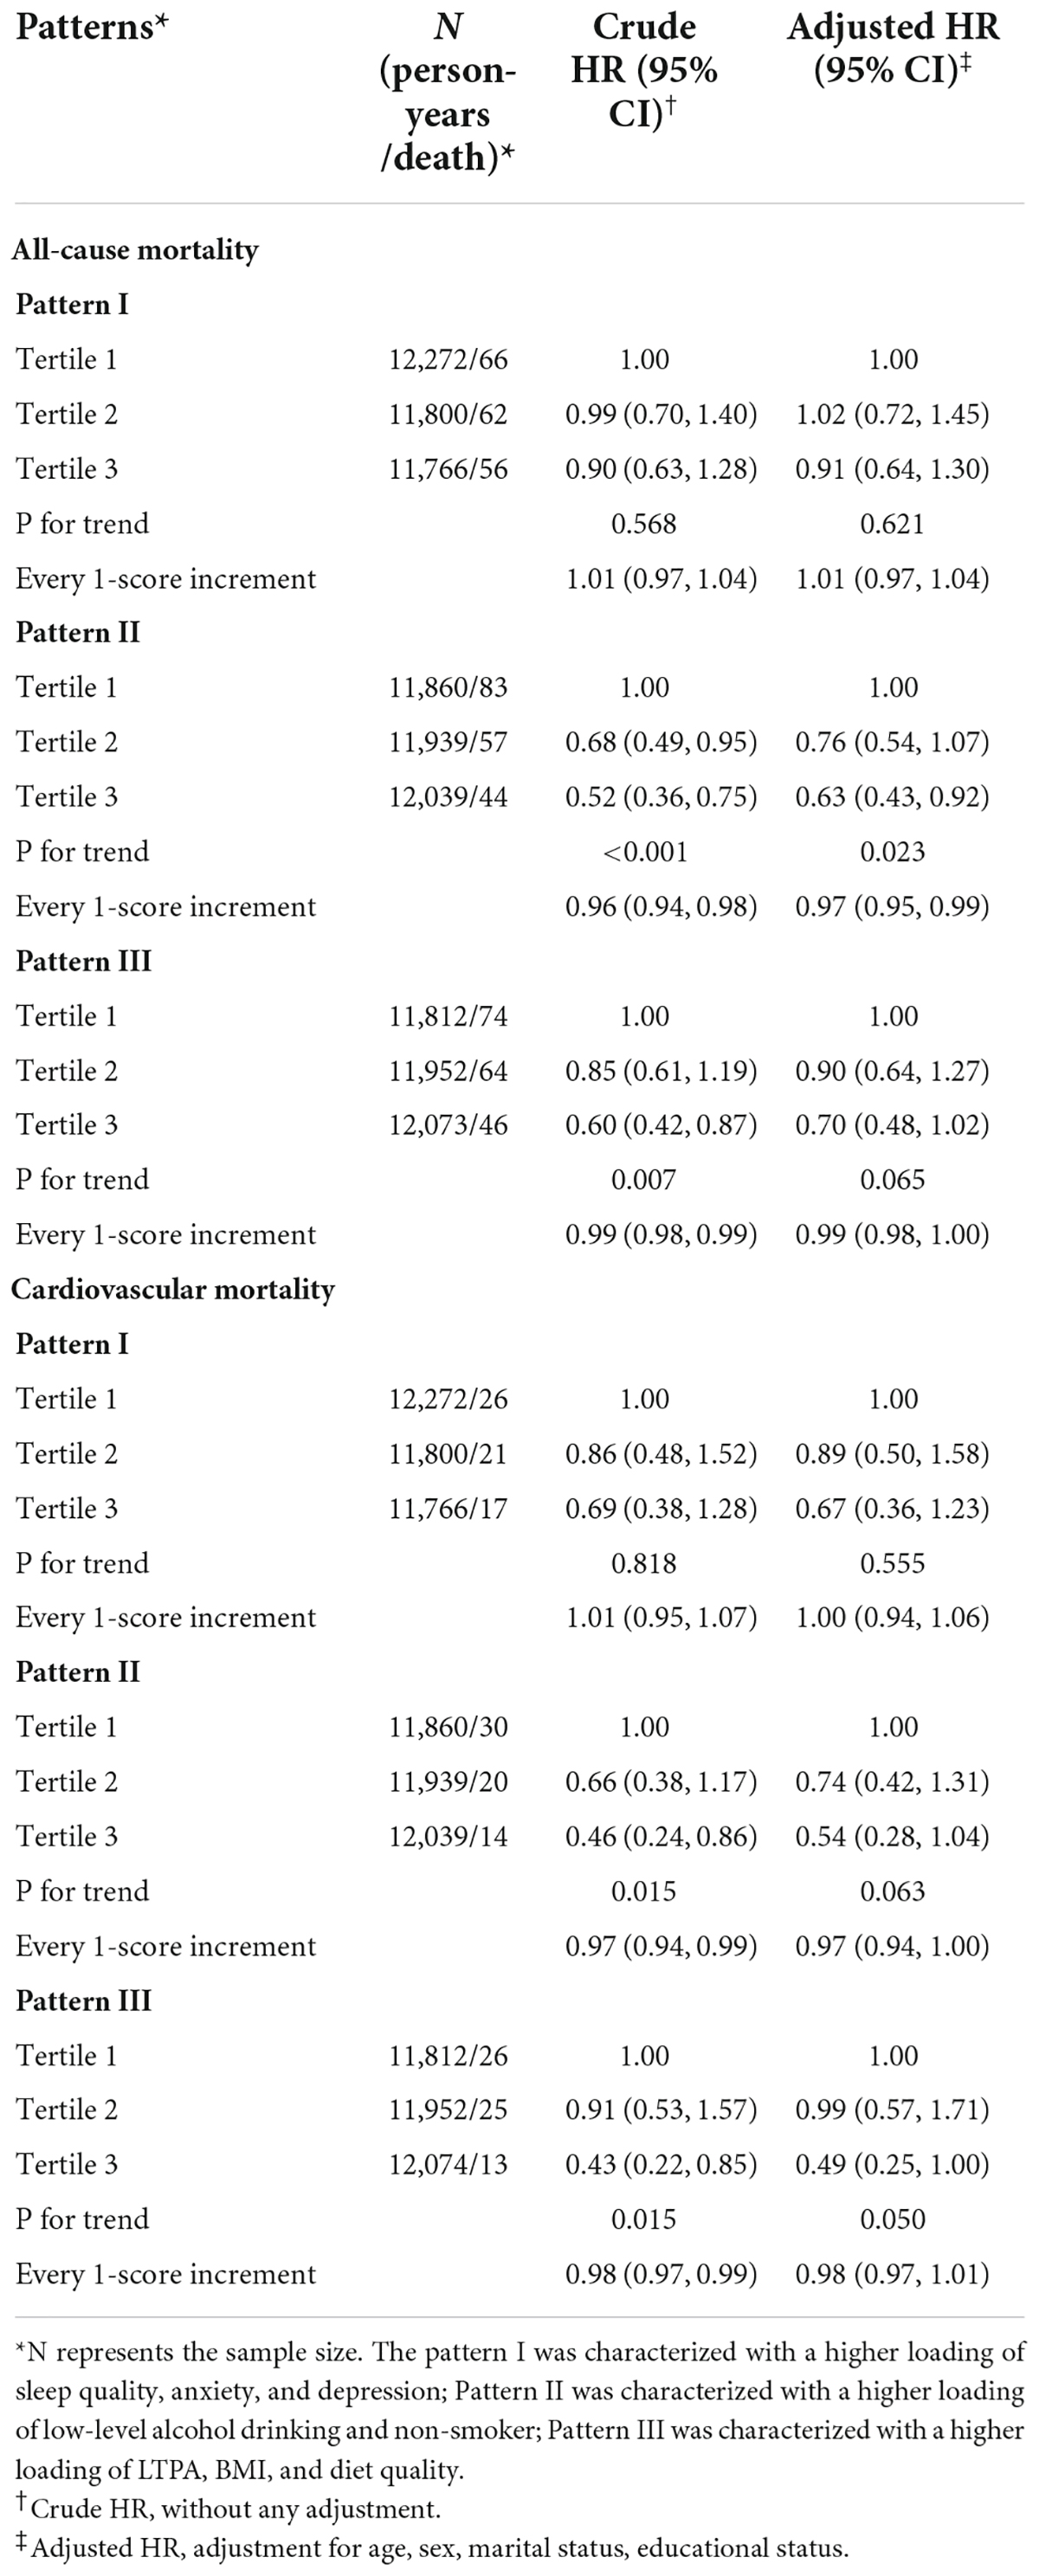
Table 5. The association of lifestyle patterns with mortality.
Two sensitivity analyses were conducted by excluding participants with a BMI lower than 18.5 kg/m2 and by excluding participants who died within the first year during the follow-up. Similar results as the main analyses were obtained for HLI (Supplementary Tables 5, 6) and three lifestyle patterns (Supplementary Tables 7, 8).
Discussion
In this large prospective cohort study, we found that both moderate and high levels of HLI were associated with the reduced risk of all-cause mortality, and lifestyle pattern II characterized with higher loadings of low-level alcohol drinking and non-smoker was negatively associated with the risk of all-cause mortality, after adjustment for confounders.
The HLI established in this study considered many aspects of the lifestyle as comprehensively as possible. The five factors used in this study—LTPA, cigarette smoking, alcohol drinking, diet quality, and BMI—have also been considered in many other similar studies (7, 14, 34). In addition, this study also considered sleep quality and mental status, as they were important elements affecting the occurrence and death of chronic diseases (20, 35–38). Consistently, other studies on the combined or overall effects of lifestyle factors had also highlighted the contribution of sleep condition (9, 10, 13, 39) and mental status (9, 10). Our study found that both moderate level (3–5 score) and high level (6–7 score) of HLI decreased the risk of all-cause mortality, which was consistent with many other studies (13, 34, 39). However, the trend test was not reaching significance; this might be due to the limited death cases during a relatively short-time follow-up.
The multicollinearity and potential synergy were often observed among different individual lifestyle factors. The cumulative impact of multiple lifestyle components in a lifestyle pattern may be detectable. PCA is a multivariate technique that evaluates intercorrelations between individual habits or behaviors and has been widely applied in health science (22). In our study, three lifestyle patterns were successfully extracted by using PCA from eight components of non-smoking, low-level alcohol drinking, BMI, LTPA, diet quality, sleep quality, the SAS index score, and the CES-D score. We found that lifestyle pattern II which was characterized with higher factor loadings of non-smoking and low-level alcohol drinking was inversely associated with the risk of all-cause mortality, no matter the pattern score was regarded as a continuous variable or as a categorical variable. Similarly, Navarro and colleagues used PCA to extract dietary and lifestyle patterns and found that the pattern with the loadings most heavily on alcohol and cigarette use was associated with an increased risk of esophageal cancer (40); Al Thani et al. found that the pattern characterized by smoking, fast foods, sweetened beverages, and sweets was positively related to the risk of elevated blood pressure (41).
Non-smoking and low-level alcohol drinking are two dominant components of lifestyle pattern II. Literature agreed that cigarette smoking was the risk factor of premature mortality and various diseases including respiratory diseases, CVDs, diabetes, and cancer (42–45). Underlying mechanisms were that burning tobacco cigarettes can produce many chemicals that affect many aspects of human health, such as nicotine, nitrosamines, and polycyclic aromatic hydrocarbons. Nicotine affects cardiac contractility and heart rate, increases blood pressure, reduces sensitivity to insulin, aggravates diabetes, and results in endothelial dysfunction (46). Nitrosamines and polycyclic aromatic hydrocarbons are proven as carcinogens and CVD enhancers (47). Regarding low-level alcohol drinking, the Global Burden of Disease Study concluded that zero standard drinks per week minimized the overall health risk (48), namely no level of alcohol consumption improves health (49).
Noteworthy, our results found that high sleep quality was associated with a 38% reduced risk of all-cause mortality, which was consistent with previous studies (17–19). The underlying biological mechanism is that poor sleep quality may induce inflammatory cytokines (50), and inflammation has been associated with the incidence of cancer and CVDs (51, 52). No significant associations of diet quality, BMI, cigarette smoking, alcohol drinking, LTPA, and mental status with mortality were observed in this study. However, we found that combined healthy lifestyle factors decreased the risk of all-cause mortality. The possible reason for such discrepancies may be that when multiple lifestyle factors were combined, the synergistic effect of various components might be greater than the effect of each component (9). This further demonstrates the critical importance of considering a variety of healthy lifestyles when maintaining and promoting health.
This study has several strengths. First, participants from community-dwelling residents were recruited by using the multistage sampling method, which can to some degree minimize or reduce selection bias and ensure the population had better representativeness. Moreover, the questionnaire survey was conducted face to face by strictly trained investigators, which can reduce the information bias to a large degree. Second, we considered a relatively comprehensive range of lifestyle factors, including traditional and emerging lifestyle factors, which could reflect to some extent the complexity of modern life. Third, using indicators of the HLI and lifestyle patterns, we for the first time comprehensively examined the impact of lifestyles on the death from both aspects of the number of healthy lifestyles and their overall effects.
Some limitations also existed. First, the follow-up period in our study was relatively short, resulting in a limited number of death cases; thus, some results did not have enough power to detect significant findings. For example, we found that the association of HLI with cardiovascular mortality risk did not a reach significant level, contradicting the previous reports that showed a negative association between healthy lifestyles and cardiovascular mortality. However, the GZHS is an ongoing cohort study, and further follow-up studies will be performed to examine the association of lifestyle with the risk of cause-specific mortality. Second, dietary information over the past 12 months was collected using the FFQ, which might inevitably lead to recall bias. However, physical examination and questionnaire survey were conducted by trained investigators, which can reduce the bias to some degree. Third, although this study adjusted for several possible confounders, we cannot avoid the possibility of residual confounding due to unmeasured factors.
Conclusion
Our results suggested that the more dimensions of the healthy lifestyle the lower the risk of death, and adherence to the lifestyle pattern characterized with heavier loading of non-smoking and lower alcohol drinking reduces the risk of all-cause mortality. The findings highlight the need to consider multi-dimensional lifestyles rather than one when developing health promotion strategies.
Data availability statement
The raw data supporting the conclusions of this article will be made available by the authors, without undue reservation.
Ethics statement
The studies involving human participants were reviewed and approved by the Guangzhou Medical Ethics Committee of the Chinese Medical Association and the Ethical Review Committee for Biomedical Research, School of Public Health, Sun Yat-sen University. The patients/participants provided their written informed consent to participate in this study.
Author contributions
XL conceived and designed the study. MZ collected the mortality data. HD, MZ, JH, H-YF, C-JF, H-HR, and Y-SY collected all other data. PH analyzed the data. PH, MZ, and JH drafted the manuscript. HD, XL, WZ, and HW reviewed and edited the manuscript. All authors provided comments and approved the final version.
Funding
This work was supported by the Science and Technology Program of Guangzhou City (No. 202102080404), the Guangdong Basic and Applied Basic Research Foundation (No. 2022A1515010686), the Guangdong Provincial Key R&D Program (No. 2019B020230004), the National Key R&D Program of China (No. 2018YFC1312502), and the Medical Science and Technology Research Fund of Guangdong Province (No. 202011269127579).
Acknowledgments
We thank epidemiologists, nurses, and doctors in Guangdong Provincial People’s Hospital, in Guangzhou Center for Disease Control and Prevention, and in Community Healthcare Centers in data collection, and we also thank study subjects for their participation.
Conflict of interest
The authors declare that the research was conducted in the absence of any commercial or financial relationships that could be construed as a potential conflict of interest.
Publisher’s note
All claims expressed in this article are solely those of the authors and do not necessarily represent those of their affiliated organizations, or those of the publisher, the editors and the reviewers. Any product that may be evaluated in this article, or claim that may be made by its manufacturer, is not guaranteed or endorsed by the publisher.
Supplementary material
The Supplementary Material for this article can be found online at: https://www.frontiersin.org/articles/10.3389/fmed.2022.920760/full#supplementary-material
References
1. Allen L, Williams J, Townsend N, Mikkelsen B, Roberts N, Foster C, et al. Socioeconomic status and non-communicable disease behavioural risk factors in low-income and lower-middle-income countries: a systematic review. Lancet Glob Health. (2017) 5:e277–89. doi: 10.1016/s2214-109x(17)30058-x
2. Shankar A, McMunn A, Steptoe A. Health-related behaviors in older adults relationships with socioeconomic status. Am J Prev Med. (2010) 38:39–46. doi: 10.1016/j.amepre.2009.08.026
3. Wilson LF, Antonsson A, Green AC, Jordan SJ, Kendall BJ, Nagle CM, et al. How many cancer cases and deaths are potentially preventable? Estimates for Australia in 2013. Int J Cancer. (2018) 142:691–701. doi: 10.1002/ijc.31088
4. Chomistek AK, Chiuve SE, Eliassen AH, Mukamal KJ, Willett WC, Rimm EB. Healthy lifestyle in the primordial prevention of cardiovascular disease among young women. J Am Coll Cardiol. (2015) 65:43–51. doi: 10.1016/j.jacc.2014.10.024
5. Akesson A, Larsson SC, Discacciati A, Wolk A. Low-risk diet and lifestyle habits in the primary prevention of myocardial infarction in men: a population-based prospective cohort study. J Am Coll Cardiol. (2014) 64:1299–306. doi: 10.1016/j.jacc.2014.06.1190
6. Carr PR, Weigl K, Jansen L, Walter V, Erben V, Chang-Claude J, et al. Healthy lifestyle factors associated with lower risk of colorectal cancer irrespective of genetic risk. Gastroenterology. (2018) 155:1805–15.e5. doi: 10.1053/j.gastro.2018.08.044
7. Li Y, Pan A, Wang DD, Liu X, Dhana K, Franco OH, et al. Impact of healthy lifestyle factors on life expectancies in the US population. Circulation. (2018) 138:345–55. doi: 10.1161/circulationaha.117.032047
8. Ford ES, Zhao G, Tsai J, Li C. Low-risk lifestyle behaviors and all-cause mortality: findings from the national health and nutrition examination survey III mortality study. Am J Public Health. (2011) 101:1922–9. doi: 10.2105/ajph.2011.300167
9. Deng YY, Zhong QW, Zhong HL, Xiong F, Ke YB, Chen YM. Higher healthy lifestyle score is associated with lower presence of non-alcoholic fatty liver disease in middle-aged and older Chinese adults: a community-based cross-sectional study. Public Health Nutr. (2021) 24:5081–9. doi: 10.1017/s1368980021000902
10. Deng YY, Liu YP, Ling CW, Li YH, Wu YY, Ke YB, et al. Higher healthy lifestyle scores are associated with greater bone mineral density in middle-aged and elderly Chinese adults. Arch Osteoporos. (2020) 15:129. doi: 10.1007/s11657-020-00758-9
11. Carlos S, de Irala J, Hanley M, Martínez-González M. The use of expensive technologies instead of simple, sound and effective lifestyle interventions: a perpetual delusion. J Epidemiol Commun Health. (2014) 68:897–904. doi: 10.1136/jech-2014-203884
12. van Dam RM, Li T, Spiegelman D, Franco OH, Hu FB. Combined impact of lifestyle factors on mortality: prospective cohort study in US women. BMJ. (2008) 337:a1440. doi: 10.1136/bmj.a1440
13. Ding D, Rogers K, van der Ploeg H, Stamatakis E, Bauman AE. Traditional and emerging lifestyle risk behaviors and all-cause mortality in middle-aged and older adults: evidence from a large population-based Australian cohort. PLoS Med. (2015) 12:e1001917. doi: 10.1371/journal.pmed.1001917
14. Pan XF, Li Y, Franco OH, Yuan JM, Pan A, Koh WP. Impact of combined lifestyle factors on all-cause and cause-specific mortality and life expectancy in Chinese: the Singapore Chinese health study. J Gerontol Ser A Biol Sci Med Sci. (2020) 75:2193–9. doi: 10.1093/gerona/glz271
15. Zhang YB, Pan XF, Chen J, Cao A, Xia L, Zhang Y, et al. Combined lifestyle factors, all-cause mortality and cardiovascular disease: a systematic review and meta-analysis of prospective cohort studies. J Epidemiol Commun Health. (2021) 75:92–9. doi: 10.1136/jech-2020-214050
16. Abbott SM, Knutson KL, Zee PC. Health implications of sleep and circadian rhythm research in 2017. Lancet Neurol. (2018) 17:17–8. doi: 10.1016/s1474-4422(17)30410-6
17. Garfield V, Joshi R, Garcia-Hernandez J, Tillin T, Chaturvedi N. The relationship between sleep quality and all-cause, CVD and cancer mortality: the Southall and Brent revisited study (SABRE). Sleep Med. (2019) 60:230–5. doi: 10.1016/j.sleep.2019.03.012
18. Kwok CS, Kontopantelis E, Kuligowski G, Gray M, Muhyaldeen A, Gale CP, et al. Self-reported sleep duration and quality and cardiovascular disease and mortality: a dose-response meta-analysis. J Am Heart Assoc. (2018) 7:e008552. doi: 10.1161/jaha.118.008552
19. Seow LSE, Tan XW, Chong SA, Vaingankar JA, Abdin E, Shafie S, et al. Independent and combined associations of sleep duration and sleep quality with common physical and mental disorders: results from a multi-ethnic population-based study. PLoS One. (2020) 15:e0235816. doi: 10.1371/journal.pone.0235816
20. Walker ER, McGee RE, Druss BG. Mortality in mental disorders and global disease burden implications: a systematic review and meta-analysis. JAMA Psychiatry. (2015) 72:334–41. doi: 10.1001/jamapsychiatry.2014.2502
21. Pratt LA, Druss BG, Manderscheid RW, Walker ER. Excess mortality due to depression and anxiety in the United States: results from a nationally representative survey. Gen Hosp Psychiatry. (2016) 39:39–45. doi: 10.1016/j.genhosppsych.2015.12.003
22. Jolliffe IT, Cadima J. Principal component analysis: a review and recent developments. Philos Trans Ser A Math Phys Eng Sci. (2016) 374:20150202. doi: 10.1098/rsta.2015.0202
23. Deng H, Guo P, Zheng M, Huang J, Xue Y, Zhan X, et al. Epidemiological characteristics of atrial fibrillation in Southern China: results from the Guangzhou heart study. Sci Rep. (2018) 8:17829. doi: 10.1038/s41598-018-35928-w
24. Du Y, Duan XR, Zheng MR, Zhao WJ, Huang J, Lao LX, et al. Association between eating habits and risk of obstructive sleep Apnea: a population-based study. Nat Sci Sleep. (2021) 13:1783–95. doi: 10.2147/Nss.S325494
25. Duan XR, Zheng MR, He SF, Lao LX, Huang J, Zhao WJ, et al. Association between physical activity and risk of obstructive sleep apnea. Sleep Breath. (2021) 25:1925–34. doi: 10.1007/s11325-021-02318-y
26. Chen C, Lu FC. Department of disease control ministry of health PRC. The guidelines for prevention and control of overweight and obesity in Chinese adults. Biomed Environ Sci. (2004) 17(Suppl.):1–36.
27. Chinese Nutrition Society. The Chinese Dietary Guidelines. Beijing: People’s Medical Publishing House (2016).
28. Krebs-Smith SM, Pannucci TE, Subar AF, Kirkpatrick SI, Lerman JL, Tooze JA, et al. Update of the healthy eating index: HEI-2015. J Acad Nutr Diet. (2018) 118:1591–602. doi: 10.1016/j.jand.2018.05.021
29. World Health Organization. Global Physical Activity Questionnaire (GPAQ). (2018). Available online at: https://www.who.int/publications/m/item/global-physical-activity-questionnaire (accessed November 20, 2021).
30. Bull FC, Al-Ansari SS, Biddle S, Borodulin K, Buman MP, Cardon G, et al. World Health Organization 2020 guidelines on physical activity and sedentary behaviour. Br J Sports Med. (2020) 54:1451–62. doi: 10.1136/bjsports-2020-102955
31. Zung WW. A rating instrument for anxiety disorders. Psychosomatics. (1971) 12:371–9. doi: 10.1016/s0033-3182(71)71479-0
32. Radloff LS. The CES-D scale:a self-report depression scale for research in the general population. Appl Psychol Meas. (1977) 1:385–401. doi: 10.1177/014662167700100306
33. Kabacoff R. R in Action : Data Analysis and Graphics With R (Second Edition). New York, NY: Manning Publications (2015).
34. Zhu NB, Yu CQ, Guo Y, Bian Z, Han YT, Yang L, et al. Adherence to a healthy lifestyle and all-cause and cause-specific mortality in Chinese adults: a 10-year prospective study of 0.5 million people. Int J Behav Nutr Phy. (2019) 16:98. doi: 10.1186/s12966-019-0860-z
35. Tao F, Cao Z, Jiang Y, Fan N, Xu F, Yang H, et al. Associations of sleep duration and quality with incident cardiovascular disease, cancer, and mortality: a prospective cohort study of 407,500 UK biobank participants. Sleep Med. (2021) 81:401–9. doi: 10.1016/j.sleep.2021.03.015
36. Song C, Zhang R, Wang C, Fu R, Song W, Dou K, et al. Sleep quality and risk of cancer: findings from the English longitudinal study of aging. Sleep. (2021) 44:zsaa192. doi: 10.1093/sleep/zsaa192
37. Zhou L, Yu K, Yang L, Wang H, Xiao Y, Qiu G, et al. Sleep duration, midday napping, and sleep quality and incident stroke: the Dongfeng-Tongji cohort. Neurology. (2020) 94:e345–56. doi: 10.1212/wnl.0000000000008739
38. Wu YT, Kralj C, Acosta D, Guerra M, Huang Y, Jotheeswaran AT, et al. The association between, depression, anxiety, and mortality in older people across eight low- and middle-income countries: results from the 10/66 cohort study. Int J Geriatr Psychiatry. (2020) 35:29–36. doi: 10.1002/gps.5211
39. Martínez-Gómez D, Guallar-Castillón P, León-Muñoz LM, López-García E, Rodríguez-Artalejo F. Combined impact of traditional and non-traditional health behaviors on mortality: a national prospective cohort study in Spanish older adults. BMC Med. (2013) 11:47. doi: 10.1186/1741-7015-11-47
40. Navarro Silvera SA, Mayne ST, Risch HA, Gammon MD, Vaughan T, Chow WH, et al. Principal component analysis of dietary and lifestyle patterns in relation to risk of subtypes of esophageal and gastric cancer. Ann Epidemiol. (2011) 21:543–50. doi: 10.1016/j.annepidem.2010.11.019
41. Al Thani M, Al Thani A, Al-Chetachi W, Al Malki B, Khalifa SAH, Bakri AH, et al. Lifestyle patterns are associated with elevated blood pressure among Qatari women of reproductive age: a cross-sectional national study. Nutrients. (2015) 7:7593–615. doi: 10.3390/nu7095355
42. Yeh HC, Duncan BB, Schmidt MI, Wang NY, Brancati FL. Smoking, smoking cessation, and risk for type 2 diabetes mellitus: a cohort study. Ann Int Med. (2010) 152:10–7. doi: 10.7326/0003-4819-152-1-201001050-00005
43. Sasco AJ, Secretan MB, Straif K. Tobacco smoking and cancer: a brief review of recent epidemiological evidence. Lung Cancer. (2004) 45(Suppl. 2):S3–9. doi: 10.1016/j.lungcan.2004.07.998
44. Messner B, Bernhard D. Smoking and cardiovascular disease: mechanisms of endothelial dysfunction and early atherogenesis. Arterioscler Thromb Vasc Biol. (2014) 34:509–15. doi: 10.1161/atvbaha.113.300156
45. Jayes L, Haslam PL, Gratziou CG, Powell P, Britton J, Vardavas C, et al. SmokeHaz: systematic reviews and meta-analyses of the effects of smoking on respiratory health. Chest. (2016) 150:164–79. doi: 10.1016/j.chest.2016.03.060
46. Anon. Republished: nicotine and health. BMJ. (2014) 349:2014.7.0264rep. doi: 10.1136/bmj.2014.7.0264rep
47. Mainali P, Pant S, Rodriguez AP, Deshmukh A, Mehta JL. Tobacco and cardiovascular health. Cardiovasc Toxicol. (2015) 15:107–16. doi: 10.1007/s12012-014-9280-0
48. GBD 2016 Alcohol Collaborators. Alcohol use and burden for 195 countries and territories, 1990-2016: a systematic analysis for the global burden of disease study 2016. Lancet. (2018) 392:1015–35. doi: 10.1016/s0140-6736(18)31310-2
49. Burton R, Sheron N. No level of alcohol consumption improves health. Lancet. (2018) 392:987–8. doi: 10.1016/s0140-6736(18)31571-x
50. Irwin MR, Olmstead R, Carroll JE. Sleep disturbance, sleep duration, and inflammation: a systematic review and meta-analysis of cohort studies and experimental sleep deprivation. Biol Psychiatry. (2016) 80:40–52. doi: 10.1016/j.biopsych.2015.05.014
51. Balkwill F, Mantovani A. Inflammation and cancer: back to Virchow? Lancet. (2001) 357:539–45. doi: 10.1016/s0140-6736(00)04046-0
Keywords: lifestyle, healthy lifestyle index, lifestyle pattern, mortality, cohort study
Citation: Hu P, Zheng M, Huang J, Fan H-Y, Fan C-J, Ruan H-H, Yuan Y-S, Zhao W, Wang HHX, Deng H and Liu X (2022) Effect of healthy lifestyle index and lifestyle patterns on the risk of mortality: A community-based cohort study. Front. Med. 9:920760. doi: 10.3389/fmed.2022.920760
Received: 15 April 2022; Accepted: 08 August 2022;
Published: 30 August 2022.
Edited by:
Tatsunori Ikemoto, Aichi Medical University, JapanReviewed by:
Sang Yeoup Lee, Pusan National University Yangsan Hospital, South KoreaNatalia Sharashkina, Pirogov Russian National Research Medical University, Russia
Copyright © 2022 Hu, Zheng, Huang, Fan, Fan, Ruan, Yuan, Zhao, Wang, Deng and Liu. This is an open-access article distributed under the terms of the Creative Commons Attribution License (CC BY). The use, distribution or reproduction in other forums is permitted, provided the original author(s) and the copyright owner(s) are credited and that the original publication in this journal is cited, in accordance with accepted academic practice. No use, distribution or reproduction is permitted which does not comply with these terms.
*Correspondence: Wenjing Zhao, emhhb3dqQHN1c3RlY2guZWR1LmNu; Hai Deng, ZG9jdG9yZGhAaG90bWFpbC5jb20=; Xudong Liu, eGRsaXUuY25AaG90bWFpbC5jb20=
†These authors have contributed equally to this work