 Ran Hao1,2†
 Mingzhou Zhang1,2†
 Liming Zhao3†Yang Liu4†Min Sun5†Jing Dong6†Yanhui Xu7†Feng Wu8†Jinwen Wei9†Xiangyang Xin10†Zhongping Luo11†Shuxuan Lv12†
 Xuemin Li1,2*
- 1Department of Ophthalmology, Peking University Third Hospital, Beijing, China
- 2Beijing Key Laboratory of Restoration of Damaged Ocular Nerve, Peking University Third Hospital, Beijing, China
- 3Department of Ophthalmology, Beijing Fengtai Hospital, Beijing, China
- 4Department of Ophthalmology, Daqing Oilfield General Hospital, Daqing, China
- 5Department of Ophthalmology, Huabei Petroleum General Hospital, Cangzhou, China
- 6Department of Ophthalmology, The First Affiliated Hospital of Baotou Medical College, Inner Mongolia, China
- 7Department of Ophthalmology, Hebei Provincial Eye Hospital, Shijiazhuang, China
- 8Department of Ophthalmology, Fuyang Hospital Affiliated to Anhui Medical University, Fuyang, China
- 9Department of Ophthalmology, Inner Mongolia Autonomous Region Xilingol League Hospital, Inner Mongolia, China
- 10Department of Ophthalmology, Inner Mongolia Baogang Hospital, Inner Mongolia, China
- 11Department of Ophthalmology, Tongliao City Ke’erqin Zuoyi Zhongqi People’s Hospital, Inner Mongolia, China
- 12Department of Ophthalmology, Yongqing People’s Hospital, Langfang, China
Purpose: To assess air pollution-induced changes on ocular surface and tear cytokine levels.
Methods: As a prospective multicenter cohort study, 387 dry eye disease (DED) participants were recruited from five provinces in China and underwent measurements of ocular surface disease index (OSDI), Schirmer’s I test (ST), tear meniscus height (TMH), tear film break-up time (TBUT), corneal fluorescein staining (CFS), meibomian gland (MG) function, and tear cytokines. The associations between ocular surface parameters and exposure to particulate matter (PM), ozone (O3), nitrogen dioxide (NO2), and sulfur dioxide (SO2) for 1 day, 1 week, and 1 month before the examination were analyzed in single- and multi-pollutant models adjusted for confounding factors.
Results: In the multi-pollutant model, the OSDI score was positively correlated with PM with diameter ≤2.5 μm (PM2.5), O3, and SO2 exposure [PM2.5: β (1 week/month) = 0.229 (95% confidence interval (CI): 0.035–0.424)/0.211 (95% CI: 0.160–0.583); O3: β (1 day/week/month) = 0.403 (95% CI: 0.229–0.523)/0.471 (95% CI: 0.252–0.693)/0.468 (95% CI: 0.215–0.732); SO2: β (1 day/week) = 0.437 (95% CI: 0.193–0.680)/0.470 (95% CI: 0.040–0.901)]. Tear secretion was negatively correlated with O3 and NO2 exposures but positively correlated with PM2.5 levels. Air pollutants were negatively correlated with TBUT and positively related with CFS score. Besides SO2, all other pollutants were associated with aggravated MG dysfunction (MG expression, secretion, and loss) and tear cytokines increasement, such as PM2.5 and interleukin-8 (IL-8) [β (1 day) = 0.016 (95% CI: 0.003–0.029)], PM with diameter ≤10 μm (PM10) and IL-6 [β (1 day) = 0.019 (95% CI: 0.006–0.033)], NO2 and IL-6 [β (1 month) = 0.045 (95% CI: 0.018–0.072)], among others. The effects of air pollutants on DED symptoms/signs, MG functions and tear cytokines peaked within 1 week, 1 month, and 1 day, respectively.
Conclusion: Increased PM2.5, O3, and SO2 exposures caused ocular discomfort and damage with tear film instability. PM10 exposure led to tear film instability and ocular injury. PM, O3, and NO2 exposures aggravated MG dysfunction and upregulated tear cytokine levels. Therefore, each air pollutant may influence DED via different mechanisms within different time windows.
Introduction
The increasing levels of environmental pollution worldwide pose a serious threat to public health (1–5). Air pollution can cause an extensive range of respiratory and cardiovascular diseases (3–9), metabolic diseases (10), strokes (11), sudden infant death syndrome (12), and even an increasement of mortality (13). According to World Health Organization (WHO), particulate matter (PM), ozone (O3), nitrogen dioxide (NO2), and sulfur dioxide (SO2) are the most significant pollutants.
The ocular surface is constantly and directly exposed to the external environment; however, the previous researches assessed dry eye disease (DED) only through binary symptoms or diagnosis (2, 14, 15). The importance of inflammation and tear cytokines on the pathogenesis of DED has been highlighted by the Tear Film and Ocular Surface Society International Dry Eye Workshop II (TFOS DEW II) (16). In addition, exposure to high levels of air pollutants were reported to cause ocular surface inflammation and tear cytokines increasement in animal models (17, 18). However, clinical validation about the fluctuations in tear cytokine levels exposure to air pollutants has not been reported until now.
In this study, we evaluated the different effects of various air pollutants, PM with diameter ≤2.5 μm (PM2.5) and diameter ≤10 μm (PM10), O3, NO2, and SO2, on the clinical characteristics and tear cytokines of DED. We aim to identify which air pollutant mainly influence ocular surface and the time window from exposure to air pollution to DED occurrence.
Materials and Methods
Study Participants and Design
In this multicenter prospective cohort study, individuals were recruited from 11 hospitals across five provinces in China, namely, Beijing, Hebei, Heilongjiang, Anhui, and Inner Mongolia, from 1 February 2019, through 31 January 2020. Participants aged 20–80 years were eligible for enrollment. DED was defined according to the TFOS DEW II standards: ocular surface disease index (OSDI) ≥13 and tear film break-up time (TBUT) <10 s, or ocular surface staining (>5 corneal spots and >9 conjunctival spots) (19). Subjects with another ocular surface abnormality, with a history of contact lens use or refractive surgery, with glaucoma medications usage, underwent ocular surgery within the past 6 months were excluded from the study. Participants in each hospital were examined by the same trained doctor, including the ocular surface health assessments and tear cytokine level measurements. The DED patients were stratified by severity grading scheme (level 1–4) according to International Dry Eye WorkShop (2007) (20). Informed consents were obtained from all participants. The study adhered to the Declaration of Helsinki and was approved by the Peking University Third Hospital Ethics Committee (No. M2019101).
Outdoor Air Pollutants and Meteorology Data
According to the monitoring methods described in the previous studies (14, 15, 21), the meteorological factors (temperature and relative humidity) and air pollution data (PM2.5, PM10, O3, NO2, and SO2) were obtained from open-access government air-quality monitoring stations closed to the participants’ homes. The 24-h average concentrations of PM2.5, PM10, NO2, and SO2 as well as the 8-h maximum values of O3 were collected as daily exposures. The mean concentrations of air pollution data for 1 day, 1 week, and 1 month before the examination date were recorded for further analysis. Tapered element oscillating microbalance (TEOM) was used to measure the daily concentrations of PM2.5 and PM10. The daily average concentrations of O3 were measured using the non-dispersive ultraviolet fluorescence photometer. The ultraviolet fluorescence and chemiluminescence were applied to measure SO2 and NO2 levels. According to the distance between the participants’ home and the monitor location, the exposed air pollution data for each patient was obtained from the closest monitoring station. The mean distance between subjects’ homes and their nearest monitor stations was 0.92 ± 0.57 km (range 0.20–2.55 km). Subjects were required to do 3–4 h outdoor activities per day (average) in the corresponding zone. Since the patients were enrolled from the industrial and densely populated areas, the primary sources of PM are the traffic emission, combustion, and sandstorms (22–26). The PM compositions are predominantly organic compound and inorganic salt (nitrate and sulfate).
Ocular Surface Health Assessment
Individuals’ symptoms were assessed using the OSDI questionnaire (27). Schirmer’s I test (ST), tear meniscus height (TMH), TBUT, corneal fluorescein staining (CFS) score, and meibomian gland (MG) morphology/function of individuals’ right eyes were examined using previously reported methods (28, 29). The CFS score was classified as follows (30): 0 = no staining; 1 = fewer than five dots; 2 = between one and three scores; and 3 = bulk or strip staining. The cornea was divided into four quadrants (superior temporal, inferior temporal, superior nasal, and inferior nasal), and each quadrant was scored separately and summed to obtain the final score. The TMH, TBUT, and MG morphology were recorded using a Keratograph 5 M (OCULUS, Wetzlar, Germany). A four-point grading scale (0–3) was used to grade the area of MG loss (31): 0 (no dropout), 1 (dropout of <1/3rd of the total area), 2 (dropout of 1/3rd to 2/3rd of the total area), and 3 (dropout of >2/3rd of the total area). The MG secretion was graded on a four-point categorical scale (0–3) (32): 0 (clear meibum), 1 (cloudy meibum), 2 (granular meibum), and 3 (inspissated meibum). MG expression was evaluated in five glands on the temporal, central, and nasal eyelids by using the following standard: 0 (all glands expressible), 1 (three to four glands expressible), 2 (one to two glands expressible), and 3 (no glands expressible) (33).
Tear Film Collection and Cytokine Measurement
Non-irritating tear collection was conducted without anesthesia by using 5-μl capillary pipettes. A plastic head was used to squeeze tears into 0.2-ml Eppendorf tubes, which were immediately frozen at −80°C. The levels of cytokines, such as interleukin (IL)-1 beta (IL-1β), IL-6, IL-8, IL-10, IL-17, tumor necrosis factor-alpha (TNF-α), interferon-gamma (IFN-γ), vascular endothelial growth factor (VEGF), and B-cell activating factor (BAFF), in the undiluted tear samples (at least 50 μl) were measured using a flow cytometer (BD FACS Canto II, Becton Dickinson, Franklin Lakes, NJ, United States) and a bead-array system (BD Cytometric Bead Array system, Becton Dickinson) in accordance with the manufacturer’s instructions. The tear samples were undiluted and each tear volume was inevitably small. Therefore, each sample was measured only once.
Covariates
Plenty of factors can influence DED (34), such as sex, age, income and education level, hypertension, diabetes mellitus, thyroid disease, rheumatoid arthritis, smoking, season change, temperature, and environmental humidity (14). We considered those factors as covariates, including the laterality of participants’ eyes.
Statistical Analysis
Participants were divided into four age groups (0–20, 21–40, 41–60, and >60 years), two sex-related groups (male and female), two income level (high and low), two education level (university or higher and high school graduation or less) and two seasonal groups (warm season from April to September, and cold season from January to March and October to December). Continuous variables were presented as mean ± standard deviation (SD). Categorical variables were expressed as frequencies and percentages. A linear mixed model was used to evaluate changes in ocular surface parameters and tear cytokines according to each air pollutant for 1 day, 1 week, and 1 month prior to the examination date. After variables collinearity checking, single-pollutant and multi-pollutant models were developed. Aforementioned covariates were adjusted for both models and got the minimized Akaike Information Criteria (AIC) value. Therefore, the models in this study include all confounding factors. The statistical analysis was performed using SPSS version 23.0 (IBM Corp., Armonk, NY, United States). A p-value < 0.05 was considered significant for all comparisons. Multiple comparisons were controlled for by the Bonferroni correction. Since the cytokine concentrations did not show a normal distribution, normality transition was performed before analysis.
Results
Demographic Characteristics and Clinical Data
A total of 387 participants were recruited in this study. Detailed demographic characteristics are shown in Table 1. The number of female patients (n = 253, 65.4%) was almost twice the number of male patients (n = 134, 34.6%). Most patients were aged 21–40 years (n = 159, 41.1%) or over 60 years (n = 145, 37.5%). The number of patients who visited the hospitals in the warm and cold seasons did not differ significantly. Most patients were classified into severity grading 3 (n = 232, 59.9%), followed by grading 2 (n = 111, 28.7%), grading 1 (n = 35, 9.1%), and grading 4 (n = 9, 2.3%). Clinical characteristics and tear cytokines in patients with different severity grades are shown in Table 2. There were significant differences in the ST, TMH, TBUT, CFS score, MG function (expression, secretion, and loss), and VEGF concentrations among grading groups. However, no significant difference was observed in the OSDI score and the concentrations of IL-1β, IL-6, and IL-8.
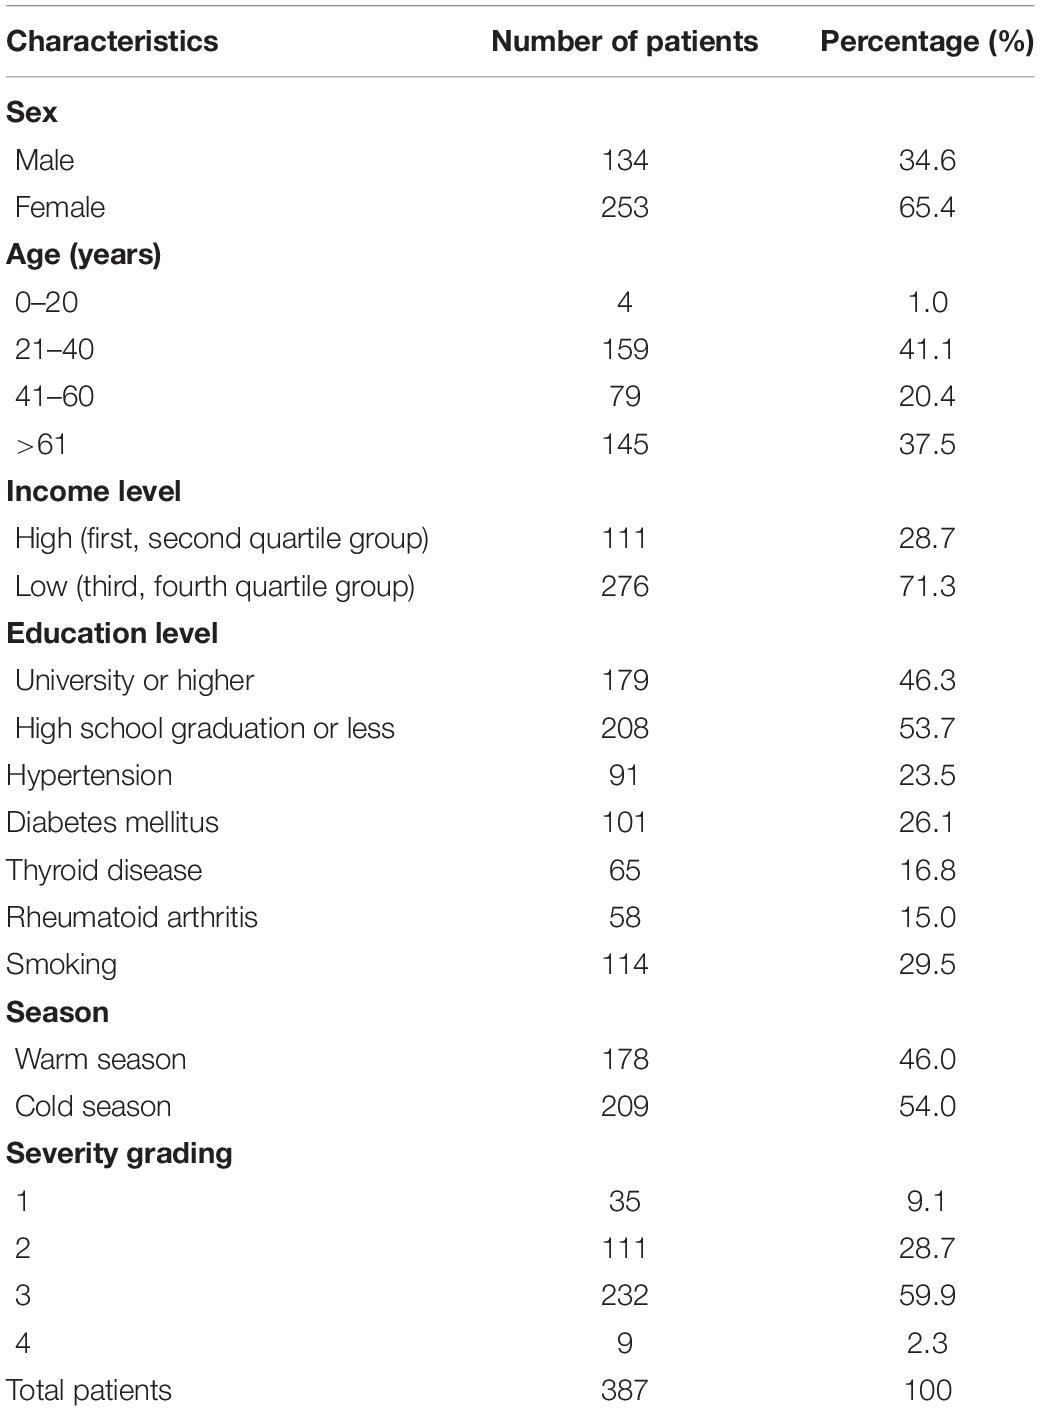
Table 1. Demographic characteristics and seasonal distribution of dry eye disease patients.
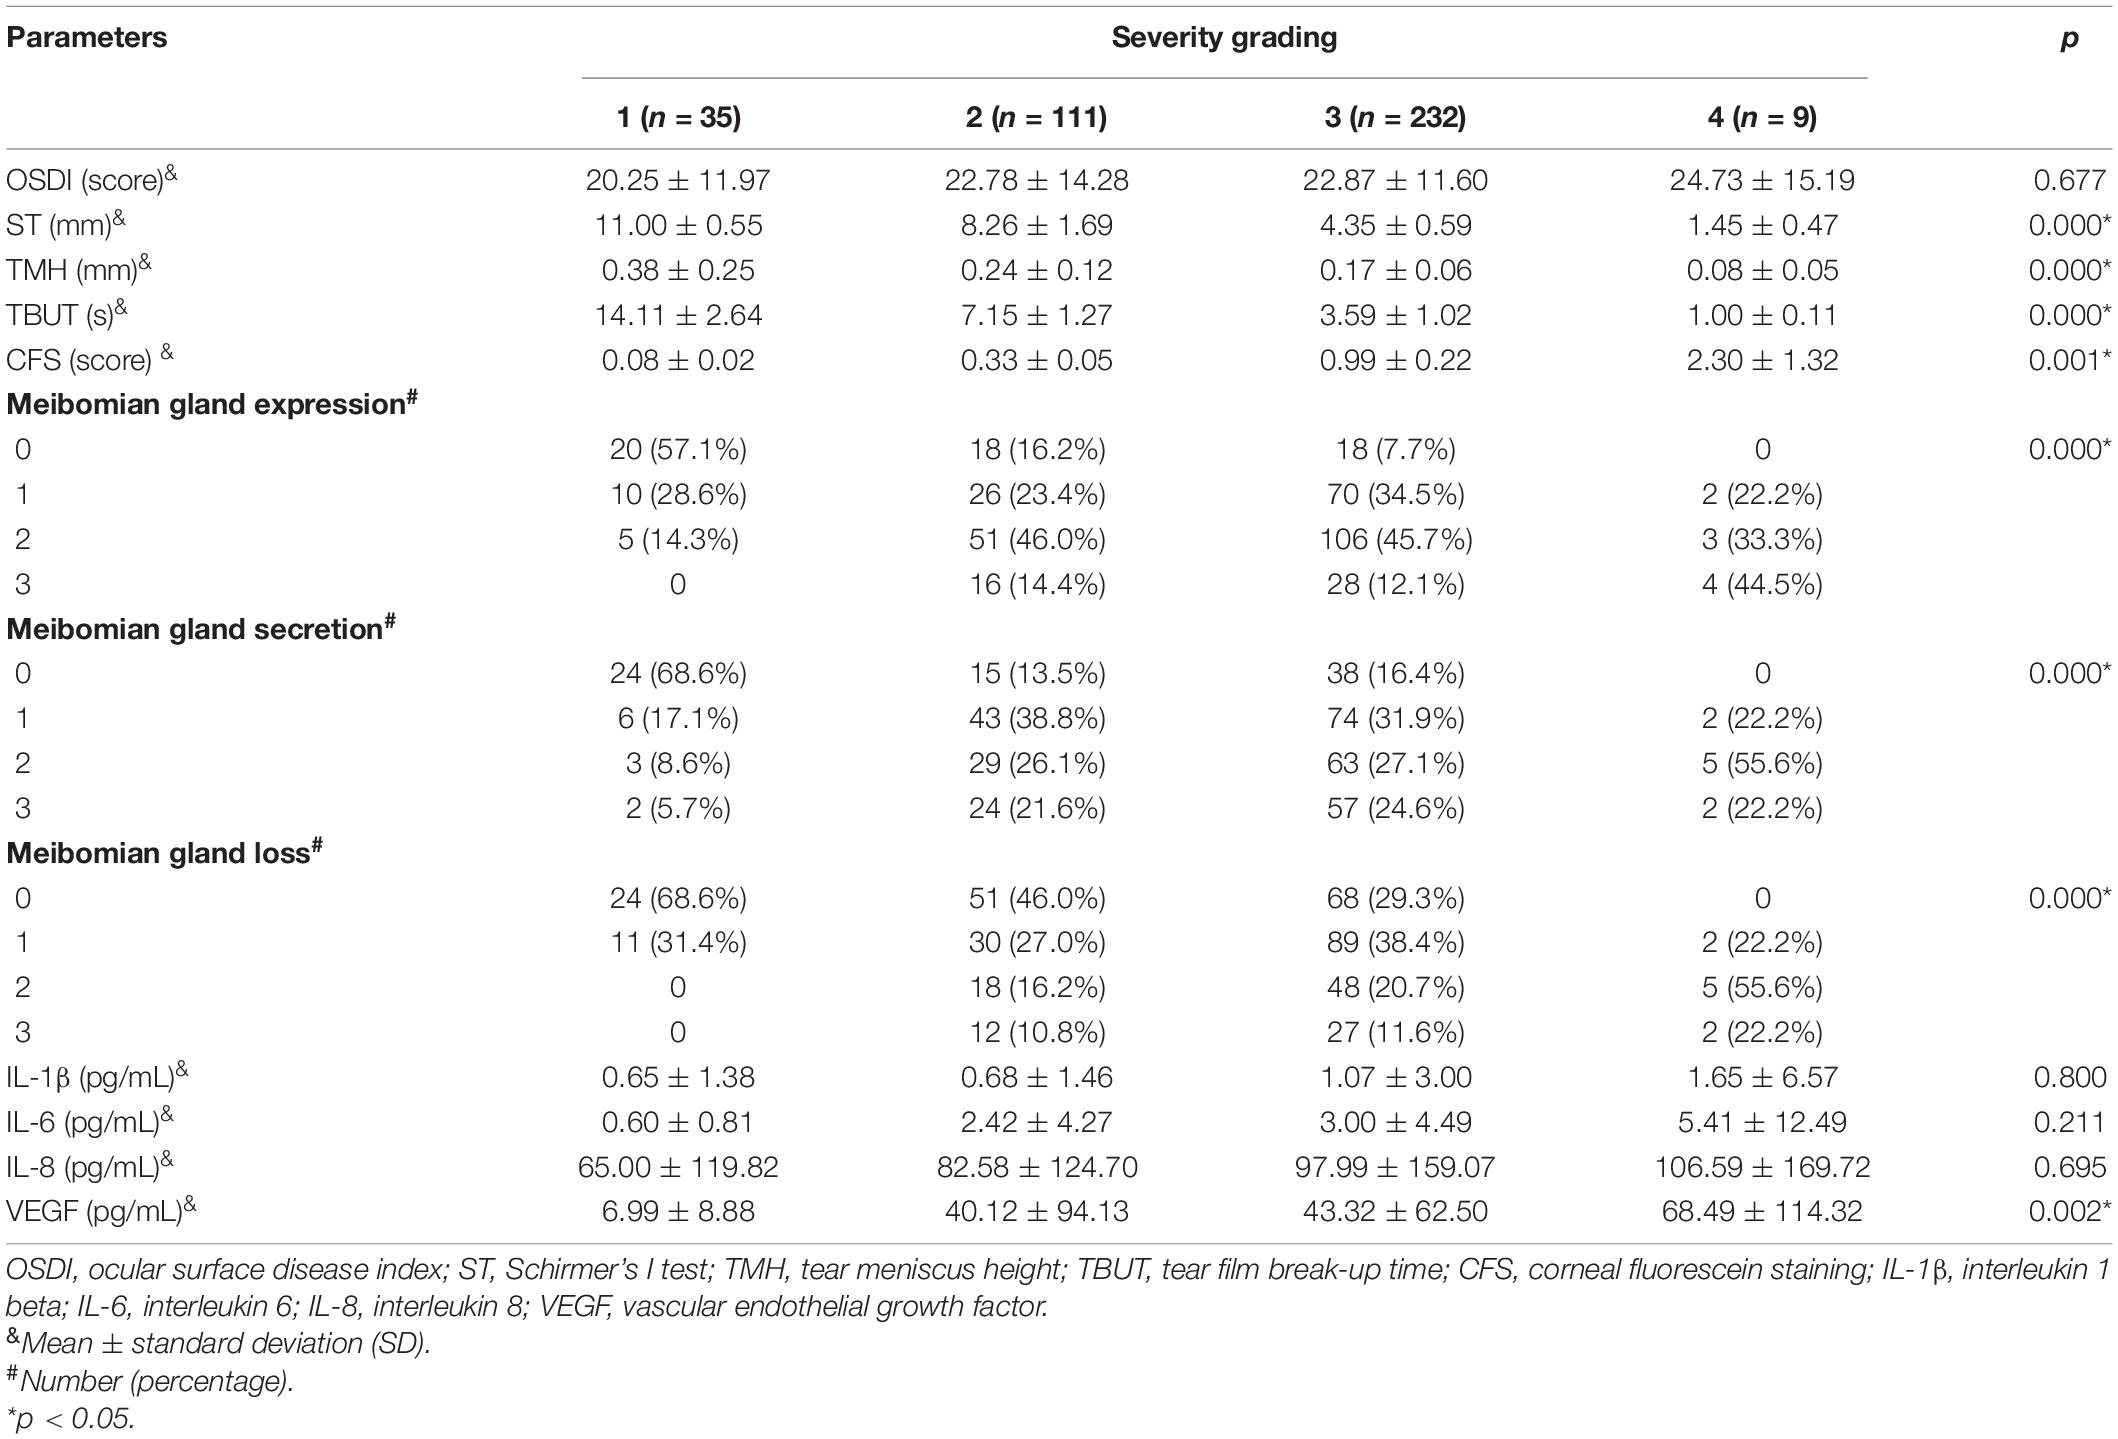
Table 2. Clinical characteristics and tear cytokines in patients with different severity grades.
The Effects of Air Pollutants on Ocular Surface in the Single-Pollutant Model
The effects of air pollutants on ocular surface in the single-pollutant model are shown in Table 3. Significant associations were found between increased OSDI scores and higher O3 exposures for 1 day, 1 week, and 1 month before the examination {β (1 day/week/month) = 0.414 [95% confidence interval (CI): 0.178–0.528]/0.454 (95% CI: 0.186–0.753)/0.486 (95% CI: 0.164–0.796), p = 0.004/0.001/0.000, per 1 ppb increase, respectively}, and higher SO2 concentrations for 1 day and 1 week [β (1 day/week) = 0.402 (95% CI: 0.127–0.667)/0.520 (95% CI: 0.084–0.956), p = 0.004/0.020, per 1 μg/m3 increase, respectively]. As for tear secretion, higher O3 exposures for 1 day, 1 week, and 1 month were associated with decreased ST [β (1 day/week/month) = −0.113 (95% CI: −0.158 to −0.032)/−0.133 (95% CI: −0.221 to −0.087)/−0.191 (95% CI: −0.283 to −0.091), p = 0.043/0.032/0.003, respectively] and TMH [β (1 day/week/month) = −0.089 (95% CI: −0.161 to −0.006)/−0.166 (95% CI: −0.209 to −0.014)/−0.189 (95% CI: −0.225 to −0.013), all p = 0.000]. Higher PM2.5 exposure was associated with increased ST for 1 day, 1 week, and 1 month [β (1 day/week/month) = 0.044 (95% CI: −0.038 to 0.127)/0.121 (95% CI: 0.009–0.188)/0.166 (95% CI: 0.014–0.319), p = 0.039/0.034/0.033, per 1 μg/m3 increase, respectively]; however, with decreased TMH for 1 day [β = −0.087 (95% CI: −0.113 to −0.002), p = 0.009] and 1 month [β = −0.014 (95% CI: −0.026 to −0.003), p = 0.017]. Higher PM10 exposure for 1 day, 1 week, and 1 month were associated with decreased TMH [β (1 day/week/month) = −0.095 (95% CI: −0.158 to −0.003)/ −0.116 (95% CI: −0.201 to −0.011)/−0.210 (95% CI: −0.317 to −0.102), p = 0.000/0.007/0.000, per 1 μg/m3 increase, respectively]. Adverse associations were found between NO2 concentration and ST for 1 month [β = −0.323 (95% CI: −0.492 to −0.154), p = 0.000, per 1 μg/m3 increase], as well as TMH for 1 day, 1 week, and 1 month [β (1 day/week/month) = −0.011 (95% CI: −0.016 to −0.006)/−0.019 (95% CI: −0.028 to −0.010)/−0.034 (95% CI: −0.044 to −0.025), all p = 0.000, respectively]. Adverse associations were found between TBUT and various air pollutants, such as PM2.5, PM10, O3, and SO2. Additionally, increased CFS scores were associated with higher PM2.5, PM10, O3, SO2, and NO2 exposures.
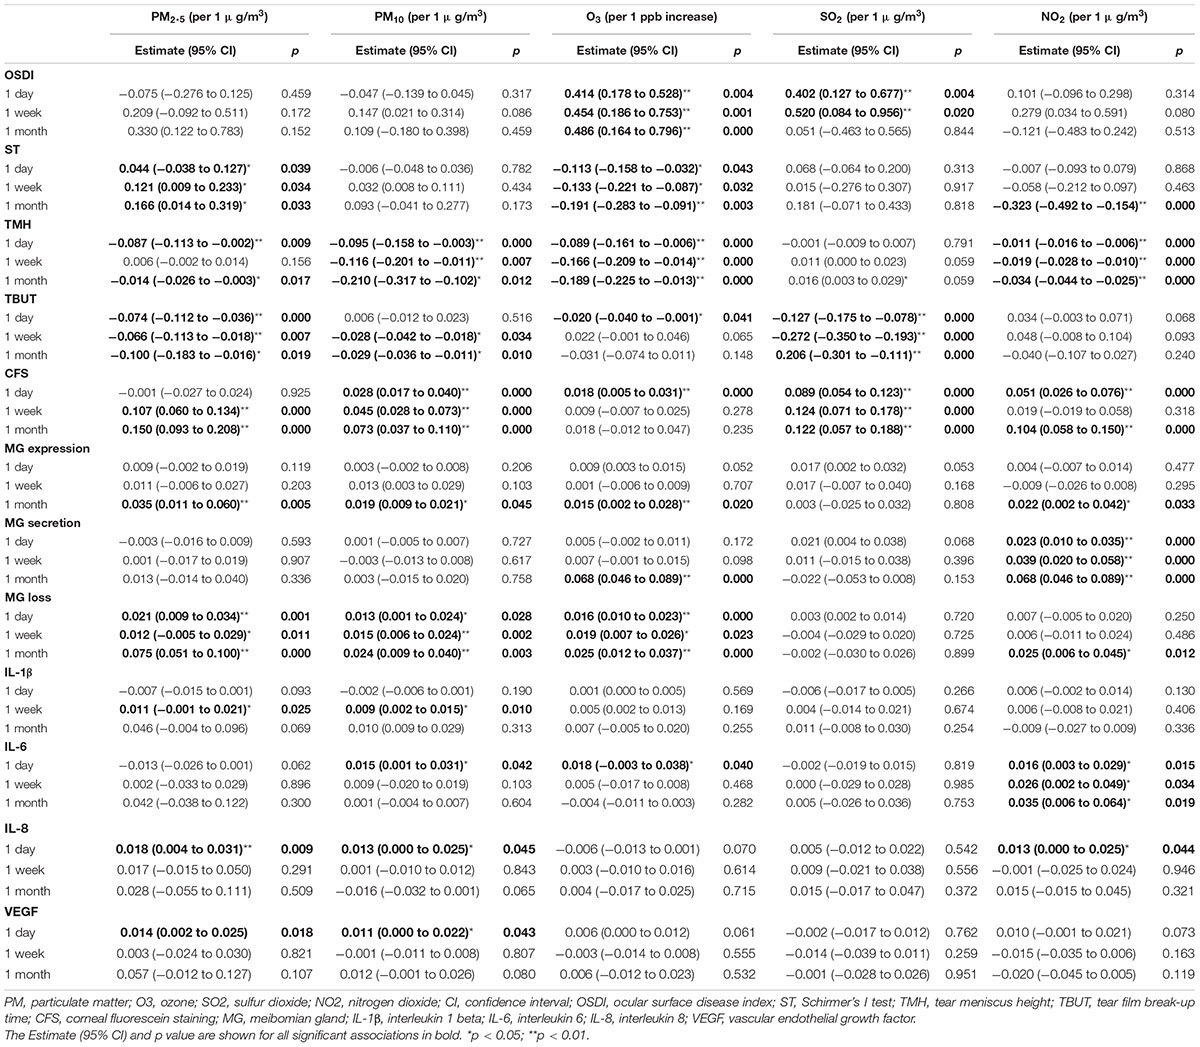
Table 3. Effects of air pollutants on ocular surface using single-pollutant models.
Exposure to air pollution for 1 month had a greater effect on MG, such as MG expression and PM2.5 [β = 0.035 (95% CI: 0.011–0.060), p = 0.005], PM10 [β = 0.019 (95% CI: 0.009–0.021), p = 0.045], O3 [β = 0.015 (95% CI: 0.002–0.028), p = 0.020] and NO2 [β = 0.022 (95% CI: 0.002–0.042), p = 0.033]; MG secretion and O3 [β = 0.068 (95% CI: 0.046–0.089), p = 0.000], and NO2 [β = 0.068 (95% CI: 0.046–0.089), p = 0.000]; MG loss and NO2 [β = 0.025 (95% CI: 0.006–0.045), p = 0.012], PM2.5 [β = 0.075 (95% CI: 0.051–0.100), p = 0.000], PM10 [β = 0.024 (95% CI: 0.009–0.040), p = 0.003], and O3 [β = 0.025 (95% CI: 0.012–0.037), p = 0.000].
Exposure to air pollution for 1 day had a greater effect on tear cytokines, such as PM2.5 and IL-8 [β = 0.018 (95% CI: 0.004–0.031), p = 0.009], and VEGF [β = 0.014 (95% CI: 0.002–0.025), p = 0.018]; PM10 and IL-6 [β = 0.015 (95% CI: 0.001–0.031), p = 0.042], IL-8 [β = 0.013 (95% CI: 0.000–0.025), p = 0.045] and VEGF [β = 0.011 (95% CI: 0.000–0.022), p = 0.043]; O3 and IL-6 [β = 0.018 (95% CI: −0.003 to 0.038), p = 0.040]; NO2 and IL-8 [β = 0.013 (95% CI: 0.000–0.025), p = 0.044]. Higher PM exposure for 1 week was associated with IL-1β [PM2.5: β = 0.011 (95% CI: −0.001 to 0.021), p = 0.025; PM10: 0.009 (95% CI: 0.002–0.015), p = 0.010]. Higher NO2 exposure for 1 day, 1 week, and 1 month were associated with IL-6 [β (1 day/week/month) = 0.016 (95% CI: 0.003–0.029)/0.026 (95% CI: 0.002–0.049)/0.035 (95% CI: 0.006–0.064), p = 0.015/0.034/0.019, respectively]. There was no association between SO2 exposure and tear cytokines.
The Effects of Air Pollutants on Ocular Surface in the Multi-Pollutant Model
The effects of air pollutants on ocular surface in the multi-pollutant model are shown in Table 4. Multicollinearity analyses among all air pollutants were assessed to ensure the variance inflation factors less than 10 in this model. Higher O3 exposures for 1 day, 1 week, and 1 month were associated with an increased OSDI score as well as decreased ST and TMH [OSDI: β (1 day/week/month) = 0.403 (95% CI: 0.229–0.523)/0.471 (95% CI: 0.252–0.693)/0.468 (95% CI: 0.215–0.732), p = 0.020/0.008/0.040; ST: β (1 day/week/month) = −0.117 (95% CI: −0.149 to −0.008)/−0.125 (95% CI: −0.178 to −0.068)/−0.114 (95% CI: −0.200 to −0.029), p = 0.033/0.029/0.009; TMH: β (1 day/week/month) = −0.075 (95% CI: −0.127 to −0.010)/−0.136 (95% CI: −0.209 to −0.053)/−0.118 (95% CI: −0.223 to −0.022), all p = 0.000]. Higher SO2 exposures were associated with increased OSDI and CFS score, as well as decreased TBUT [OSDI: β (1 day/week) = 0.437 (95% CI: 0.193–0.680)/0.470 (95% CI: 0.040–0.901), p = 0.000/0.032; CFS: β (1 day/week/month) = 0.089 (95% CI: 0.054–0.123)/0.106 (95% CI: 0.059–0.154)/0.073 (95% CI: 0.007–0.138), p = 0.000/0.000/0.029; TBUT: β (1 day/week/month) = −0.122 (95% CI: −0.170 to −0.073)/ −0.293 (95% CI: −0.363 to −0.224)/−0.241 (95% CI: −0.307 to −0.174), all p = 0.000]. Unlike in the single-pollutant model, higher PM2.5 concentrations for 1 week and 1 month were associated with an increased OSDI score [β (1 week/month) = 0.229 (95% CI: 0.035–0.424)/0.211 (95% CI: 0.160–0.583), p = 0.021/0.014, respectively]. Moreover, higher PM2.5 concentration was associated with increased ST for 1 day [β = 0.246 (95% CI: 0.106–0.328), p = 0.029] and 1 week [β = 0.202 (95% CI: 0.150–0.365), p = 0.046]; but decreased TMH for 1 day [β = −0.086 (95% CI: −0.112 to −0.010), p = 0.029], 1 week [β = −0.043 (95% CI: −0.085 to 0.021), p = 0.042], and 1 month [β = −0.023 (95% CI: −0.033 to −0.014), p = 0.000]. Higher PM10 exposure for 1 month was also associated with decreased TMH [β = −0.015 (95% CI: −0.021 to −0.009), p = 0.000], but not associated with OSDI and ST. Similarity, air pollutants showed adverse associations with TBUT and positive effects on CFS, and those effects were more apparently for 1-week exposure. However, exposure to PM, O3, and NO2 for 1 month showed higher effects on MG function.
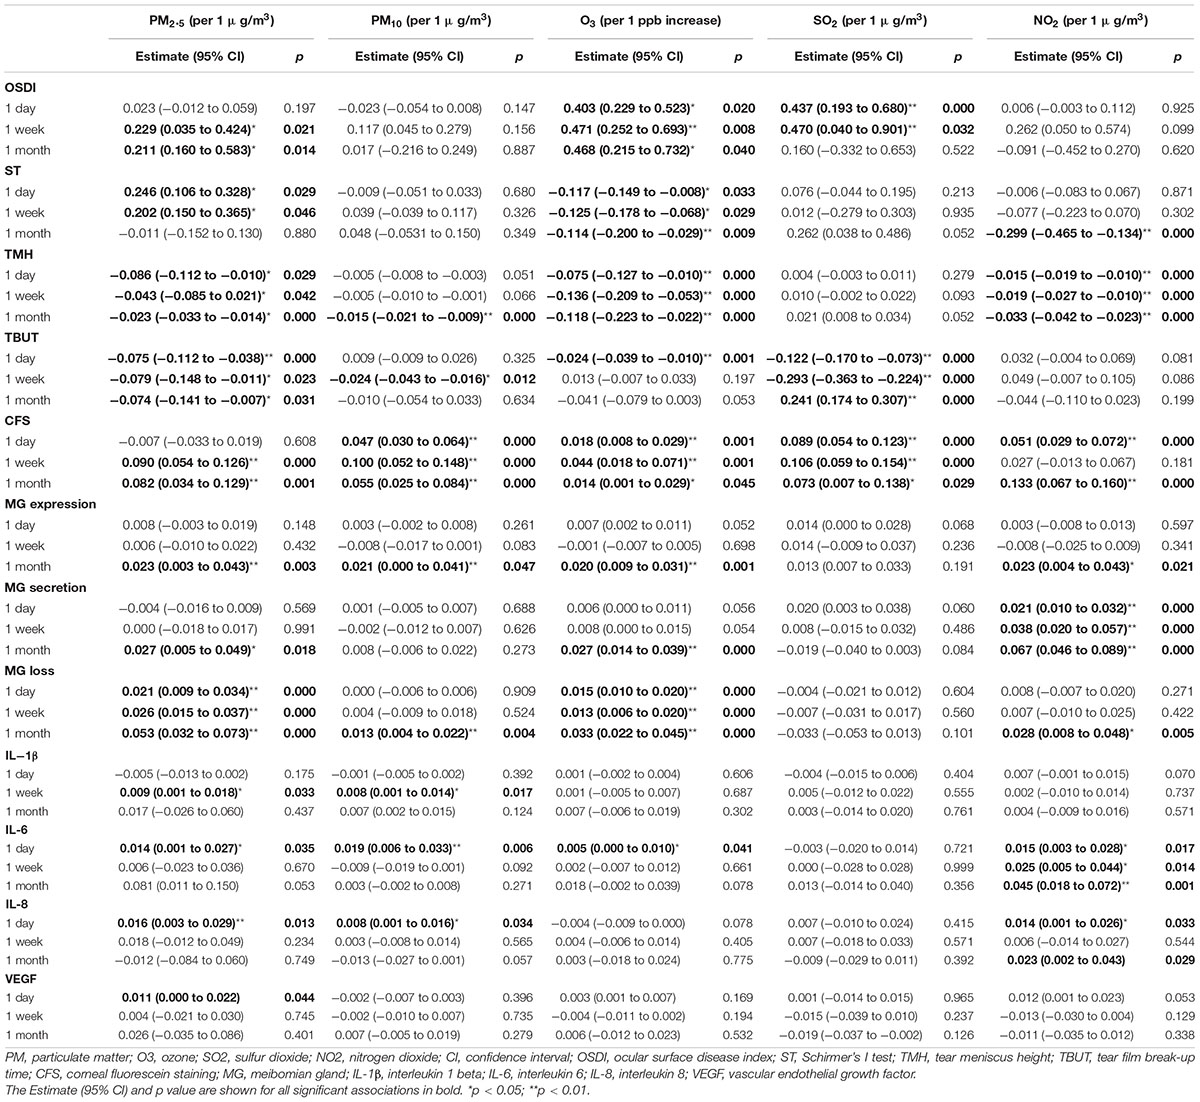
Table 4. Effects of air pollutants on ocular surface using multi-pollutant models.
Exposure to PM and O3 for 1 day had greater effects on tear cytokines, such as PM2.5 and IL-6 [β = 0.014 (95% CI: 0.001–0.027), p = 0.035], IL-8 [β = 0.016 (95% CI: 0.003–0.029), p = 0.013], VEGF [β = 0.011 (95% CI: 0.000–0.022), p = 0.044]; PM10 and IL-6 [β = 0.019 (95% CI: 0.006–0.033), p = 0.006], IL-8 [β = 0.008 (95% CI: 0.001–0.016), p = 0.034]; O3 and IL-6 [β = 0.005 (95% CI: 0.000–0.010), p = 0.041]. Higher PM exposures were associated with increased IL-1β concentration for 1 week [PM2.5: β = 0.009 (95% CI: 0.001–0.018), p = 0.033; PM10: β = 0.008 (95% CI: 0.001–0.014), p = 0.017]. However, exposure to NO2 for 1 month had greater effects on tear cytokines, such as NO2 and IL-6 [β = 0.045 (95% CI: 0.018–0.072), p = 0.001], NO2 and IL-8 [β = 0.023 (95% CI: 0.002–0.043), p = 0.029].
Discussion
The multicenter prospective cohort study found that higher PM2.5, O3, and SO2 exposures could increase ocular surface discomfort, aggravate tear film stability, and deteriorate ocular surface damage. Increased PM10 concentration also led tear film instability and ocular injury, however, it was not associated with an increased OSDI score. Increased O3 and NO2 concentrations decreased tear secretion, higher PM2.5 level increased ST while decreased TMH. Exposure to high levels of air pollutants (except SO2) also aggravated meibomian gland dysfunction (MGD) and upregulated tear inflammatory cytokine concentrations. Interestingly, the time windows of different air pollutants exposure on different DED parameters were diverse. Exposure to air pollutants for 1 week before the examination had the greatest effects on the discomforts and clinical data of DED, while exposure to air pollution for 1 month and 1 day showed more apparently influences on MG functions and tear cytokines, respectively.
The PM has become one of the crucial air pollutants and can result in various diseases of human beings (21, 35). The development in industrialization and urbanization has led to air pollution as the biggest social issue in China recently, and PM levels in China often exceeded normal range and reached “bad” level according to the WHO air quality guidelines. The constituents of PM are diverse and complex, mainly such as polyaromatic hydrocarbons, nitrate, sulfate, organic carbon, heavy metals, and among others (21). Since the continuously changed atmospheric chemistry and weather conditions in different time and locations, and the complex interactions with other air pollutants, the PM compositions are diverse and can play various roles on the ocular surface (21). The patients in the present study were enrolled from the industrial and densely populated areas, the predominant compositions of PM are organic compound, nitrate, and sulfate. It may be hard for us to determine the specific effects of PM on the ocular surface because of the heterogeneity. However, several confounding factors including humidity and season have been adjusted and consistent results were found both in the single and multi-pollutant models. The oxidative stress has been proved to be a main harmful effect of PM (17, 18). Increased PM2.5 and PM10 exposure on the ocular surface could cause tear film instability and homeostasis imbalance, then lead to ocular surface damage (17, 18). Higher PM concentrations also could impair corneal epithelial cell and conjunctival goblet cells, as well as increase the release of pro-inflammatory factors, including TNF-α and phosphorylated NF-κB in mice (17, 18). Those results were consistent with our findings. In the present study, high PM exposures were associated with the increased tear film instability and ocular surface damage. High PM2.5 exposures were associated with more serious dry eye complaints and increased ST. Interestingly, PM could stimulate the tear production (increased ST) but could not remain tears on the ocular surface (decreased TMH), this might also be attributed to the poor tear film stability. Increased PM2.5 concentration was closely associated with a decreased TBUT in both the single- and multi-pollutant models compared to PM10. Moreover, increased PM2.5 concentration was associated with an increased OSDI score. These diversities may be because of the differences in particle sizes. Among all the coarse particles, PM10 is the largest one. The large particle size may influence the contact areas with the tear film and lead to a lower effect than PM2.5. Compared to PM10, PM2.5 may adsorb more toxic materials and elicit greater toxicity since the much wider available surface areas.
Similar to the PM, NO2 is considered as combustion-derived pollutant from vehicular emissions and biomass burning (36, 37). Several studies have demonstrated the association between conjunctival goblet cell density and NO2 level (36, 37). Mucins, which mainly produced from goblet cells, play a key role in keeping tear film stability and ocular surface homeostasis, such as removal of pathogens, allergens and debris, lubrication, and antimicrobial properties (38, 39). Gipson et al. found that increased mucin levels were associated with DED presentation (38). Actually, the excess mucin production is a self-preservation mechanism in humans to defend ocular surface irritation and early stage inflammatory (38, 40). Those funding were consistent with our results that higher NO2 concentrations increased the ocular surface damage, impaired the MG function and upregulated the pro-inflammatory factors. However, there was no associations with OSDI scores and TBUT, suggesting the appearance of a compensatory mechanism to avoid dry eye symptoms and keep tear film balance (41). There may be some adaptive responses during continued exposure to air pollution. And though some unknown pathways, increased goblet cell density and mucin levels could remain tears and maintain tear film homeostasis, therefore, patients remain symptom-free temporarily. Additionally, exposure to NO2 for 1 month had the greater effects on ocular surface (including MG and cytokines) than exposure for 1 day or 1 week. The damage to the ocular surface was cumulative over time, suggesting that compensatory mechanism may only work within a certain threshold, and long-term exposures causing lasting damage. A study also found the conjunctivitis outpatient visit was small after exposure to NO2 immediately but the odds were increasing with time (42).
Epidemiological studies found SO2 was derived from the combustion of sulfur-containing fossil fuels of motor vehicles and various industries (43). Exposure to SO2 contributes to high morbidity and mortality worldwide (43, 44). Eye sensitivity and irritation were found associated with high SO2 exposures (45). Saha et al. suggested that tear film was vulnerable when exposure to combustion products in ambient air (46). Those results were consisted with our findings that increased ground-level SO2 concentrations increased ocular discomforts and tear secretions (ST), decreased the TBUT and caused ocular surface damage. The balance and dynamics of tear film are influenced by many factors, such as tear generation and evaporation, eyelid motion, surface tension, and polar lipid of the tear film (47). Tear film can evenly diffuse on the ocular surface because of a reduced air-fluid interface tension (47, 48). As the first physical and chemical barrier, the outermost lipid layer of the precorneal tear film may be influenced by the combustion particulates (PM, NO2, and SO2) which repeated contact on the air-fluid surface though oxidative damage or other mechanisms, resulting in an increased surface energy. Moreover, there is a negative correlation between TBUT and surface tension (48). As a consequence, decreased TBUT may be associated with higher PM and SO2 concentrations.
As a powerful oxidant, Ozone has been reported to be associated with various adverse health effects and even increased the mortality rates (49). The previous studies have shown that the O3 exposure was associated with DED. Hwang et al. found that DED symptoms and diagnosis were associated with higher O3 exposures in Korea (14). Moreover, Kim et al., demonstrated that higher O3 concentrations were associated with increased OSDI scores and decreased tear secretion in DED patients (21). Additionally, Lee et al., reported that O3 could upregulate tear inflammatory cytokine levels (IL-1β, IL-6, and IL-17) and decrease conjunctival goblet cell density in mouse models, therefore, resulting in ocular surface discomfort and inflammation (50, 51). This present study also showed that high O3 concentrations increased ocular discomfort, decreased tear secretion (both ST and TMH), impaired tear film stability, aggravated ocular surface damage and upregulated tear inflammatory cytokine levels (IL-6). The O3 concentration was also associated with MGD, especially in 1 month. It may be based on its ability to produce reactive oxygen species and induce pro-inflammatory cytokines. Also, O3 can cause injury to cellular proteins and lipids and the damage may accumulate over time. Importantly, ozone is an atmospheric trace gas with its molecule much smaller than a protein or lipid (43). Therefore, it may approach the ocular surface, such as cornea, lacrimal glands, and MGs, decrease tear secretions and induce ocular surface inflammation (21). The effects of O3 on the lacrimal glands need further study.
The effects of air pollution on various clinical parameters of DED are different. Exposure to air pollution for 1 week had a greater effect on ocular discomforts and signs than exposure for 1 day or 1 month. However, the influences on the MG and tear cytokines were apparently in 1 month and 1 day, respectively. Different air pollutants also play diverse roles in different ocular characteristics. Exposure to high SO2 levels were more likely to cause ocular surface discomfort and damage as well as tear film instability, and the effects peaked within a week. While high NO2 levels were closely associated with MG functions and inflammatory cytokines and had a greater effect for 1 month. PM and O3 showed wide influences on the ocular surface. Li et al. and Tan et al. have found obvious dose–response relationships in the continuous exposure to air pollutants in animal models (17, 18). However, the concentrations of air pollution changes persistently from time to time. Inevitably, we have to use the mean concentrations in the present study. And our patients were asked to do 3–4 h outdoor activities in the corresponding zone. Thus, the dose–response relationship in this study seems not as evident as in those animal eyes. However, exposure to high levels of air pollution for 1 day can sufficiently upregulate inflammatory cytokines, 1-week exposure can obviously aggravate DED and 1-month exposure can apparently impair MG.
This study had several limitations. First, the study sample size was not large enough, which made it difficult to stratify the differences in DED subtypes for further analyses. Second, since this was a prospective cohort study, the results did not definitively provide causal evidence for the relationship between DED and air pollutants. Third, air-quality monitoring did not yield constant results, and there were differences between the indoor and outdoor activities of individuals. To avoid this discrepancy as much as possible, our participants were required to do 3–4 h outdoor activities in the corresponding zone. Fourth, the chemical characteristics of the compounds adsorbed to the particle surface will definite determine the PM toxic effects on the ocular surface and the correlation with DED symptoms, and those different effects will be clarified in further studies. Despite the above limitations, the present study is a well-designed multicenter prospective clinical study with organized statistical analysis. We have adjusted for several confounding factors including humidity and found consistent results both in the single and multi-pollutant models. We also considered the MGD and conducted laboratory examinations of inflammation in this study. Therefore, this present study still has some meaningful effects.
Conclusion
In conclusion, increased PM2.5, O3, and SO2 exposures could cause ocular discomfort and damage as well as tear film instability. Increased PM10 concentration impaired tear film stability and ocular surface balance, however, it was not associated with eye symptoms. High O3 and NO2 concentrations decreased tear secretion, increased PM2.5 levels increased ST while reduced TMH. Exposure to high levels of air pollutants also impaired MG and upregulated tear cytokine concentrations. Thus, air pollutants seem to affect DED via various mechanisms. Furthermore, exposure to air pollutants for 1 week before the examination had the greatest effects on the symptoms and signs of DED, while exposure for 1 month and 1 day showed more obviously influences on MG and inflammatory cytokines, respectively. The time windows of air pollutants on different DED parameters were diversity. Further prospective multi-center clinical studies with large amounts of subjects from diverse regions are needed, such as severity classification, individual monitoring, personalized treatments, and longer follow-up periods.
Data Availability Statement
The raw data supporting the conclusions of this article will be made available by the authors, without undue reservation.
Ethics Statement
The studies involving human participants were reviewed and approved by Peking University Third Hospital Ethics Committee (No. M2019101). The patients/participants provided their written informed consent to participate in this study.
Author Contributions
RH and MZ setup the protocol and recruited the participants. RH collected and analyzed the data, created the figures, and contributed to the writing. MZ and LZ discussed the data and participated in writing manuscript. YL, MS, JD, YX, FW, JW, XX, ZL, and SL recruited the participants. XL setup the protocol, and oversaw the final manuscript. All authors contributed to the article and approved the submitted version.
Funding
This work was supported by “National Natural Science Foundation of Beijing” (No. 7202229). The funding organization had no role in the design or conduct of this research.
Conflict of Interest
The authors declare that the research was conducted in the absence of any commercial or financial relationships that could be construed as a potential conflict of interest.
Publisher’s Note
All claims expressed in this article are solely those of the authors and do not necessarily represent those of their affiliated organizations, or those of the publisher, the editors and the reviewers. Any product that may be evaluated in this article, or claim that may be made by its manufacturer, is not guaranteed or endorsed by the publisher.
References
1. Sinharay R, Gong J, Barratt B, Ohman-Strickland P, Ernst S, Kelly FJ, et al. Respiratory and cardiovascular responses to walking down a traffic-polluted road compared with walking in a traffic-free area in participants aged 60 years and older with chronic lung or heart disease and age-matched healthy controls: a randomised, crossover study. Lancet. (2018) 391:339–49.
2. Zhong JY, Lee YC, Hsieh CJ, Tseng CC, Yiin LM. Association between dry eye disease, air pollution and weather changes in Taiwan. Int J Environ Res Public Health. (2018) 15:E2269. doi: 10.3390/ijerph15102269
3. Wang X, Kindzierski W, Kaul P. Air pollution and acute myocardial infarction hospital admission in Alberta, Canada: a three-step procedure case-crossover study. PLoS One. (2015) 10:e0132769. doi: 10.1371/journal.pone.0132769
4. Su C, Breitner S, Schneider A, Liu L, Franck U, Peters A, et al. Short-term effects of fine particulate air pollution on cardiovascular hospital emergency room visits: a time-series study in Beijing, China. Int Arch Occup Environ Health. (2016) 89:641–57. doi: 10.1007/s00420-015-1102-6
5. Weichenthal S, Lavigne E, Evans G, Pollitt K, Burnett RT. Ambient PM2.5 and risk of emergency room visits for myocardial infarction: impact of regional PM2.5 oxidative potential: a case-crossover study. Environ Health. (2016) 15:46.
6. Mustafic H, Jabre P, Caussin C, Murad MH, Escolano S, Tafflet M, et al. Main air pollutants and myocardial infarction: a systematic review and meta-analysis. JAMA. (2012) 307:713–21. doi: 10.1001/jama.2012.126
7. Chan SH, Van Hee VC, Bergen S, Szpiro AA, DeRoo LA, London SJ, et al. Long-Term air pollution exposure and blood pressure in the sister study. Environ Health Perspect. (2015) 123:951–8.
8. Link MS, Dockery DW. Air pollution and the triggering of cardiac arrhythmias. Curr Opin Cardiol. (2010) 25:16–22.
9. Forouzanfar MH, Afshin A, Alexander LT, Anderson HR, Bhutta ZA, Biryukov S, et al. Global, regional, and national comparative risk assessment of 79 behavioural, environmental and occupational, and metabolic risks or clusters of risks, 1990-2015: a systematic analysis for the Global Burden of Disease Study 2015. Lancet. (2016) 388:1659–724.
10. Meo SA, Memon AN, Sheikh SA, Rouq FA, Usmani AM, Hassan A, et al. Effect of environmental air pollution on type 2 diabetes mellitus. Eur Rev Med Pharmacol Sci. (2015) 19:123–8.
11. Stafoggia M, Cesaroni G, Peters A, Andersen ZJ, Badaloni C, Beelen R, et al. Long-term exposure to ambient air pollution and incidence of cerebrovascular events: results from 11 European cohorts within the ESCAPE project. Environ Health Perspect. (2014) 122:919–25. doi: 10.1289/ehp.1307301
12. Woodruff TJ, Darrow LA, Parker JD. Air pollution and postneonatal infant mortality in the United States, 1999-2002. Environ Health Perspect. (2008) 116:110–5. doi: 10.1289/ehp.10370
13. Lelieveld J, Evans JS, Fnais M, Giannadaki D, Pozzer A. The contribution of outdoor air pollution sources to premature mortality on a global scale. Nature. (2015) 525:367–71.
14. Hwang SH, Choi YH, Paik HJ, Wee WR, Kim MK, Kim DH. Potential importance of ozone in the association between outdoor air pollution and dry eye disease in South Korea. JAMA Ophthalmol. (2016) 134:503–10. doi: 10.1001/jamaophthalmol.2016.0139
15. Mo Z, Fu Q, Lyu D, Zhang L, Qin Z, Tang Q, et al. Impacts of air pollution on dry eye disease among residents in Hangzhou, China: a case-crossover study. Environ Pollut. (2019) 246:183–9. doi: 10.1016/j.envpol.2018.11.109
16. Bron AJ, de Paiva CS, Chauhan SK, Bonini S, Gabison EE, Jain S, et al. TFOS DEWS II pathophysiology report. Ocul Surf. (2017) 15:438–510.
17. Li J, Tan G, Ding X, Wang Y, Wu A, Yang Q, et al. A mouse dry eye model induced by topical administration of the air pollutant particulate matter 10. Biomed Pharmacother. (2017) 96:524–34. doi: 10.1016/j.biopha.2017.10.032
18. Tan G, Li J, Yang Q, Wu A, Qu DY, Wang Y, et al. Air pollutant particulate matter 2.5 induces dry eye syndrome in mice. Sci Rep. (2018) 8:17828.
19. Craig JP, Nichols KK, Akpek EK, Caffery B, Dua HS, Joo CK, et al. TFOS DEWS II Definition and Classification Report. Ocul Surf. (2017) 15:276–83.
20. Lemp MA, Baudouin C, Baum J, Dogru M, Foulks GN, Kinoshita S, et al. The definition and classification of dry eye disease: report of the definition and classification subcommittee of the international dry eye workshop (2007). Ocul Surf. (2007) 5:75–92. doi: 10.1016/s1542-0124(12)70081-2
21. Kim Y, Choi YH, Kim MK, Paik HJ, Kim DH. Different adverse effects of air pollutants on dry eye disease: ozone, PM2.5, and PM10. Environ Pollut. (2020) 265:115039. doi: 10.1016/j.envpol.2020.115039
22. Hao R, Wan Y, Zhao L, Liu Y, Sun M, Dong J, et al. The effects of short-term and long-term air pollution exposure on meibomian gland dysfunction. Sci Rep. (2022) 12:6710. doi: 10.1038/s41598-022-10527-y
23. Huang X, Tang G, Zhang J, Liu B, Liu C, Zhang J, et al. Characteristics of PM2.5 pollution in Beijing after the improvement of air quality. J Environ Sci. (2021) 100:1–10. doi: 10.1016/j.jes.2020.06.004
24. Li X, Zhao H, Xue T, Geng G, Zheng Y, Li M, et al. Consumption-based PM2.5-related premature mortality in the Beijing-Tianjin-Hebei region. Sci Total Environ. (2021) 800:149575. doi: 10.1016/j.scitotenv.2021.149575
25. Fang C, Wang L, Li Z, Wang J. Spatial characteristics and regional transmission analysis of PM2.5 pollution in Northeast China, 2016-2020. Int J Environ Res Public Health. (2021) 18:12483. doi: 10.3390/ijerph182312483
26. Xu N, Zhang F, Xuan X. Impacts of industrial restructuring and technological progress on PM2.5 pollution: evidence from prefecture-level cities in China. Int J Environ Res Public Health. (2021) 18:5283. doi: 10.3390/ijerph18105283
27. Michel M, Sickenberger W, Pult H. The effectiveness of questionnaires in the determination of contact lens induced dry eye. Ophthalmic Physiol Opt. (2009) 29:479–86.
28. Qiu W, Zhang M, Xu T, Liu Z, Lv H, Wang W, et al. Evaluation of the effects of conjunctivochalasis excision on tear stability and contrast sensitivity. Sci Rep. (2016) 6:37570. doi: 10.1038/srep37570
29. Pflugfelder SC, Tseng SC, Sanabria O, Kell H, Garcia CG, Felix C, et al. Evaluation of subjective assessments and objective diagnostic tests for diagnosing tear-film disorders known to cause ocular irritation. Cornea. (1998) 17:38–56. doi: 10.1097/00003226-199801000-00007
30. Wolffsohn JS, Arita R, Chalmers R, Djalilian A, Dogru M, Dumbleton K, et al. TFOS DEWS II Diagnostic Methodology Report. Ocul Surf. (2017) 15:539–74.
31. Arita R, Itoh K, Inoue K, Amano S. Noncontact infrared meibography to document age-related changes of the meibomian glands in a normal population. Ophthalmology. (2008) 115:911–5. doi: 10.1016/j.ophtha.2007.06.031
32. Shimazaki J, Goto E, Ono M, Shimmura S, Tsubota K. Meibomian gland dysfunction in patients with Sjögren syndrome. Ophthalmology. (1998) 105:1485–8.
33. Tomlinson A, Bron AJ, Korb DR, Amano S, Paugh JR, Pearce EI, et al. The international workshop on meibomian gland dysfunction: report of the diagnosis subcommittee. Invest Ophthalmol Vis Sci. (2011) 52:2006–49.
34. Stapleton F, Alves M, Bunya VY, Jalbert I, Lekhanont K, Malet F, et al. TFOS DEWS II Epidemiology Report. Ocul Surf. (2017) 15:334–65.
35. Kim KH, Kabir E, Kabir S. A review on the human health impact of airborne particulate matter. Environ Int. (2015) 74:136–43.
36. Torricelli AA, Matsuda M, Novaes P, Braga AL, Saldiva PH, Alves MR, et al. Effects of ambient levels of traffic-derived air pollution on the ocular surface: analysis of symptoms, conjunctival goblet cell count and mucin 5AC gene expression. Environ Res. (2014) 131:59–63. doi: 10.1016/j.envres.2014.02.014
37. Novaes P, do Nascimento Saldiva PH, Kara-José N, Macchione M, Matsuda M, Racca L, et al. Ambient levels of air pollution induce goblet-cell hyperplasia in human conjunctival epithelium. Environ Health Perspect. (2007) 115:1753–6. doi: 10.1289/ehp.10363
38. Gipson IK, Spurr-Michaud SJ, Senchyna M, Ritter R III, Schaumberg D. Comparison of mucin levels at the ocular surface of postmenopausal women with and without a history of dry eye. Cornea. (2011) 30:1346–52. doi: 10.1097/ICO.0b013e31820d852a
39. Mantelli F, Argüeso P. Functions of ocular surface mucins in health and disease. Curr Opin Allergy Clin Immunol. (2008) 8:477–83.
40. Basbaum C, Lemjabbar H, Longphre M, Li D, Gensch E, McNamara N. Control of mucin transcription by diverse injury-induced signaling pathways. Am J Respir Crit Care Med. (1999) 160:S44–8. doi: 10.1164/ajrccm.160.supplement_1.12
41. Torricelli AA, Novaes P, Matsuda M, Braga A, Saldiva PH, Alves MR, et al. Correlation between signs and symptoms of ocular surface dysfunction and tear osmolarity with ambient levels of air pollution in a large metropolitan area. Cornea. (2013) 32:e11–5. doi: 10.1097/ICO.0b013e31825e845d
42. Szyszkowicz M, Kousha T, Castner J. Air pollution and emergency department visits for conjunctivitis: a case-crossover study. Int J Occup Med Environ Health. (2016) 29:381–93.
43. Carvalho H. New WHO global air quality guidelines: more pressure on nations to reduce air pollution levels. Lancet Planet Health. (2021) 5:e760–1. doi: 10.1016/S2542-5196(21)00287-4
44. Venners SA, Wang B, Xu Z, Schlatter Y, Wang L, Xu X. Particulate matter, sulfur dioxide, and daily mortality in Chongqing, China. Environ Health Perspect. (2003) 111:562–7.
45. Longo BM, Rossignol A, Green JB. Cardiorespiratory health effects associated with sulphurous volcanic air pollution. Public Health. (2008) 122:809–20.
46. Saha A, Kulkarni PK, Shah A, Patel M, Saiyed HN. Ocular morbidity and fuel use: an experience from India. Occup Environ Med. (2005) 62:66–9. doi: 10.1136/oem.2004.015636
47. Siddique JI, Braun RJ. Tear film dynamics with evaporation, osmolarity and surfactant transport. Appl Math Model. (2015) 39:255–69.
48. Niamprem P, Teapavarapruk P, Srinivas SP, Tiyaboonchai W. Impact of nanostructured lipid carriers as an artificial tear film in a rabbit evaporative dry eye model. Cornea. (2019) 38:485–91. doi: 10.1097/ICO.0000000000001867
49. Bell ML, McDermott A, Zeger SL, Samet JM, Dominici F. Ozone and short-term mortality in 95 US urban communities, 1987-2000. JAMA. (2004) 292:2372–8. doi: 10.1001/jama.292.19.2372
50. Lee H, Kim EK, Kim HY, Kim TI. Effects of exposure to ozone on the ocular surface in an experimental model of allergic conjunctivitis. PLoS One. (2017) 12:e0169209. doi: 10.1371/journal.pone.0169209
Keywords: air pollution, dry eye disease, meibomian gland, ocular surface, tear cytokine
Citation: Hao R, Zhang M, Zhao L, Liu Y, Sun M, Dong J, Xu Y, Wu F, Wei J, Xin X, Luo Z, Lv S and Li X (2022) Impact of Air Pollution on the Ocular Surface and Tear Cytokine Levels: A Multicenter Prospective Cohort Study. Front. Med. 9:909330. doi: 10.3389/fmed.2022.909330
Received: 31 March 2022; Accepted: 14 June 2022;
Published: 06 July 2022.
Edited by:
Yonathan Garfias, Universidad Nacional Autónoma de México, MexicoReviewed by:
Paulo Hilario Nascimento Saldiva, University of São Paulo, BrazilRomina Mayra Lasagni Vitar, San Raffaele Hospital (IRCCS), Italy
Copyright © 2022 Hao, Zhang, Zhao, Liu, Sun, Dong, Xu, Wu, Wei, Xin, Luo, Lv and Li. This is an open-access article distributed under the terms of the Creative Commons Attribution License (CC BY). The use, distribution or reproduction in other forums is permitted, provided the original author(s) and the copyright owner(s) are credited and that the original publication in this journal is cited, in accordance with accepted academic practice. No use, distribution or reproduction is permitted which does not comply with these terms.
*Correspondence: Xuemin Li, MTM5MTEyNTQ4NjJAMTYzLmNvbQ==, orcid.org/0000-0001-7822-4694
†These authors have contributed equally to this work