
94% of researchers rate our articles as excellent or good
Learn more about the work of our research integrity team to safeguard the quality of each article we publish.
Find out more
ORIGINAL RESEARCH article
Front. Med., 20 September 2022
Sec. Gastroenterology
Volume 9 - 2022 | https://doi.org/10.3389/fmed.2022.903856
This article is part of the Research TopicGlobal Excellence in Gastroenterology: AfricaView all 8 articles
 Shereen A. El Sobky1Nourhan K. Aboud1Nihal M. El Assaly2Injie O. Fawzy1Nada El-Ekiaby1Ahmed I. Abdelaziz1*
Introduction: Increased de novo lipogenesis (DNL) is one of the key factors contributing to fat accumulation and non-alcoholic fatty liver disease (NAFLD). Among the critical transcription factors (TFs) regulating DNL is mTOR and its downstream lipogenic TF, SREBP1c. In recent years, it has been established that non-coding RNAs (ncRNAs) play role in both biological processes and disease pathogenesis. Our group has previously characterized microRNAs that can target and regulate the expression of both mTOR and SREBP1c. Accordingly, this study aimed to broaden our understanding of the role of ncRNAs in regulating the mTOR/SREBP1c axis to elucidate the role of the non-coding transcriptome in DNL and lipid droplet (LD) formation. Hence, short ncRNA, miR-615-5p, and long non-coding RNA (lncRNA), H19, were chosen as they were previously proven to target mTOR by our group and in the published literature, respectively.
Methodology: Huh-7 cells were treated with 800 μM oleic acid (OA) to promote LD formation. Transfection of miR-615-5p mimics or H19 over-expression vectors was performed, followed by the measurement of their downstream targets, mTOR and SREBP, on the mRNA level by quantitative real-time PCR (qRT-PCR), and on the protein level by Western blot. To determine the functional impact of miR-615-5p and H19 on LD formation and triglyceride (TG) accumulation, post-transfection LDs were stained, imaged, and characterized, and TGs were extracted and quantified.
Results: miR-615-5p was able to reduce mTOR and SREBP1c significantly on both the mRNA and protein levels compared to control cells, while H19 caused a reduction of both targets on the protein level only. Both miR-615-5p and H19 were able to significantly reduce the LD count and total area, as well as TG levels compared to control cells.
Conclusion: To conclude, this study shows, for the first time, the impact of miR-615-5p and H19 on the mTOR/SREBP1c axis, and thus, their functional impact on LDs and TG accumulation. These findings might pave the way for using ncRNAs as potential therapeutic targets in the management of fatty liver.
Increased de novo lipogenesis (DNL) is one of the contributing factors leading to fat accumulation and non-alcoholic fatty liver disease (NAFLD) (1). DNL is controlled by lipogenic transcription factors such as sterol regulatory element-binding protein (SREBP), carbohydrate response element-binding protein (ChREBP), and peroxisome proliferator-activated receptor gamma (PPARγ) (2). These transcription factors may contribute to NAFLD as patients with NAFLD have increased DNL that is not suppressed by fasting or high nocturnal levels of free fatty acids (FFAs) in plasma (3). SREBP is the main transcription factor responsible for hepatic DNL by insulin (1). There are three isoforms of SREBP: SREBP1c, SREBP1a, and SREBP2. Despite functional overlap between different SREBPs, SREBP1c is the one which is primarily responsible for fatty acid synthesis and triglyceride (TG) accumulation (2).
Non-coding RNAs (ncRNAs) can be classified according to their length, localization, and function into several classes. They can be classified into small ncRNAs being <200 nucleotides (nts) long and long ncRNAs of more than 200 nts length (4). Among the small ncRNAs are the microRNAs (miRNAs). miRNAs are small single-stranded RNAs of ≈22 nucleotides that were shown to be among the main regulators for gene expression (5). Several miRNAs were reported to affect NAFLD and DNL, such as miR-122 and miR-33, which decrease SREBP expression as well as downstream enzymes needed for lipogenesis (6, 7). On the other hand, our group also found that miR-29a induces SREBP1c expression as well as lipid droplet (LD) and TG accumulation in HCV-infected cell models (8).
lncRNAs, on the other hand, have shown great versatility, regulating almost every step of eukaryotic gene expression through mechanisms such as chromatin remodeling, transcription machinery recruitment, mRNA processing and delivery to the cytoplasm, mRNA stabilization, translation, and posttranslational processing (9). In addition, lncRNAs are also able to fold into secondary and tertiary structures, enabling them to interact with proteins as well (9). Among the lncRNAs affecting DNL is MALAT1, which was found to induce SREBP1c expression as well as hepatic lipid accumulation (10). On the other hand, lncHR1 was found to repress SREBP1c and hepatic lipid accumulation (11). Furthermore, inhibition of PLIN2, a lipid droplet protein member, was reported to markedly increase lncRNA H19, resulting in a decrease in liver TGs (12).
Among the regulators of SREBP1c is mTOR (mammalian or mechanistic target of rapamycin), which is another activator of lipogenesis (13–15). mTOR nucleates both mTORC1 and mTORC2 complexes, which were found to activate SREBP1c expression and maturation (14, 16, 17). We have previously shown a tumor-suppressive effect for miR-615-5p in hepatocellular carcinoma by downregulating mTOR (18). Moreover, Wu et al. have also showed that miR-615-5p is capable of targeting mTOR in colorectal cancer (19). Interestingly, mTOR was also found to be regulated by lncRNA H19 in pituitary tumors (20). In addition, lncRNA H19 was shown to target the AKT/mTOR pathway in psoriasis (21), as well as hepatic stellate cells and fibrotic mouse models (22). In these previously published studies, miR-615-5p and lncRNA H19 were validated to target mTOR; however, pathways other than the mTOR/SREBP axis were investigated, and hence, their impact on LD and TG accumulation was not explored. Therefore, this study sought to regulate the lipogenic SREBP1c through its upstream TF, mTOR, via these validated ncRNAs, particularly since their impact on lipogenic activity has not been thoroughly investigated previously.
Therefore, the aim of the study is to examine the role of both ncRNAs on lipogenesis by investigating their effect on the lipogenic mTOR/SREBP axis while studying the net impact of this regulation on LD formation and TG accumulation in hepatic cell lines.
The human hepatocellular carcinoma cell line (Huh-7) was provided by Professor Kai Breuhahn (University of Heidelberg, Germany) and was cultured in Dulbecco's modified Eagle medium (DMEM) supplemented with 4.5 g/L glucose, L-glutamine (Biowest, France), 10% fetal bovine serum (Lonza, Switzerland), and 1% streptomycin/penicillin (Biowest, France). Cells were incubated under normal conditions (37°C and 5% CO2).
A total of 10,000 Huh-7 cells were seeded in 96-well plates and treated with different concentrations of oleic acid (OA) (Sigma Aldrich, United States) (250 μM, 500 μM, 1000 μM). 1X PBS was used as a negative control. MTT assay was performed 24 h and 48 h posttreatment. Absorbance was measured at 570 nm.
The Huh-7 cells were seeded in 24-well plates (75,000 cells/well) and then treated with 800 μM OA the following day (this concentration reflects the fasting plasma-free FA levels of patients with NASH) (23). After 24 h, the cells were transfected with either miR-615-5p mimics or negative control oligonucleotides (NC) (Qiagen, Germany) using HiPerFect transfection reagent (Qiagen, Germany) following the manufacturer's instruction. For plasmid transfection, the same procedure was followed but using SuperFect transfection reagent (Qiagen, Germany) to transfect H19 over-expression plasmid (provided by Prof. Kiemer, Saarland University, Germany) or empty vector.
Total cellular RNA was extracted 48 h post-transfection using TRIzol reagent (Invitrogen, USA) following the manufacturer's instructions. Total RNA was then DNAse-digested (NEB, USA) and reverse-transcribed into single-stranded complementary DNA (cDNA) using the high-capacity cDNA archive kit (Applied Biosystems, USA) following the manufacturer's instruction. The mRNA expression levels were quantified using TaqMan gene assays for H19, mTOR, and SREBP1c (Applied Biosystems, USA). On the other hand, miRNA was reverse-transcribed and quantified using the TaqMan microRNA Reverse Transcription Kit (Applied Biosystems, USA) and specific primers for hsa-miR-615-5p (Assay ID: 002353) or RNU6B (Assay ID: 001093). The mRNA and miRNA expression levels were quantified using a StepOne Real-Time PCR instrument (Applied Biosystems, USA). Relative expression was calculated using the comparative CT method. Beta-actin was used as an internal control for cellular genes, while RNU6B was used as an internal control for miRNAs.
Proteins were extracted 48 h post-transfection using TRIzol reagent (Invitrogen, USA) following the developed protocol by Ashley et al. (24). Proteins were quantified using a Modified Lowry Protein Assay Kit (Pierce Biotechnology, Inc.) following the manufacturer's instructions. A measure of 100 μg of proteins were separated using 8% SDS–PAGE. Proteins were transferred into a nitrocellulose membrane, and the expression of proteins was detected using mouse anti-mTOR (1:250) (4517, Cell signaling, USA), mouse anti-SREBP1c (2A4) antibody (1:50) (sc-13551, Santa Cruz Biotech, USA), and mouse anti-β-actin (C4) antibody (1:1000) (sc-47778, Santa Cruz Biotech, USA), respectively. Anti-mouse IgG-HRP (sc-516102, Santa Cruz Biotech, USA) was used along with the Clarity™ Western ECL Substrate (Biorad, USA) for detection of the protein bands. Blots were imaged using ImageQuant LAS500 (GE Healthcare Bio-Sciences, Sweden) and analyzed using ImageJ software (http://rsbweb.nih.gov/ij).
Lipid droplets were stained 48 h post-transfection as follows: cultured cells were fixed with 4% formaldehyde in PBS for 10 min. The cells were then washed three times with PBS, followed by permeabilization with 0.05% Tween 20 in PBS. The cells were washed three times with 1X PBS and then treated with 60% isopropanol for 5 min. This was followed by the addition of diluted oil red-O for 20 min (Serva, Germany). After removal of oil red-O, the cells were washed three times with distilled water. For imaging of lipid droplets, hematoxylin was added after washing oil red-O with distilled water, left to stand for 1–3 min, and then washed under running tap water to change its color from purple to blue. Lipid droplets were then imaged at 40x (Axiom Zeiss, Germany). For measuring oil red-O absorbance, oil red-O was eluted in 100% isopropanol and measured at 500 nm.
Digital analysis of lipid droplets from the cells stained with oil red-O was carried out, and imaged as suggested by Deutsch et al. method with some modifications. After staining lipid droplets with oil red-O and nuclei with hematoxylin, five random pictures at 40× were captured and analyzed using ImageJ software (http://rsbweb.nih.gov/ij). Brightness/contrast for each picture was adjusted to enhance contrast between oil red-O and bluish hematoxylin, and then images were color-thresholded for the color saturation of lipid droplet signals with the command option “pass”. Masked images were then compared with original images. After setting the scale for images, count, total area, and average size of lipid droplets were quantified. For each picture, these data were divided by the number of cells in the picture. Each experiment was normalized to itself.
Triglycerides were extracted 48 h post-transfection using the Folch extraction method (25, 26) as follows: cells were collected and homogenized in 1.5 ml chloroform:methanol (2:1) and left on ice for 30 min with occasional vortexing. This was followed by the addition of 0.38 ml water, and the mixture was left for 10 min on ice. The mixture was then centrifuged at 400xg for 5 min. The lower TG layer was collected and evaporated under vacuum using an Eppendorf Concentrator plus (Eppendorf, Germany), and then TGs were dissolved in 5% NP-40 and quantified using a triglyceride quantification colorimetric/fluorometric kit (MAK266, Sigma Aldrich, United States) following the manufacturer's instructions. The protein layer found in the interphase was collected and quantified using modified Lowry protein assay (Applied biosystem, USA) following the manufacturer's instructions. For each sample, the TG concentration was normalized to its respective protein level.
Gene expression was expressed in relative quantitation (RQ). miRNA or gene expression was compared using Student's unpaired t-test. The normality test was run for all results obtained from each experiment. The unpaired t-test or Mann–Whitney was used for p-value calculation depending on data distribution. A p-value <0.05 was considered statistically significant. *** = P < 0.001, ** = P < 0.01, * = P < 0.05, and ns = statistically not significant. All data were the result of multiple independent experiments. All data were statistically analyzed using GraphPad Prism 5.00 software and presented as mean ± standard error of the mean SEM.
The potential cytotoxic effect of different concentrations of OA on Huh-7 cells was determined using MTT assay at 24 and 48 h. At 24 h, Huh-7 cell viability had significantly increased at the following concentrations: 250 μM (p = 0.0006, 1.171 ± 0.04183), 500 μM (p = 0.0004, 1.201 ± 0.04998), and 1000 μM (p = 0.0002, 1.217 ± 0.05147) compared to cells treated with PBS (n = 2, pentaplicate) (Figure 1A), whereas at 48 h, there was no significant change between cell viability at 250 μM or 1000 μM compared to PBS (Figure 1B). However, the cells exhibited a significant increase in viability at 500 μM (p = 0.0396, 1.147 ± 0.08112) compared to PBS at 48 h (Figure 1B) (n = 2, pentaplicate).

Figure 1. Determining Huh-7 cell viability upon exposure to different concentrations of oleic acid. At 24 h (A), Huh-7 cell viability increased significantly at 250 μM (p = 0.0006), 500 μM (p = 0.0004), and 1000 μM (p = 0.0002) compared to PBS (n = 2, pentaplicate), whereas at 48 h, (B) Huh-7 cell viability only increased significantly at 500 μM (p = 0.0396), but there was no significant change with other concentrations (n = 2, pentaplicate). The unpaired two-tailed t-test was performed. *** P < 0.001, *P < 0.05.
To confirm the lipogenic effect of 800 μM OA on Huh-7 cells [the concentration of fasting plasma-free FA of patients with NASH (23)], LDs were stained after treatment with PBS or 800 μM OA. LDs of cells treated with 800 μM OA showed a significant increase in the oil red-O absorbance (p = 0.0074, 1.465 ± 0.1460) compared to the cells treated with PBS (1.000 ± 0.05947) (n = 3, quadruplicate) (Figure 2).
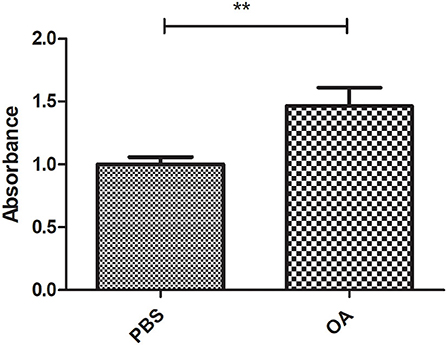
Figure 2. Validating the lipogenic effect of 800 μM on Huh7 cells. Oil red-O absorbance of LDs from cells treated with 800 μM OA showed significant increase (p = 0.0074) compared to cells treated with PBS (n = 3, quadruplicate). The unpaired two-tailed t-test was performed. **P < 0.01.
Relative expression of miR-615-5p and lncRNA H19 was investigated in cells treated with 800 μM OA compared to control cells treated with PBS. miR-615-5p was found to be upregulated (p = 0.0339, 2.215 ± 0.4799) (Figure 3A) in cells treated with 800 μM OA compared to control (1.061 ± 0.1308) (n > 3, duplicate). On the other hand, H19 was found to be downregulated (p = 0.0019, 0.6216 ± 0.06853) in cells treated with 800 μM OA compared to control (1.017 ± 0.07524) (Figure 3B) (n > 3, duplicate).
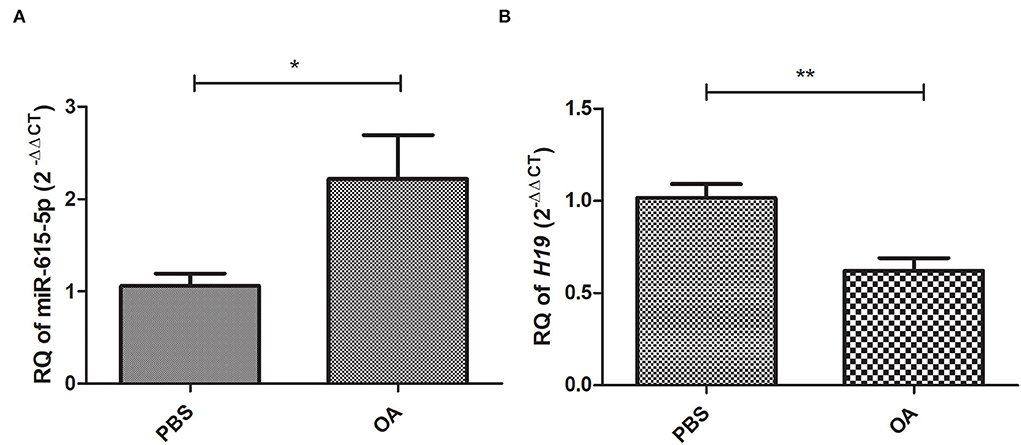
Figure 3. Expression profile of miR-615-5p and H19 in cells treated with 800 μM compared to controls treated with PBS. Expression pattern of miR-615-5p and H19 was determined in Huh-7 cells treated with 800 μM compared to control. (A) miR-615-5p levels were upregulated in cells treated with OA compared to controls (p = 0.0339) (n > 3, duplicate). (B) lncRNA H19 levels were downregulated in cells treated with OA compared to controls (p = 0.0019) (n > 3, duplicate). The unpaired two-tailed t-test was performed. **P < 0.01, *P < 0.05.
Relative expression of mTOR and SREBP1c at the mRNA level was examined in cells treated with 800 μM OA compared to control cells treated with PBS. Both mTOR (p = 0.0002, 0.6842 ± 0.03691) and SREBP1c (p = <0.0001, 0.4057 ± 0.01724) were found to be downregulated in cells treated with 800 μM OA compared to control (1.003 ± 0.03963) (1.003 ± 0.03614), respectively (n = 3, duplicate) (Figures 4A,B, respectively).
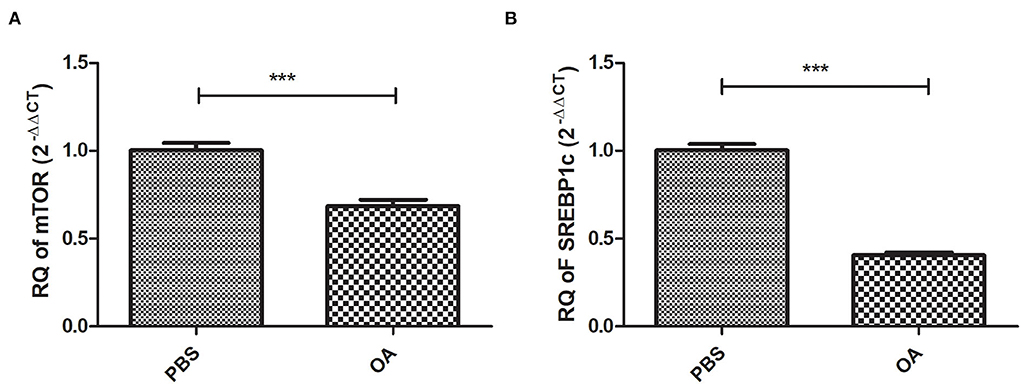
Figure 4. Expression profile of lipogenic transcription factors: mTOR and SREBP1c in cells treated with 800 μM compared to controls treated with PBS. Expression profile of mTOR and SREBP1c was determined in Huh-7 cells treated with 800 μM compared to control. Both mTOR (A) (p = 0.0002) and SREBP1c (B) (p = <0.0001) mRNA levels were downregulated in cells treated with OA compared to controls (n = 3, duplicate). The unpaired two-tailed t-test was performed. ***P < 0.001.
Huh-7 cells were treated with 800 μM OA, and on the next day, the cells were transfected with miR-615-5p oligonucleotides or negative control oligonucleotides with no homology to mammalian genes (NC). Efficient transfection was then confirmed by measuring the relative expression of miR-615-5p in mimicked cells relative to cells transfected with NC. Mimicked cells showed a mean 442-fold increase in miR-615-5p expression (p = 0.0195) compared to NC (Figure 5A). Mimicking of miR-615-5p in Huh-7 cells treated with 800 μM OA resulted in a decrease in the mRNA level of mTOR (p = 0.0429, 0.8945 ± 0.01901) compared to NC (1.006 ± 0.04784) (n > 3, duplicate) (Figure 5B). Concomitantly, SREBP1c was also reduced on the mRNA level in cells mimicked with miR-615-5p (p = 0.0457, 0.6671 ± 0.1279) compared to NC (1.000 ± 0.01217) (n > 3, duplicate) (Figure 5B).
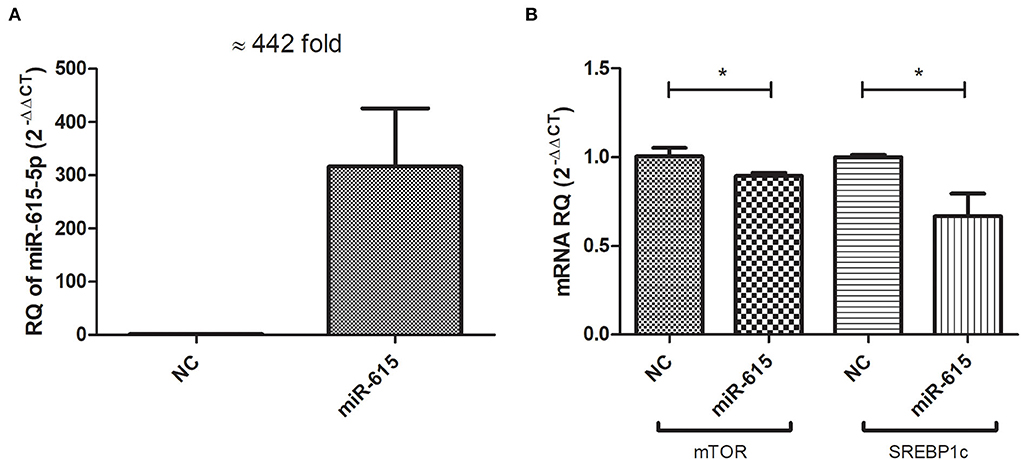
Figure 5. Impact of miR-615-5p on lipogenic transcription factors: mTOR and SREBP1c mRNA levels. Cells transfected with miR-615-5p showed a mean of 442-fold increase (p = 0.0195) compared to cells transfected with NC, thus confirming efficient transfection (A). Huh-7 cells treated with 800 μM OA, followed by miR-615 transfection showed a significant decrease in the mRNA level of mTOR (p = 0.0429) and SREBP1c (p = 0.0457) concomitantly (n > 3, duplicate) (B). The unpaired two-tailed t-test was performed. *P < 0.05.
Forcing the expression of miR-615-5p in Huh-7 cells treated with 800 μM OA resulted in a decrease in the protein level of mTOR (p = 0.0020, 0.3763 ± 0.1131) compared to NC (1.000 ± 0.07920) (n = 3) (Figures 6A,B). This was accompanied by a reduction in SREBP1c protein levels and in cells mimicked with miR-615-5p (p = 0.0146, 0.6717 ± 0.1056) compared to NC (1.000 ± 0.006537) (n > 3) (Figures 6C,D).
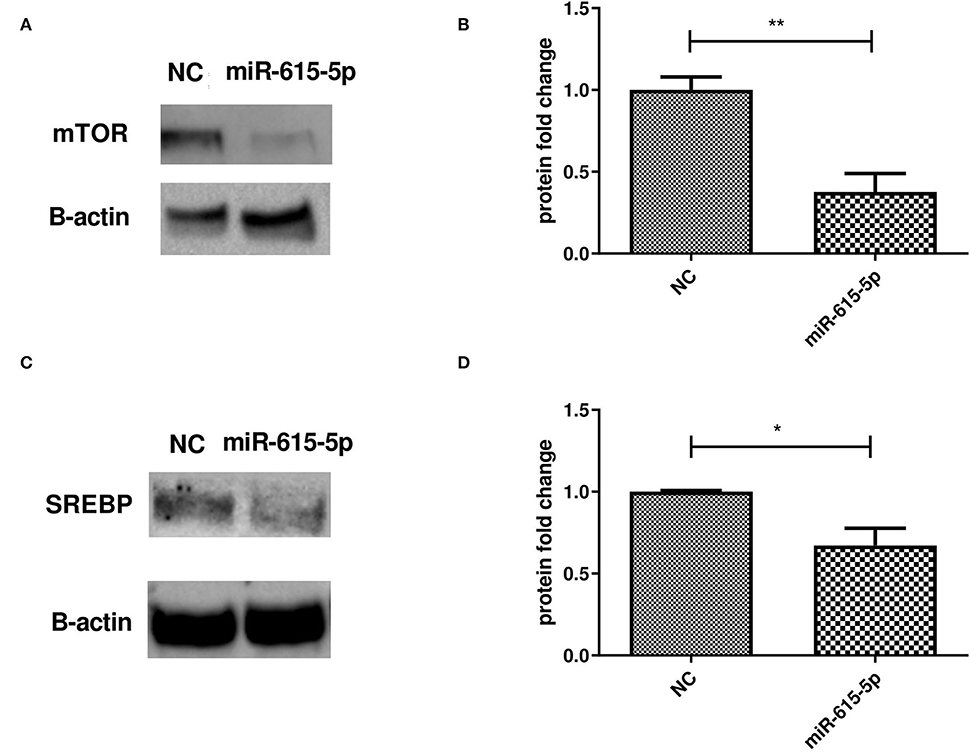
Figure 6. Impact of miR-615-5p on mTOR and SREBP protein levels. Determining the impact of forcing the expression of miR-615-5p in Huh-7 cells treated with 800 μM OA on mTOR/SREBP1 protein levels. (A) Representative figure of mTOR blots showing a decrease in the protein level of mTOR. (B) Relative quantification of the mTOR protein level in cells treated with an miR-615 mimic and NC (p = 0.0020) (n = 3). (C) Representative figure of SREBP1 blots showing a decrease in the protein level of SREBP1. (D) Relative quantification of the SREBP1 protein level in cells treated with an miR-615 mimic and NC (p = 0.0146) (n > 3). The unpaired two-tailed t-test was performed. **P < 0.01, *P < 0.05.
Lipid droplets were characterized in Huh-7 cells treated with 800 μM OA, followed by transfection of miR-615-5p mimics. Treatment with miR-615-5p showed a significant decrease in the LD count (p = 0.0162, 0.8002 ± 0.06855) compared to NC (1.000 ± 0.04403), as well as total area (p = 0.0158, 0.6833 ± 0.1070) compared to NC (1.000 ± 0.06993). However, no significant change was detected in the average size of LDs (p = 0.5848) compared to NC (n = 3, duplicate) (Figures 7A,B).
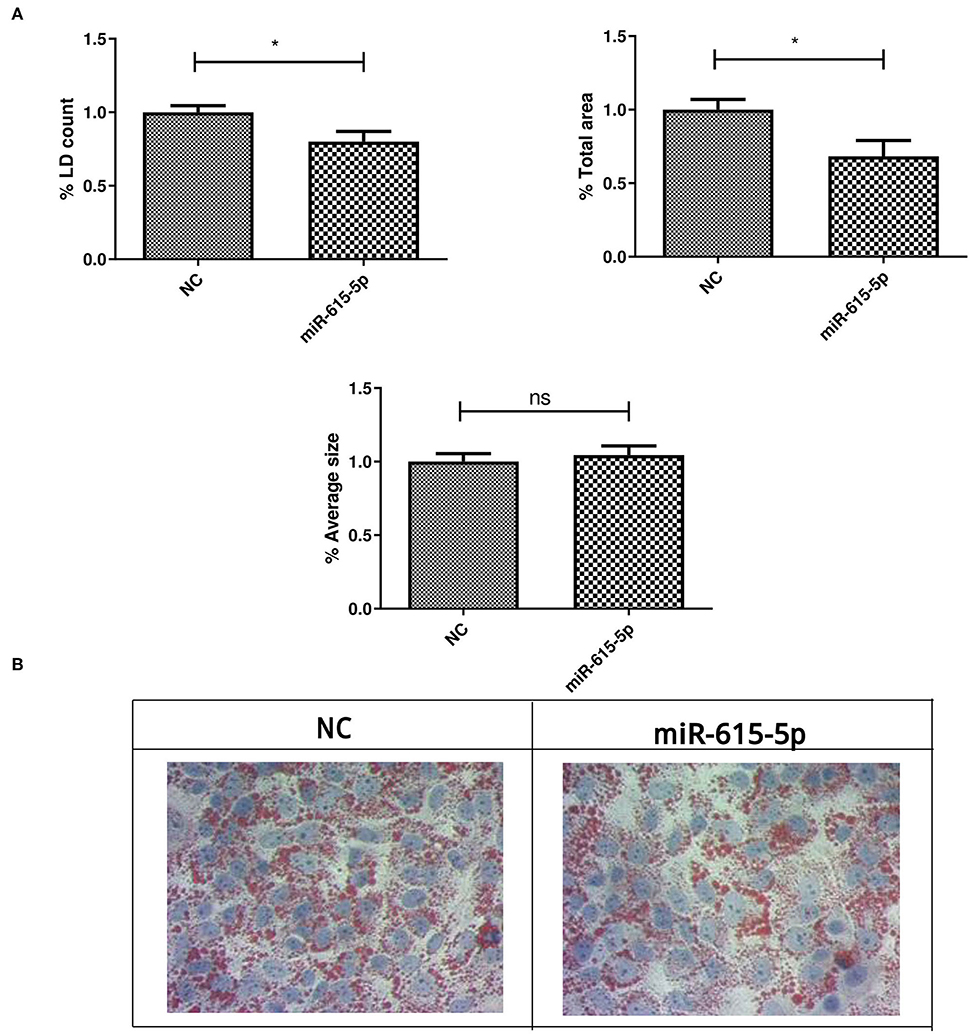
Figure 7. LD characterization after treating Huh-7 cells with an miR-615-5p mimic after OA treatment. LD characterization in Huh-7 cells treated with 800 μM OA after manipulation of miR-615-5p. (A) miR-615-5p showed a significant decrease in the %LD count (p = 0.0162) (left panel) and total area (p = 0.0158) (right panel); however, no significant change was detected on the average size of LD (p = 0.5848) (lower panel) compared to NC (n = 3, duplicate). (B) Representative figure from three independent experiments showing a decrease in the LD count upon miR-615-5p mimicking in Huh-7 cells treated with OA compared to NC. The unpaired two-tailed t-test was performed. *P < 0.05, and ns, statistically not significant.
Triglycerides were extracted and quantified from Huh-7 cells treated with 800 μM OA after transfection with miR-615-5p mimics or NC oligonucleotides. Cells mimicked with miR-615-5p showed decreased TG (p = 0.0108) compared to NC (n = 3) (Figure 8).
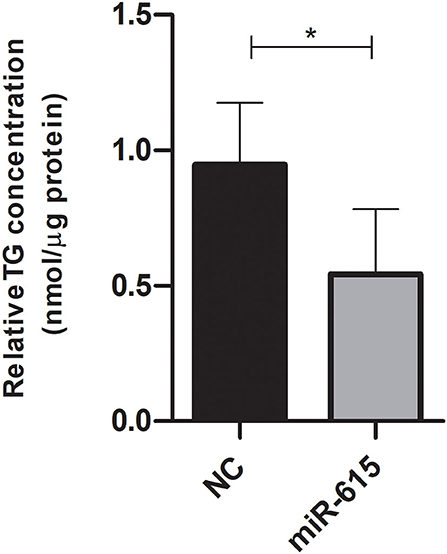
Figure 8. Triglyceride quantification after treatment with miR-615-5p mimics after OA treatment. Relative triglyceride quantification in Huh-7 cells treated with 800 μM OA after forcing the expression of either miR-615-5p or NC. miR-615-5p mimics showed a significant decrease in TG (p = 0.0108) compared to NC (n = 3). For each sample, the TG concentration was normalized to its respective protein level. The paired two-tailed t-test was performed. *P < 0.05, and ns, statistically not significant.
The Huh-7 cells were treated with 800 μM OA, and the next day, lncRNA H19 over-expression or empty vectors were transfected. Over-expression was first confirmed, and H19 was over-expressed with a mean 188-fold increase (p = 0.0024) (173.9 ± 48.04) compared to empty vector (1.018 ± 0.07986) (Figure 9A). The relative expression of mTOR and SREBP1c mRNA levels was determined in the Huh-7 cells treated with 800 μM OA, after H19 over-expression. Upon forcing the expression of H19, no significant change was observed in either mTOR (p = 0.8498) (1.020 ± 0.06345) or SREBP1c (p = 0.8405) (0.9917 ± 0.06840) relative mRNA expression compared to the empty vector (1.005 ± 0.04274) (1.011 ± 0.06120), respectively (n > 3, duplicate) (Figure 9B).
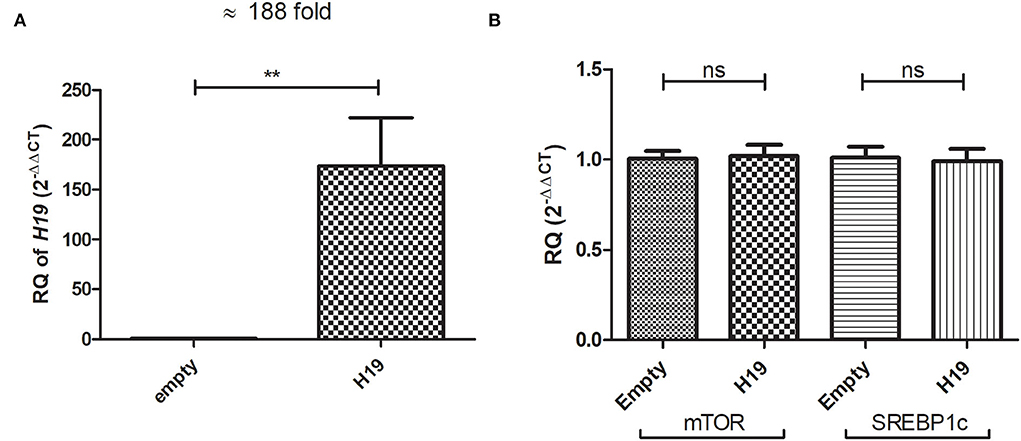
Figure 9. Impact of H19 on mTOR and SREBP1c in Huh-7 cells treated with 800 μM OA. The relative expression of H19 was determined in Huh-7 cells treated with 800 μM OA 48 h post-H19 over-expression. The H19 vector elevated its expression with a mean 188-fold increase (p = 0.0051) compared to cells transfected with the empty vector (A). Relative mRNA expression of mTOR (p = 0.8498) and SREBP1c (p = 0.8405) showed no significant difference between cells over-expressing H19 compared to the empty vector (n > 3, duplicate) (B). The unpaired two-tailed t-test was performed. **P < 0.01.
Inducing the expression of H19 in the Huh-7 cells treated with 800 μM OA resulted in a decrease in the mTOR protein level (p = 0.0379, 0.8042 ± 0.05646) compared to the empty vector (1.081 ± 0.1089) (n = 3) (Figures 10A,B). At the same time, H19 decreased SREBP1c protein levels (p = 0.0332, 0.6267 ± 0.1406) compared to the empty vector (1.000 ± 0.06994) (n > 3) (Figures 10C,D).
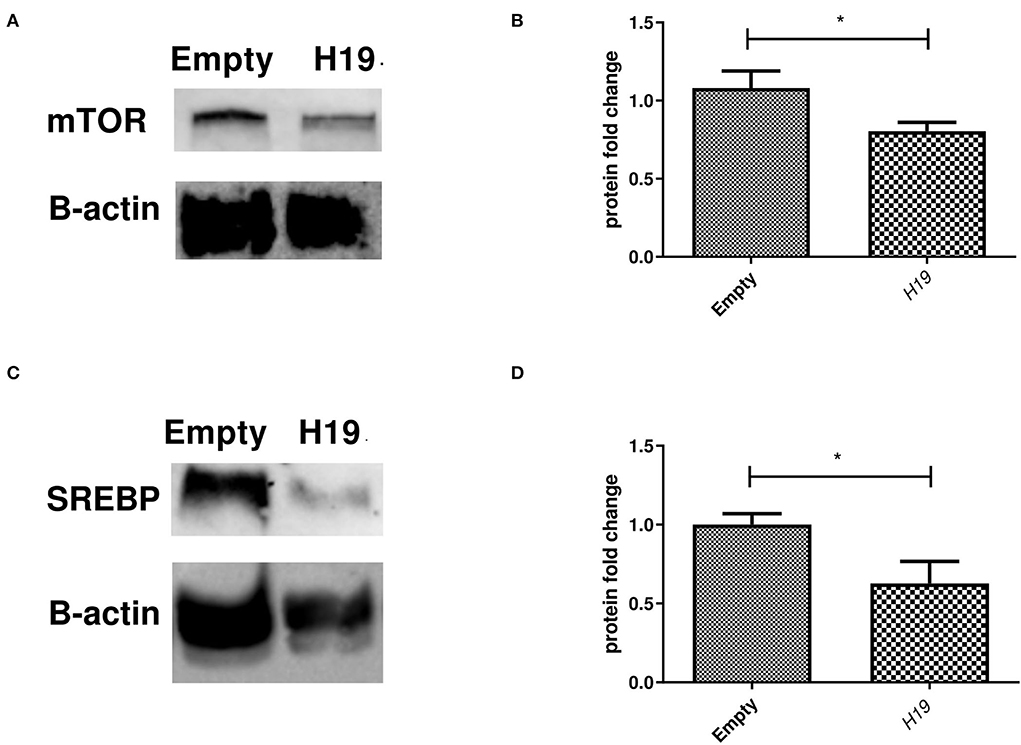
Figure 10. Impact of forcing the expression of H19 on mTOR and SREBP1 protein level. Impact of H19 on the mTOR/SREBP axis at the protein level. (A) Representative figure of mTOR blots showing a decrease in the mTOR protein level following H19 over-expression. (B) Relative quantification of mTOR protein levels in cells treated with the H19 over-expression vector compared to the empty vector (n = 3) (p = 0.0379). (C) Representative figure of SREBP1c blots showing reduced SREBP1c protein levels in cells treated with H19 compared to the empty vector. (D) Relative quantification of SREBP1c in cells over-expressing H19 compared to the empty vector (p = 0.0332) (n > 3). The unpaired two-tailed t-test was performed. *P < 0.05.
Lipid droplets were characterized in the Huh-7 cells treated with 800 μM OA, followed by transfection of the H19 over-expression vector or empty vector. H19 over-expression showed a significant decrease in the LD count (p = 0.0164) and total area (p = 0.0226) but had no significant effect on average size (p = 0.1536) compared to the empty vector (n > 3, duplicate) (Figures 11A,B).

Figure 11. LD characterization after treatment with H19 over-expression vector. LD characterization in Huh-7 cells treated with 800 μM OA after forcing the expression of H19. (A) H19 showed a significant decrease in the %LD count (p = 0.0164) (left panel) and total area (p = 0.0226) (right panel); however, no significant difference in average size was observed (p = 0.1536) (lower panel) compared to the empty vector (n > 3, duplicate). (B) Representative figure from three independent experiments showing the a decrease in the LD count upon H19 induction in Huh7 cells treated with OA compared to the empty vector. The unpaired two-tailed t-test was performed. *P < 0.05, and ns, statistically not significant.
Triglycerides were extracted and quantified from Huh-7 cells treated with 800 μM OA after transfection with H19 over-expression or empty vector. Cells over-expressing H19 showed decreased TG levels compared to cells transfected with the empty vector (p = 0.0012) (n = 3) (Figure 12).
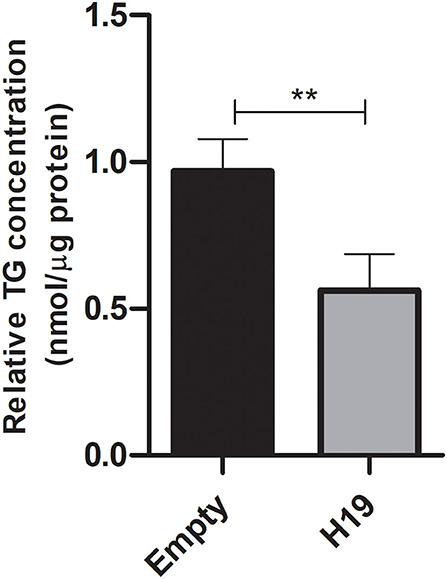
Figure 12. Triglyceride quantification after treatment with H19 over-expression vector. Triglyceride quantification in Huh-7 cells treated with 800 μM OA after forcing the expression of H19 over-expression or the empty vector. H19 over-expression showed a significant decrease in TG (p = 0.0012) compared to the empty vector (n = 3). For each sample, the TG concentration was normalized to its respective protein level. The paired two-tailed t-test was performed. **P < 0.01, and ns, statistically not significant.
NAFLD is characterized by the main hallmark of TG accumulation, which can be achieved by either increased TG influx into the liver or increased DNL and thus TG synthesis, or decreased export or hydrolysis of TG (27). Therapeutic approaches involving molecular targeting of critical events leading to NAFLD have been recently investigated. Such approaches include targeting pro-lipogenic enzymes and nuclear receptors related to impaired lipogenic signaling. This was supported by the finding that knocking down or knocking out of key enzymes needed for fatty acid (FA) synthesis in steatotic mice models showed reversal of metabolic defects associated with the condition (28, 29). Since FA synthesis is controlled by lipogenic transcription factors, our aim was to study the regulation of the main lipogenic transcription factor responsible for DNL, SREBP1c. We sought to achieve this by targeting its upstream regulator, mTOR, using both short and long ncRNAs, thus regulating TG accumulation and LD formation. This was of particular interest as LDs are increasingly showing roles in various other diseases in addition to steatosis, such as HCV infection and several cancers (30–32).
To induce LD formation, Huh-7 cells were treated with 800 μM OA, the concentration of fasting plasma-free FA of patients with NASH (23). To ensure that this concentration was not toxic to Huh-7 cells, viability was assessed using different concentrations of OA ranging from 250 to 1,000 μM. Up to 1,000 μM OA showed no sign of toxicity in Huh-7 cells at both 24 and 48 h (Figures 1A,B); on the contrary, increased viability was observed. This is in line with the study by Chafez-Tapia et al. who also showed the absence of cytotoxicity of palmitic/oleic acid 1:2 molar ratio up to 1,200 μM (33). It is also in agreement with the study by Park et al. (34) who showed increased proliferation of HepG2 cell lines upon OA treatment. Nevertheless, this opposes the finding of Giulitti et al. (35) who reported decreased proliferation of liver cancer cell lines upon OA treatment; however, this effect was not observed in healthy liver-derived human cell lines. This discrepancy regarding the effect of OA on cell viability and proliferation might be attributed to the different methods used to prepare OA, different OA doses used, or OA treatment for different time intervals. However, the viability experiment was mainly performed to exclude that the 800 μM OA preparation used in subsequent experiments is toxic. To validate that this OA concentration promotes LD formation, LDs were stained with oil red-O, where significantly increased oil red-O absorbance confirmed the success of LD induction (Figure 2). Accordingly, this treatment fulfills the following criteria: (1) it simulates fasting levels of free FAs in patients with NASH, (2) it is not toxic to the cells and (3) it induces LD formation.
Dietary fat was shown to upregulate SREBP (36). In addition, SREBP was found to be elevated in animal models with fatty liver and insulin resistance; moreover, despite insulin resistance in peripheral tissues, insulin was still able to activate SREBP in the liver, thus inducing downstream lipogenic enzymes (37, 38). Accordingly, we were highly interested in studying the regulation of SREBP1c (the main TF for DNL) through targeting its upstream regulator mTOR by short and long ncRNAs. mTOR can activate lipogenesis in energy-abundant fed states (13) as it promotes SREBP1c expression and maturation (14, 39); this can partially explain the selective insulin resistance underlying enhanced lipogenesis in obese mice (37, 40).
To regulate mTOR and thus SREBP1c, two ncRNAs, miR-615-5p and H19, were chosen. miR-615-5p was previously characterized by our group as a tumor suppressor and shown to target mTOR, but to our knowledge, this was never investigated before in fatty liver (18, 41). On the other hand, long ncRNA H19 was found to inhibit mTORC1 in pituitary tumors (20). The role of H19 in lipid metabolism is controversial. When PLIN2, a member of the lipid droplet protein family, was inhibited, this was associated with a 548-fold increase in H19 levels accompanied by decreased liver TGs, suggesting a role for H19 in steatosis (12). However, despite decreasing precursor SREBP1c protein levels, H19 was reported to stabilize nuclear SREBP1c, thus promoting lipid accumulation in high-fat or fasting state in vitro and in vivo studies (42). Despite the controversy, a role for H19 in lipid metabolism and mTORC1 regulation is apparent.
Accordingly, it was interesting to measure the baseline levels of these ncRNAs and the lipogenic transcription factors upon OA treatment. miR-615-5p was shown, for the first time, to be significantly upregulated after OA treatment (Figure 3A). On the other hand, H19 was downregulated (Figure 3B). This is in line with the finding of Khaoula et al. who showed a decreased expression of lncRNA H19 in an HepG2 steatotic model (43). However, our findings oppose the result of Liu et al. which reported an induction of H19 upon FA treatment. It is worth noting that the latter study used 200 μM OA treatment for only 16 hours. This might show how dose, as well as time of exposure, can affect the cell transcriptomic response and highlights the complexity of generating a fatty liver model (42). Nonetheless, the altered expression of both miR-615-5p and lncRNA H19 in OA-treated cells could lead to significant changes in their downstream target genes.
Interestingly, both mTOR and SREBP1c showed reduced mRNA expression upon OA treatment (Figure 4). The low level of SREBP1c is in line with the fact that polyunsaturated FAs can induce SREBP mRNA degradation (44). In addition, FAs were shown to antagonize the effect of agonists of LXR, an upstream inducer of SREBP1c (45, 46). Our findings are also in line with the study by van Deursen et al. who reported decreased SREBP2 activity by oleate (44, 47, 48). However, this contradicts another study by Rojas et al., although this discrepancy might be attributed to differences in cell lines used or OA preparation methods (49). In addition, in the context of our findings, the downregulation of both mTOR and SREBP might also be explained by the increased levels of miR-615-5p, which we found in OA-treated cells. Hence, the impact of miR-615-5p on these transcription factors was examined.
Forcing the expression of miR-615-5p caused a significant concomitant decrease in the mRNA levels of both mTOR and SREBP1c (Figure 5). This impact was also examined on the translational level, where both mTOR and SREBP1c protein levels were dramatically reduced by miR-615-5p (Figure 6). This is in agreement with our previous study that showed miR-615-5p decreased mTOR levels in Huh-7 cells (18). Since miR-615-5p showed a suppressive effect on the mTOR/SREBP axis, it was intriguing to investigate its subsequent impact on LDs. Indeed, miR-615-5p was able to decrease the LD count and total LD area without an impact on average LD size (Figure 7), showing, for the first time, a potential role for miR-615-5p in regulating LDs. Similarly, miR-615-5p reduced TG accumulation (Figure 8). Interestingly, its counterpart, miR-615-3p, has demonstrated a role in reversing lipotoxicity (50), which may suggest a function for the miR-615 duplex in alleviating fatty liver. Taken together, the anti-lipogenic activity of miR-615-5p, along with its ability to reduce both mTOR and SREBP1c, supports that co-regulation of these two transcription factors has a potential role in lowering lipogenesis. This was also proved by Wang et al. who showed that suppressing both mTOR and SREBP—as opposed to suppressing only SREBP—was more efficient in lowering LDs and lipogenesis in diabetic kidneys both in vivo and in vitro (51).
The effect of ncRNA H19 on regulating the mTOR/SREBP axis was also explored. No impact was found on either mTOR or SREBP1c mRNA levels upon inducing H19 expression (Figure 9). Liu et al. also showed that H19 had no effect on the SREBP1c mRNA level (42). Since lncRNAs can mediate their action translationally, rather than on the transcription level, the impact of forcing the expression of H19 on the protein levels of mTOR and SREBP1c was assessed. Indeed, H19 was able to reduce the protein levels of both mTOR and SREBP1c (Figure 10). This opposes the study by Liu et al. that reported increased stability of SREBP1 by H19 in cells treated with OA. Again, these discrepant findings may be due to the differences in experimental setups. The exact mechanism by which H19 regulates the TF on the protein, rather than the mRNA, level requires further elucidation.
Since H19 affected the protein levels of both mTOR and SREBP, it was interesting to determine its impact on LDs, especially since its role in lipid regulation has been controversial. In fact, H19 over-expression was able to reduce the LD count and total LD area with no effect on average LD size (Figure 11). As further confirmation, H19 over-expression reduced TG accumulation (Figure 12). This is in consensus with the study by Imai et al. who reported decreased TG levels in the presence of high H19 levels, as well as Gao et al. who showed that TG levels in muscle cells were decreased upon H19 induction (12, 52). However, Liu et al. reported increased LDs upon H19 transduction using AAV8 virus. This might be partially explained by the differences in the experimental design as H19 was first transduced in Huh-7 cells, then 72 h later, the cells were treated with 200 μM OA for 16 h (42). In this study, the cells were treated with 800 μM OA, transfected the next day with H19 over-expression plasmids, and then 48 h later, LDs and TG were characterized. Thus, the impact of H19 might be time-dependent or OA dose-dependent.
In light of these findings, miR-615-5p is shown for the first time as a novel regulator of the mTOR/SREBP axis on both the mRNA and protein levels, with an impact on LDs and TG accumulation. In addition, H19 exhibited a functional role on LDs and TG accumulation, which may be partially explained by its ability to reduce mTOR and SREBP protein levels, also suggesting a role of H19 in regulating the same axis. It is important to note that in vivo and in vitro models for NAFLD that recapitulate the exact NAFLD metabolic hallmarks are still hard to achieve to date (53–55). However, our findings can be considered as first steps in regulating LD formation through ncRNAs, which remains to be further confirmed in different NAFLD models. In addition, it would be of great interest to study genes downstream to SREBP1 to further elucidate and validate the role of miR-615 or lncRNA H19 in LD and TG regulation. Our findings are especially interesting after the success of the ARO-HSD clinical trial. ARO-HSD is the first RNA interfering (RNAi) therapeutic agent that knocks down hydroxysteroid 17-beta dehydrogenase 13 (HSD17B13) mRNA and protein levels and protects patients with NASH with acceptable tolerability (56). Accordingly, regulation of the mTOR/SREBP1c axis with ncRNAs provides a promising NASH therapeutic approach.
The original contributions presented in the study are included in the article/supplementary material, further inquiries can be directed to the corresponding author/s.
AA conceived and supervised the study. SE and NA performed the experiments. NE-E, IF, and NE co-supervised the work process. NE provided new tools and reagents. SE, NE-E, IF, and AA analyzed the data. SE wrote the manuscript. AA made the manuscript revisions. All authors contributed to the article and approved the submitted version.
Part of this study is based upon work supported by the Egyptian Science, Technology and Innovation Funding Authority, under Young Researcher Grant (YRG-43240).
We would like to thank Prof. Alexandra Kiemer for providing us with the H19 over-expression vector and acknowledge Zewail City of Science and Technology and thank Prof. Dr. Nagwa El-Badri for providing Western blot tools.
The authors declare that the research was conducted in the absence of any commercial or financial relationships that could be construed as a potential conflict of interest.
All claims expressed in this article are solely those of the authors and do not necessarily represent those of their affiliated organizations, or those of the publisher, the editors and the reviewers. Any product that may be evaluated in this article, or claim that may be made by its manufacturer, is not guaranteed or endorsed by the publisher.
1. Alves-Bezerra M, Cohen DE. Triglyceride Metabolism in the Liver. Compr Physiol. (2017) 8:1–22. doi: 10.1002/cphy.c170012
2. Moon YA. The SCAP/SREBP Pathway: A Mediator of Hepatic Steatosis. Endocrinol Metab (Seoul, Korea). (2017) 32:6–10. doi: 10.3803/EnM.2017.32.1.6
3. Lambert JE, Ramos-Roman MA, Browning JD, Parks EJ. Increased de novo lipogenesis is a distinct characteristic of individuals with nonalcoholic fatty liver disease. Gastroenterology. (2014) 146:726–35. doi: 10.1053/j.gastro.2013.11.049
4. Mattick JS. Non-coding RNAs: the architects of eukaryotic complexity. EMBO Rep. (2001) 2:986–91 doi: 10.1093/embo-reports/kve230
5. Kim V. MicroRNA biogenesis: coordinated cropping and dicing. Nat Rev Mol Cell Biol. (2005) 6:376–85 doi: 10.1038/nrm1644
6. Gao L-L, Li M, Wang Q, Liu SA, Zhang JQ, Cheng J. HCBP6 modulates triglyceride homeostasis in hepatocytes via the SREBP1c/FASN pathway. J Cell Biochem. (2015) 116:2375–84. doi: 10.1002/jcb.25188
7. Rayner KJ, Esau CC, Hussain FN, McDaniel AL, Marshall SM, van Gils JM, et al. Inhibition of miR-33a/b in non-human primates raises plasma HDL and lowers VLDL triglycerides. Nature. (2011) 478:404–7. doi: 10.1038/nature10486
8. Mahdy MM, El-Ekiaby NM, Hashish RM, Salah RA, Hanafi RS, Azzazy HMES, et al. miR-29a promotes lipid droplet and triglyceride formation in HCV infection by inducing expression of SREBP-1c and CAV1. J Clin Transl Hepatol. (2016) 4:293–9. doi: 10.14218/JCTH.2016.00046
9. Fernandes J, Acuña S, Aoki J, Floeter-Winter L, Muxel S, Fernandes JCR, et al. Long non-coding RNAs in the regulation of gene expression: physiology and disease. Non-Coding RNA. (2019) 5:17. doi: 10.3390/ncrna5010017
10. Yan C, Chen J, Chen N. Long noncoding RNA MALAT1 promotes hepatic steatosis and insulin resistance by increasing nuclear SREBP-1c protein stability. Sci Rep. (2016) 6:22640. doi: 10.1038/srep22640
11. Li D, Cheng M, Niu Y, Chi X, Liu X, Fan J, et al. Identification of a novel human long non-coding RNA that regulates hepatic lipid metabolism by inhibiting SREBP-1c. Int J Biol Sci. (2017) 13:349–57. doi: 10.7150/ijbs.16635
12. Imai Y, Boyle S, Varela GM, Caron E, Yin X, Dhir R, et al. Effects of perilipin 2 antisense oligonucleotide treatment on hepatic lipid metabolism and gene expression. Physiol Genomics. (2012) 44:1125–31. doi: 10.1152/physiolgenomics.00045.2012
13. Bakan I, Laplante M. Connecting mTORC1 signaling to SREBP-1 activation. Curr Opin Lipidol. (2012) 23:226–34. doi: 10.1097/MOL.0b013e328352dd03
14. Peterson TR, Sengupta SS, Harris TE, Carmack AE, Kang SA, Balderas E, et al. mTOR complex 1 regulates lipin 1 localization to control the SREBP pathway. Cell. (2011) 146:408–20. doi: 10.1016/j.cell.2011.06.034
15. Yecies JL, Zhang HH, Menon S, Liu S, Yecies D, Lipovsky AI, et al. Akt stimulates hepatic SREBP1c and lipogenesis through parallel mTORC1-dependent and independent pathways. Cell Metab. (2011) 14:21–32. doi: 10.1016/j.cmet.2011.06.002
16. Han J, Zhang L, Guo H, Wysham WZ, Roque DR, Willson AK, et al. Glucose promotes cell proliferation, glucose uptake and invasion in endometrial cancer cells via AMPK/mTOR/S6 and MAPK signaling. Gynecol Oncol. (2015) 138:668–75. doi: 10.1016/j.ygyno.2015.06.036
17. Caron A, Richard D, Laplante M. The roles of mTOR complexes in lipid metabolism. Annu Rev Nutr. (2015) 35:321–48. doi: 10.1146/annurev-nutr-071714-034355
18. Rahmoon MA, Youness RA, Gomaa AI, Hamza MT, Waked I, El Tayebi HM, et al. MiR-615-5p depresses natural killer cells cytotoxicity through repressing IGF-1R in hepatocellular carcinoma patients. Growth Factors. (2017) 35:76–87. doi: 10.1080/08977194.2017.1354859
19. Wu M, Kong C, Cai M, Huang W, Chen Y, Wang B, et al. Hsa_circRNA_002144 promotes growth and metastasis of colorectal cancer through regulating miR-615-5p/LARP1/mTOR pathway. Carcinogenesis. (2021) 42:601–10 doi: 10.1093/carcin/bgaa140
20. Wu Z, Yan L, Liu YT, Cao L, Guo YH, Zhang Y, et al. Inhibition of mTORC1 by lncRNA H19 via disrupting 4E-BP1/Raptor interaction in pituitary tumours. Nat Commun. (2018) 9:4624. doi: 10.1038/s41467-018-06853-3
21. He Y, Yin X, Yan J, Li X, Sun Q. The lncRNA H19/miR-766-3p/S1PR3 axis contributes to the hyperproliferation of keratinocytes and skin inflammation in psoriasis via the AKT/mTOR pathway. Mediators Inflamm. (2021) 2021:9991175 doi: 10.1155/2021/9991175
22. Huang T-J, Ren J-J, Zhang Q-Q, Kong Y-Y, Zhang H-Y, Guo X-H, et al. IGFBPrP1 accelerates autophagy and activation of hepatic stellate cells via mutual regulation between H19 and PI3K/AKT/mTOR pathway. Biomed Pharmacother. (2019) 116:109034 doi: 10.1016/j.biopha.2019.109034
23. Nehra V, Angulo P, Buchman AL, Lindor KD. Nutritional and metabolic considerations in the etiology of nonalcoholic steatohepatitis. Dig Dis Sci. (2001) 46:2347–52. doi: 10.1023/A:1012338828418
24. Kopec AM, Rivera PD, Lacagnina MJ, Hanamsagar R, Bilbo SD. Optimized solubilization of TRIzol-precipitated protein permits Western blotting analysis to maximize data available from brain tissue. J Neurosci Methods. (2017) 280:64–76. doi: 10.1016/j.jneumeth.2017.02.002
25. Folch J, Lees M, Sloane Stanley GH, A. simple method for the isolation and purification of total lipides from animal tissues. J Biol Chem. (1957) 226:497–509. doi: 10.1016/S0021-9258(18)64849-5
26. Ulmer C, Yost R, Chen J, Mathews C, Garrett T. Liquid chromatography-mass spectrometry metabolic and lipidomic sample preparation workflow for suspension-cultured mammalian cells using Jurkat T lymphocyte cells. J Proteomics Bioinform. (2015) 8:126–32. doi: 10.4172/jpb.1000360
27. Lewis GF, Carpentier A, Adeli K, Giacca A. Disordered fat storage and mobilization in the pathogenesis of insulin resistance and type 2 diabetes. Endocr Rev. (2002) 23:201–29. doi: 10.1210/edrv.23.2.0461
28. Repa JJ, Liang G, Ou J, Bashmakov Y, Lobaccaro JM, Shimomura I, et al. Regulation of mouse sterol regulatory element-binding protein-1c gene (SREBP-1c) by oxysterol receptors, LXRalpha and LXRbeta. Genes Dev. (2000) 14:2819–30. doi: 10.1101/gad.844900
29. Fiorucci S, Rizzo G, Donini A, Distrutti E, Santucci L. Targeting farnesoid X receptor for liver and metabolic disorders. Trends Mol Med. (2007) 13:298–309. doi: 10.1016/j.molmed.2007.06.001
30. Tirinato L, Liberale C, Di Franco S, Candeloro P, Benfante A, La Rocca R, et al. Lipid droplets: a new player in colorectal cancer stem cells unveiled by spectroscopic imaging. Stem Cells. 2015:35–44 doi: 10.1002/stem.1837
31. Miyanari Y, Atsuzawa K, Usuda N, Watashi K, Hishiki T, Zayas M, et al. The lipid droplet is an important organelle for hepatitis C virus production. Nat Cell Biol. (2007) 9:1089–97. doi: 10.1038/ncb1631
32. Santos CR, Schulze A. Lipid metabolism in cancer. FEBS J. (2012) 279:2610–23. doi: 10.1111/j.1742-4658.2012.08644.x
33. Chavez-Tapia NC, Rosso N, Tiribelli C. Effect of intracellular lipid accumulation in a new model of non-alcoholic fatty liver disease. BMC Gastroenterol. (2012) 12:20. doi: 10.1186/1471-230X-12-20
34. Park S, Park J-H, Jung H-J, Jang J-H, Ahn S, Kim Y, et al. A secretome profile indicative of oleate-induced proliferation of HepG2 hepatocellular carcinoma cells. Exp Mol Med. (2018) 50:1–14 doi: 10.1038/s12276-018-0120-3
35. Giulitti F, Petrungaro S, Mandatori S, Tomaipitinca L, de Franchis V, D'Amore A, et al. Anti-tumor effect of oleic acid in hepatocellular carcinoma cell lines via autophagy reduction. Front cell Dev Biol. (2021) 9:629182 doi: 10.3389/fcell.2021.629182
36. Lin J, Yang R, Tarr PT, Wu P-H, Handschin C, Li S, et al. Hyperlipidemic effects of dietary saturated fats mediated through PGC-1β coactivation of SREBP. Cell. (2005) 120:261–73. doi: 10.1016/j.cell.2004.11.043
37. Shimomura I, Bashmakov Y, Ikemoto S, Horton JD, Brown MS, Goldstein JL. Insulin selectively increases SREBP-1c mRNA in the livers of rats with streptozotocin-induced diabetes. Proc Natl Acad Sci. (1999) 96:13656–61. doi: 10.1073/pnas.96.24.13656
38. Matsuda M, Korn BS, Hammer RE, Moon YA, Komuro R, Horton JD, et al. SREBP cleavage-activating protein (SCAP) is required for increased lipid synthesis in liver induced by cholesterol deprivation and insulin elevation. Genes Dev. (2001) 15:1206–16. doi: 10.1101/gad.891301
39. Porstmann T, Santos CR, Griffiths B, Cully M, Wu M, Leevers S, et al. SREBP activity is regulated by mTORC1 and contributes to Akt-dependent cell growth. Cell Metab. (2008) 8:224. doi: 10.1016/j.cmet.2008.07.007
40. Shimomura I, Matsuda M, Hammer RE, Bashmakov Y, Brown MS, Goldstein JL. Decreased IRS-2 and increased SREBP-1c lead to mixed insulin resistance and sensitivity in livers of lipodystrophic and ob/ob mice. Mol Cell. (2000) 6:77–86. doi: 10.1016/S1097-2765(05)00010-9
41. El Tayebi HM, Hosny KA, Esmat G, Breuhahn K, Abdelaziz AI. miR-615-5p is restrictedly expressed in cirrhotic and cancerous liver tissues and its overexpression alleviates the tumorigenic effects in hepatocellular carcinoma. FEBS Lett. (2012) 586:3309–16. doi: 10.1016/j.febslet.2012.06.054
42. Liu C, Yang Z, Wu J, Zhang L, Lee S, Shin D-J, et al. Long noncoding RNA H19 interacts with polypyrimidine tract-binding protein 1 to reprogram hepatic lipid homeostasis. Hepatology. (2018) 67:1768–83. doi: 10.1002/hep.29654
43. Errafii K, Al-Akl NS, Khalifa O, Arredouani A. Comprehensive analysis of LncRNAs expression profiles in an in vitro model of steatosis treated with Exendin-4. J Transl Med. (2021) 19:235. doi: 10.1186/s12967-021-02885-4
44. Ou J, Tu H, Shan B, Luk A, DeBose-Boyd RA, Bashmakov Y, et al. Unsaturated fatty acids inhibit transcription of the sterol regulatory element-binding protein-1c (SREBP-1c) gene by antagonizing ligand-dependent activation of the LXR. Proc Natl Acad Sci USA. (2001) 98:6027–32. doi: 10.1073/pnas.111138698
45. Xu J, Teran-Garcia M, Park JH, Nakamura MT, Clarke SD. Polyunsaturated fatty acids suppress hepatic sterol regulatory element-binding protein-1 expression by accelerating transcript decay. J Biol Chem. (2001) 276:9800–7. doi: 10.1074/jbc.M008973200
46. Schlaepfer IR, Hitz CA, Gijón MA, Bergman BC, Eckel RH, Jacobsen BM. Progestin modulates the lipid profile and sensitivity of breast cancer cells to docetaxel. Mol Cell Endocrinol. (2012) 363:111–21. doi: 10.1016/j.mce.2012.08.005
47. van Deursen D, van Leeuwen M, Akdogan D, Adams H, Jansen H, Verhoeven AJM. Activation of hepatic lipase expression by oleic acid: possible involvement of USF1. Nutrients. (2009) 1:133–47 doi: 10.3390/nu1020133
48. Yoshikawa T, Shimano H, Yahagi N, Ide T, Amemiya-Kudo M, Matsuzaka T, et al. Polyunsaturated fatty acids suppress sterol regulatory element-binding protein 1c promoter activity by inhibition of liver X receptor (LXR) binding to LXR response elements. J Biol Chem. (2002) 277:1705–11 doi: 10.1074/jbc.M105711200
49. Rojas Á, Gallego P, Gil-Gómez A, Muñoz-Hernández R, Rojas L, Maldonado R, et al. Natural extracts abolished lipid accumulation in cells harbouring non-favourable PNPLA3 genotype. Ann Hepatol. (2018) 17:242–9 doi: 10.5604/01.3001.0010.8642
50. Miyamoto Y, Mauer AS, Kumar S, Mott JL, Malhi H. Mmu-miR-615-3p regulates lipoapoptosis by inhibiting C/EBP homologous protein. PLoS ONE. (2014) 9:e109637. doi: 10.1371/journal.pone.0109637
51. Wang H, Zhu L, Hao J, Duan H, Liu S, Zhao S, et al. Co-regulation of SREBP-1 and mTOR ameliorates lipid accumulation in kidney of diabetic mice. Exp Cell Res. (2015) 336:76–84. doi: 10.1016/j.yexcr.2015.06.006
52. Gao Y, Wu F, Zhou J, Yan L, Jurczak MJ, Lee H-Y, et al. The H19/let-7 double-negative feedback loop contributes to glucose metabolism in muscle cells. Nucleic Acids Res. (2014) 42:13799–811. doi: 10.1093/nar/gku1160
53. Müller FA, Sturla SJ. Human in vitro models of nonalcoholic fatty liver disease. Curr Opin Toxicol. (2019) 16:9–16. doi: 10.1016/j.cotox.2019.03.001
54. Gunn PJ, Green CJ, Pramfalk C, Hodson L. In vitro cellular models of human hepatic fatty acid metabolism: differences between Huh7 and HepG2 cell lines in human and fetal bovine culturing serum. Physiol Rep. (2017) 5:e13532. doi: 10.14814/phy2.13532
55. Korínková L, PraŽienková V, Cerná L, Karnošová A, Železná B, Kuneš J, et al. Pathophysiology of NAFLD and NASH in Experimental Models: The Role of Food Intake Regulating Peptides. Front Endocrinol (Lausanne). (2020) 11:597583 doi: 10.3389/fendo.2020.597583
56. Gane E, Schwabe C, Yoon KT, Heo J, Scott R, Lee J, et al. A Phase 1/2a Single and multiple dose-escalating study to evaluate the safety, tolerability, pharmacokinetics and pharmacodynamic effects of ARO-HSD in normal healthy volunteers as well as in patients with NASH or suspected NASH - AdisInsight. J Hepatol y. (2021) 75:S294–803.
Keywords: SREBP1c, mTOR, ncRNAs, NAFLD, de novo lipogenesis (DNL)
Citation: El Sobky SA, Aboud NK, El Assaly NM, Fawzy IO, El-Ekiaby N and Abdelaziz AI (2022) Regulation of lipid droplet (LD) formation in hepatocytes via regulation of SREBP1c by non-coding RNAs. Front. Med. 9:903856. doi: 10.3389/fmed.2022.903856
Received: 24 March 2022; Accepted: 25 August 2022;
Published: 20 September 2022.
Edited by:
Reda Elwakil, Ain Shams University, EgyptReviewed by:
Yasser Fouad, Minia University, EgyptCopyright © 2022 El Sobky, Aboud, El Assaly, Fawzy, El-Ekiaby and Abdelaziz. This is an open-access article distributed under the terms of the Creative Commons Attribution License (CC BY). The use, distribution or reproduction in other forums is permitted, provided the original author(s) and the copyright owner(s) are credited and that the original publication in this journal is cited, in accordance with accepted academic practice. No use, distribution or reproduction is permitted which does not comply with these terms.
*Correspondence: Ahmed I. Abdelaziz, aihab@ngu.edu.eg
Disclaimer: All claims expressed in this article are solely those of the authors and do not necessarily represent those of their affiliated organizations, or those of the publisher, the editors and the reviewers. Any product that may be evaluated in this article or claim that may be made by its manufacturer is not guaranteed or endorsed by the publisher.
Research integrity at Frontiers
Learn more about the work of our research integrity team to safeguard the quality of each article we publish.