 Naila A. Shaheen1,2,3
 Hina Rehan1,2,4,5Areej Moghairi1,2,5,6Giamal Gmati1,2,4,5,7Moussab Damlaj1,2,4,5,7Hind Salama1,2,4,5,7Mushtaq Rather1,2,4,5May Anne Mendoza1,2,5
 Abeer Alanazi1,2,5Bader Al Ahmari1,2,4,5,7Mohsen Al Zahrani1,2,4,5,7
 Ayman Al-Hejazi1,2,4,5,7
 Ahmed S. Alaskar1,2,4,5,7*
- 1King Saud bin Abdulaziz University for Health Sciences, Riyadh, Saudi Arabia
- 2Ministry of the National Guard–Health Affairs, Riyadh, Saudi Arabia
- 3Department of Biostatistics and Bioinformatics, King Abdullah International Medical Research Center, Riyadh, Saudi Arabia
- 4Divisions of Adult Hematology and SCT, King Abdulaziz Medical City, Riyadh, Saudi Arabia
- 5King Abdullah International Medical Research Center, Riyadh, Saudi Arabia
- 6Department of Pathology and Laboratory Medicine, King Abdulaziz Medical City, Ministry of the National Guard–Health Affairs, Riyadh, Saudi Arabia
- 7Saudi Society of Blood and Marrow Transplant, Riyadh, Saudi Arabia
Introduction: Hematological parameters are critical in disease diagnosis, management, and monitoring; however, complete blood count (CBC) reference intervals vary across populations. The aim of the current study was to provide the reference ranges of hematological parameters/indices in the healthy adult Saudi population.
Methods: A multicenter retrospective cross-sectional study was conducted with a sample of employees who were screened pre-employment from January 2015 to December 2019, at tertiary care hospitals in three regions. Demographic and CBC data were extracted from the electronic health system. The 2.5th and 97.5th percentiles were used to determine the reference intervals.
Results: Of a total of 1,388 participants, 53.82% were male. The majority 96% was less than 40 years old, and 85% were from the Central region. Gender-related differences were observed for the RBC count, Hb, HCT, MCV, MCH, MCHC, and the platelet count. Age-related differences were observed for the RBC, Hb, HCT, and eosinophils. The WBC parameters did not differ by gender or age categories. Region-related differences were observed for the RBC, hemoglobin, HCT, MCV, WBC, and basophils. The platelet count was higher in the female group, the age group 40 years and above, and in the Western region. The prevalence of anemia was high in the female group and the Eastern region. The overall neutropenia rate was 12.8%.
Conclusion: The data from this study provide hematological parameter reference ranges for the adult Saudi population by gender, age, and region. Gender and age-related differences were observed for the hematological parameters. Anemia was more frequent in the female group and the Eastern region. Caution must be taken when comparing or interpreting results from different age groups, gender, region of origin, and ethnicity.
Introduction
The complete blood count (CBC) is a widely used laboratory test to assess an individual's health and disease status (1). However, several factors can affect the hematological parameters, such as age, gender, ethnicity, lifestyle, environment, and the analytical method of testing. A wide variation has been reported in the hematological parameters of different populations (2, 3). A low normal range has been reported for the hematocrit (HCT), hemoglobin (Hb), and mean platelet volume in the Asian population compared to Caucasian populations (4). Low platelets, white blood cells (WBC), red blood cells (RBCs), and Hb have been reported in South Indian compared to European populations (5). Technical labels of hematological parameters as normal range are not applicable due to the variation in populations. Consequently, normal values or normal range has been replaced by reference values or reference intervals (6). Laboratory Reference Intervals (RIs) are fundamental for disease diagnosis, prognosis, management, or following up the treatment response (7).
The RI values of a laboratory parameter are characterized as 95 ± 2.5% lower and upper limits (between 2.5 and 97.5 percentiles of the result distribution) in a healthy population (8). Laboratories have a best practice of establishing a RI, based on the variables involved. The results are interpreted relative to the normal range of the values of a particular laboratory (9). The Clinical and Laboratory Standards Institute (CLSI) recommends the establishment of RIs for every laboratory (9).
Most of the literature is based on the RIs established in Western populations (10–12). Recent studies reported RIs in the Middle East region (3, 7, 13, 14). A few studies from Saudi Arabia were not comprehensive enough due to a small sample size (15), targeted children and adolescents (16), or focused on one region (17). This study aimed to provide hematological parameter ranges for the adult Saudi population from three regions, and to estimate the prevalence of blood count abnormalities.
Methods
A multicenter retrospective cross-sectional study was conducted with a sample of adult Saudi employees who were screened during the recruitment process from January 2015 to December 2019, at tertiary care hospitals in three regions (Central, Eastern, and Western). All adult Saudi employees, both male and female, 55 years and younger were included. A positive hepatitis B surface antigen (HBsAg), hepatitis C antibody (anti-HCV), or human immunodeficiency virus antibody (anti-HIV) was an exclusion criterion. The study was approved by the Institutional Review Board, number RC18/094/R. This study was conducted in accordance with the Declaration of Helsinki.
The data were extracted from the electronic health system. The data included age, gender, region, and CBC parameters, such as red blood cells (RBC) count, Hb, HCT, mean corpuscular volume (MCV), mean corpuscular hemoglobin (MCH), mean corpuscular hemoglobin concentration (MCHC), red blood cell distribution width (RDW), white blood cells count (WBC), neutrophils, eosinophils, basophils, lymphocytes, monocytes, and platelets. The initial sample size was 1,438 participants, but 50 records were excluded due to duplicates (n = 43), and an age above 55 years (n = 7), resulting in a total sample of 1,388.
Blood sample analysis
Approximately 5.0 ml peripheral venous blood was collected with standard 5 ml K3-EDTA (BD Vacutainer® tubes from Becton, Dickinson, United Kingdom). The blood specimens were processed at the central laboratory of the hospital in each region within 6–8 h of collection. The CBC parameters were measured using ADVIA2120i (Siemens Healthcare Diagnostics, Deerfield, IL, USA) and Cell-Dyn Sapphire (Abbott Laboratories, IL, USA), such as Hb, RBC count, HCT, MCV, MCH, MCHC, RDW, WBC count, WBC differential count (neutrophils, eosinophils, basophils, lymphocytes, and monocytes), and the platelet counts.
Statistical analysis
The study cohort was divided in three age groups (18–29, 30–39, and ≥ 40 years) for both genders. The effect of gender, age category, and region on the hematological parameters was examined. All the hematological parameters were summarized as mean, and 95% confidence intervals (CI). The 95th percentile (2.5 and 97.5 percentiles) with the 95% CI was used to determine the reference intervals by gender, age group, and region. The CBC parameters did not follow the Gaussian distribution and the Wilcoxon two-sample test was used to compare the hematological RIs by gender. Kruskal–Wallis test was used to compare the hematological RIs by region and age group.
Blood count abnormalities were defined based on the study hospital's reference intervals: leukopenia if the WBC count was less than 4 (reference range 4.0–11.0 × 10⁹/L), neutropenia if the neutrophil count was <2 (reference range 2.0–7.5 × 10⁹/L), anemia if the Hb was less than 120 (reference range 120–160 g/L), polycythemia (erythrocytosis) if the RBC count was ≥ 5.41 (reference range 4.0–5.40 × 10¹²/L), thrombocytosis if the platelet count was ≥ 401 (reference range 150–400), and thrombocytopenia if the platelet count was <150 (reference range 150–400 × 1012/L).
The prevalence of blood count abnormalities was calculated by dividing the frequency of blood count abnormalities by the sample size. The denominator was adjusted by gender and region. The results are reported as % and 95% CI. The proportion of blood count abnormalities was compared with a chi-square or Fisher exact test.
All statistical analyses were performed with SAS version 9.4 (SAS Institute Inc., Cary, NC, USA). A p < 0.05 was considered statistically significant. The hematological parameters reference intervals were compared with the results reported from different populations within the region and the region as a whole (Table 6) (*the Hb was compared in g/dl to enable consistent reporting for all the studies).
Results
Of 1,388 participants, 747 (53.82%) were male. The majority (96%, n = 1,328) was <40 years (30.61 ± 4.07), and from the Central region (85%, n = 1,182) (Supplemental Table 1). The CBC parameters are summarized in Supplemental Table 2 or Figure 1. The CBC reference intervals by gender, age category, and region are summarized in Tables 1–3.
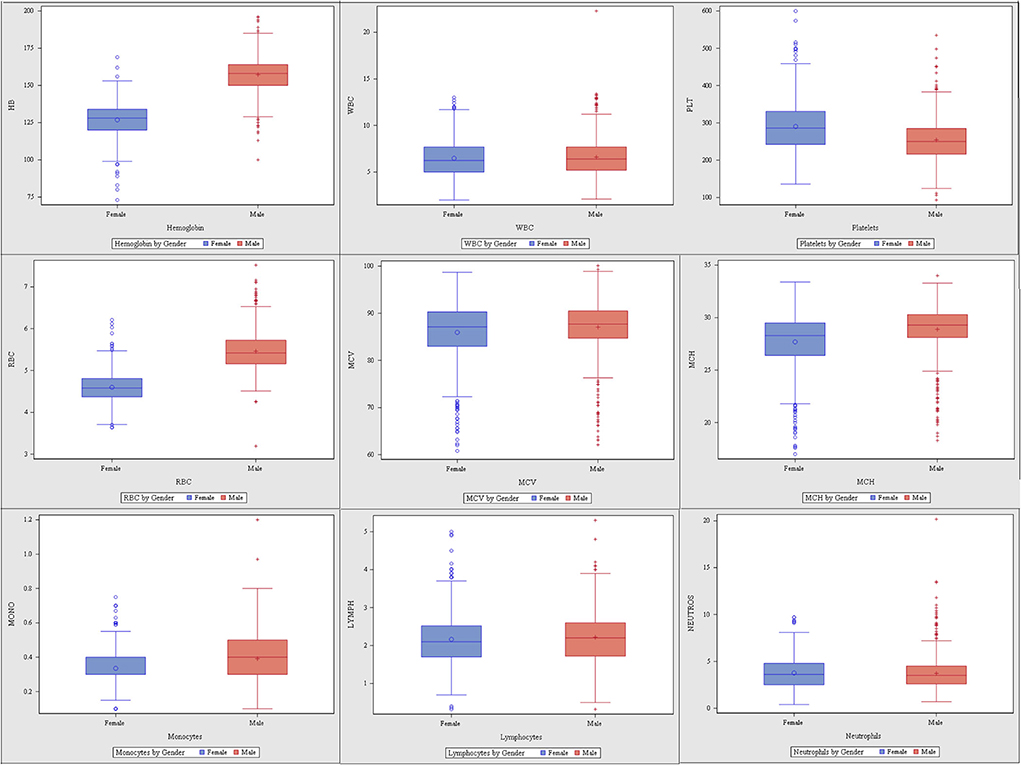
Figure 1. Complete blood count (CBC) parameters ranges of the study cohort by gender.
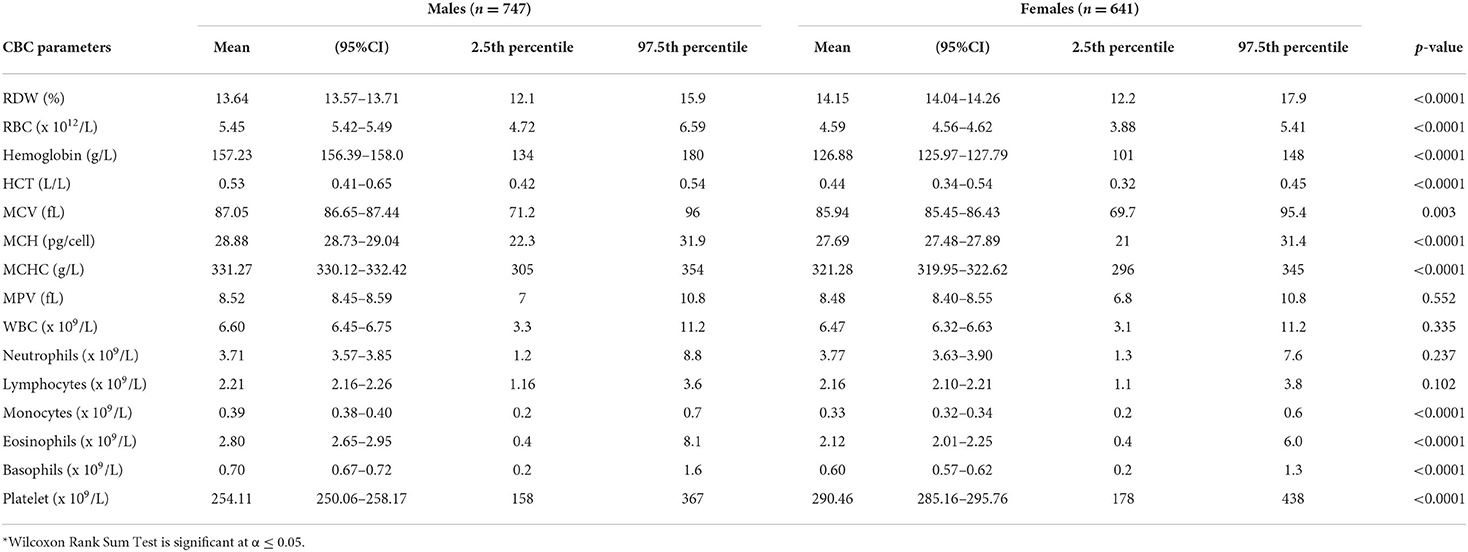
Table 1. Complete blood count (CBC) reference intervals of the study cohort by gender.
RBC parameters
Gender-related differences were observed for the RBC count, Hb, HCT, MCV, MCH, and MCHC. The red blood cells in the male group averaged 5.4 (× 1012/L), higher than the female group 4.5 (× 1012/L). The Hb values in the men averaged 14.9 g/L, higher than the female 12.6 g/L. The MCV and MCHC in men were higher with an average of 87.05 vs. 85.94 fL, compared with 331.27 vs. 321.28 g/L in women. The mean MCH value in men was 28.9 pg/cell and in women 27.69 pg/cell. The average male-related RDW was 13.64 %, compared with 14.15% in the female group (Table 1). The RBC parameters for the age categories (18–29 years, 30–39 years, 40 years, and above) are summarized in Table 2. The RBC, Hb, and HCT were higher in the 30–39 years age group. Region-related differences were observed for the RBC count, Hb, HCT, MCV, and MPV. The RBC count, Hb, and MCV were higher in the Central region, and the HCT in the Western region. The MPV was higher in the Eastern region (Table 3).
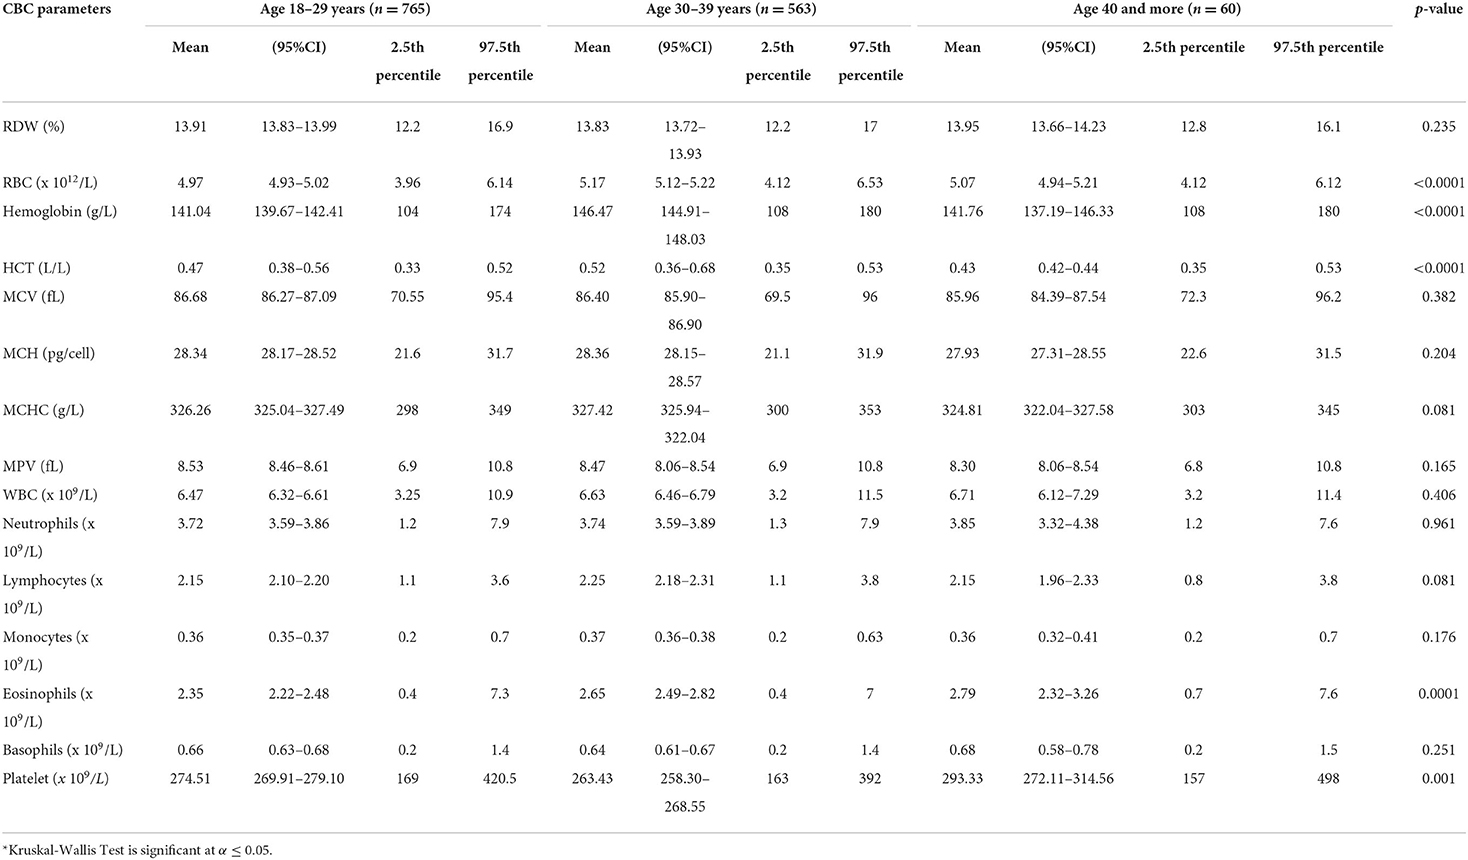
Table 2. The CBC reference intervals of the study cohort by age categories.
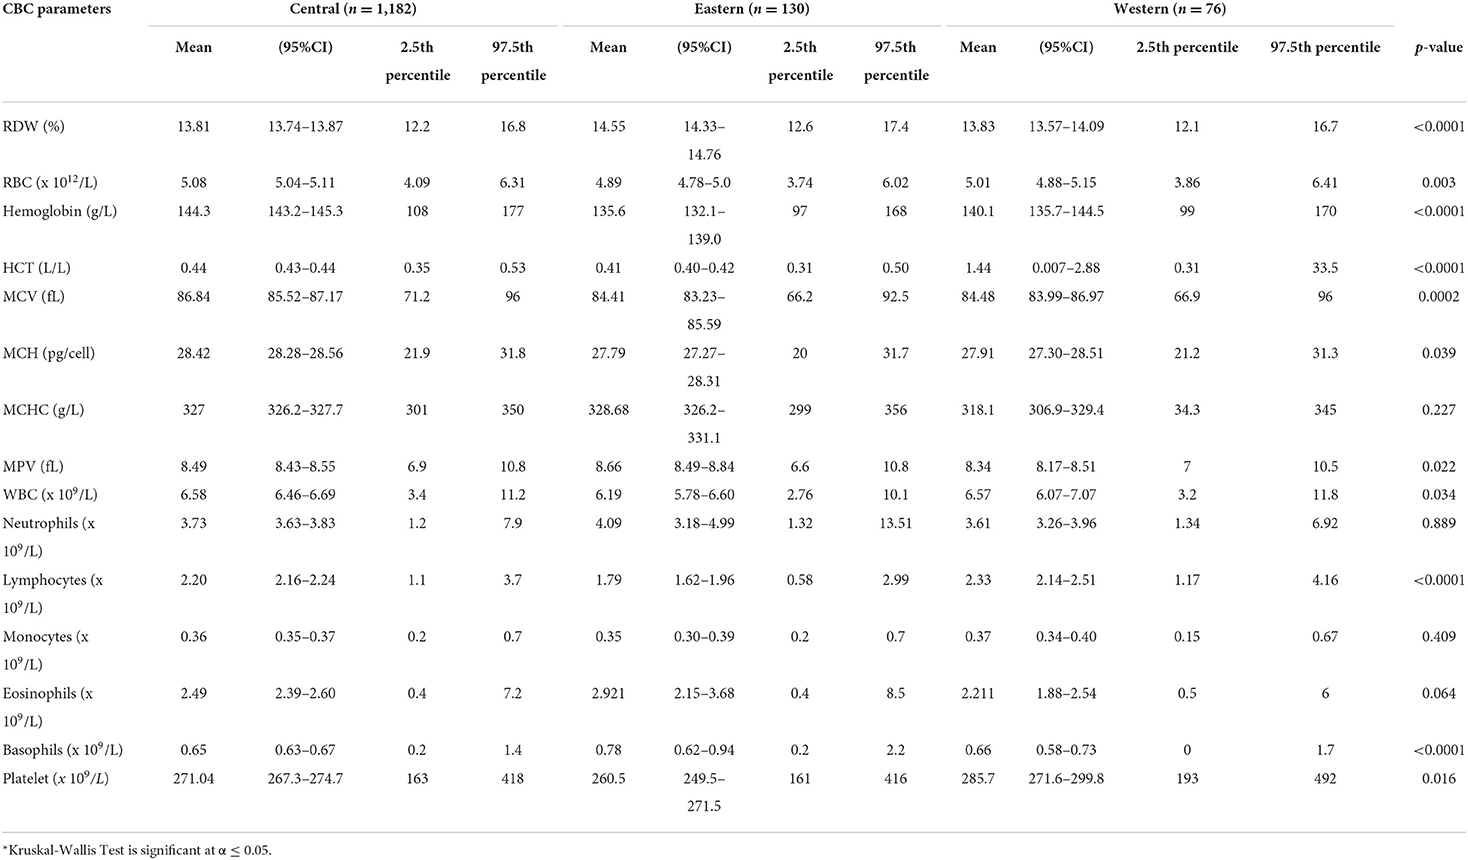
Table 3. The CBC reference intervals of the study cohort by regions.
WBC parameters
Gender-related differences were not observed in the WBC, neutrophils, and lymphocytes. However, gender-related differences were observed in the male compared to female, for the monocytes (0.39 vs. 0.33 × 10⁹/L), eosinophils (2.80 vs. 2.12 × 10⁹/L), and basophils (0.70 vs. 0.60 × 10⁹/L) (Table 1). The WBC parameters did not differ by age category except for the eosinophils (Table 2). Region-related differences were observed for the WBC, lymphocytes, and basophils (Table 3).
Platelets parameters
The gender-related difference was observed for the platelet count, which was higher in female (290.46 vs. 254.1 × 10⁹/L) (Table 1). The platelet count varied by age category and was higher in the 40 year and older age group (Table 2). The platelet count was higher in the Western region (Table 3).
The prevalence rate of leukopenia, neutropenia, anemia, polycythemia, thrombocytosis, and thrombocytopenia by gender and region
The most frequent blood abnormalities identified in the study cohort are summarized in Tables 4, 5. Gender-related differences were observed in the rate of anemia, polycythemia, thrombocytosis, and thrombocytopenia. The overall rate of anemia was 10.6% (95% CI: 9.15, 12.42), and higher in women 22.5% (95% CI: 19.45, 25.96). The rate of polycythemia was higher in men 51.6% (95% CI: 48.02, 55.22). Region-related differences were observed in the rate of anemia, and neutropenia which was noticeably higher in the Eastern region 22.48% (95% CI: 16.13, 30.42), and Central region 12.97% (95% CI: 11.13, 15.07) (Table 5).
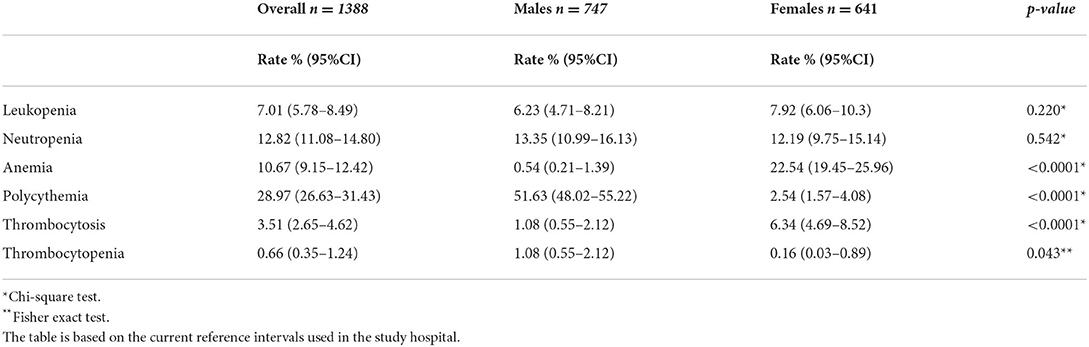
Table 4. Prevalence rate of leukopenia, neutropenia, anemia, polycythemia, thrombocytosis, and thrombocytopenia by gender.
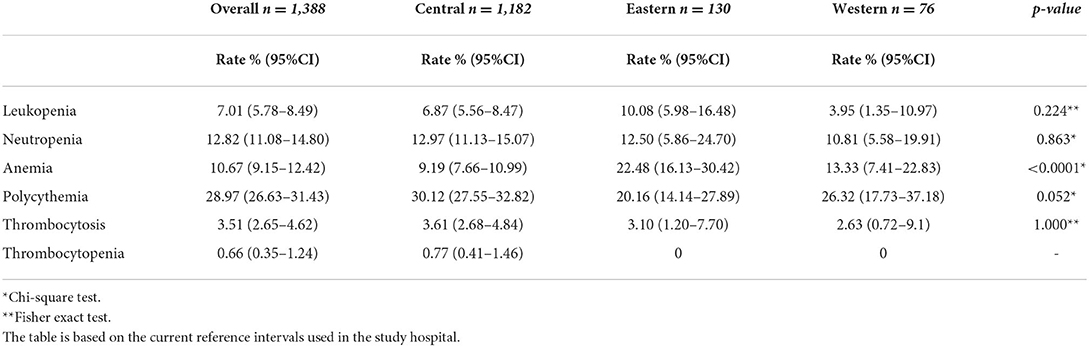
Table 5. Prevalence rate of leukopenia, neutropenia, anemia, polycythemia, thrombocytosis, and thrombocytopenia by region.
Comparison of reference intervals globally
Table 6 summarizes the hematological parameter RIs in different populations in the region and other populations. The MCV in men and women is lower in Saudi Arabia compared to Caucasians (France and Canada), but similar to Nigeria. However, it is lowest in Mali and Iran. The lower limit of Hb is higher in Saudi men compared to Omani men, but similar to the Kuwaiti population. The lower limit of Hb in Saudi women is lower than France, Canada, Mali, Kenya, Oman, and Kuwait. The lower limit of neutrophils is lower in Saudi Arabia compared to Caucasians; however, it is lowest in Brazil and Oman.
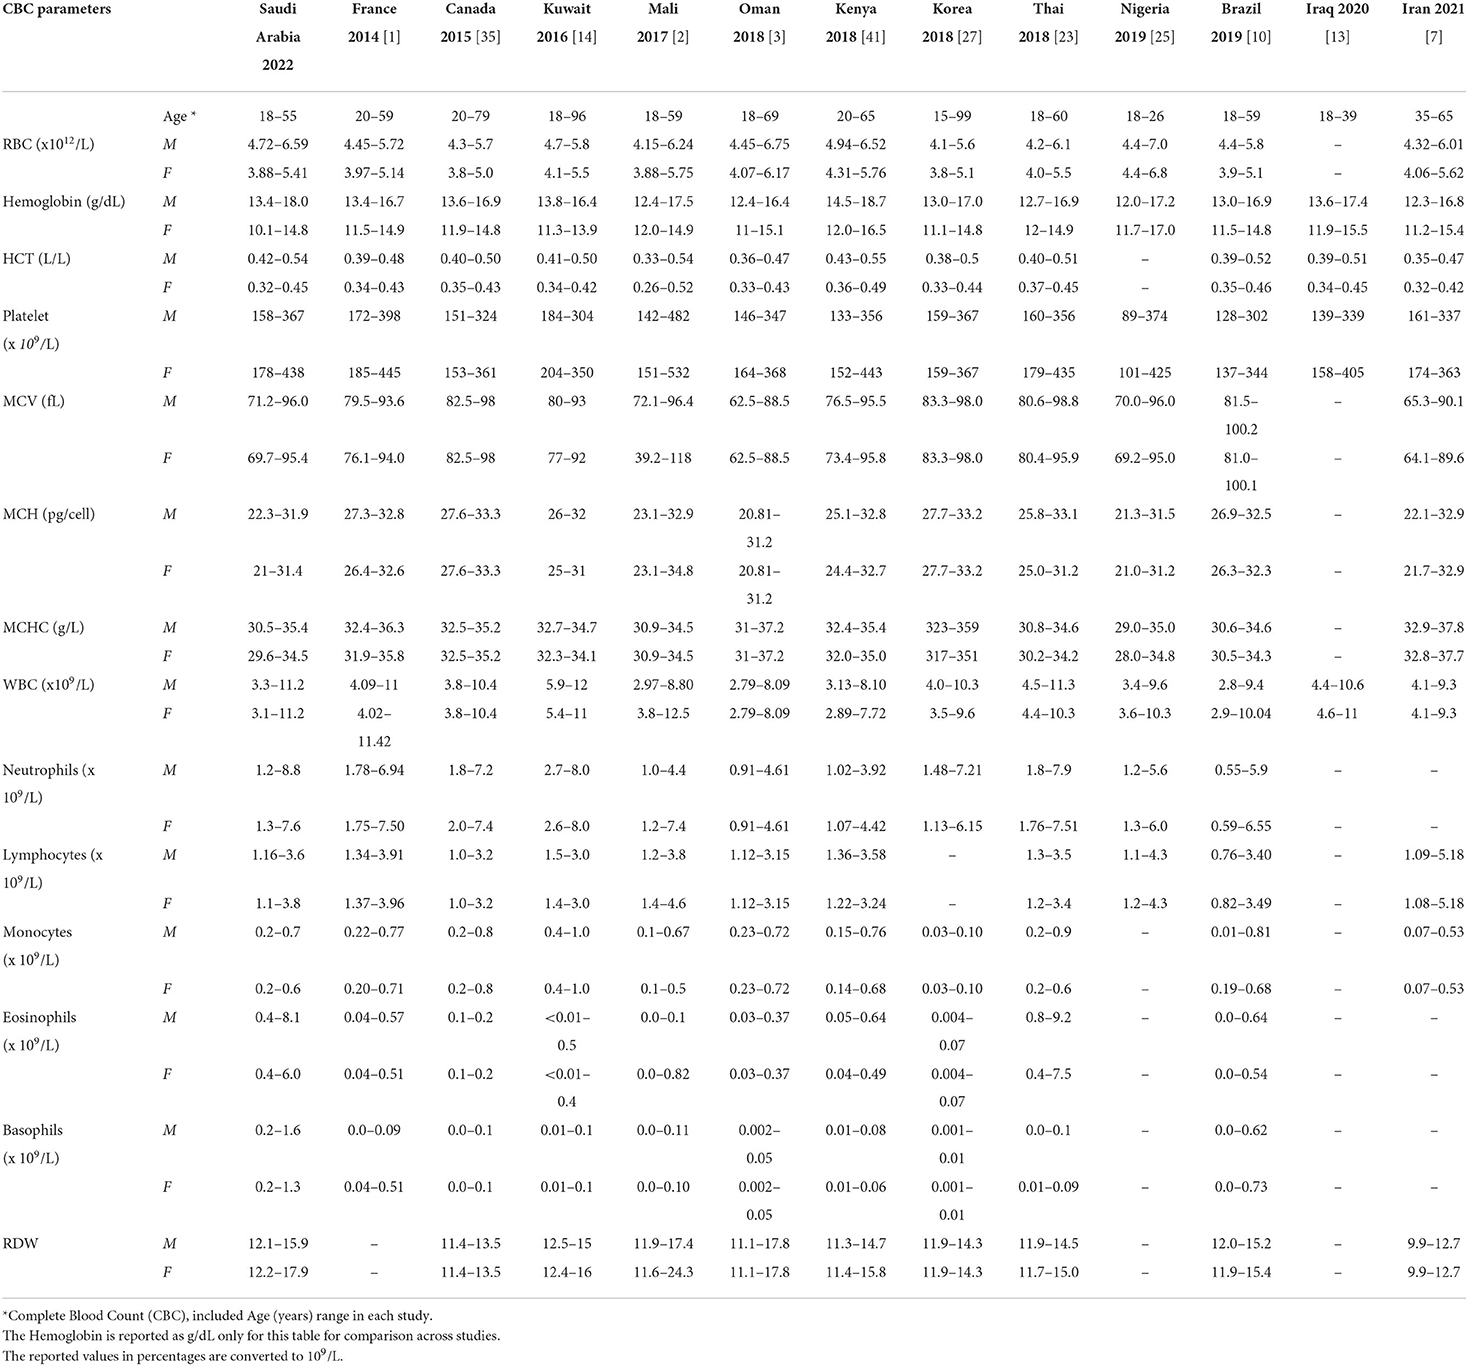
Table 6. Comparison of CBC parameters reference intervals across reported studies.
Discussion
This study provided the RIs for the adult Saudi population for three age categories, gender, and regions. The establishment of hematological RIs in terms of disease diagnosis and monitoring is crucial. Hematological parameters are influenced by age, gender, and lifestyle (8). Ethnicity is also a factor to consider when establishing RIs for hematological parameters (18). Canada endorsed specific RIs established by the Canadian Laboratory Initiative for Pediatric Reference Intervals (CALIPER), (19) and the Canadian Health Measures Survey (CHMS) (20). Australia also reported specific RIs for the population (21). In the last decade, several studies reported RIs form different parts of the world (2, 7, 10, 13, 22–29), such as Saudi Arabia (15–17). The reported hematological parameters RIs in literature differ for populations, for example, Asian Americans and American blacks compared to white Americans (4), South Indians compared to European (5) and Africans compared to Western populations (30, 31). Few studies recently reported hematological RIs in the Middle Eastern region (3, 7, 13, 14).
In the current study, compared to men, women had lower RBC, Hb, HCT, MCV, and MCHC. The findings that men have higher levels of RBC, Hb, HCT, MCV, and MCHC parameters are consistent as reported in literature (7, 10, 27–29, 32, 33). The findings are also consistent with a regional study (3). The gender-related differences in the RBC parameters were noticeable after the age of 14 years (27). A possible explanation for the gender difference in Hb is low iron stores due to menstruation, decreased muscle mass, the effect of androgens/estrogen, and decreased metabolic demand (3, 34, 35). A Canadian study also reported changes in hemoglobin by gender overtime (35).
In the current study, the lower limit of Hb in the female group was lower compared with the Caucasians (France and Canada) (1, 35) and also the populations in Oman and Kuwait (3, 14). A possible explanation of the Hb difference compared to Caucasians is the prolonged menstrual cycle in Saudi women [median bleeding days were 5 (1–16)] (36). Other reasons could be lifestyle, dietary habits, and due to the prevalence of other blood disorders (37, 38).
A study from the Aljouf region, Saudi Arabia (17) reported that the RIs differed from other studies reported in the region (Tanzania and Palestine) (39, 40). An interesting observation was that the RIs reported in the Aljouf region differed slightly from the current study (17) which warranted further exploration and indicated that RIs could be different not only for populations but also between regions of a country. Possible reasons are changes in altitude, climate, and lifestyle. Interestingly, the RIs of the current study differ from other populations in the region, however, with similarities to the Kenyan and Thai population (23, 41).
Gender-related differences were not observed for the WBC, neutrophils, and lymphocytes in the current study, which contradicts the previous findings (33). The current study indicates significant difference in the RDW by gender, also contrasting a prior study (10). Genetics play a key role in the platelet count variation in populations (42). In general, a lower platelet count has been reported in men compared to women, probably due to hormones or compensation due to menstruation (34). In the current study, the platelet-related findings are consistent with literature (1, 27, 32, 42). A possible explanation for the higher platelet count in women could be due to estrogen-promoting platelet production (43). Another factor related to higher platelets is a reduction in the body iron stores. A moderate iron deficiency stimulates the platelet production due to iron deficiency (44, 45). However, a study also reported no gender effect on the platelet count (28).
The comparison of an age-related variation is not possible as the reported age group is not homogeneous in all the studies (10, 27). A comprehensive Korean study included all age groups, namely pediatric, adults, and geriatric (27). The age groups of the current study are similar to the Kenyan study (41). The age-specific CBC parameters trends observed in the current study were similar to an another study (35). The RBC, Hb, and HCT were higher in the 30–39 years age group. As reported in literature, age influences the Hb, the value gets lower with increasing age (46). The RDW increases with age as reported earlier (47, 48), which contradicts the findings of the current study with no significant difference in RDW between the age categories. The mean platelet count in the current study decreased with advancing age, supporting literature (7, 42). A possible rationale for the reduction in the platelet count is the decrease in the hematopoietic stem cell reserve with aging (42). However, no difference in an age-related variation has also been reported (41).
In the current study, the prevalence of blood abnormalities is based on the study hospital reference ranges. The cutoff for anemia, as described by the World Health Organization (WHO) is based on the severity of the anemia (49). We have observed a lower rate of anemia (10.6%), compared to Oman (28%) (50). In the current study, based on the WHO guidelines, anemia occurred more frequently in women. As reported by WHO 2011 report, the prevalence of anemia in women (22.5%) is lower compared to the child bearing age of women globally (29.4%) (51). Several studies reported a prevalence of anemia in Saudi Arabia, from the Eastern province 35.5% (71/201) (52), 67.35% (33/49) from Jazan (53), and 64% (171/268) from Madinah (54). The reported prevalence of sickle cell disease is highest in the Eastern region (54) and ranges between 2 and 27% (55, 56), which explains the higher rate of anemia in the Eastern region. The current study results indicate the prevalence of polycythemia/erthyrocytosis (29%), which is lower than a prior Saudi study (24/200, 38.7%) (57). The polycythemia is higher among men the fact which can be attributed to the smoking status among men. However, the smoking status for all participants could not be captured due to the retrospective nature of the data. Benign neutropenia is a frequent finding in our clinical practice, also reported in literature (58–60). One study reported a prevalence of 20%, but the sample size was only 69 (60). The overall prevalence rate of benign neutropenia (12.8%) in the current study falls within the range reported by the Western region of Saudi Arabia (11–23%) (58). However, in the current study, the benign neutropenia rate is higher in the Central region (12.97%) vs. the Western region (10.8%). Our benign neutropenia rate is slightly higher than reported by studies done in the region, such as Qatar (10.7%) (61) and the United Arab Emirates (10.7%) (62). However, the cut-off for defining neutropenia in the study from Qatar was lower (1.5 × 10⁹/L) than the current study (61). The key point is that benign neutropenia is frequently reported in Arabs (60, 62), possibly due to genetic factors (63). In addition, an interesting discussion explores the role of altitude in the neutrophil count (59). In the current study, the neutropenia rate is higher than reported in the West, such as Black (4.5%) and White Americans (0.79%) (64). A strong association was reported between being from an African origin and neutropenia, ranging from 2.7 to 12.5% (65).
Limitations
The study has several limitations. Firstly, the results may not represent the hematological reference range for Saudi Arabia, and are not applicable to children, adolescents, and the elderly. Secondly, the employees from different regions are a mixed group, for example, participants from a region residing in another region and not mutually exclusive. Due to the retrospective nature of the data, it was not possible to screen for chronic medical conditions (diabetes mellitus or hematological diseases). Thirdly, the information related to the factors which might influence the reference intervals, such as inflammation-related disease, drugs, occupational exposure, circadian rhythms, and the blood sample collection time could not be gathered.
Conclusion
The data from this study provide hematological parameter reference ranges for a healthy adult Saudi population by gender, age, and region. Gender- and age-related differences were observed for the hematological parameters. Anemia was more frequent in the female and the Eastern region. The rate of benign neutropenia was similar to a study reported in Saudi Arabia; however, it was higher than studies reported in the region. Our findings also reflect that some hematological reference intervals were not only different from Western populations, but also from some of the other populations in the region. Caution must be taken when comparing or interpreting results from the different age groups, gender, regions of origin, and ethnicity. We recommend additional large-scale studies exploring all the influencing factors and age groups prior to establishing reference intervals.
Data availability statement
The datasets generated and/or analyzed during the current study are not publicly available due to the institutional rules and regulations but are available from the author on a reasonable request. Requests to access these datasets should be directed to YXNrYXJhc0BuZ2hhLm1lZC5zYQ==.
Ethics statement
The studies involving human participants were reviewed and approved by King Abdullah International Medical Research Center Institutional Review Board. Written informed consent for participation was not required as secondary data was used and there was no direct interaction with the participants.
Author contributions
All authors made significant contributions to the conception, study design/execution of the study, data acquisition, analysis, interpretation, drafting manuscript, and critical review. The final version of the manuscript has been reviewed by all the authors and all agreed on the journal chosen for publication.
Acknowledgments
The abstract was published by ASH publications Hematological profile in the Saudi population: Reference intervals by gender, age, and region 2019.
Conflict of interest
The authors declare that the research was conducted in the absence of any commercial or financial relationships that could be construed as a potential conflict of interest.
Publisher's note
All claims expressed in this article are solely those of the authors and do not necessarily represent those of their affiliated organizations, or those of the publisher, the editors and the reviewers. Any product that may be evaluated in this article, or claim that may be made by its manufacturer, is not guaranteed or endorsed by the publisher.
Supplementary material
The Supplementary Material for this article can be found online at: https://www.frontiersin.org/articles/10.3389/fmed.2022.901937/full#supplementary-material
References
1. Troussard X, Vol S, Cornet E, Bardet V, Couaillac J-P, Fossat C, et al. Full blood count normal reference values for adults in France. J Clin Pathol. (2014) 67:341–4. doi: 10.1136/jclinpath-2013-201687
2. Kone B, Maiga M, Baya B, Sarro Y, Coulibaly N, Kone A, et al. Establishing reference ranges of hematological parameters from malian healthy adults. J blood lymph. (2017) 7(1).
3. Al-Mawali A, Pinto AD, Al-Busaidi R, Al-Lawati RH, Morsi M. Comprehensive haematological indices reference intervals for a healthy Omani population: First comprehensive study in Gulf Cooperation Council (GCC) and Middle Eastern countries based on age, gender and ABO blood group comparison. PLoS ONE. (2018) 13:e0194497. doi: 10.1371/journal.pone.0194497
4. Lim E, Miyamura J, Chen JJ. Racial/Ethnic-Specific reference intervals for common laboratory tests: a comparison among Asians, Blacks, Hispanics, and White. Hawai'i J Med public Heal a J Asia Pacific Med Public Heal. (2015) 74:302–10.
5. Sundaram M, Mohanakrishnan J, Murugavel KG, Shankar EM, Solomon S, Srinivas CN, et al. Ethnic variation in certain hematological and biochemical reference intervals in a south Indian healthy adult population. Eur J Intern Med. (2008) 19:46–50. doi: 10.1016/j.ejim.2007.06.010
6. Castaneda C, Nalley K, Mannion C, Bhattacharyya P, Blake P, Pecora A, et al. Clinical decision support systems for improving diagnostic accuracy and achieving precision medicine. J Clin Bioinforma. (2015) 5:4. doi: 10.1186/s13336-015-0019-3
7. Moradinazar M, Najafi F, Pasdar Y, Hamzeh B, Shakiba E, Bohn MK, et al. Establishing hematological reference intervals in healthy adults: Ravansar non-communicable disease cohort study, Iran. Int J Lab Hematol. (2021) 43:199–209. doi: 10.1111/ijlh.13371
8. Fulgoni VL 3rd, Agarwal S, Kellogg MD, Lieberman HR. Establishing pediatric and adult rbc reference intervals with nhanes data using piecewise regression. Am J Clin Pathol. (2019) 151:128–42. doi: 10.1093/ajcp/aqy116
9. Institute CLS. Ep28-A3c Defining, Establishing, and Verifying Reference Intervals In The Clinical Laboratory; Approved Guideline. Wayne, PA: Clinical and Laboratory Standards Institute (2008).
10. Rosenfeld LG, Malta DC, Szwarcwald CL, Bacal NS, Cuder MAM, Pereira CA, et al. Reference values for blood count laboratory tests in the Brazilian adult population, National Health Survey. Rev Bras Epidemiol. (2019) 22:E190003.SUPL.2.
11. Kratz A, Ferraro M, Sluss PM, Lewandrowski KB. Normal reference laboratory values. N Engl J Med [Internet]. (2004) 351:1548–63. doi: 10.1056/NEJMcpc049016
12. Cheng CK-W, Chan J, Cembrowski GS, van Assendelft OW. Complete blood count reference interval diagrams derived from NHANES III: stratification by age, Gender, and race. Lab Hematol. (2004) 10:42–53. doi: 10.1532/LH96.04010
13. Abdullah DA, Mahmood GA, Rahman HS. Hematology reference intervals for healthy adults of the city of Sulaymaniyah, Iraq. Int J Gen Med. (2020) 13:1249–54. doi: 10.2147/IJGM.S270800
14. Al-Jafar H. Provisional study of Kuwait adult hematology reference range. (2016). 2:1–4. doi: 10.13188/2380-6842.1000013
15. Al-Buhairan AM, Khalil SH, Oluboyede OA. Reference range values of hematological parameters in Saudi healthy adults. Saudi Med J. (1999) 20:757–62.
16. El-Hazmi MA, Warsy AS. Normal reference values for hematological parameters, red cell indices, HB A2 and HB F from early childhood through adolescence in Saudis. Ann Saudi Med. (2001) 21(3–4):165–9. doi: 10.5144/0256-4947.2001.165
17. Elderdery AY, Alshaiban AS. Reference value profile for healthy individuals from the Aljouf region of Saudi Arabia. J Hematol. (2017) 6:6–11. doi: 10.14740/jh316e
18. Horn PS, Pesce AJ. Effect of ethnicity on reference intervals. Clin Chem. (2002) 48:1802–4. doi: 10.1093/clinchem/48.10.1802
19. Bevilacqua V, Chan MK, Chen Y, Armbruster D, Schodin B, Adeli K. Pediatric population reference value distributions for cancer biomarkers and covariate-stratified reference intervals in the CALIPER cohort. Clin Chem. (2014) 60:1532–42. doi: 10.1373/clinchem.2014.229799
20. Tremblay M, Wolfson M, Connor Gorber S. Canadian health measures survey: rationale, background and overview. Heal reports. (2007) 18:7–20. doi: 10.1007/BF03405437
21. Sinclair L, Hall S, Badrick T. A survey of Australian haematology reference intervals. Pathology. (2014) 46:538–43. doi: 10.1097/PAT.0000000000000148
22. Ambayya A, Su AT, Osman NH, Nik-Samsudin NR, Khalid K, Chang KM, et al. Haematological reference intervals in a multiethnic population. PLoS ONE. (2014) 9:e91968. doi: 10.1371/journal.pone.0091968
23. Wongkrajang P, Chinswangwatanakul W, Mokkhamakkun C, Chuangsuwanich N, Wesarachkitti B, Thaowto B, et al. Establishment of new complete blood count reference values for healthy Thai adults. Int J Lab Hematol. (2018) 40:478–83. doi: 10.1111/ijlh.12843
24. Gessese T, Yalew A, Asrie F. Determination of hematological reference intervals for healthy adults in Northeast Ethiopia. Clin Lab. (2020) 66(4). doi: 10.7754/Clin.Lab.2019.190729
25. Ayemoba O, Hussain N, Umar T, Ajemba-Life A, Kene T, Edom U, et al. Establishment of reference values for selected haematological parameters in young adult Nigerians. PLoS ONE. (2019) 14:e0213925. doi: 10.1371/journal.pone.0213925
26. Angeli A, Andrew OS, Qian YZ, Anselm ST, Chang KM, Jameela S, et al. Reference interval establishment of full blood count extended research parameters in the multi-ethnic population of Malaysia. Med J Malaysia. (2019) 74:534–6.
27. Nah EH, Kim S, Cho S, Cho HI. Complete blood count reference intervals and patterns of changes across pediatric, adult, and geriatric ages in Korea. Ann Lab Med. (2018) 38:503–11. doi: 10.3343/alm.2018.38.6.503
28. Siraj N, Issac J, Anwar M, Mehari Y, Russom S, Kahsay S, et al. Establishment of hematological reference intervals for healthy adults in Asmara. BMC Res Notes [Internet]. (2018) 11:55. doi: 10.1186/s13104-018-3142-y
29. Wu X, Zhao M, Pan B, Zhang J, Peng M, Wang L, et al. Complete blood count reference intervals for healthy Han Chinese adults. PLoS ONE. (2015) 10:e0119669. doi: 10.1371/journal.pone.0119669
30. Smit FC, Davison GM, Hoffmann M, Erasmus RT, Davids S, Matsha TE. Full blood count and white cell differential count reference ranges obtained from a healthy urban South African population residing in the Western Cape of South Africa. Int J Lab Hematol. (2019) 41:635–41. doi: 10.1111/ijlh.13076
31. Segolodi TM, Henderson FL, Rose CE, Turner KT, Zeh C, Fonjungo PN, et al. Normal laboratory reference intervals among healthy adults screened for a HIV pre-exposure prophylaxis clinical trial in Botswana. PLoS ONE. (2014) 9:e93034. doi: 10.1371/journal.pone.0093034
32. Koram K, Addae M, Ocran J, Adu-Amankwah S, Rogers W, Nkrumah F. Population based reference intervals for common blood haematological and biochemical parameters in the akuapem north district. Ghana Med J. (2007) 41:160–6. doi: 10.4314/gmj.v41i4.55284
33. Addai-Mensah O, Gyamfi D, Duneeh RV, Danquah KO, Annani-Akollor ME, Boateng L, et al. Determination of haematological reference ranges in healthy adults in three regions in Ghana. Chao Y-P, editor. Biomed Res Int. (2019) 2019:7467512. Available from: doi: 10.1155/2019/7467512
34. Arbiol-Roca A, Imperiali CE, Montserrat MM, Cerro AS, Bosch de Basea AC, Navarro LS, et al. Reference intervals for a complete blood count on an automated haematology analyser Sysmex XN in healthy adults from the southern metropolitan area of Barcelona. EJIFCC. (2018) 29:48–54.
35. Adeli K, Raizman JE, Chen Y, Higgins V, Nieuwesteeg M, Abdelhaleem M, et al. Complex biological profile of hematologic markers across pediatric, adult, and geriatric ages: establishment of robust pediatric and adult reference intervals on the basis of the Canadian Health Measures Survey. Clin Chem. (2015) 61:1075–86. doi: 10.1373/clinchem.2015.240531
36. Dasharathy SS, Mumford SL, Pollack AZ, Perkins NJ, Mattison DR, Wactawski-Wende J, et al. Menstrual bleeding patterns among regularly menstruating women. Am J Epidemiol. (2012) 175:536–45. doi: 10.1093/aje/kwr356
37. Al-Sultan A, Phanasgaonkar S, Suliman A, Al-Baqushi M, Nasrullah Z, Al-Ali A. Spectrum of β-thalassemia mutations in the eastern province of Saudi Arabia. Hemoglobin. (2011) 35:125–34. doi: 10.3109/03630269.2011.553567
38. Altaf A, Algethmi W. Risk of bowel resection in patients with hernia. J Appl Hematol. (2010) 1:43–6.
39. Sirdah MM, Tarazi IS, El Jeadi H, Al Haddad RM. Normal blood cells reference intervals of healthy adults at the Gaza Strip-Palestine. J Clin Lab Anal [Internet]. (2008) 22:353–61. doi: 10.1002/jcla.20265
40. Saathoff E, Schneider P, Kleinfeldt V, Geis S, Haule D, Maboko L, et al. Laboratory reference values for healthy adults from southern Tanzania. Trop Med Int Health. (2008) 13:612–25. doi: 10.1111/j.1365-3156.2008.02047.x
41. Omuse G, Maina D, Mwangi J, Wambua C, Radia K, Kanyua A, et al. Complete blood count reference intervals from a healthy adult urban population in Kenya. PLoS ONE. (2018) 13:e0198444. doi: 10.1371/journal.pone.0198444
42. Biino G, Santimone I, Minelli C, Sorice R, Frongia B, Traglia M, et al. Age- and sex-related variations in platelet count in Italy: a proposal of reference ranges based on 40987 subjects' data. PLoS ONE. (2013) 8:e54289–e54289. doi: 10.1371/journal.pone.0054289
43. Daly ME. Determinants of platelet count in humans. Haematologica. (2011) 96:10–3. doi: 10.3324/haematol.2010.035287
45. Kadikoylu G, Yavasoglu I, Bolaman Z, Senturk T. Platelet parameters in women with iron deficiency anemia. J Natl Med Assoc. (2006) 98:398–402. doi: 10.4103/ssj.ssj_44_18
46. Mugisha JO, Seeley J, Kuper H. Population based haematology reference ranges for old people in rural South-West Uganda. BMC Res Notes. (2016) 9:433. doi: 10.1186/s13104-016-2217-x
47. Martínez-Velilla N, Ibáñez B, Cambra K, Alonso-Renedo J. Red blood cell distribution width, multimorbidity, and the risk of death in hospitalized older patients. Age (Dordr). (2012) 34:717–23. doi: 10.1007/s11357-011-9254-0
48. Patel K V, Ferrucci L, Ershler WB, Longo DL, Guralnik JM. Red blood cell distribution width and the risk of death in middle-aged and older adults. Arch Intern Med. (2009) 169:515–23. doi: 10.1001/archinternmed.2009.11
49. WHO. Haemoglobin Concentrations for the Diagnosis of Anaemia and Assessment of severity. Vitamin and Mineral Nutrition Information System. (2011). Available online at: https://apps.who.int/iris/bitstream/handle/10665/85839/WHO_NMH_NHD_MNM_11.1_eng.pdf (accessed March 20, 2022).
50. Al Riyami A, Elaty MAA, Morsi M, Al Kharusi H, Al Shukaily W, Jaju S. Oman world health survey: part 1 - methodology, sociodemographic profile and epidemiology of non-communicable diseases in oman. Oman Med J. (2012) 27:425–43.
51. Horld Health Organization. The Global Prevalence of Anaemia in 2011. (2011). Geneva: World Health Organization. Available online at: https://apps.who.int/iris/handle/10665/177094 (accessed March 20, 2022).
52. Al-Jamea L, Woodman A, Elnagi E, Al-Amri S, Al-Zahrani A, Al-shammari N, et al. Prevalence of Iron-deficiency anemia and its associated risk factors in female undergraduate students at prince sultan military college of health sciences. J Appl Hematol. (2019) 10:126–33. doi: 10.4103/joah.joah_44_19
53. Hamali HA, Mobarki AA, Saboor M, Alfeel A, Madkhali AM, Akhter MS, et al. Prevalence of Anemia Among Jazan University Students. Int J Gen Med. (2020) 13:765–70. doi: 10.2147/IJGM.S275702
54. Al Hassan NN. The prevalence of iron deficiency anemia in a Saudi University female students. J Microsc Ultrastruct. (2015) 3:25–8. doi: 10.1016/j.jmau.2014.11.003
55. Alhamdan NA, Almazrou YY, Alswaidi FM, Choudhry AJ. Premarital screening for thalassemia and sickle cell disease in Saudi Arabia. Genet Med. (2007) 9:372–7. doi: 10.1097/GIM.0b013e318065a9e8
56. el-Hazmi MA, Warsy AS. Appraisal of sickle-cell and thalassaemia genes in Saudi Arabia. East Mediterr Heal J = La Rev sante la Mediterr Orient = al-Majallah al-sihhiyah li-sharq al-mutawassit. (1999) 5:1147–53. doi: 10.26719/1999.5.6.1147
57. Malhan H, Alzahrani H, Elgohary G, Owaidah T, Aslam M, Mohamed S. Clinical and laboratory presentations of Janus Kinase II-positive patients in Saudi population. J Appl Hematol. (2014) 5:133–40. doi: 10.4103/1658-5127.146947
58. Awan ZA, Al Amoudi SM, Saboor M, Alkhaldy HY. Isolated neutropenia/benign ethnic neutropenia: a common clinical and laboratory finding in Southern and Western Saudi Arabia. Int J Gen Med [Internet]. (2021) 14:451–7. doi: 10.2147/IJGM.S300690
59. Alkhaldy HY, A Awan Z, Abouzaid AA, Elbahaie HM, Al Amoudi SM, Andarawi M, et al. The prevalence of isolated neutropenia at high altitude in southern saudi arabia: does altitude affect leucocyte count? Int J Gen Med. (2020) 13:1373–9. doi: 10.2147/IJGM.S284133
60. Gari M, Dakhakhni M, Gari A, Alshihri E, Al-Jahdali R, Narasimhan K, et al. Incidence and potential causative factors associated with chronic benign neutropenia in the Kingdom of Saudi Arabia. BMC Proc. (2015) 9:S1. doi: 10.1186/1753-6561-9-S2-S1
61. Yassin MA, Soliman AT, Desanctis V, Mohamed SF, Nashwan AJ, Ibrahim F. Prevalence of neutropenia in a cohort of adult population in qatar: relation to other hematological parameters and anthropometric data. Blood. (2020) 136:23–4. doi: 10.1182/blood-2020-135928
62. Denic S, Showqi S, Klein C, Takala M, Nagelkerke N, Agarwal MM. Prevalence, phenotype and inheritance of benign neutropenia in Arabs. BMC Blood Disord. (2009) 9:3. doi: 10.1186/1471-2326-9-3
63. Kobayashi Y. Neutrophil biology: an update. EXCLI J. (2015) 14:220–7. doi: 10.4414/pc-d.2014.00726
64. Hsieh MM, Everhart JE, Byrd-Holt DD, Tisdale JF, Rodgers GP. Prevalence of neutropenia in the U.S. population: age, sex, smoking status, and ethnic differences. Ann Intern Med. (2007) 146:486–92. doi: 10.7326/0003-4819-146-7-200704030-00004
Keywords: complete blood count (CBC), healthy adults, hematological parameters, normal values, reference intervals (RIs)
Citation: Shaheen NA, Rehan H, Moghairi A, Gmati G, Damlaj M, Salama H, Rather M, Mendoza MA, Alanazi A, Al Ahmari B, Al Zahrani M, Al-Hejazi A and Alaskar AS (2022) Hematological indices in the adult saudi population: Reference intervals by gender, age, and region. Front. Med. 9:901937. doi: 10.3389/fmed.2022.901937
Received: 23 March 2022; Accepted: 24 June 2022;
Published: 28 July 2022.
Edited by:
Eric Kraut, The Ohio State University, United StatesReviewed by:
Mohsen Saleh Elalfy, Ain Sham University, EgyptXiumei Xing, Sun Yat-sen University, China
Copyright © 2022 Shaheen, Rehan, Moghairi, Gmati, Damlaj, Salama, Rather, Mendoza, Alanazi, Al Ahmari, Al Zahrani, Al-Hejazi and Alaskar. This is an open-access article distributed under the terms of the Creative Commons Attribution License (CC BY). The use, distribution or reproduction in other forums is permitted, provided the original author(s) and the copyright owner(s) are credited and that the original publication in this journal is cited, in accordance with accepted academic practice. No use, distribution or reproduction is permitted which does not comply with these terms.
*Correspondence: Ahmed S. Alaskar, YXNrYXJhc0BuZ2hhLm1lZC5zYQ==; orcid.org/0000-0002-0648-3256