 Xianfeng Wu1,2*†
 Jiao Meng3†Lei Zhou4Xiaojiang Zhan5Yueqiang Wen6
 Xiaoyang Wang7
 Xiaoran Feng8
 Niansong Wang1,2
 Fenfen Peng9
 Junnan Wu3*
- 1Department of Nephrology, Shanghai Jiao Tong University Affiliated Sixth People’s Hospital, Shanghai, China
- 2Clinical Research Center for Chronic Kidney Disease, Shanghai Jiao Tong University Affiliated Sixth People’s Hospital, Shanghai, China
- 3Department of Nephrology, Zhejiang University Medical College Affiliated Sir Run Run Shaw Hospital, Hangzhou, China
- 4Evergreen Tree Nephrology Association, Guangzhou, China
- 5Department of Nephrology, The First Affiliated Hospital of Nanchang University, Nanchang, China
- 6Department of Nephrology, The Second Affiliated Hospital of Guangzhou Medical University, Guangzhou, China
- 7Department of Nephrology, The First Affiliated Hospital of Zhengzhou University, Zhengzhou, China
- 8Department of Nephrology, Jiujiang No. 1 People’s Hospital, Jiujiang, China
- 9Department of Nephrology, Zhujiang Hospital of Southern Medical University, Guangzhou, China
Background: Serum albumin and total cholesterol are associated with mortality. In clinical practice, evaluating the association of combining album and total cholesterol with mortality may be more reasonable. Thus, we examined the association between serum albumin to total cholesterol ratio and mortality in peritoneal dialysis (PD) patients.
Methods: We conducted a retrospective cohort study of 3447 incident continuous ambulatory peritoneal dialysis (CAPD) patients from five PD centers in China from 1 January 2005 and 31 May 2020. The association between albumin to total cholesterol ratio and mortality was evaluated.
Results: With a median follow-up of 39.3 months, 762 (22.1%) all-cause deaths occurred, including 382 (11.1%) cardiovascular deaths. As compared with a serum albumin to total cholesterol ratio of 0.77–0.82 (reference range), a higher ratio (>0.82) was associated with increased risks of all-cause mortality[hazards ratio (HR), 1.54; 95% confidence interval (CI), 1.16–2.05, E-value = 2.45] and cardiovascular mortality (HR, 2.10; 95% CI, 1.35–3.29, E-value = 3.62). A lower ratio (<0.77) was also associated with increased risks of all-cause mortality (HR, 1.46; 95% CI, 1.10–1.94, E-value = 2.28) and cardiovascular mortality (HR, 1.78; 95% CI, 1.14–2.78, E-value = 2.96) compared with the reference. No interaction was observed in subgroup analyses of age, sex, diabetes mellitus, hypertension, prior cardiovascular disease, and hyperlipidemia, and malnutrition (serum albumin <3.6 g/dL).
Conclusion: An albumin to total cholesterol ratio before the start of PD between 0.77 and 0.82 was associated with a lower risk of death than a higher or lower ratio, resulting in a U-curve association. Therefore, serum albumin to total cholesterol ratio, as an inexpensive and readily available biochemical biomarker, may further improve the stratification risk of mortality in PD patients.
Introduction
Moderate to severe malnutrition is associated with an increased risk of death in peritoneal dialysis (PD) patients. Early publications estimated that 40–66% of PD patients in the United States are malnourished (1–6). In a subsequent study that defined protein-energy wasting by serum albumin of <3.8 g/dL, 63% of PD patients were classified as malnourished (7). Many patients are malnourished when they begin dialysis. As an example, in one study, approximately 75% of patients initiating PD were malnourished (8). Thus, lower serum albumin is very common in PD patients.
Peritoneal dialysis patients typically have elevated levels of serum total cholesterol, whereas hemodialysis patients have normal or low levels of serum total cholesterol (9). As PD patients have different lipid profiles, traditional lipid profiles may have a different association with mortality in PD patients. As an example, a strategy to reduce low density lipoprotein (LDL) demonstrated no beneficial effect on cardiovascular disease in dialysis patients (10). Therefore, it may not be appropriate to evaluate the risk of mortality using only traditional lipid profiles in PD patients.
Previous studies have reported that lower serum albumin is associated with a higher risk of mortality (11–14), and lower cholesterol levels have been consistently associated with a higher risk of mortality in dialysis patients (14–17). Notably, many individuals who start PD have lower serum albumin and higher total cholesterol levels in clinical practice. Thus, based on serum albumin or total cholesterol levels, it is difficult to speculate the prognosis of dialysis patients. Hence, it is mandatory to combine serum albumin with total cholesterol to evaluate the prognosis in PD patients. An early study reported that the total cholesterol to albumin ratio could be used as an alternative parameter in predicting the risk of cardiovascular disease in the general population (18). However, there is no study to date examining the association between albumin to total cholesterol ratio and mortality in dialysis patients. Our study aimed to evaluate the association between albumin to total cholesterol ratio and mortality in patients on continuous ambulatory peritoneal dialysis (CAPD).
Materials and Methods
Study Design and Participants
We conducted a retrospective study that included 3566 incident CAPD patients from five PD centers in China between 1 January 2005 and 31 May 2020. To evaluate the association between albumin to total cholesterol 1 week before the start of PD and mortality in the real-world setting, we only excluded patients aged <18 years and those with <3 months of the follow-up. the data were de-identified, and the need for informed consent was waived. The study protocol complied with the Declaration of Helsinki and had full approval from each Clinical Research Ethics Committee.
Follow Up and Data Collection
Patients were advised to initiate PD with professional and clinical evaluation from nephrologists. In all patients, thorough medical records were reviewed by trained nurses in each dialysis center at study entry. In China, the patient must receive the first dialysis in the hospital, suggesting most of the patient’s data can be obtained within 1 week before the first dialysis. Thus, we defined baseline as 1 week (5.3 ± 1.2 days) before the first PD. All laboratory parameters from fasting blood samples were measured in each tertiary hospital’s laboratory department. Specifically, we included age at study entry, sex, body mass index, current smoker, current alcohol use, systolic blood pressure, diastolic blood pressure, comorbidities [diabetes mellitus, hypertension, prior cardiovascular disease, hyperlipidemia, chronic obstructive pulmonary disease (COPD), gastrointestinal bleeding], medication use [calcium antagonist, beta-blockers, angiotensin-converting enzyme inhibitors/angiotensin II receptor blockers (ACEI or ARBs), diuretics, and statins], and laboratory measurements [hemoglobin, albumin, estimated glomerular filtration rate (eGFR), total cholesterol, high density lipoprotein (HDL), and LDL]. There was no exposure to all patients with any intervention. Patients needed to return to each center at least quarterly for an overall medical assessment. The trained nurses conducted monthly face-to-face interviews or monthly telephone interviews to assess their general condition and related medications. All patients received CAPD treatment. Conventional dialysis solutions (Dianeal 1.5, 2.5, or 4.25% dextrose; Baxter Healthcare, Guangzhou, China), Y sets, and twin bag systems were used in all CAPD patients. No patients received automated PD.
Outcome Measurements
Our primary outcome measure was all-cause and cardiovascular mortality. We determined death causes based on medical files of admission. If patients died out of hospitals, we determined death causes according to interviewing with family members by telephone to acknowledge death’s circumstances, combining with information from medical records of PD centers. Details for the CAPD follow-up were previously described elsewhere (19). The follow-up period was from the start of PD to the date of death, transfer to hemodialysis, receiving renal transplantation, transfer to other dialysis centers, loss of follow-up, or 31 May 2020. Patients who were lost to follow-up were censored at the date of the last examination.
Statistical Analysis
Differences in the baseline characteristics among the study population in the different categories of albumin to total cholesterol ratio were compared using the Chi-square test for categorical variables and analysis of variance for continuous variables. We used restricted-cubic-spline plots to explore the shape of the association between albumin to total cholesterol ratio and mortality, fitting a restricted-cubic-spline function with four knots (at the 25th, 50th, 75th, and 95th percentiles) (20).
Based on our restricted-cubic-spline plots for the primary outcome, we selected a level of 0.77–0.82 as the reference category for the albumin to total cholesterol ratio. Cumulative all-cause and cardiovascular mortality were analyzed using the Kaplan–Meier failure function. Using four sequential models, we performed a multivariable Cox proportional hazards model to determine the association between albumin to total cholesterol ratio and all-cause and cardiovascular mortality. Model 1 was adjusted for age, sex, body mass index, current smoker, current alcohol use, and systolic blood pressure. Model 2 included model 1 and diabetes mellitus, hypertension, prior cardiovascular disease, COPD, gastrointestinal bleeding, and hyperlipidemia. Model 3 included model 2 and taking calcium antagonist, beta-blocker, ACE inhibitor or ARB, diuretics, and statin. Model 4 included model 3 and hemoglobin, eGFR, HDL, and LDL. We explored the potential influence of unmeasured confounders on our risk estimates using E-value analysis to determine how solid and imbalanced a confounding effect would need to be to alter the direction of findings (21). We tested for interactions of age, sex, diabetes mellitus, hypertension, prior cardiovascular disease, hyperlipidemia, and malnutrition (serum albumin <3.6 g/dL).
Sensitivity Analysis
To further explore the potential effect of imbalanced confounders, we performed propensity score-matched sensitivity analyses that compared low ratio with moderate ratio and high ratio with moderate ratio by using a greedy matching algorithm with a caliper width of 0.2 of the propensity score (22). To minimize the potential for reverse causation, we conducted analyses that excluded patients with prior cardiovascular disease or those deaths in the first years of follow-up. When considering a transfer to hemodialysis, receiving renal transplantation, transfer to other centers, and loss of follow-up as competing risks for all-cause mortality, we further analyzed the association between albumin to total cholesterol ratio and all-cause mortality using the Gray test. Missing data for serum albumin (n = 23), total cholesterol (35), or any other explanatory variables (n = 121) at the start of PD were replaced by the most recent available values by checking patients’ medical records of receiving the first PD procedure. All analyses were conducted with the use of Stata 15.1. statistical software (StataCorp, College Station, TX, United States).
Results
Baseline Characteristics
We excluded 55 patients aged <18 years, 62 patients with <3 months of follow-up, and 2 patients with serum albumin ≥6.0 g/dL. Thus, 3447 eligible patients were finally included in the present study (Supplementary Figure 1).
Of 3447 patients with a mean age of 49.7 years, 1795 (52.1%) were male sex, 662 (19.2%) had diabetes mellitus, 2415 (70.1%) had hypertension, 368 (10.7%) had a prior cardiovascular disease, and 596 (17.3%) had hyperlipidemia. The median albumin to total cholesterol ratio was 0.80 (range, 0.11–2.14). Based on our restricted-cubic-spline plots for the primary outcome, we selected a level of 0.77–0.82 as the reference category for the albumin to total cholesterol ratio (Figure 1). According to the albumin to total cholesterol ratio, the baseline characteristics of patients were shown in Table 1. The low group had low levels of serum albumin and high levels of total cholesterol, whereas the high group had high levels of serum albumin and low levels of total cholesterol. Compared with the moderate group, the high group was younger and less likely to have diabetes mellitus, had a history of cardiovascular disease, gastrointestinal bleeding, hyperlipidemia, taking calcium antagonist, beta-blocker, ACE inhibitor or ARB, and diuretics, and had lower systolic blood pressure, hemoglobin, eGFR, HDL, and LDL. In contrast, the low group was more likely to have diabetes mellitus and hyperlipidemia.
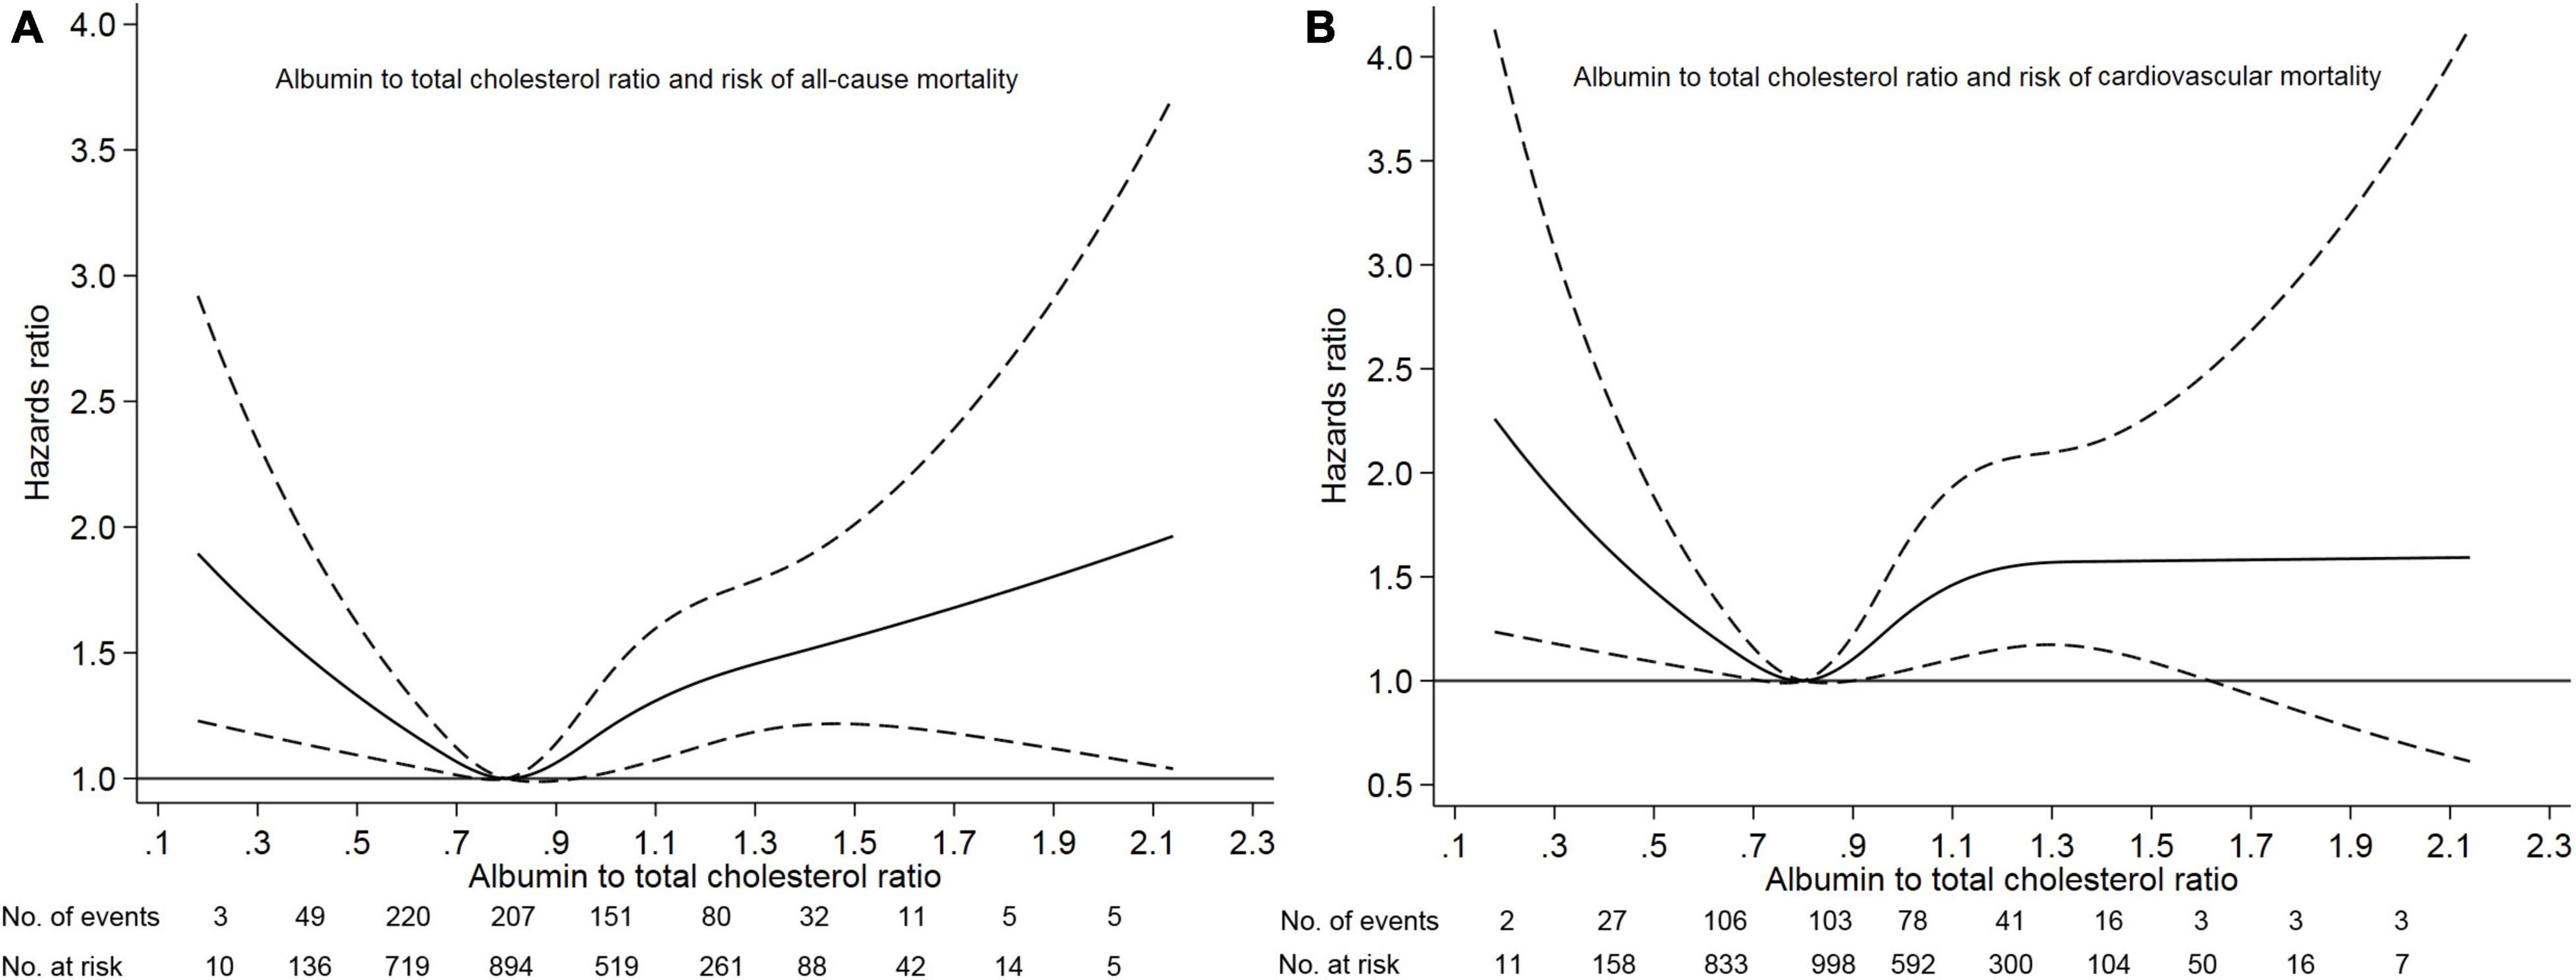
Figure 1. Association of albumin to total cholesterol ratio with risk of mortality. Panel (A) showed a restricted-cubic-spline plot of the association between albumin to total cholesterol ratio and all-cause mortality. Panel (B) showed a restricted cubic-spline plot of the association of albumin to total cholesterol ratio and cardiovascular mortality. All plots were adjusted for age, sex, body mass index, systolic blood pressure, current smoking, alcohol intake, comorbid conditions, medication use, laboratory measurements. Dashed lines indicate 95% confidence intervals. The median albumin to total cholesterol ratio (0.80) was the reference standard, indicated by the gray line.
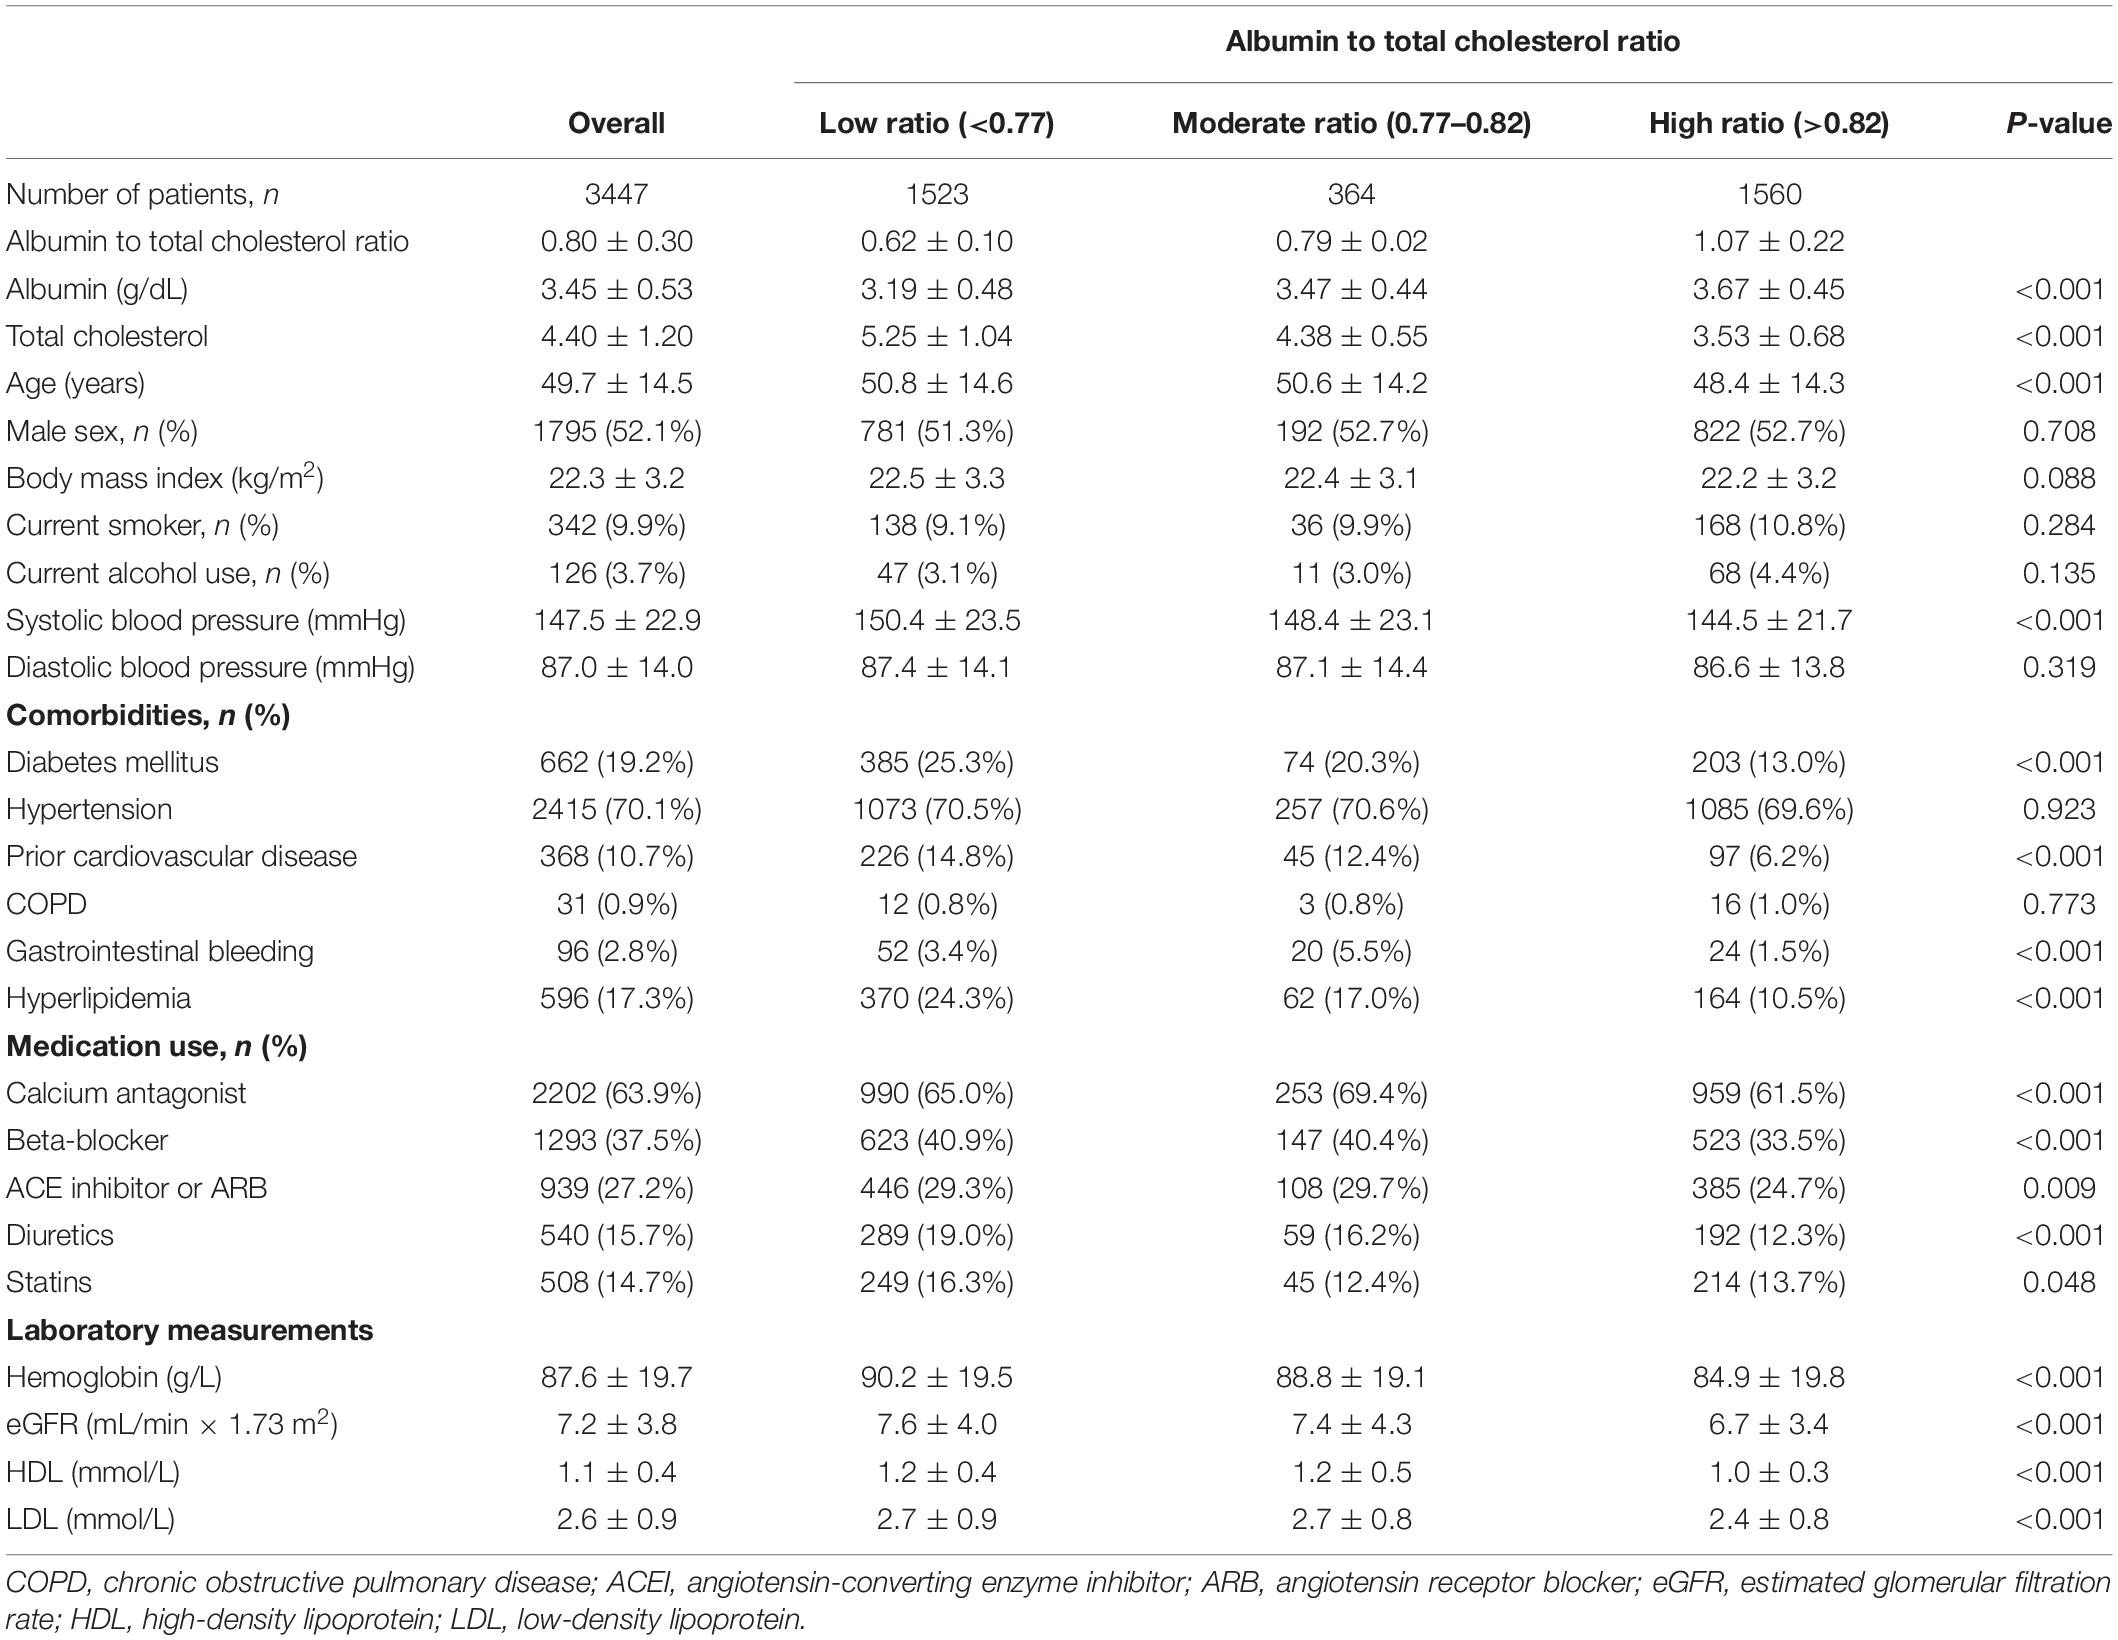
Table 1. Baseline patient characteristics by categories of albumin to total cholesterol ratio.
Albumin to Total Cholesterol Ratio and Mortality
During the median of 39.3 (range, 3.1–181.5) months of follow-up, 762 (22.1%) patients died, 466 (13.5%) patients transferred to hemodialysis, 229 (6.6%) patients received renal transplantation, 434 (12.6%) patients transferred to other dialysis centers, and 58 (1.7%) patients were loss to follow-up. Of 762 deaths, 382 (50.1%) deaths were due to cardiovascular disease, 135 (17.8%) deaths due to infectious disease, 72 (9.4%) deaths due to gastrointestinal bleeding, 14 (1.8%) deaths due to malignancy, 66 (8.7%) deaths due to other reasons, and 93 (12.2%) deaths due to unknown reasons. Deaths occurred in 356 (56.5/1000 person-years), 56 (38.3/1000 person-years), and 350 (57.0/1000 person-years) patients in those <0.77, 0.77–0.82, and >0.82 patients, respectively (Table 2).
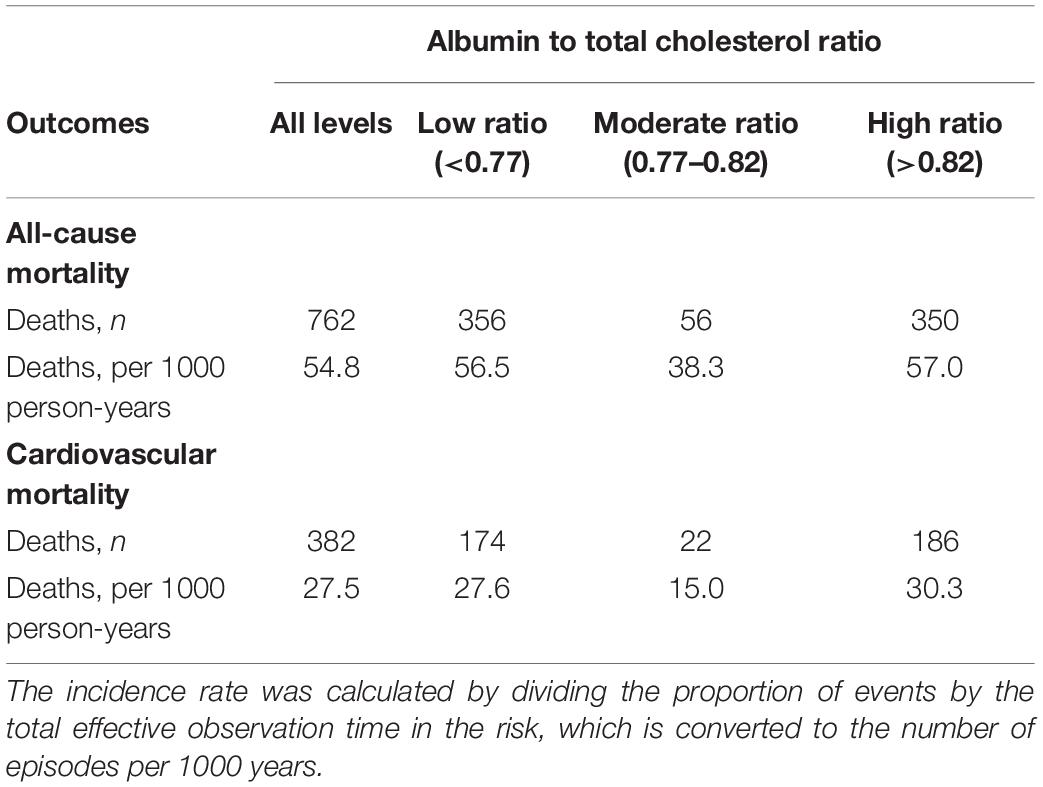
Table 2. Incidence rate of death according to albumin to total cholesterol ratio.
Survival analyses showed that the albumin to total cholesterol ratio of 0.77–0.82 had the lowest cumulative all-cause and cardiovascular mortality (Figure 2). As compared with an albumin to total cholesterol ratio of 0.77–0.82 (the reference category), an albumin to total cholesterol ratio of >0.82 was associated with increased risks of all-cause mortality [hazards ratio (HR), 1.54; 95% confidence interval (CI), 1.16–2.05; E-value = 2.45] and cardiovascular mortality (HR, 2.10 95% CI, 1.35–3.29; E-value = 3.46) on multivariable analysis (Tables 3, 4 and Figure 1). Plus, as compared with the reference range, an albumin to total cholesterol ratio (<0.77) was also associated with increased risks of all-cause mortality (HR, 1.46; 95% CI, 1.10–1.94; E-value = 2.28) and cardiovascular mortality (HR, 1.78; 95% CI, 1.14–2.78; E-value = 3.62) on multivariable analysis (Tables 3, 4 and Figure 1).
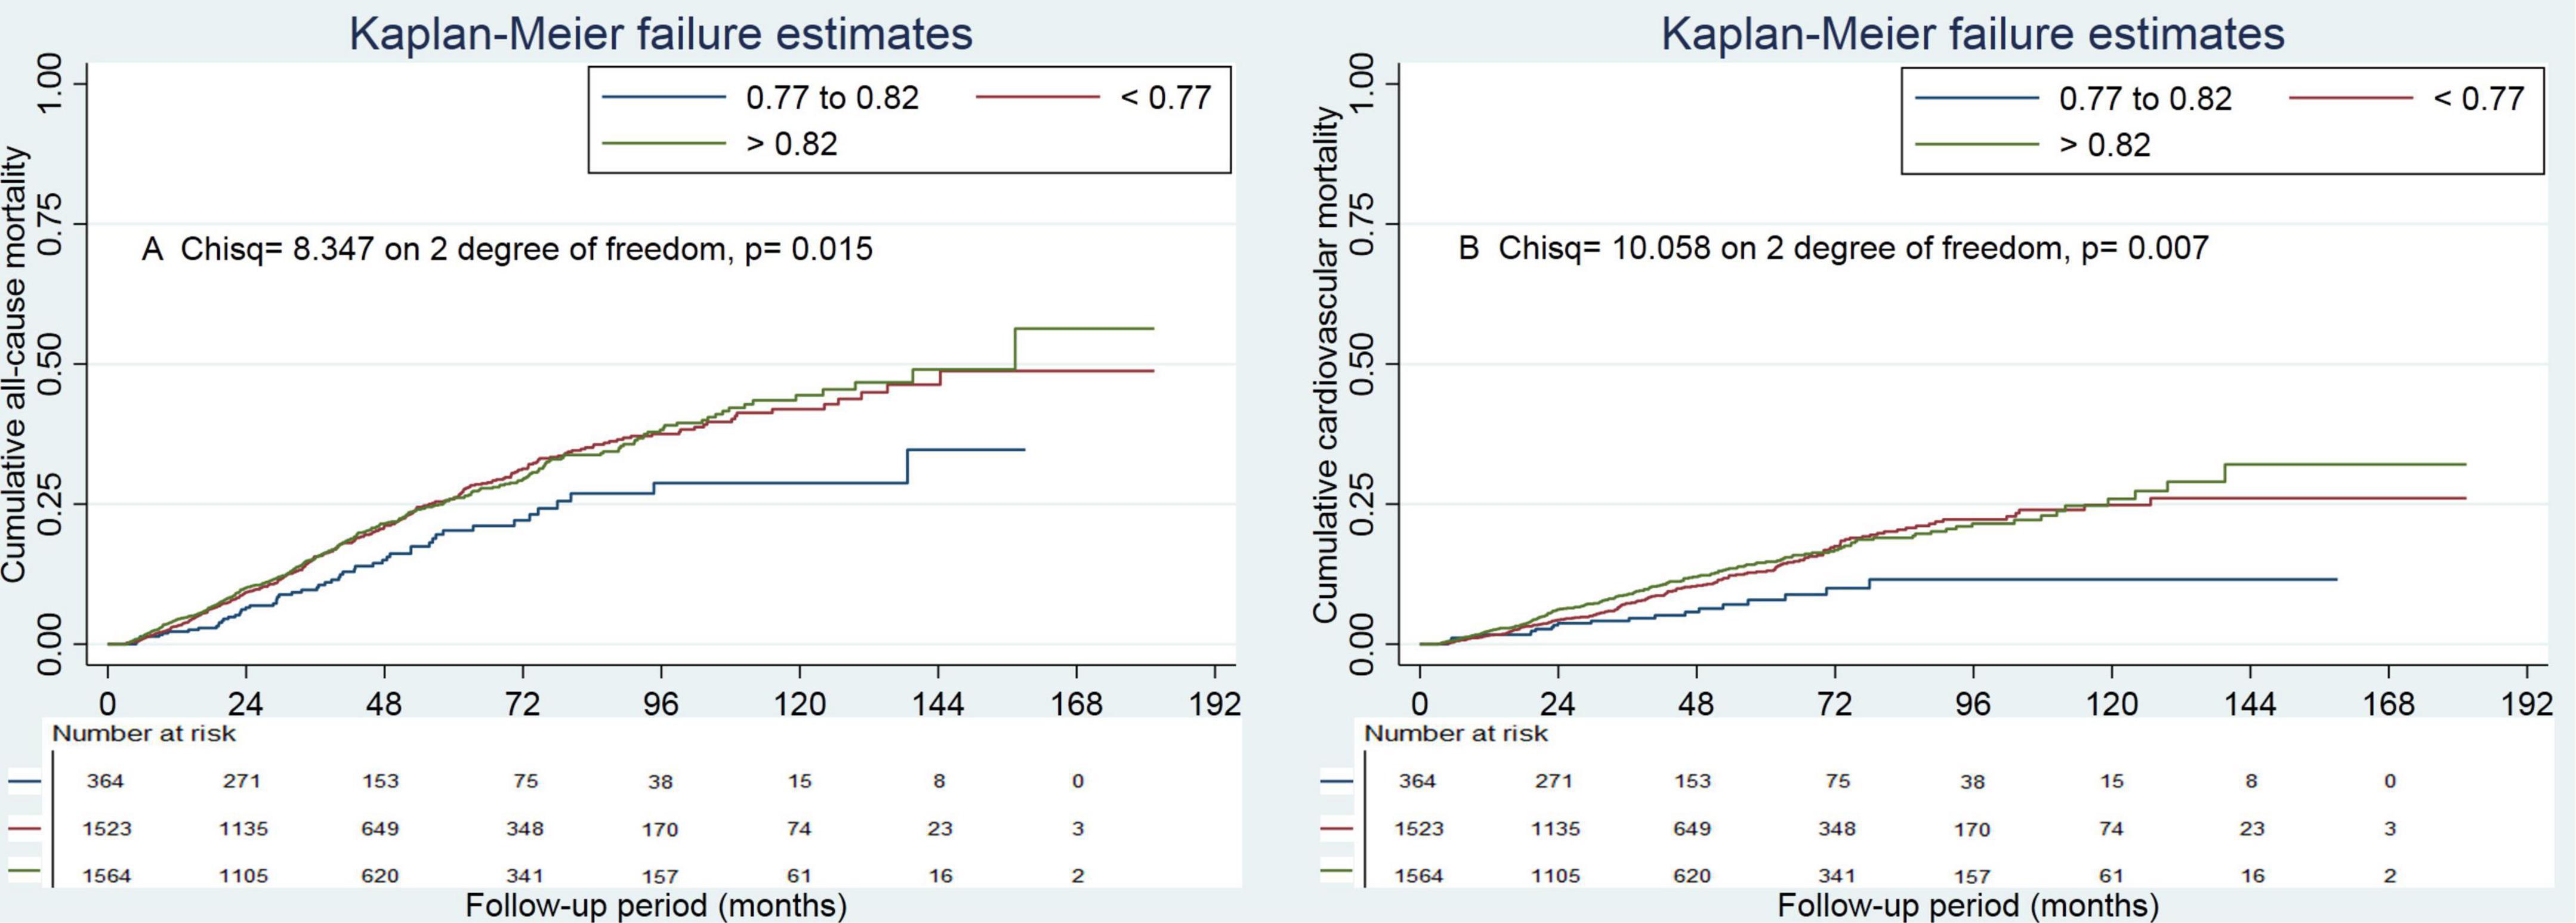
Figure 2. Cumulative mortality by categories of albumin to total cholesterol ratio. Panel (A) showed cumulative all-cause mortality by categories of albumin to total cholesterol ratio. Panel (B) showed cumulative cardiovascular mortality by categories of albumin to total cholesterol ratio.
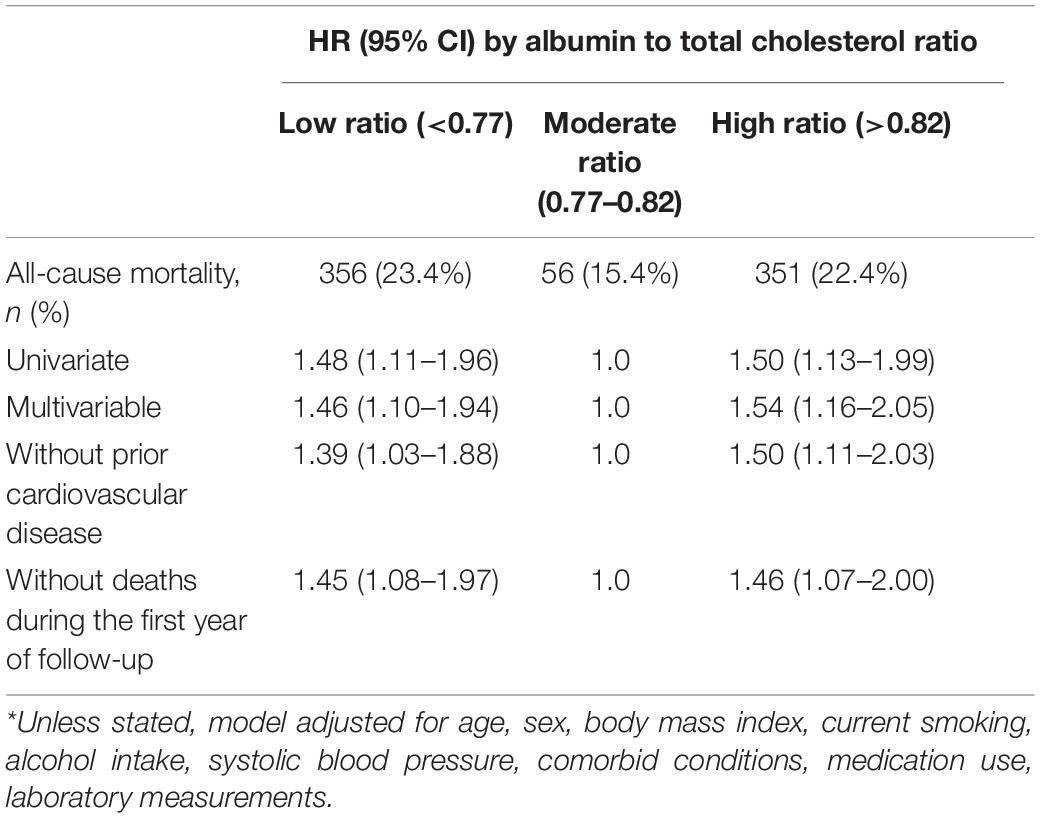
Table 3. Association between albumin to total cholesterol ratio and all-cause mortality*.
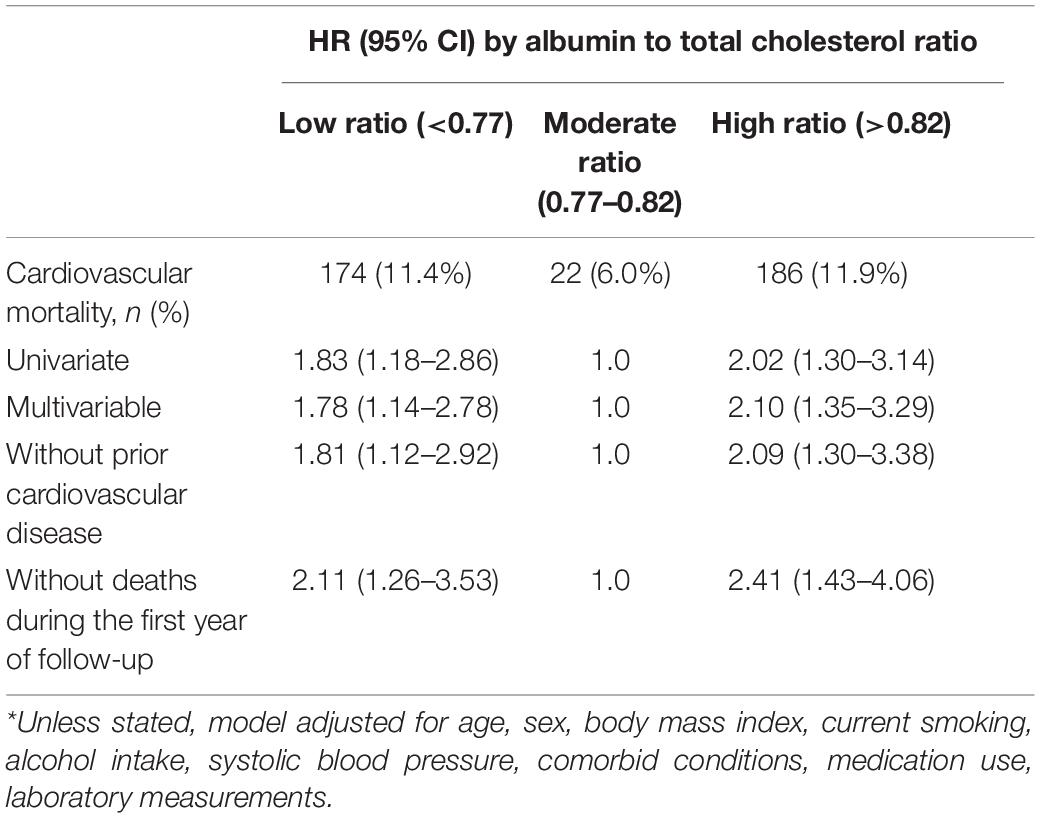
Table 4. Association between albumin to total cholesterol ratio and cardiovascular mortality*.
Subgroup Analysis
There were no significant subgroup interactions (Supplementary Tables 1, 2). Similar findings were observed in subgroup analyses.
Sensitivity Analysis
The exclusion of patients with prior cardiovascular disease or those who died in the first year of follow-up did not materially affect the results from the albumin to total cholesterol ratio analyses (Tables 3, 4).
When considering a transfer to hemodialysis, receiving renal transplantation, transfer to other centers, as well as loss of follow-up as competing risks for all-cause mortality, we found that compared with the moderate group, the high and low groups were associated with 1.50 (95% CI, 1.13–1.99; E-value = 2.37) and 1.48 (95% CI, 1.11–1.96; E-value = 2.32) times higher risk of all-cause mortality, respectively (Supplementary Table 3).
In a propensity-score-matched analysis that compared with a moderate level (0.77–0.82), high albumin to total cholesterol ratio (>0.82) was associated with increased risks of all-cause mortality (HR, 1.92; 95% CI, 1.30–2.82) and cardiovascular mortality (HR, 2.43; 95% CI, 1.37–4.30; Table 5). In a similar analysis that as compared with a moderate level, low albumin to total cholesterol ratio (<0.77) was associated with increased risks of all-cause mortality (HR, 1.57; 95% CI, 1.08–2.30) and cardiovascular mortality (HR, 1.97; 95% CI, 1.15–3.39; Table 5).
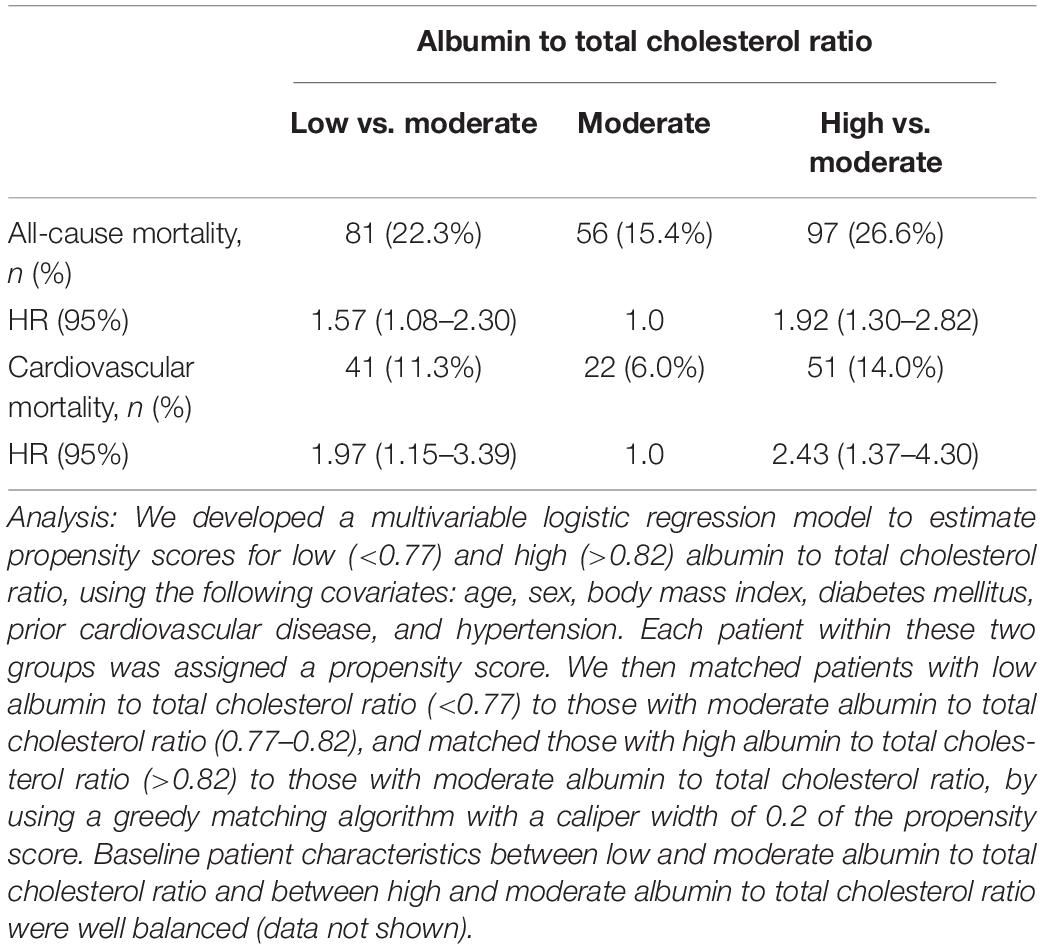
Table 5. Propensity score-based matched analysis for comparison of low to moderate albumin to total cholesterol ratio and high to moderate albumin to total cholesterol ratio.
Discussion
In this large, retrospective cohort study, we found the lowest risk of death among patients with albumin to total cholesterol ratio between 0.77 and 0.82. Both higher and lower albumin levels to total cholesterol ratio were associated with increased risk, resulting in a U-shaped association curve. Notably, although patients with higher albumin to cholesterol ratio at baseline were younger and less likely to present with comorbidities than those with a moderate ratio, they remained to be at higher risk of death, suggesting that lower levels of total cholesterol may be more strongly associated with a poorer prognosis in PD patients.
As we know, low serum albumin is associated with high mortality in patients with end-stage renal disease (ESRD) on chronic dialysis. A prospective cohort study of 680 consecutive CAPD patients in 14 centers in Canada and the United States reported that each 1 g/dL increase in the plasma albumin concentration was associated with a decrease in the relative risk of death by 6% (23). Another previous study with more than 8000 hemodialysis patients having low albumin also reported that of the laboratory variables, low serum albumin less than 4.0 g/dL was most highly associated with death probability (14). Similar results also were observed in other studies (11–13). There is a graded relationship between total cholesterol concentration and coronary risk among general patients, and the absolute risk is greater in those with prior manifestations of coronary heart disease (24).
However, the relationship is not the same in dialysis patients. A prospective cohort of 1167 chronic hemodialysis patients found that hypocholesterolemia (<3.6 mmol/L) was an independent predictor of death in hemodialysis patients (15). Serum total cholesterol was a significant predictor of death with an adjusted HR (95% CI) was 0.94 (0.89–0.99). Similarly, other studies also found similar results (14, 16, 17). Thus, there is pending a question: among dialysis patients combining lower serum albumin and higher serum total cholesterol, how is the prognosis? More importantly, many dialysis patients have the conditions above in clinical settings. Therefore, we need a variable combining serum albumin and total cholesterol to examine the association. Based on previous studies (18, 25), we considered the albumin to total cholesterol ratio an optimal variable.
An early study reported that the total cholesterol to albumin ratio could be used as an alternative parameter in predicting the risk of cardiovascular disease in 30 patients with a history of cardiovascular disease, with 5.0 as a cutoff value (18). Another early study found that replacing total cholesterol to HDL with total cholesterol to albumin in general outpatients was likely to weaken the relation with coronary heart disease (25). However, in recent decades, no study has further examined the association between serum albumin to total cholesterol ratio and prognosis in any specific population. In the present study, we first reported the association between albumin to total cholesterol ratio and mortality in PD patients. We found a U-shaped association between albumin to total cholesterol ratio and mortality. Our results were robust because we showed consistent results, even after adjusting for confounding factors or balancing baseline characteristics using propensity-score-matched analysis or sensitivity analysis.
Previous studies have reported that lower serum albumin is associated with a higher risk of mortality (11–13), and higher cholesterol levels have been consistently associated with lower mortality in dialysis patients (14–17). Thus, lower albumin to total cholesterol ratio was associated with an increased risk of mortality, suggesting that patients with lower albumin and higher total cholesterol may have a poorer prognosis. These findings suggested that the effect power of lower albumin levels on mortality was more potent than that of higher total cholesterol on mortality. Similarity, higher albumin to total cholesterol was also associated with increased risk mortality, suggesting that patients with higher albumin and lower total cholesterol may have a poorer prognosis. These findings also suggested that the effect power of lower total cholesterol on mortality was more potent than that of higher albumin on mortality. Needless to say, a large prospective study needs to be conducted to identify our findings and speculation.
An earlier study of 823 dialysis patients reported hypercholesterolemia is a risk factor for all-cause and cardiovascular mortality. This association was masked among those with malnutrition (26). In this study, an inverse association of cholesterol levels with all-cause mortality and a U-shaped relationship with cardiovascular mortality were observed in malnutrition, whereas a strong, graded, positive association of total cholesterol with all-cause and cardiovascular mortality in the absence of malnutrition. In the present study, we did not find that malnutrition masked the association of albumin to total cholesterol ratio with all-cause and cardiovascular mortality.
Strengths include a large number of patients, the high integrity of the data, and the availability of detailed covariates that can be adjusted for a wide range of potential confounders. In this study, several limitations should be acknowledged, and findings should be interpreted with these carefully. First, because this was an observational study, the possibility of residual confounding from unmeasured variables was a potential limitation. We used the E-value analysis to examine the possibility. For example, even a substantial confounding effect (HR ≥2.45) would require a significant imbalance between the high and moderate albumin-to-total cholesterol ratio categories to result in an adjusted HR below 1.0. Weaker confounders cannot do this. Our study had adjusted for these traditional strong confounders such as age, current smoker, current alcohol use, diabetes mellitus, prior cardiovascular disease, and hypertension. In addition, we used propensity score-matched analyses to actively control confounding variables. Second, we only analyzed the albumin to total cholesterol ratio at the initiation of PD. The single albumin to total cholesterol ratio measurement at baseline may have underestimated the association due to regression dilution bias (27). Notably, regression dilution bias may in part lead to over-adjustment (28). Nonetheless, serial measurements could provide more information than a single measurement. Third, missing values were replaced by the most recent available deals of the first PD, not using multiple imputations. Although multiple imputations can randomly fill in these missing values, the latest available value may represent the clinical status more appropriately. Lastly, all eligible patients were from China, suggesting that the findings may lack general applicability to other ethnic groups. In addition, automated PD may lead to a significant decline in serum albumin and higher total cholesterol levels (29, 30). Thus our results were also not generalizable in patients on a cycler.
In summary, lower or higher albumin to total cholesterol ratio before the first PD was associated with increased mortality, resulting in a U-shaped association. Although the underlying mechanisms are unclear, using an inexpensive and readily available biochemical biomarker, serum albumin to total cholesterol ratio, may improve the stratification risk of mortality in PD patients.
Data Availability Statement
The raw data supporting the conclusions of this article will be made available by the authors, without undue reservation.
Ethics Statement
The studies involving human participants were reviewed and approved by the Ethics Committee of The First Affiliated Hospital of Zhengzhou University, Zhengzhou, China; The Ethics Committee of The First Affiliated Hospital of Nanchang University, Nanchang, China; The Ethics Committee of Jiujiang No. 1 People’s Hospital, Jiujiang, China; The Ethics Committee of Zhujiang Hospital of Southern Medical University, Guangzhou, China; The Ethics Committee of The Second Affiliated Hospital of Guangzhou Medical University, Guangzhou, China. Written informed consent for participation was not required for this study in accordance with the national legislation and the institutional requirements.
Author Contributions
XFW and JM: conceptualization. XFW, JW, and JM: methodology. XFW, JM, and LZ: software. JW: validation. XYW and XZ: formal analysis and investigation. XYW, XZ, FP, YW, and XF: resources. NW: data curation. JM: writing – original draft preparation. XFW and JW: writing – review and editing. All authors contributed to the article and approved the submitted version.
Funding
This work was supported by the National Natural Science Foundation of China (81870487) and Natural Science Foundation of Zhejiang Province (LSY19H050001).
Conflict of Interest
The authors declare that the research was conducted in the absence of any commercial or financial relationships that could be construed as a potential conflict of interest.
Publisher’s Note
All claims expressed in this article are solely those of the authors and do not necessarily represent those of their affiliated organizations, or those of the publisher, the editors and the reviewers. Any product that may be evaluated in this article, or claim that may be made by its manufacturer, is not guaranteed or endorsed by the publisher.
Acknowledgments
We express our gratitude to all patients who participated in the study.
Supplementary Material
The Supplementary Material for this article can be found online at: https://www.frontiersin.org/articles/10.3389/fmed.2022.896443/full#supplementary-material
References
1. Marckmann P. Nutritional status of patients on hemodialysis and peritoneal dialysis. Clin Nephrol. (1988) 29:75–8.
2. Young GA, Kopple JD, Lindholm B, Vonesh EF, De Vecchi A, Scalamogna A, et al. Nutritional assessment of continuous ambulatory peritoneal dialysis patients: an international study. Am J Kidney Dis. (1991) 17:462–71. doi: 10.1016/s0272-6386(12)80642-1
3. Teehan BP, Schleifer CR, Brown JM, Sigler MH, Raimondo J. Urea kinetic analysis and clinical outcome on CAPD. A five year longitudinal study. Adv Perit Dial. (1990) 6:181–5.
4. Rocco MV, Jordan JR, Burkart JM. The efficacy number as a predictor of morbidity and mortality in peritoneal dialysis patients. J Am Soc Nephrol. (1993) 4:1184–91. doi: 10.1681/ASN.V451184
5. Keshaviah PR, Nolph KD, Moore HL, Prowant B, Emerson PF, Meyer M, et al. Lean body mass estimation by creatinine kinetics. J Am Soc Nephrol. (1994) 4:1475–85. doi: 10.1681/ASN.V471475
6. Centers for Medicare and Medicaid Services, Kinney R. 2005 Annual Report: ESRD clinical performance measures project. Am J Kidney Dis. (2006) 48:S1–106. doi: 10.1053/j.ajkd.2006.07.015
7. Mehrotra R, Duong U, Jiwakanon S, Kovesdy CP, Moran J, Kopple JD, et al. Serum albumin as a predictor of mortality in peritoneal dialysis: comparisons with hemodialysis. Am J Kidney Dis. (2011) 58:418–28. doi: 10.1053/j.ajkd.2011.03.018
8. Prasad N, Gupta A, Sinha A, Sharma RK, Kumar A, Kumar R. Changes in nutritional status on follow-up of an incident cohort of continuous ambulatory peritoneal dialysis patients. J Ren Nutr. (2008) 18:195–201. doi: 10.1053/j.jrn.2007.08.002
9. Shin JH, Kim CR, Park KH, Hwang JH, Kim SH. Predicting clinical outcomes using phase angle as assessed by bioelectrical impedance analysis in maintenance hemodialysis patients. Nutrition. (2017) 41:7–13. doi: 10.1016/j.nut.2017.02.013
10. Chen HY, Tsai WC, Chiu YL, Hsu SP, Pai MF, Yang JY, et al. Triglyceride to high-density lipoprotein cholesterol ratio predicts cardiovascular outcomes in prevalent dialysis patients. Medicine (Baltimore). (2015) 94:e619. doi: 10.1097/MD.0000000000000619
11. Avram MM, Fein PA, Bonomini L, Mittman N, Loutoby R, Avram DK, et al. Predictors of survival in continuous ambulatory peritoneal dialysis patients: a five-year prospective study. Perit Dial Int. (1996) 16(Suppl. 1):S190–4.
12. Jones CH, Newstead CG, Wills EJ, Davison AM. Serum albumin and survival in CAPD patients: the implications of concentration trends over time. Nephrol Dial Transplant. (1997) 12:554–8. doi: 10.1093/ndt/12.3.554
13. Sharma AP, Gupta A, Sharma RK, Agarwal DK, Sural S, Wardhe DJ. Does serum albumin at start of continuous ambulatory peritoneal dialysis (CAPD) or its drop during CAPD determine patient outcome? Adv Perit Dial. (2000) 16:119–22.
14. Lowrie EG, Lew NL. Death risk in hemodialysis patients: the predictive value of commonly measured variables and an evaluation of death rate differences between facilities. Am J Kidney Dis. (1990) 15:458–82. doi: 10.1016/s0272-6386(12)70364-5
15. Iseki K, Yamazato M, Tozawa M, Takishita S. Hypocholesterolemia is a significant predictor of death in a cohort of chronic hemodialysis patients. Kidney Int. (2002) 61:1887–93. doi: 10.1046/j.1523-1755.2002.00324.x
16. Coresh J, Longenecker JC, Miller ER III, Young HJ, Klag MJ. Epidemiology of cardiovascular risk factors in chronic renal disease. J Am Soc Nephrol. (1998) 9(Suppl. 12):S24–30.
17. Keane WF, Lyle PA. Reduction of Endpoints in NwtAIIRALs. Recent advances in management of type 2 diabetes and nephropathy: lessons from the RENAAL study. Am J Kidney Dis. (2003) 41:S22–5. doi: 10.1053/ajkd.2003.50078
18. Atukorala TM, Gunarathne PH, Ekanayake RA. Total cholesterol: albumin ratio as an alternative indicator of risk of cardiovascular disease. Ceylon Med J. (1986) 31:161–4.
19. Zhou L, Wang X, Zhan X, Feng X, Wang N, Peng F, et al. Serum chloride and mortality in patients on continuous ambulatory peritoneal dialysis: a multi-center retrospective study. EClinicalMedicine. (2021) 41:101133. doi: 10.1016/j.eclinm.2021.101133
20. LaVange LM, Stearns SC, Lafata JE, Koch GG, Shah BV. Innovative strategies using SUDAAN for analysis of health surveys with complex samples. Stat Methods Med Res. (1996) 5:311–29. doi: 10.1177/096228029600500306
21. VanderWeele TJ, Ding P. Sensitivity analysis in observational research: introducing the E-value. Ann Intern Med. (2017) 167:268–74. doi: 10.7326/M16-2607
22. Austin PC. Optimal caliper widths for propensity-score matching when estimating differences in means and differences in proportions in observational studies. Pharm Stat. (2011) 10:150–61. doi: 10.1002/pst.433
23. David N, Churchill D, Taylor W, Prakash Keshaviah R, Kevin E, et al. Adequacy of dialysis and nutrition in continuous peritoneal dialysis: association with clinical outcomes. Canada-USA (CANUSA) peritoneal dialysis study group. J Am Soc Nephrol. (1996) 7:198–207. doi: 10.1681/ASN.V72198
24. Michos ED, McEvoy JW, Blumenthal RS. Lipid management for the prevention of atherosclerotic cardiovascular disease. N Engl J Med. (2019) 381:1557–67. doi: 10.1056/NEJMra1806939
25. Mulder C, Bezemer PD, Van Leeuwen C, Schouten JA. Is the ratio of total cholesterol to albumin useful as a predictor for the risk of coronary heart disease? J Clin Pathol. (1985) 38:961–2. doi: 10.1136/jcp.38.8.961-b
26. Liu Y, Coresh J, Eustace JA, Longenecker JC, Jaar B, Fink NE, et al. Association between cholesterol level and mortality in dialysis patients: role of inflammation and malnutrition. JAMA. (2004) 291:451–9. doi: 10.1001/jama.291.4.451
27. MacMahon S, Peto R, Cutler J, Collins R, Sorlie P, Neaton J, et al. Blood pressure, stroke, and coronary heart disease. Part 1, prolonged differences in blood pressure: prospective observational studies corrected for the regression dilution bias. Lancet. (1990) 335:765–74. doi: 10.1016/0140-6736(90)90878-9
28. O’Donnell MJ, Yusuf S, Mente A, Gao P, Mann JF, Teo K, et al. Urinary sodium and potassium excretion and risk of cardiovascular events. JAMA. (2011) 306:2229–38. doi: 10.1001/jama.2011.1729
29. Liu S, Zhuang X, Zhang M, Wu Y, Liu M, Guan S, et al. Application of automated peritoneal dialysis in urgent-start peritoneal dialysis patients during the break-in period. Int Urol Nephrol. (2018) 50:541–9. doi: 10.1007/s11255-018-1785-1
Keywords: albumin to total cholesterol ratio, mortality, peritoneal dialysis, cardiovascular, prognosis
Citation: Wu X, Meng J, Zhou L, Zhan X, Wen Y, Wang X, Feng X, Wang N, Peng F and Wu J (2022) Albumin to Total Cholesterol Ratio and Mortality in Peritoneal Dialysis. Front. Med. 9:896443. doi: 10.3389/fmed.2022.896443
Received: 15 March 2022; Accepted: 09 May 2022;
Published: 09 June 2022.
Edited by:
Robert P. Woroniecki, Stony Brook Children’s Hospital, United StatesReviewed by:
Maria-Eleni Roumelioti, University of New Mexico, United StatesNatalia M. Stepanova, SI “Institute of Nephrology National Academy of Medical Science of Ukraine”, Ukraine
Copyright © 2022 Wu, Meng, Zhou, Zhan, Wen, Wang, Feng, Wang, Peng and Wu. This is an open-access article distributed under the terms of the Creative Commons Attribution License (CC BY). The use, distribution or reproduction in other forums is permitted, provided the original author(s) and the copyright owner(s) are credited and that the original publication in this journal is cited, in accordance with accepted academic practice. No use, distribution or reproduction is permitted which does not comply with these terms.
*Correspondence: Xianfeng Wu, eGlhbmZlbmd3dTJAMTYzLmNvbQ==; Junnan Wu, anVubmFuLnd1QHpqdS5lZHUuY24=
†These authors have contributed equally to this work and share first authorship