 Sanu Susan Jacob1*
 Jijo Lukose2
 Aseefhali Bankapur2N. Mithun2
 R. Vani Lakshmi3Mahendra Acharya2Pragna Rao4Asha Kamath3Prathap M. Baby5Raghavendra K. Rao1
 Santhosh Chidangil2
- 1Department of Physiology, Kasturba Medical College, Manipal, Manipal Academy of Higher Education, Manipal, India
- 2Department of Atomic and Molecular Physics, Centre of Excellence for Biophotonics, Manipal Academy of Higher Education, Manipal, India
- 3Department of Data Science, Prasanna School of Public Health, Manipal Academy of Higher Education, Manipal, India
- 4Department of Biochemistry, Kasturba Medical College, Manipal, Manipal Academy of Higher Education, Manipal, India
- 5Department of Physiology, Melaka Manipal Medical College, Manipal Academy of Higher Education, Manipal, India
Malaria, dengue and leptospirosis are three tropical infectious diseases that present with severe hematological derangement causing significant morbidity and mortality, especially during the seasonal monsoons. During the course of these infectious diseases, circulating red blood cells are imperiled to the direct ill-effects of the infectious pathogen in the body as well as to the pro-inflammatory cytokines generated as a consequence of the infection. RBCs when exposed to such inflammatory and/or pathogenic milieu are susceptible to injuries such as RBC programmed eryptosis or RBC programmed necrosis. This research aimed to explore the Raman spectra of live red cells that were extracted from patients infected with malaria, dengue, and leptospirosis. Red cells were optically trapped and micro-Raman probed using a 785 nm Diode laser. RBCs from samples of all three diseases displayed Raman signatures that were significantly altered from the normal/healthy. Distinct spectral markers that were common across all the four groups were obtained from various standardized multivariate analytical methods. Following comprehensive examination of multiple studies, we propose these spectral wavenumbers as “Raman markers of RBC injury.” Findings in our study display that anemia-triggering infections can inflict variations in the healthy status of red cells, easily identifiable by selectively analyzing specific Raman markers. Additionally, this study also highlights relevant statistical tools that can be utilized to study Raman spectral data from biological samples which could help identify the very significant Raman peaks from the spectral band. This approach of RBC analysis can foster a better understanding of red cell behavior and their alterations exhibited in health and disease.
Introduction
Malaria, dengue and leptospirosis are tropical infectious diseases that display overlapping clinical and hematological profiles (1). Malaria and dengue require mosquitos as vectors. While malaria is caused by the Plasmodium parasite, infection by the dengue virus (DENV) causes dengue (2). Leptospirosis is a zoonotic disease caused by the bacterial spirochete Leptospira that enters the bloodstream through open wounds from contaminated soil or water bodies (3). Despite the differing causative agents, anemia remains a common hematological aberration observed in the three infections (4–6).
The Plasmodium parasite utilizes red blood cells (RBCs) to complete its life cycle. This can consequently result in hemolysis, which if excessive, can lead to jaundice and anemia (7). Another mechanism that contributes to anemia in malaria is eryptosis (8). Eryptosis is a physiological event that is programmed in RBCs, solely meant for the elimination of senescent or abnormal RBCs. This phenomenon, however, is seen to be amplified in many diseases and disorders, as in malaria. RBCs in eryptosis exhibit many structural variations comparable to those seen in apoptosis. Among the many characteristics, some striking features of eryptosis include a decrease in RBC volume leading to its shrinkage, membrane blebbing and vesiculation accompanied by diminution of membrane CD47 expression along with phosphatidylserine (PS) scrambling and exposure. PS-displaying-RBCs are identified by splenic macrophages for phagocytosis. This physiological mechanism is significantly favorable than the alternative RBC death, hemolysis. Hemolysis can be damaging to the body as it releases hemoglobin into circulation, which may adhere to the vasculature, initiate thrombosis and pro-inflammatory activities, and if extensive can even obstruct blood vessels (9). Eryptosis in malaria affects both the parasitized as well as the non-infected RBCs, a process that is activated to impede parasitemia (10).
The pathogenesis of leptospirosis though is mediated mainly through sphingomyelinases. Sphingomyelinases can themselves act as eryptotic stimulators, hydrolyzing membrane sphingomyelin into ceramide (11). Some sphingomyelinases function as hemolysins and are known to cause hemolytic jaundice and anemia, such as in sepsis. Sphingomyelinases are also known to cause deleterious inflammatory effects on a multi-organ/system level (12). Yet another kind of programmed RBC death, distinct from eryptosis is programmed RBC necrosis, which is dependent on Fas/FasL signaling, receptor-interacting protein 1 (RIP 1) kinase phosphorylation, and also the mixed-lineage kinase domain-like (MLKL) protein (13). Interestingly, leptospiral infection has been found to activate these signaling mechanisms for hemolysis (14). In contrast to malaria and leptospirosis, dengue has always been associated with platelets and hemorrhagic anemia. However, uncommonly, there have been reports of hemolytic anemia being accompanied by jaundice and reticulocytosis (15, 16). There exists a dearth of knowledge in regards to the effects of dengue infection on RBC physiology. Nevertheless, inducers of eryptosis such as oxidative stress and pro-inflammatory cytokines make strong associations in dengue, as much as they do in malaria and leptospirosis (17).
Jaundice, an unhealthy build-up of bilirubin in the blood, is a frequent finding in malaria, dengue and leptospirosis (18). Hyperbilirubinemia can arise due to hemolysis, liver and/or renal dysfunction. Bilirubin toxicity can itself lead to eryptosis and hemolysis, creating an ambiance for more hyperbilirubinemia (19). The complexity of infection is further intensified with the large legion of cytokines generated during the disease (20, 21). All these factors foster an unhealthy “eryptotic milieu” in circulation providing ample probabilities for the RBC to undergo imbalance in its physiology, if not aberrations (22).
RBCs in circulation can display abnormal composition within a pathological environment even though they may appear intact structurally (23). This study intended to investigate the Raman spectral characteristics and chemometrics of RBCs in malaria, dengue and leptospirosis infections. Since the RBC is a very sensitive cell, even a minuscule change in its environment can lead to a drastic variation in its chemical make-up. Therefore, this study necessitated a tool that recorded RBC biochemistry keeping the corpuscles in a physiological medium and that required less-arduous sample-fixation techniques (24). Processing/fixating chemicals could themselves cause cell modifications. Therefore, we employed an in-house assembled micro-Raman spectroscopy system with optical tweezers to record RBC biochemistry in situ (25). Raman spectroscopy is an established bio-analytical tool capable of measuring even the slightest molecular change with high sensitivity in real-time (26). The method was standardized in RBCs of hyperbilirubinemic samples wherein the Raman markers that characterized significant variation from the normal were identified and classified using numerous multivariate analytical tests. A detailed description of the technique is available in an earlier article (27).
Materials and methods
Ethics statement
This study was approved (IEC 02/2002) by the Institutional Ethics Committee of Kasturba Medical College, Manipal Academy of Higher Education, Manipal and all experimental procedures conformed with the Ethical Committee guidelines. Written informed consent was obtained from all the volunteers. Blood samples of malaria, dengue and leptospirosis patients were collected from the laboratory of Clinical Hematology. The requirement for informed consent was waived concerning the acquisition of patients’ samples.
Blood sample collection and red blood cell preparation
Four milliliter anticoagulated blood samples were collected from healthy volunteers (n = 10), and patients confirmed with malaria (n = 10), dengue (n = 10) and leptospirosis (n = 10) from the laboratory of Clinical Hematology, Kasturba Hospital-Manipal. Blood samples were centrifuged (Labnet Spectrafuge 7M) at 5,000 rpm for 5 min. Following centrifugation, plasma and buffy-coat were aspirated out. 1 μL Hct was pipetted out and suspended in an Eppendorf tube containing 2 mL PBS (Sigma Aldrich, India). 1 μL of RBC suspension in PBS was pipetted onto the sample chamber of the experimental set-up.
A total of 333 raw spectra were recorded from 333 individual RBCs, of which 68 spectra were recorded from the blood samples of healthy volunteers, 97 from that of patients with malaria, 80 from patients with dengue and 88 from patients with leptospirosis.
Experimental set-up
The schematic representation of the single-beam micro-Raman spectrometer combined with optical tweezers has been presented in Figure 1. This tool encompasses an inverted microscope (Nikon Eclipse Ti-U, Japan) coupled with a 785 nm wavelength-emitting diode laser (Starbright Diode Laser, Denmark) and a spectrograph (Horiba Jobin Yvon iHR320). The expanded laser beam overfills the back aperture of a 100 X, 1.3NA oil immersion objective lens (Nikon, Plan Fluor) that creates a well-defined focal spot at the sample plane. RBCs suspended in PBS were optically trapped beneath this focal spot and concurrently Raman-excited. Scattered light from individual RBCs was collected from this same objective and fed into the spectrograph with f-matching optics. The spectrograph was equipped with a grating of dimension 1,200 groves/mm and a liquid nitrogen-cooled charged couple device (Symphony CCD-1,024 × 256-OPEN-1LS) detector of 1,024 × 256 pixels. The removal of Rayleigh scattered light was accomplished by placing an optical edge filter (Razor edge LP02-785RU-25, Semrock, USA) in front of the spectrograph. A detailed account of the experimental arrangement has been previously published (27, 28).
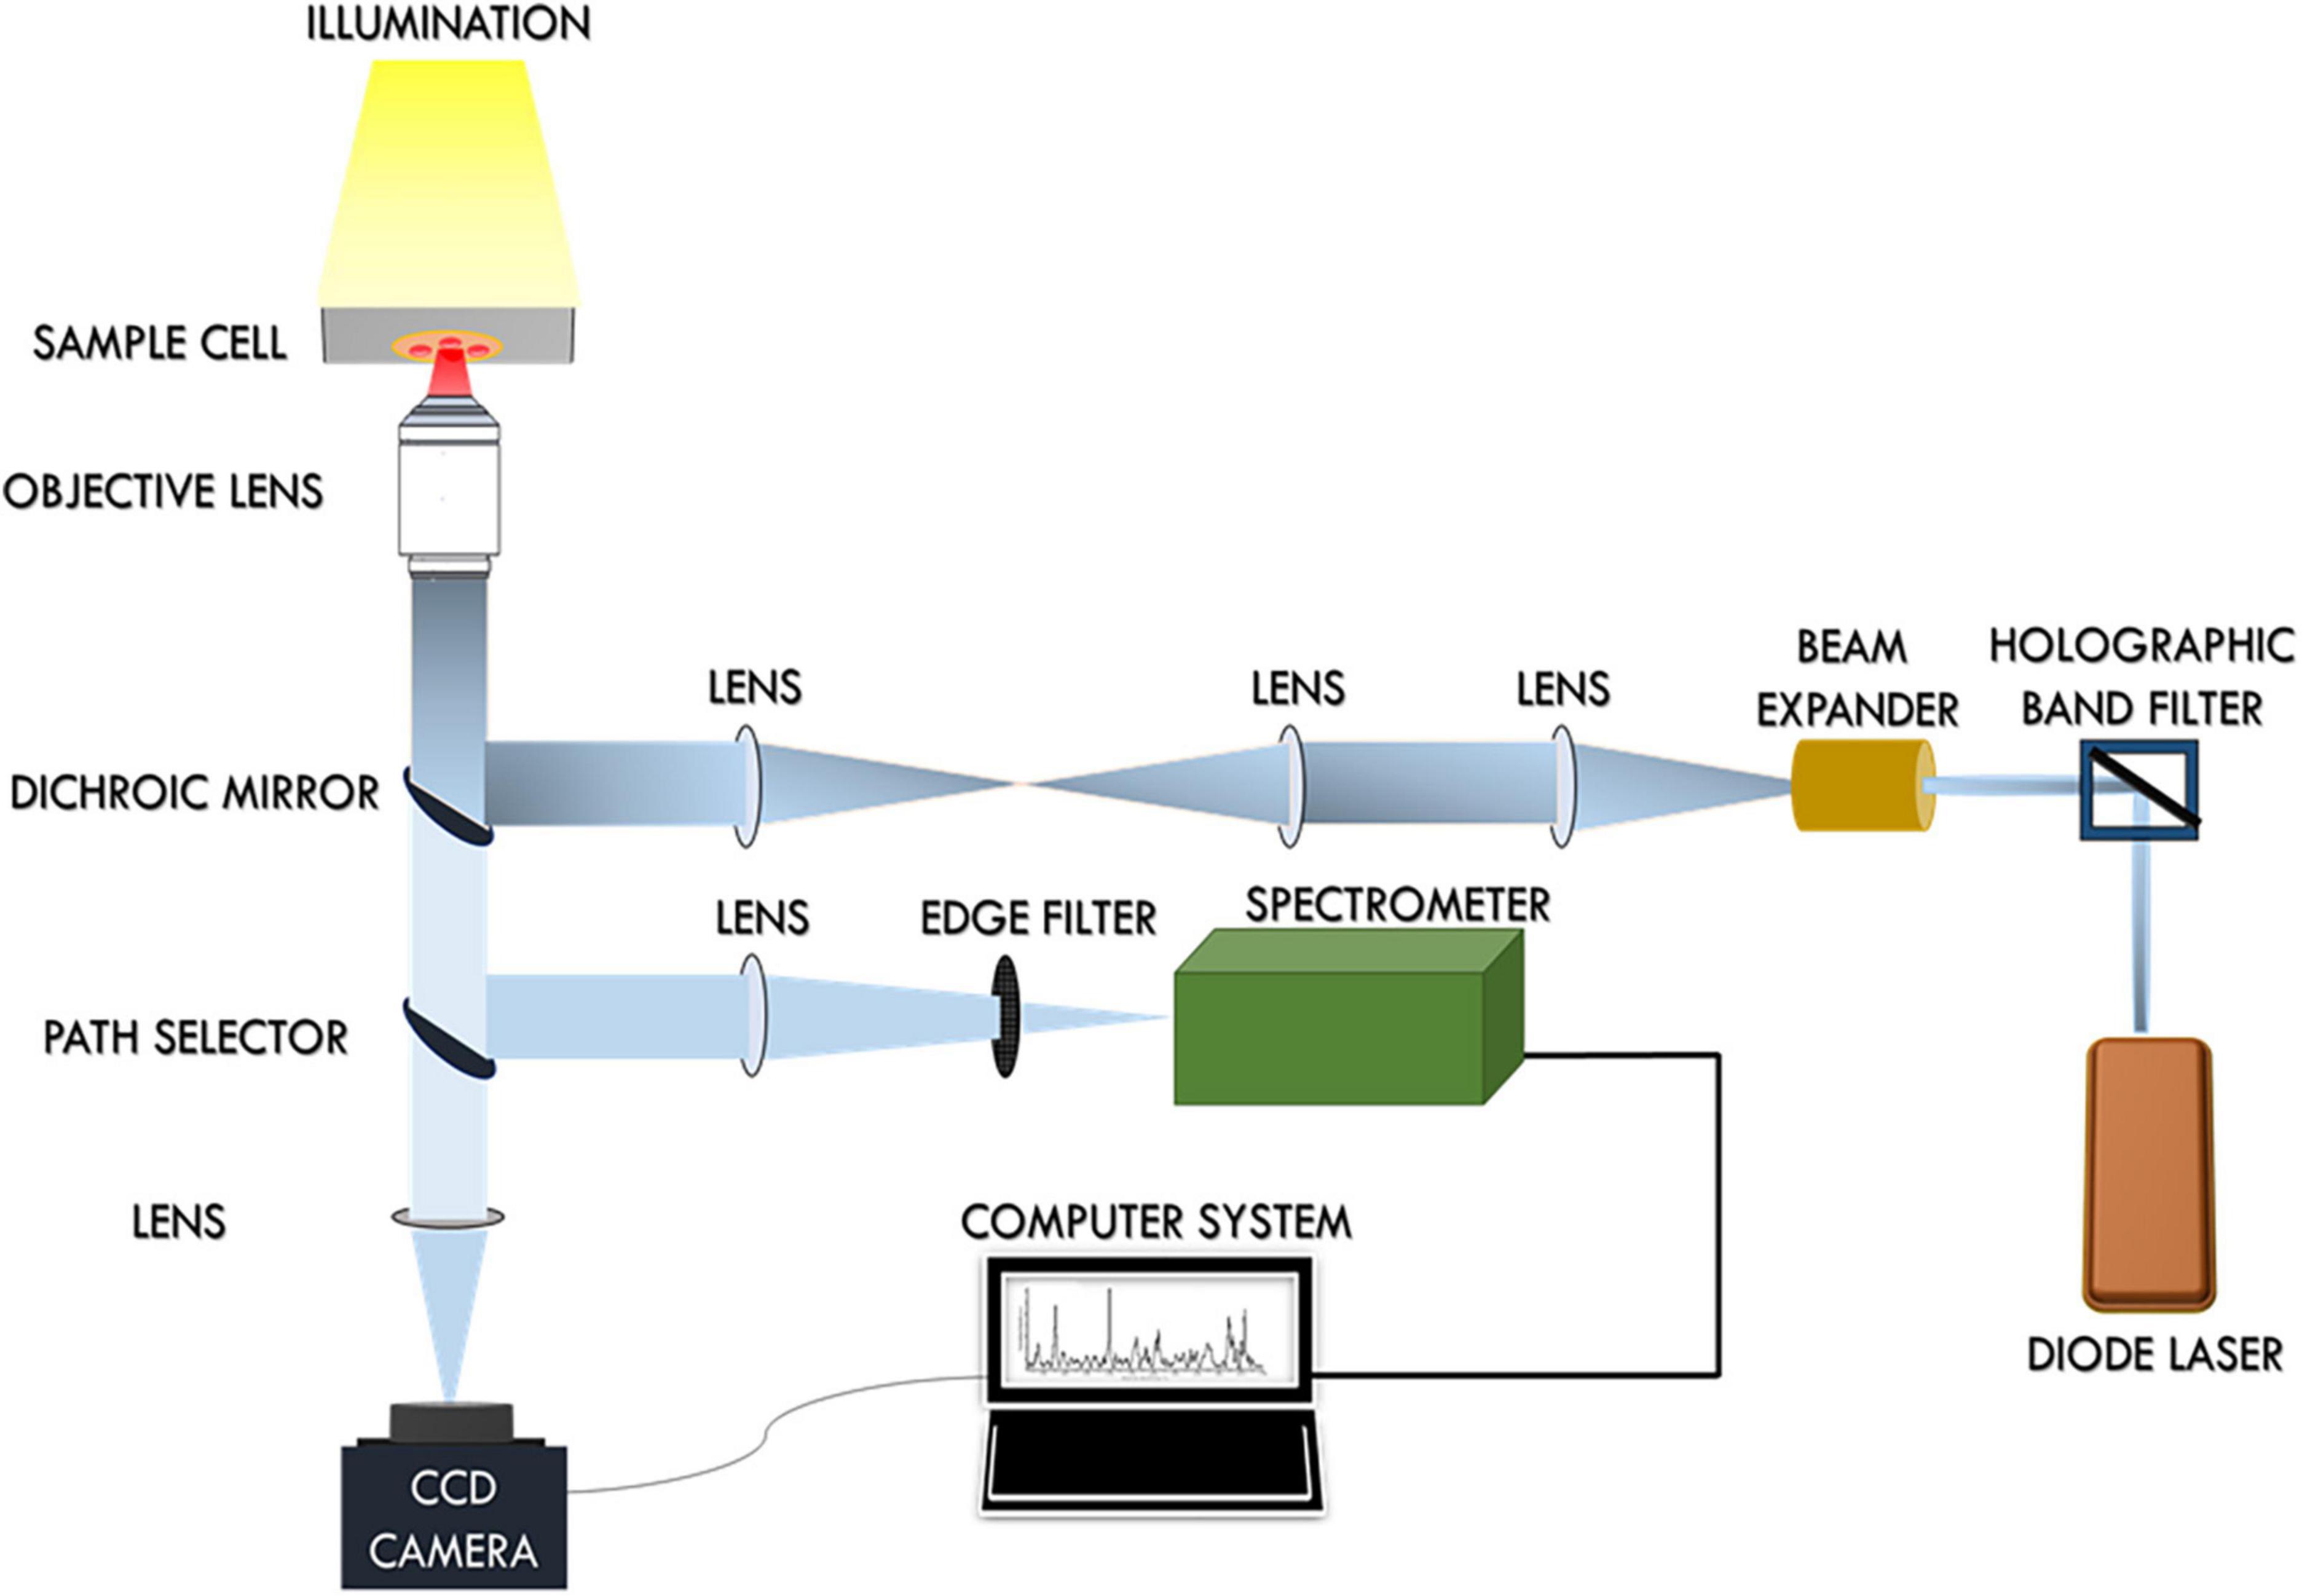
Figure 1. Schematic diagram of the Raman Tweezers set up.
Data acquisition
The Raman Tweezers setup was employed to optically immobilize and probe RBCs using a 785 nm diode laser. The excitation power of the laser beam was set at ∼10 mW. RBCs were held at focus by adjusting the manual stage. Two accumulations were recorded with an acquisition time of 60 s from each RBC. RBC Spectra were recorded from the fingerprint region (550–1,700 cm–1) and further analyzed.
Data pre-processing
Pre-processing of the accumulated raw RBC spectra was carried out utilizing three software programs, namely, Origin (OriginLab Corp., Northampton, MA) and MATLAB (MATLAB® 7.0).
Pre-processing events comprised omission of spurious noises and cosmic spikes, smoothening of the raw Raman spectra, baseline correction, and vector normalization. The data points that corresponded to cosmic spikes were deleted and further spectral smoothening was performed using the software “Origin.” Spectral baseline correction and normalization were carried out in MATLAB. The second-order polynomial Savitzky-Golay moving-average-technique was employed for spectral smoothening and a two-norm standard-vector normalization technique was employed for normalization (29). The asymmetric Least Squares (AsLS) fitting approach (30) was followed for baseline correction.
Statistical analysis
Multivariate data analysis was implemented using GRAMS-AI (Grams/AI, PLS Plus IQ) and CRAN R 3.6.1 (© 2019 The R Foundation for Statistical Computing) packages.
Partial least-squares discriminant analysis and factor analysis
Partial least-squares discriminant analysis (PLS-DA) of the intensity scores of Raman wavenumbers across the healthy and infectious samples facilitated the extraction of the principal components (PCs). Following this, factor load analysis, which is yet another dimensionality-reduction statistical approach, was implemented on the PCs. Both these tests were carried out using GRAMS spectroscopy software and aided the classification/categorization of the healthy and the three disease samples.
MANOVA
The statistically significant difference in the mean value of the Raman intensity scores across the four groups was verified using a non-parametric variant of MANOVA. This analysis was done using CRAN R-3.6.1 with heplots (31), npmv (32), and MVN (33) packages. To enable multiple comparisons, a paired Wilcoxon post-hoc test with Bonferonni correction was implemented. The level of significance was set at 0.05 throughout the study.
PCA of the significantly different Raman peaks
Subsequently, a PCA was run on the intensity scores of only those wavenumbers that displayed a significant difference in MANOVA. This step was conducted to appreciate the degree of variance between the groups.
Factor analysis of principal component
A repeat factor analysis was performed on the PC scores of the healthy and each of the three disease groups. This test displayed a significant distinction between the healthy and each of the disease groups individually.
Results
Raman spectra of red blood cells from healthy and disease blood samples
Figure 2A gives the averaged Raman spectra of the healthy and the three disease groups separately. The spectral bands were assigned as was described in earlier studies (34–36) and the details of the vibrational assignments and their variations have been outlined in Table 1. RBCs comprise predominantly of the Hb protein, and hence the spectral records were principally the Raman signatures that emerged from heme. Additionally, contributions from other organic components such as aromatic amino acids, amide bonds and –CH/-CH2 side-chains of globular proteins were also obtained that had their origins from the RBC membrane.
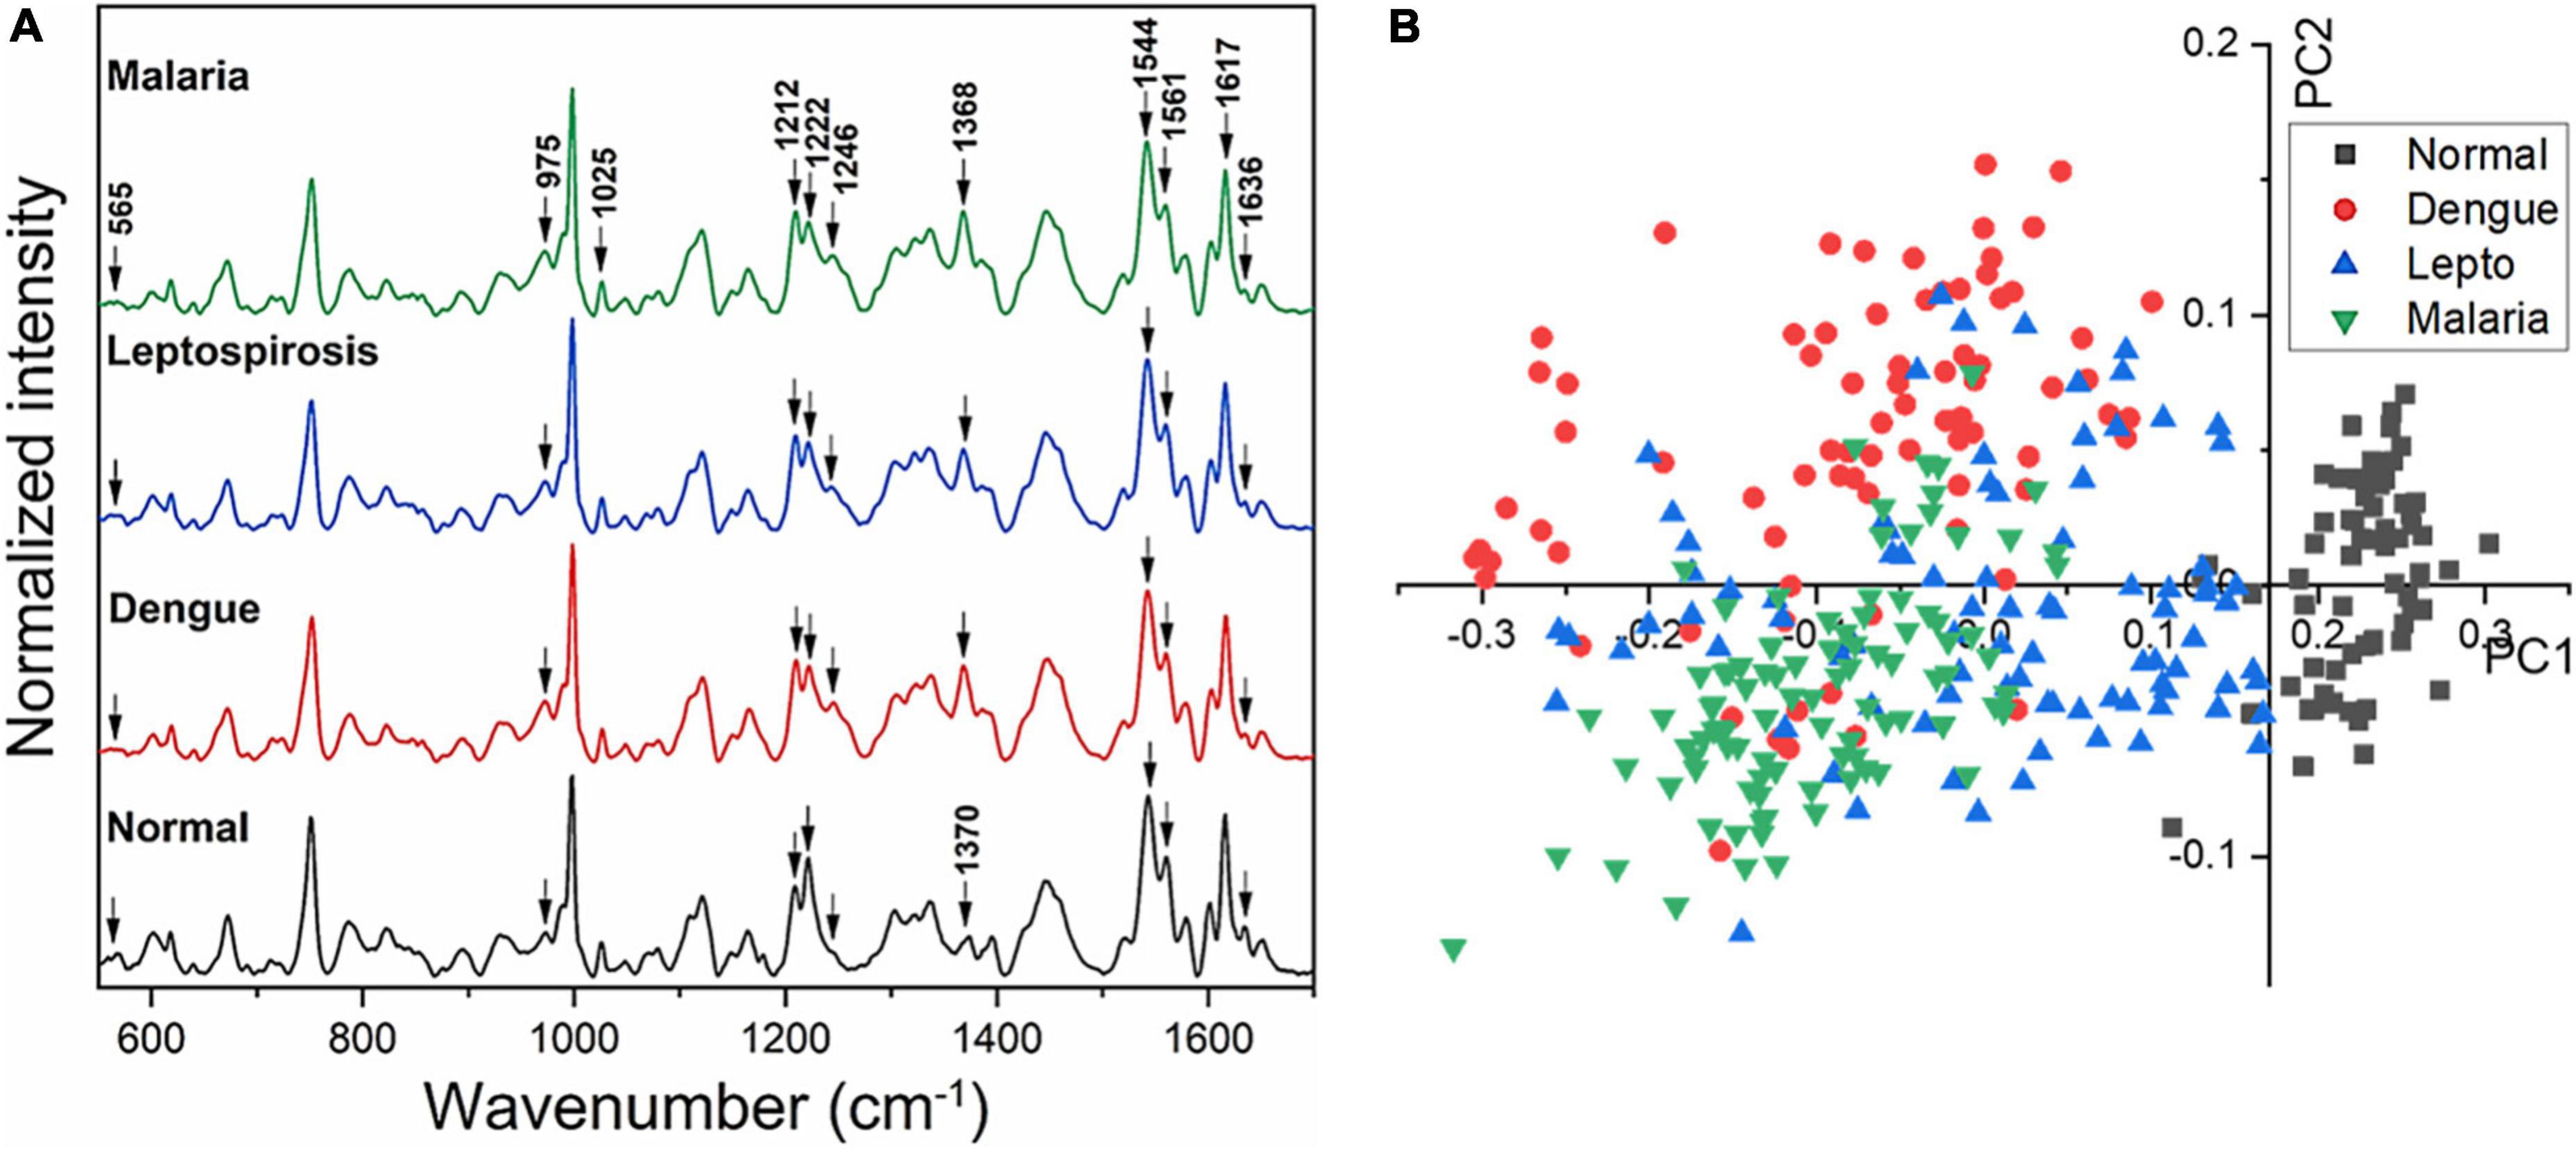
Figure 2. (A) Averaged Raman spectra of RBCs from blood samples of healthy volunteers and patients with malaria, dengue and leptospirosis and (B) PLS-DA score plot of the first two PCs between RBCs of healthy and the disease samples.
Table 1. Assignments of the significantly different Raman peaks of RBCs from healthy and the three disease samples that were detected through spectral analysis.
The averaged spectra between the healthy and the three disease groups revealed numerous variances that encompassed intensity changes and frequency shifts. The common variations exhibited by the RBCs of the disease groups was an increase in intensity of Raman frequencies at 975, 999, 1,049, 1,212, 1,246, 1,258, 1,264, 1,389, and 1,460 cm–1 and a decrease in intensity at frequencies 565, 752, 999, 1,080, 1,222, 1,524, 1,544, 1,561, 1,602, 1,617, and 1,636 cm–1 when compared to those from RBCs of the healthy group.
Multivariate partial least-squares discriminant analysis and factor analysis approach
Figure 2B displays the two-dimensional plot of the first two PCs: PC1 and PC2, from the healthy and the three disease groups. This score-plot, generated by Grams IQ, exhibited a clear distinction between the healthy and the three infectious disease groups, indicating that RBCs can be distinguished as “healthy” or “stressed due to a state of disease.” The bi-plot also indicated the existence of certain overlapping PC scores among the disease groups. This implies that despite the three different pathologies, there occurred similarity in the response imparted by the “stressed” RBCs, at least with regards to Raman scattering. Among the three disease groups, the scores of the leptospirosis group exhibited much more variance than those shown by malaria and dengue groups.
We then proceeded to estimate the degree of variance in the Raman intensity scores. In terms of variations in the PCs too substantial differences existed for the classification of RBCs as healthy or “stressed/altered.” The variance captured in this approach, taking into account all the wavenumbers in the spectra, across the four groups, was 52.26%.
Subsequently, a factor load analysis of the spectral data was performed. The results (Figure 3) exhibited that all the Raman peaks that showed positive peaks in Factor-1 loading allied to their corresponding peaks of increased intensities in Figure 2A. Similarly, all the Raman signals that showed negative peaks in Factor-1 loading allied with their corresponding peaks with decreased intensities in Figure 2A.
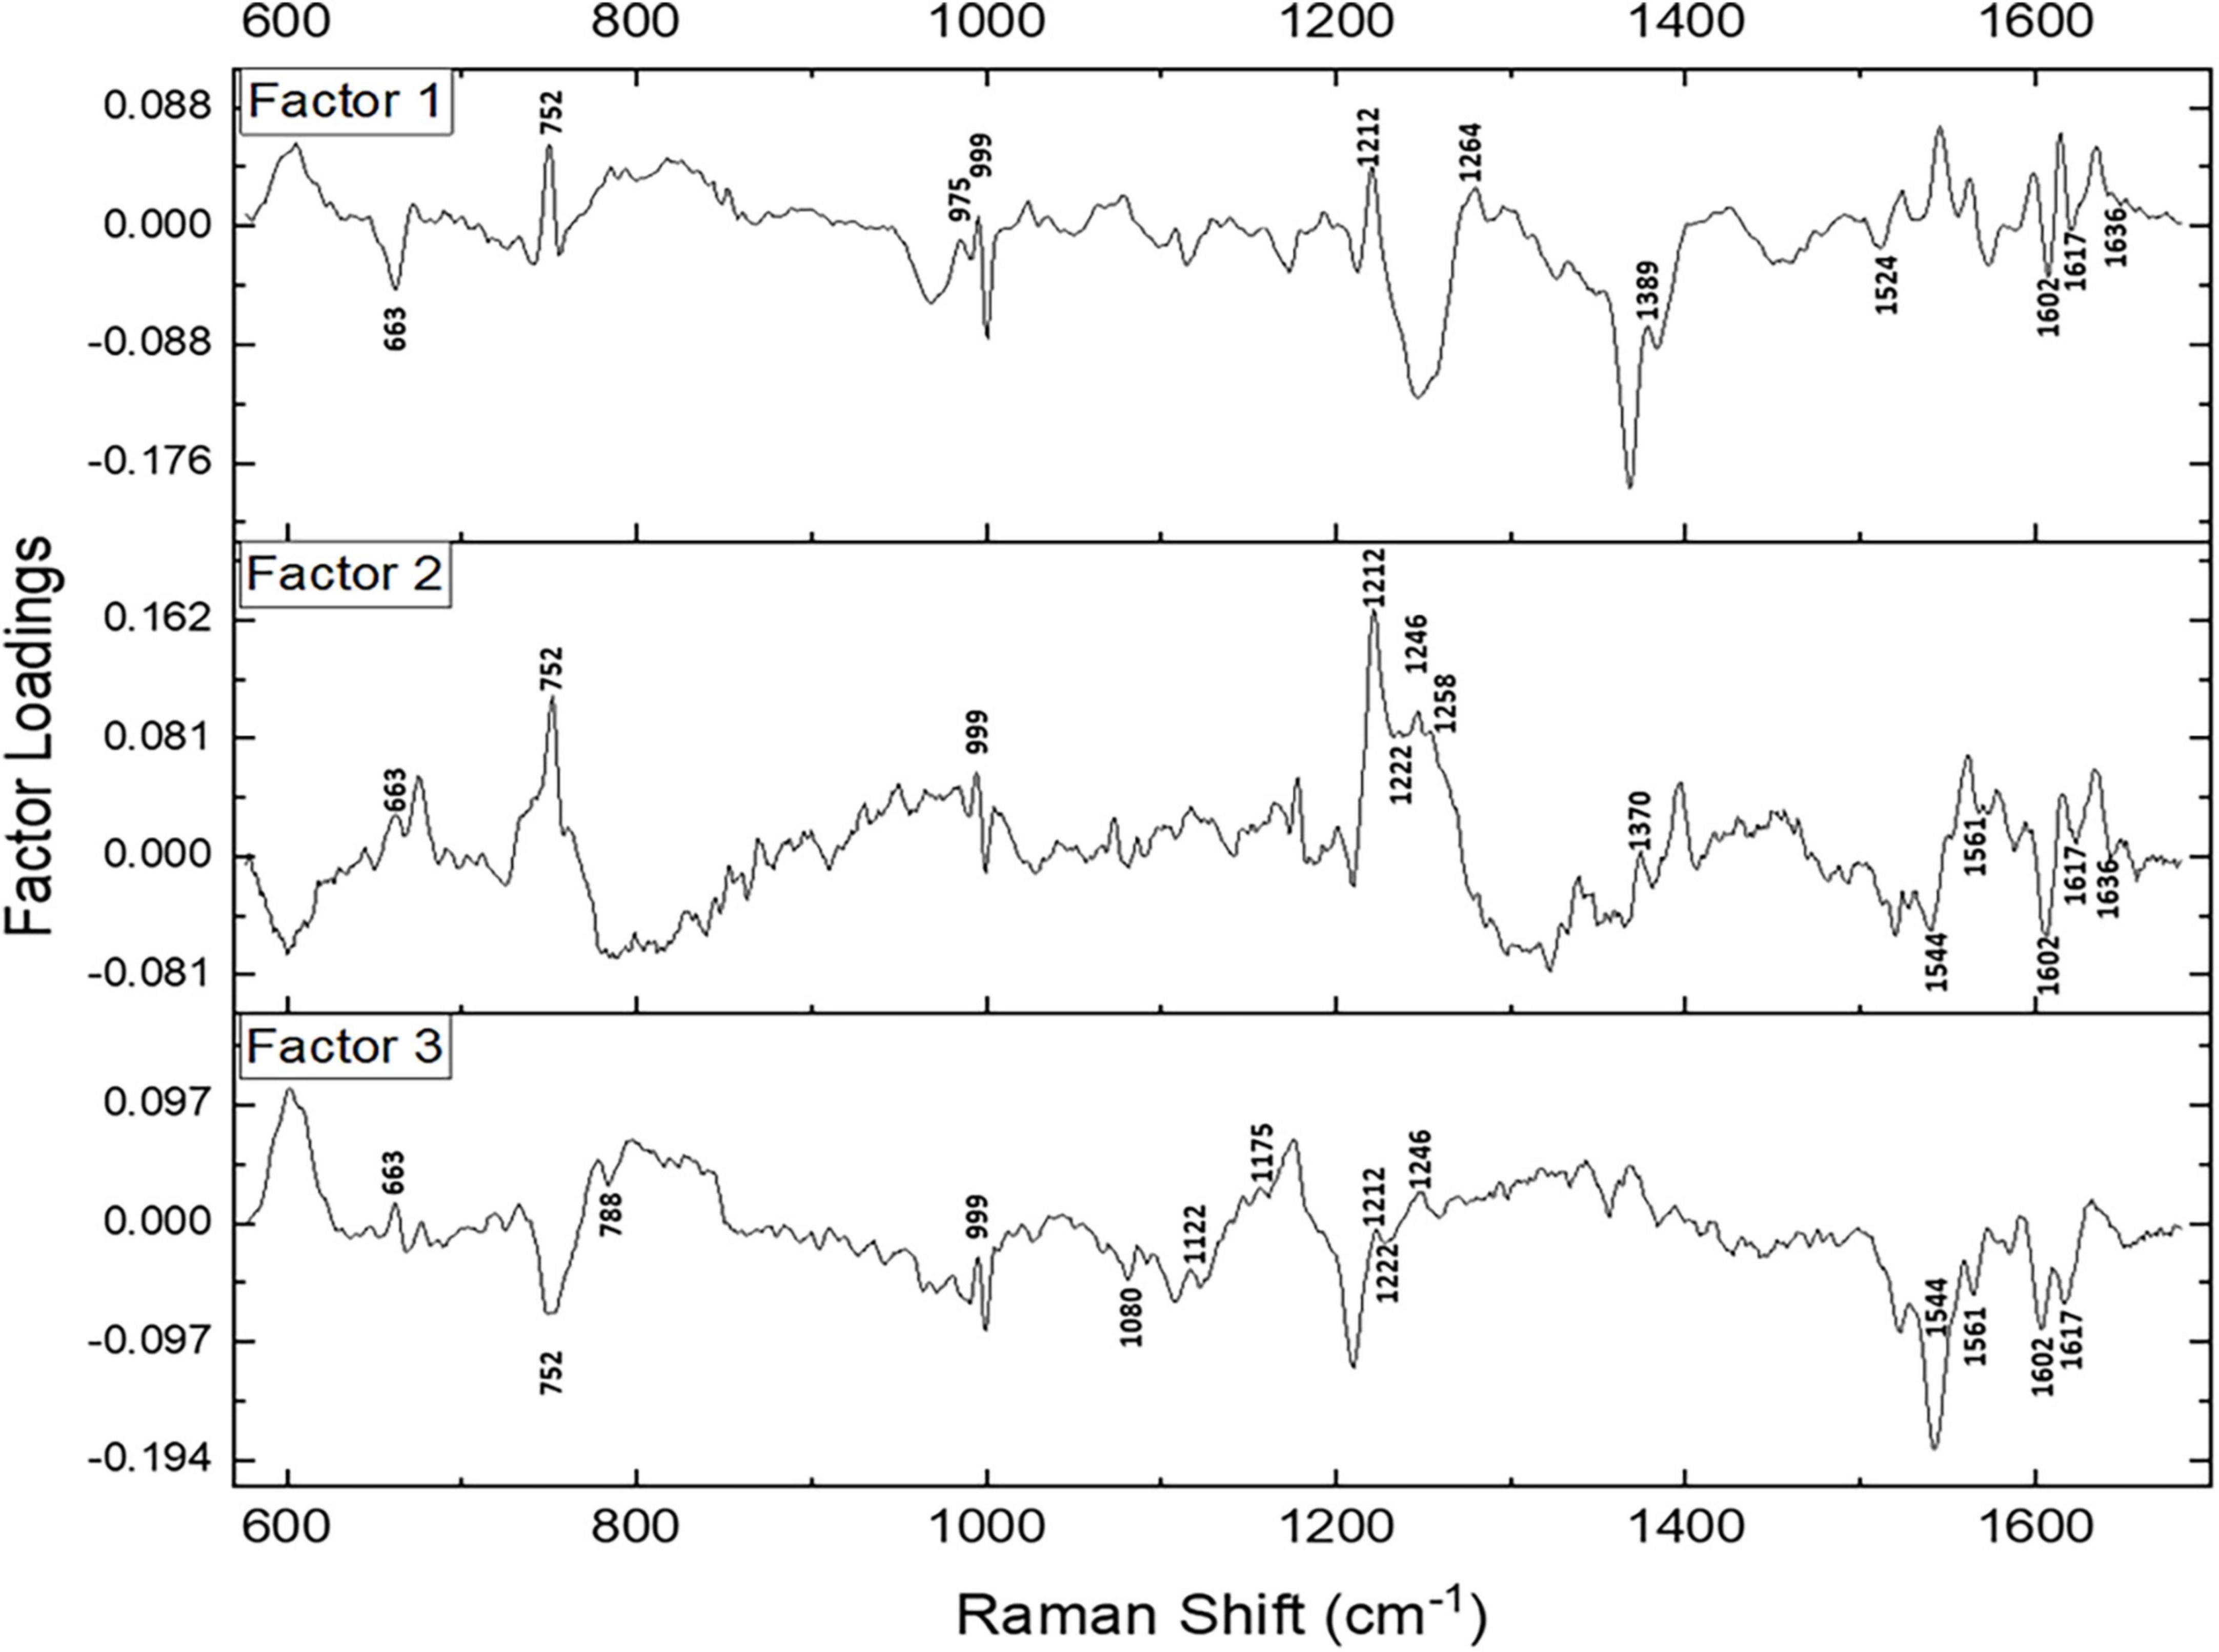
Figure 3. Spectral loadings of the PC factors (Factor 1, Factor 2, and Factor 3) between RBCs of healthy and disease samples.
Factors 2 and 3 picked up the subsequent level variations in the spectra, chiefly of Raman peaks at 752, 999, 1,212, 1,222, 1,246, 1,370, 1,389, 1,561, 1,602, 1,617, and 1,636 cm–1.
Since maximum variance had been picked up by PC1, a repeat factor-load analysis was performed for the scores of PC1 across all three infectious disease groups against the healthy group (Figure 4). By performing this repeat factor load analysis, the extent of alterations in the RBC Raman spectra in each disease can be better appreciated.
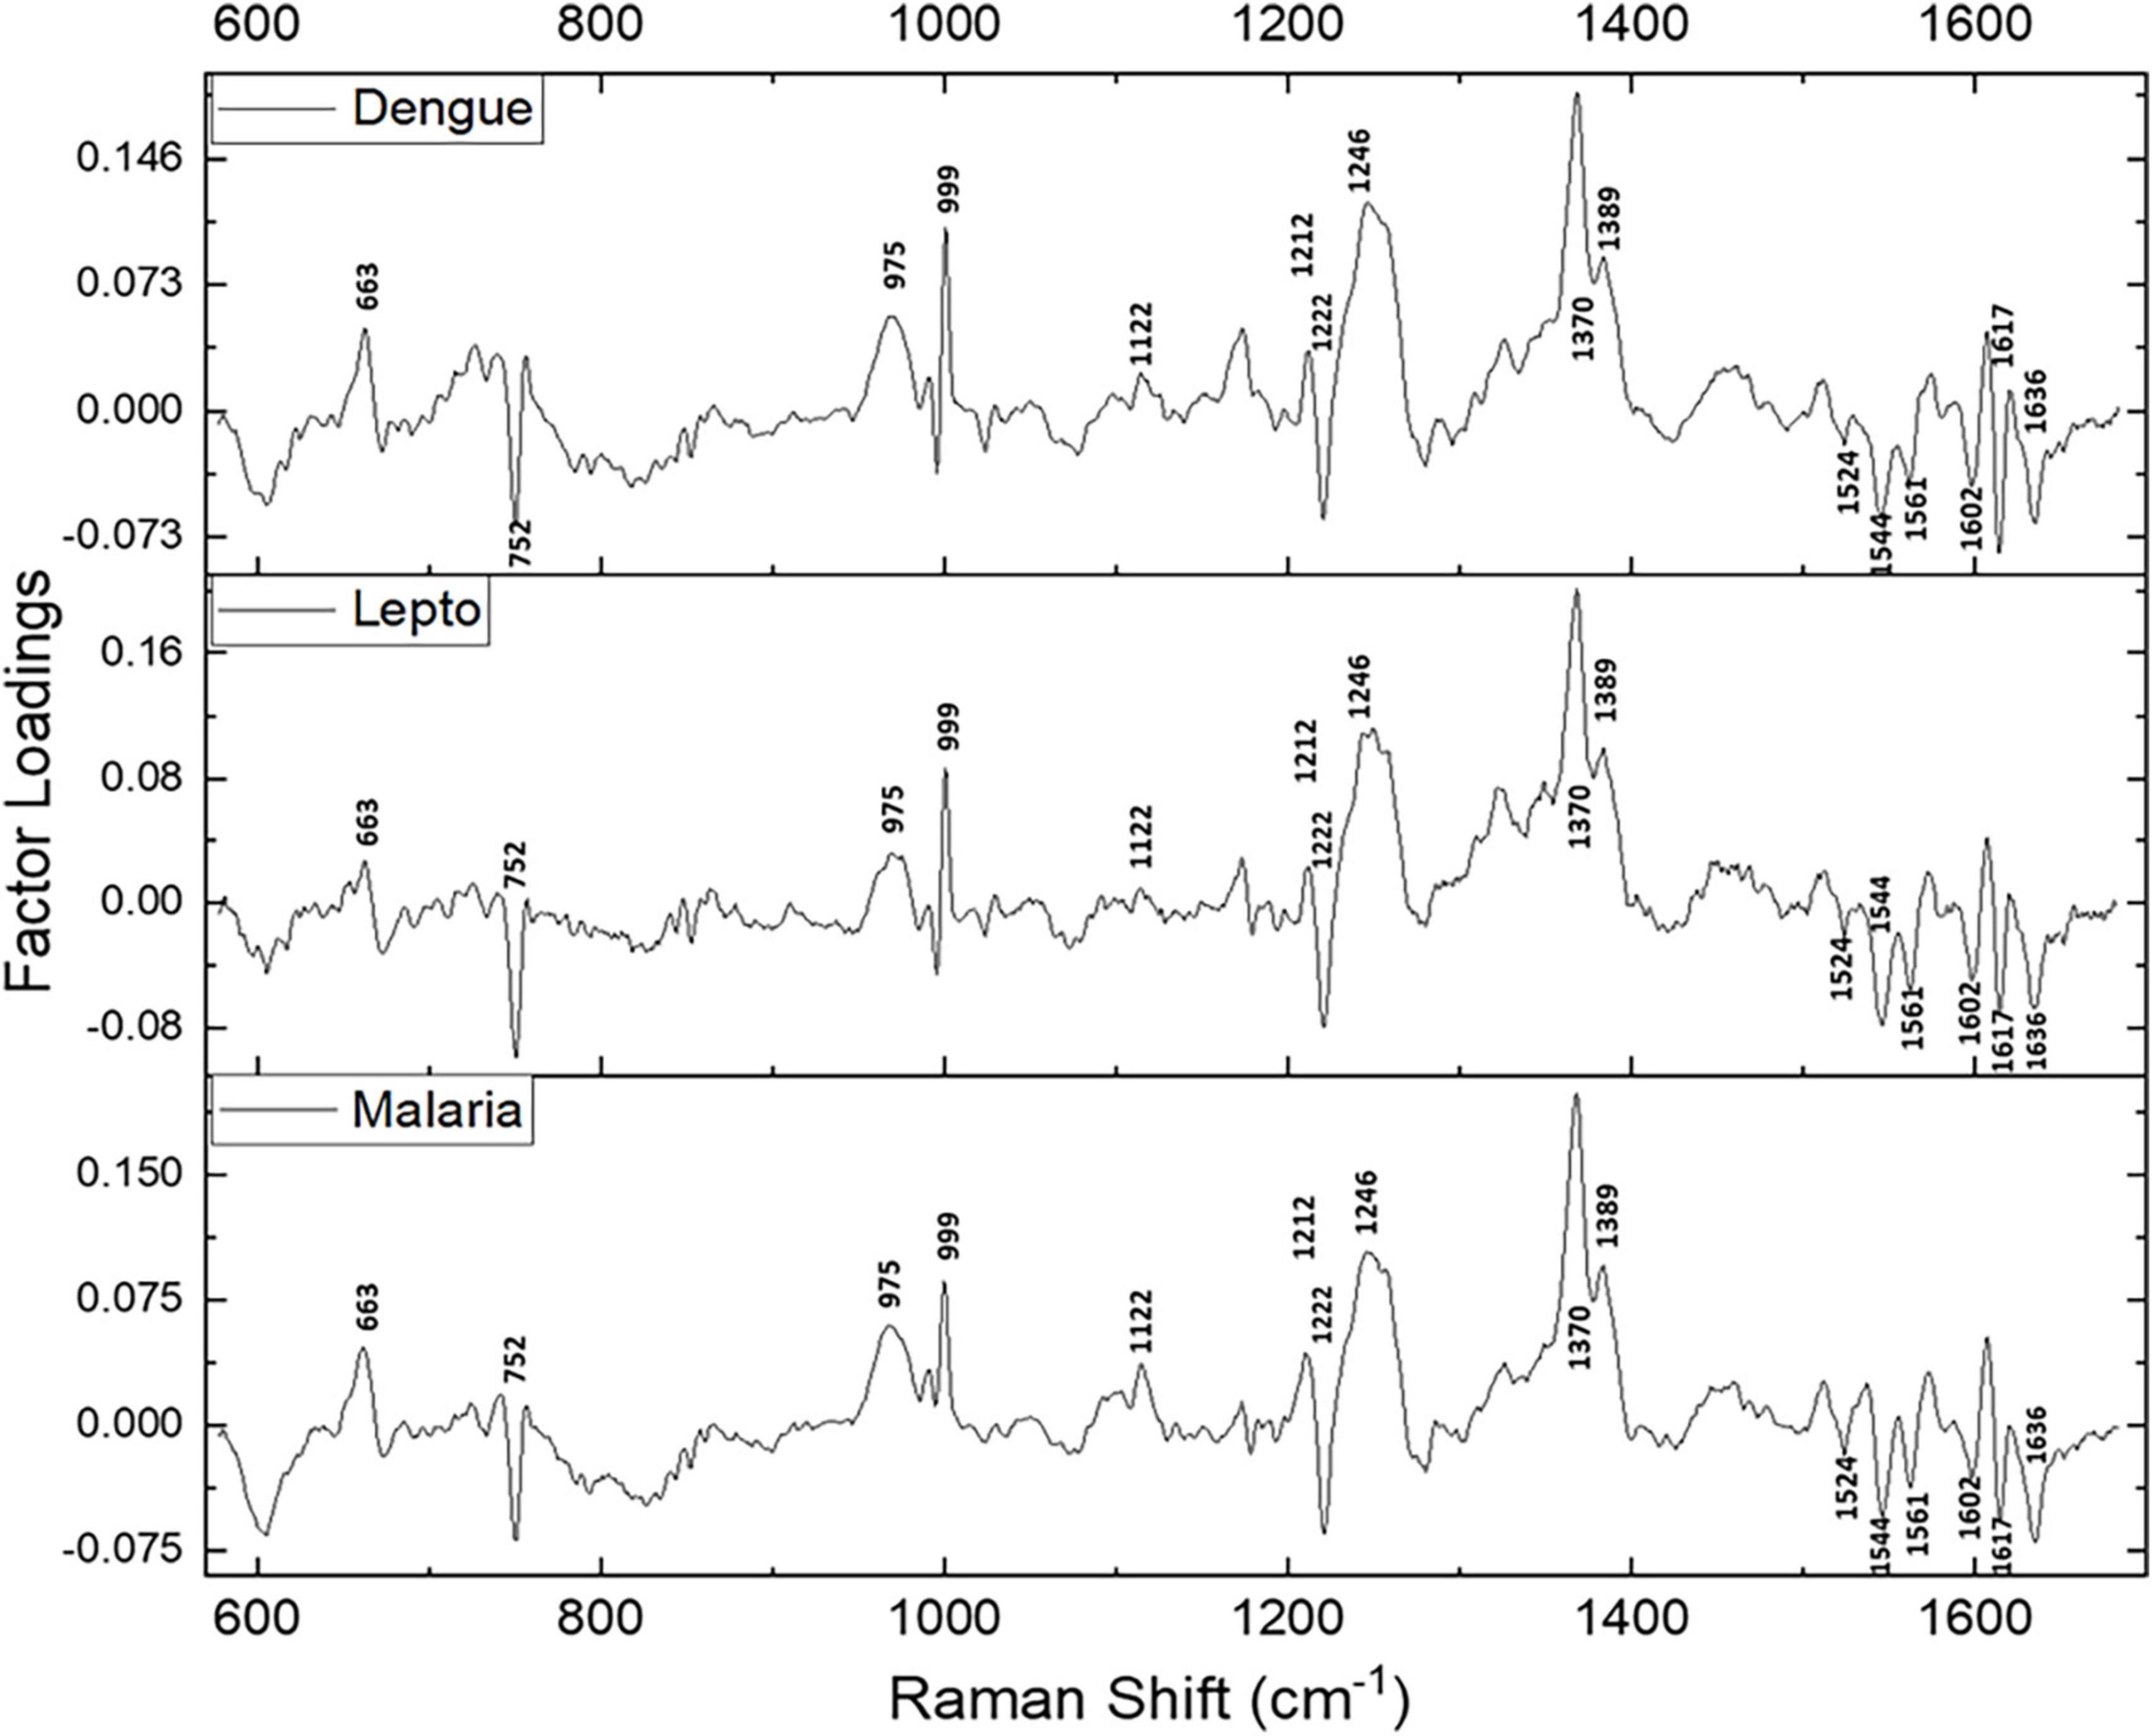
Figure 4. Spectral loadings of the PC1 scores between RBCs of healthy and disease samples.
Red blood cell Raman markers detected in malaria, dengue and leptospirosis
Spectral analysis, PLS-DA and the factor analysis extracted the Raman frequencies that displayed considerable variations between RBCs from the healthy and the disease populations. The deviant peaks and their assignments have been described below under the four specific band regions, viz., core size/spin-state marker region, pyrrole-ring stretching region, methine C-H deformation region and the low wavenumber region (37). The averaged Raman spectra from the disease groups displayed Raman peaks that had their intensities altered when compared with the healthy group (Figures 2A, 4 and Table 1). The Raman peaks were assigned based on already existing data from previously conducted studies (27, 28, 35) and this paper reports the alteration of these very Raman peaks in malaria, dengue and leptospirosis. The details of the variation in the Raman bands are described and elaborated below.
Core size or spin state marker band: 1,500–1,650 cm–1
This marker band encompasses the Raman signatures that disseminate from the C-C bonds in the porphyrin ring of heme and is dependent on the spin-state of atomic iron (38). Raman peaks that signify the “oxy” state of Hb at 1,524, 1,544, 1,561, 1,602, 1,617, and 1,636 cm–1 exhibited a decrease in their intensities in all three disease spectra as compared to their corresponding peaks in the healthy spectra. This inferred a decline in the “oxy” configuration of heme (21) comprising Hb with a reduced amount of bound-oxygen in disease. Raman peak 1,636 cm–1 characterizes oxygen concentration, a decrease of which implied a fall in the oxyconfiguration of heme (39).
Pyrrole-ring stretching band: 1,300–1,400 cm–1
The importance of this spectral zone is that it includes the heme-aggregation bands and also conveys information relating to the “oxidation” state of iron in heme. In all three disease groups there appeared to be a notable increase in the intensity of the heme-aggregation Raman peak at 1,368 cm–1 accompanied by an enhanced pyrrole deformation peak at 1,389 cm–1. This occurrence indicated the production of heme-aggregates in RBCs (40).
Methine C-H deformation band: 1,200–1,300 cm–1
This zone of the Raman spectrum is attributed to the methine C-H bonds within heme. These bonds are sensitive to alterations in Hb conformations and are influenced by the binding of oxygen with heme iron. Their closeness with the protein subunits is inferred to be the basis of their sensitivity (35). Raman peaks that displayed enhanced intensity in this spectral region were wavenumbers at 1,212, 1,246, and 1,264 cm–1. Alteration of 1,246 cm–1 is indicative of heme aggregation (41). This was accompanied by a fall in intensity at the peak of 1,222 cm–1 suggesting changes in the methine C-H deformation (35, 36).
Low wavenumber band: 600–1,200 cm–1
Pyrrole-breathing and pyrrole-deformation features of RBCs can be studied from this Raman region (42). This portion of the Raman spectrum also depicts membrane stability (43, 44). There appeared a significant increase in the intensity of the Raman peak at 975 cm–1 in all three disease groups. A new peak surfaced at 663 cm–1 that shouldered the 675 cm–1 pyrrole-deformation peak across the disease populations as well. Both these events are indicative of heme-aggregation in consequence of protein denaturation (40, 41). The porphyrin breathing mode peak at 752 cm–1, signifying Hb integrity (45), exhibited a significantly reduced intensity in the disease groups. The deoxy Raman marker peak at 788 cm–1 displayed a substantial decrease in intensity in all three disease groups (28). The peaks originating from phenylalanine at 999 and 1,025 cm–1 Raman peaks displayed a deviation in their strengths when compared to the healthy spectrum. This implied Hb breakdown (38, 46) and disruption of the RBC membrane (43). Altered heights of peaks 1,122 and 1,080 cm–1 in the disease groups that emanate from the RBC membrane signified distorted membrane deformability (41), whereas altered intensities at 1,165 and 1,175 cm–1 characterize deformation in the pyrrole ring (47).
PCA of the significantly different wavenumber bands
On the whole, there were 26 Raman bands (Table 1) detected by the spectral analysis approach that presented a significant difference between the healthy and disease samples. A repeat PCA, in CRAN R-3.6.1, of the intensity-scores of just these significantly different Raman peaks captured a better variance of 68.13% for the first three PCs, much higher than that obtained (52.26%) when the whole molecular fingerprint region of the RBC spectra was considered.
The 3-dimensional score-plot of the first three PCs displayed in Figure 5A exhibited a clear classification of the four groups. Figure 5B displays the scree-plot of the first ten PCs which exhibited that among the first ten PCs, the first PC captured maximum variance (46.62%) from the data procured from the four groups.
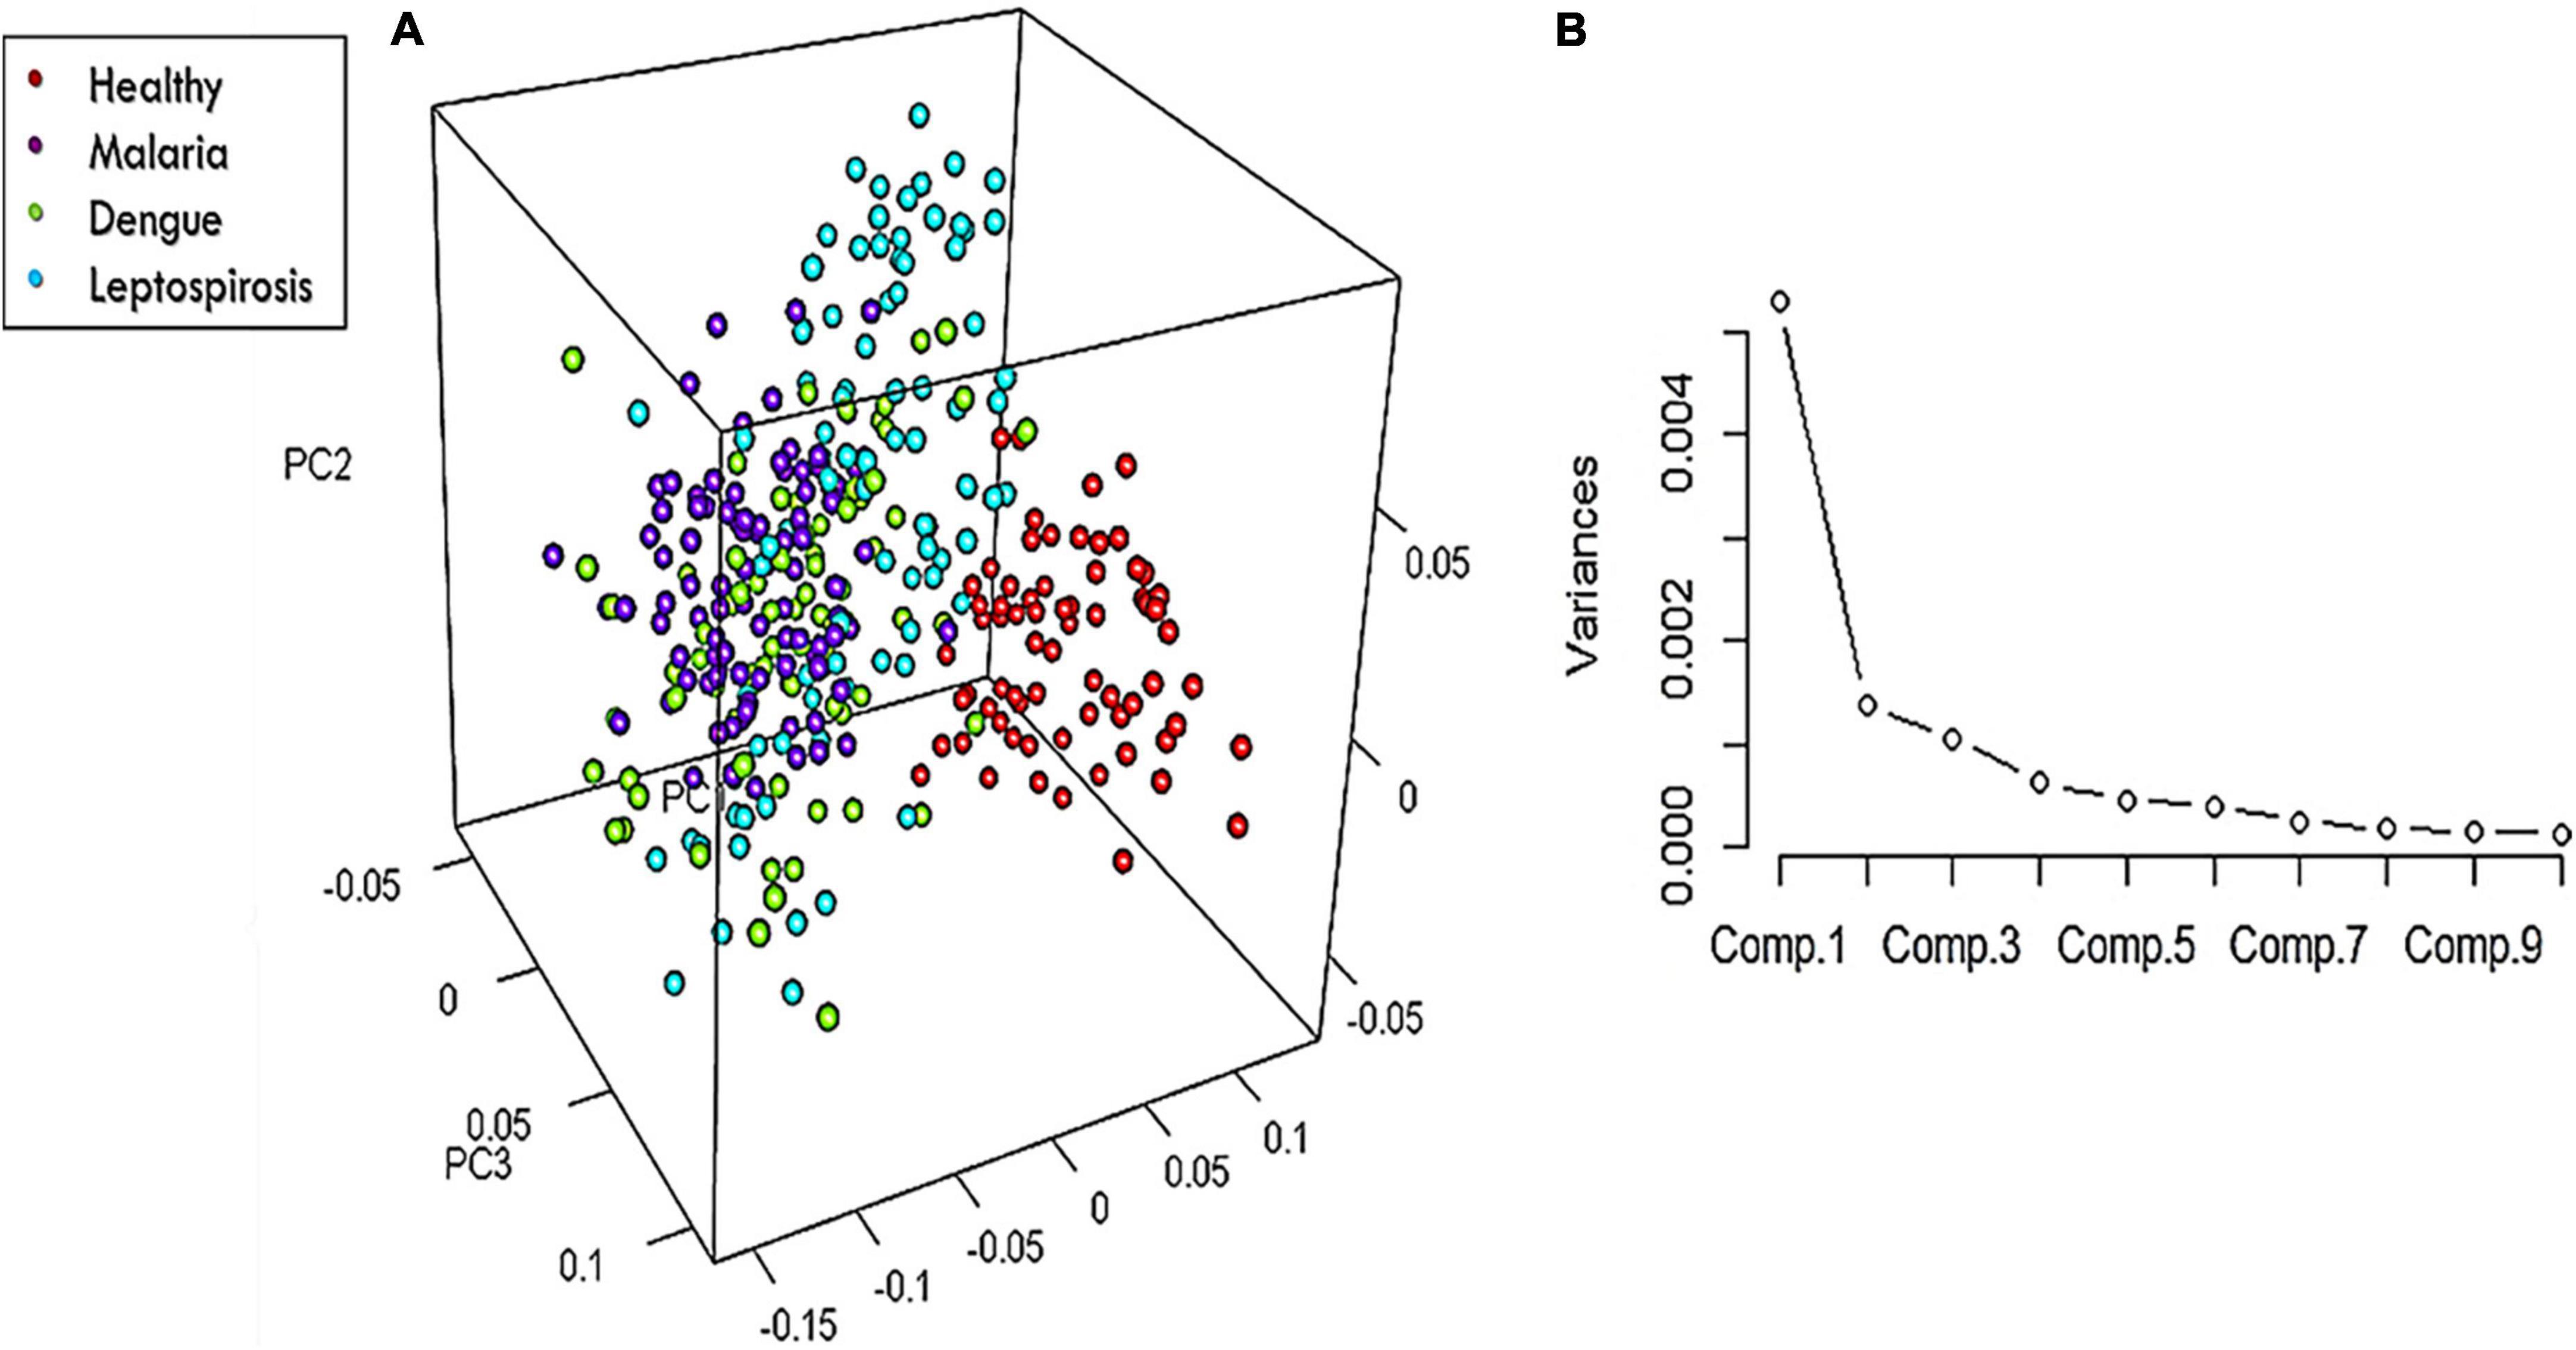
Figure 5. (A) 3-Dimensional score-plot for the healthy and the three disease samples and (B) % Variance of the PCs.
Non-parametric MANOVA approach to Raman spectral markers
A non-parametric variant of MANOVA (CRAN R 3.6.1) was used to investigate the statistically significant difference in the mean intensity scores across the four groups for only those Raman bands that were identified as significantly different in the spectral analysis. Toward this, the McKeon approx. for Lawley Hotelling Test was considered. Results indicated a significant difference (p-value < 0.00001) between the average values of the intensity scores across the healthy and all three disease samples. The Lawley-Hotelling trace test in MANOVA was employed to examine the discriminating aspects of the groups that encompass large datasets.
Subsequently, a pairwise Wilcoxon test with Bonferonni corrections was utilized to facilitate post hoc comparisons. This helped identify those Raman peaks that attributed to significant differences in the intensity scores across the four populations. The p-values that were obtained have been presented in Table 2 for the following pair of groups: Group 1 (healthy) vs. Group 2 (dengue), Group 1 (healthy) vs. Group 3 (leptospirosis), Group 1 (healthy) vs. Group 4 (malaria), Group 2 (dengue) vs. Group 3 (leptospirosis), Group 2 (dengue) vs. Group 4 (malaria), Group 3 (leptospirosis) vs. Group 4 (malaria).
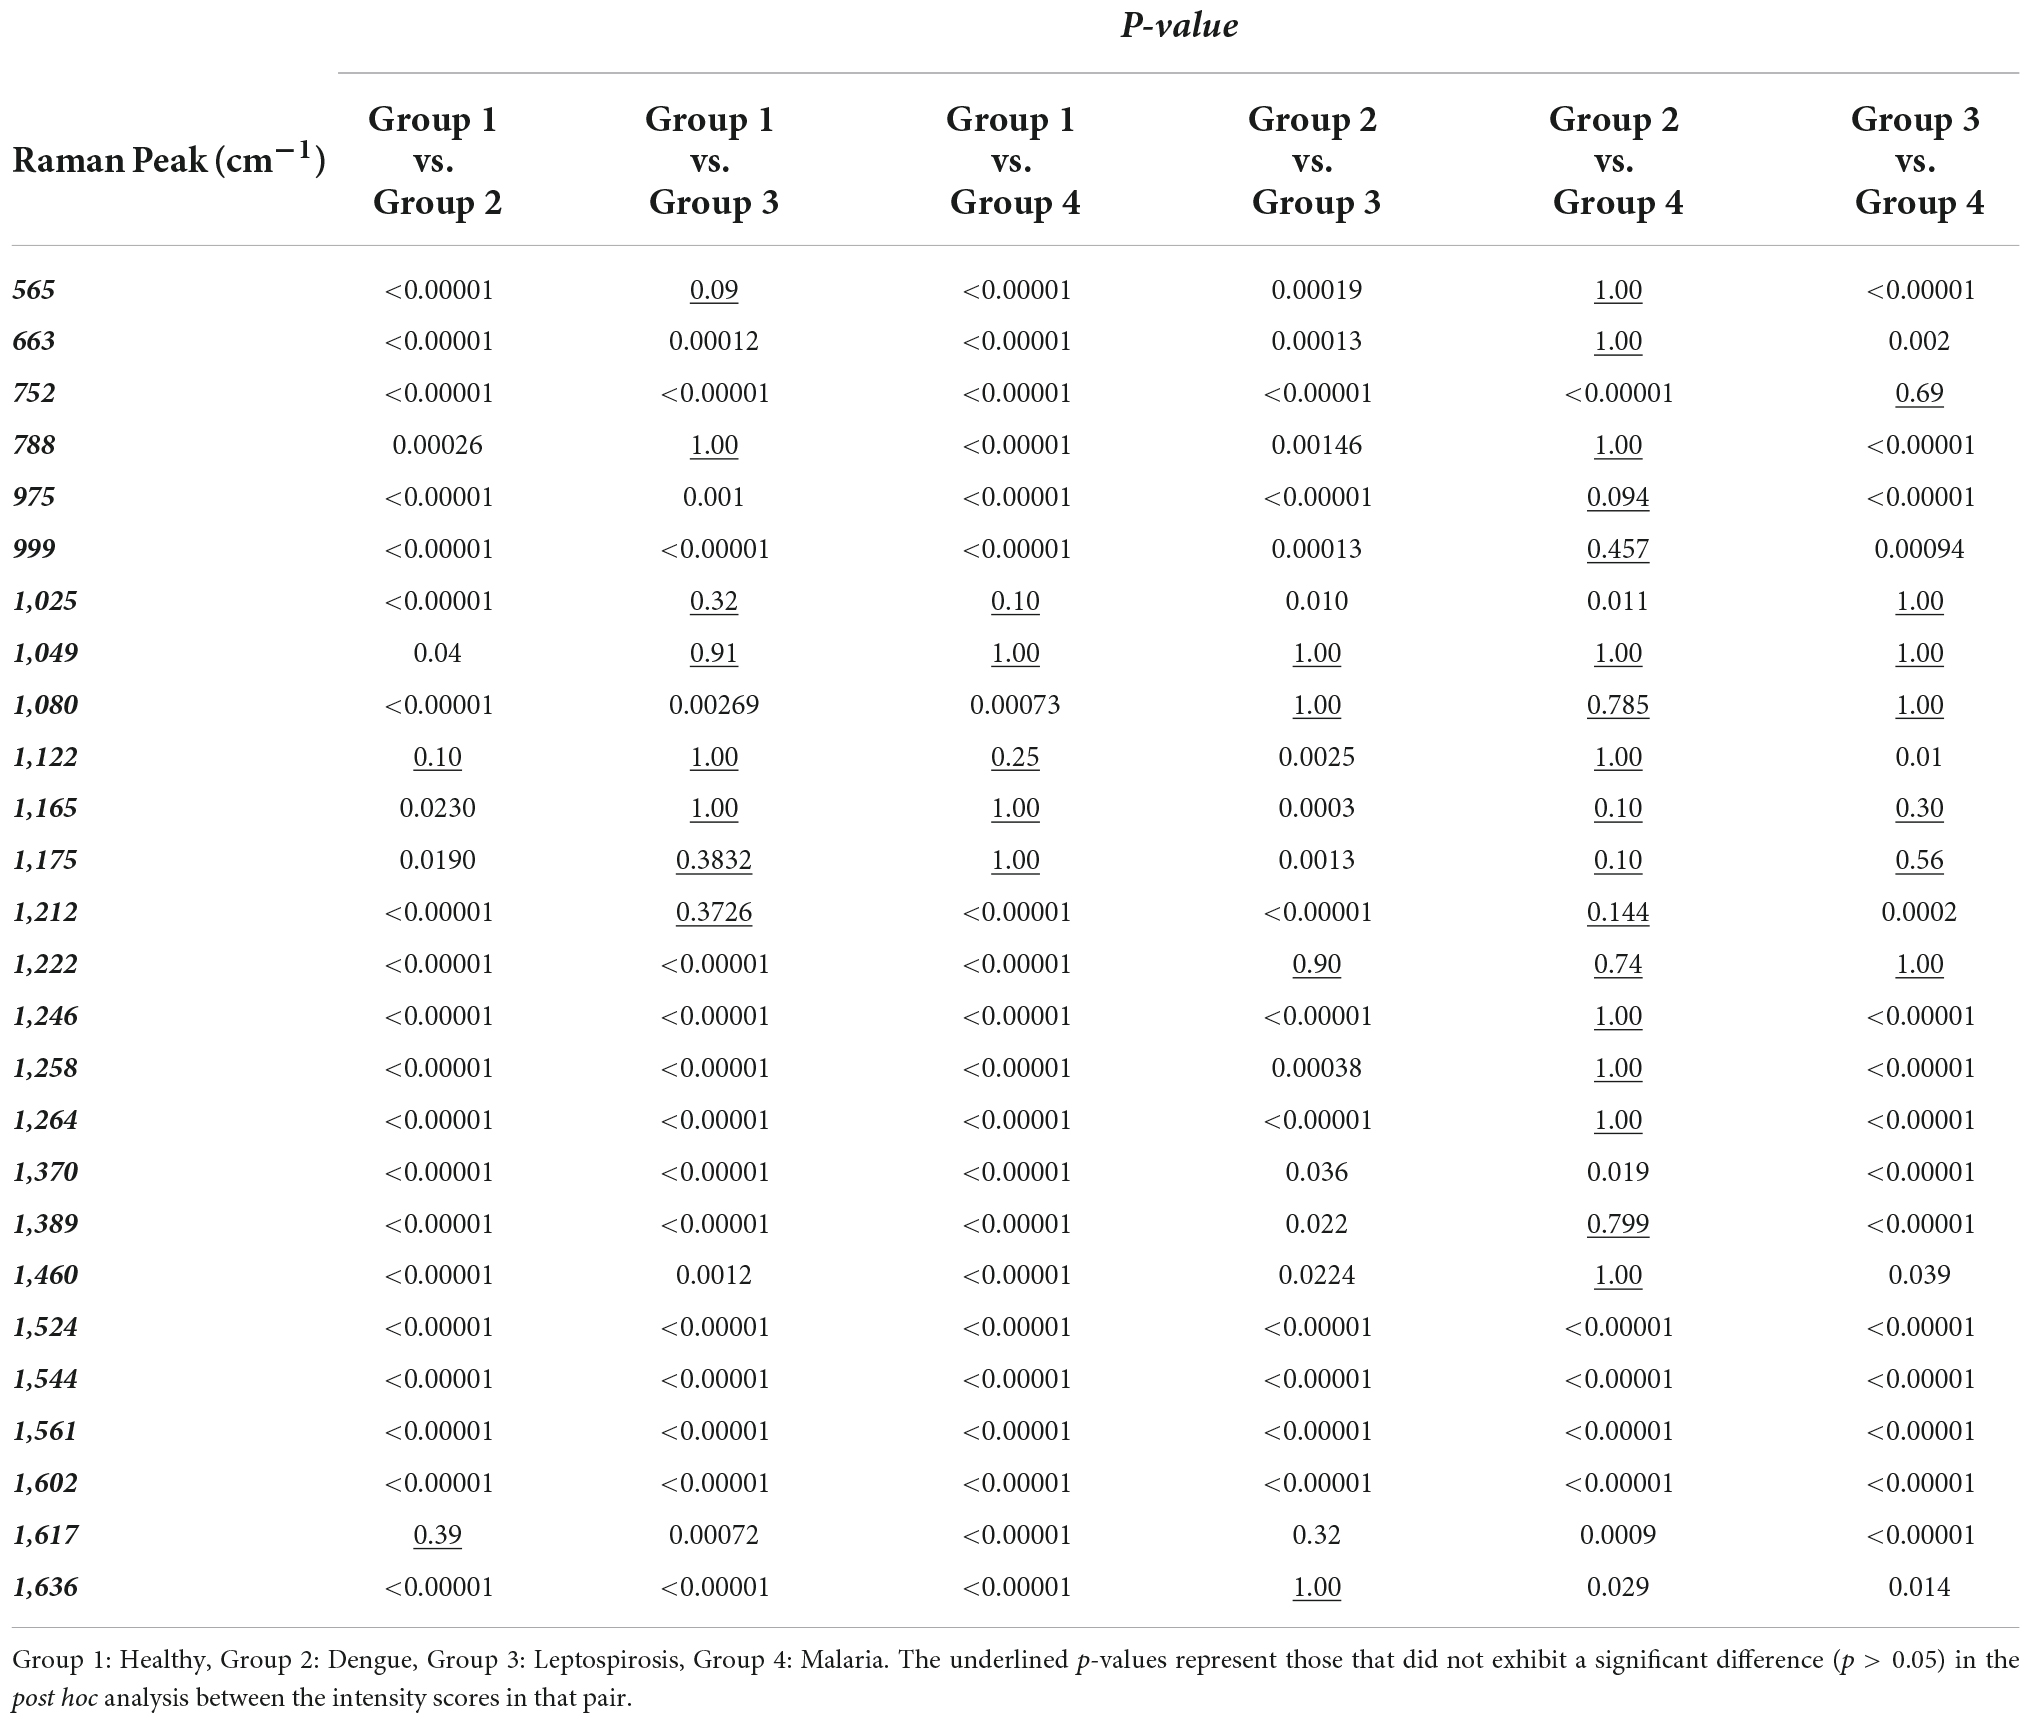
Table 2. Level of significance of the significantly different Raman peaks derived from pair-wise Wilcoxon post-hoc test between RBCs of healthy and the disease samples.
Group 1 (healthy) vs. group 2 (dengue)
Excluding the Raman peak at 1,617 cm–1 (p = 0.39) that characterizes the “oxy” state of Hb, the intensity scores of all the other Raman bands detected by spectral analysis exhibited a highly significant difference between the healthy and dengue samples.
Group 1 (healthy) vs. group 3 (leptospirosis)
Between the healthy and leptospirosis groups, excluding the following Raman peaks: oxygenation status marker at 565 cm–1 (p = 0.09), Hb integrity conferring marker at 788 cm–1 (p = 1.00), phenylalanine and amide emanating peaks at 1,025 cm–1 (p = 0.32) and 1,049 cm–1 (p = 0.91), respectively, RBC membrane peak at 1,122 cm–1 (p = 1.00) and the pyrrole deformation peaks at 1,165 cm–1 (p = 1.00) and 1,175 cm–1 (p = 0.38), all other Raman peaks exhibited significant differences across the samples.
Group 1 (healthy) vs. group 4 (malaria)
Amongst the healthy and malaria samples, except the Raman peaks at 1,025 cm–1 (p = 0.10) from phenylalanine, 1,049 cm–1 (p = 1.00) from amide, and the pyrrole deformation peaks at 1,165 cm–1 (p = 1.00) as well as 1,175 cm–1 (p = 1.00), all other Raman peaks appeared significantly different.
On the whole, among the three diseases, RBCs from the dengue samples exhibited significant variances from the healthy in all Raman markers, excluding one, as compared to those from malaria and leptospirosis samples. For completeness, a pairwise comparison of the Raman markers between the disease groups was also conducted which generated the following results:
Group 2 (dengue) vs. group 3 (leptospirosis)
A pair-wise comparison between the dengue and leptospirosis populations exhibited substantial distinction between the two groups, excluding Raman peaks at 1,049 cm–1 (p = 1.00) which emanated from amide, 1,080 cm–1 (p = 1,00) a membrane deformability marker, 1,222 cm–1 (p = 0.90) from the methine C-H deformation band and 1,636 cm–1 (p = 1.00) an “oxygenation” status Raman marker.
Group 3 (leptospirosis) vs. group 4 (malaria)
Between malaria and leptospirosis groups too, excluding Raman peaks at 752 cm–1 (p = 0.69) a porphyrin breathing mode peak, phenylalanine emanating peak at 1,025 cm–1 (p = 1.00), amide emanating peak at 1,049 cm–1 (p = 1.00), the membrane deformability marker at 1,080 cm–1 (p = 1.00), pyrrole deformation peaks at 1,165 cm–1 (p = 0.30) as well as at 1,175 cm–1 (p = 0.56) and the methine C-H deformation band at 1,222 cm–1 (p = 1.00), there was significant distinction.
Group 2 (dengue) vs. group 4 (malaria)
Between dengue and malaria groups, there appeared many Raman peaks that exhibited lesser variance such as the oxygenation status markers at 565 cm–1 (p = 1.00), heme-aggregation denoting peak at 663 cm–1 (p = 1.00), the deoxy Raman marker peak at 788 cm–1 (p = 1.00), heme aggregation peak at 975 cm–1 (p = 0.90) and phenylalanine emanating peak at 999 cm–1 (p = 0.46), RBC membrane peak at 1,122 cm–1 (p = 0.79), pyrrole deformation peaks at 1,165 cm–1 (p = 1.00) as well as 1,175 cm–1 (p = 0.10), the methine C-H deformation bands at 1,212 cm–1 (p = 0.14) and 1,222 cm–1 (p = 0.74), 1,246 cm–1 (p = 1.00), 1,258 cm–1 (p = 1.00), and 1,264 cm–1 (p = 1.00) and the pyrrole deformation peaks at 1,389 cm–1 (p = 0.80) and 1,460 cm–1 (p = 1.00).
As seen above, it is clear that pairwise comparisons between disease groups displayed those Raman peaks that showed significant deviation from the normal/healthy, but not from each other. This is an indication that these deviations could be generic and not specific to the disease. On the other hand, those Raman peaks that displayed significant distinction between the diseases in the pair though could be an exclusive or elite feature of the particular disease on RBCs.
Discussion
To summarize the key findings of this study, in malaria, dengue and leptospirosis, variations were observed in the intensities of Raman peaks that represented the “oxygenation status” of Hb. It was observed that these Raman signatures primarily exhibited a “deoxy” configuration configuration rather than an “oxy” configuration, as compared to RBCs in the healthy samples. There also occurred a decline in the frequencies signifying “oxygen saturation” in the disease samples (28). Another characteristic feature observed in RBCs from diseased samples is that they showed a predominance of those Raman markers indicative of heme-aggregation (39). Results also showed a significant drop in peak intensities that depicted Hb stability in conjunction with altered Raman peaks that portrayed RBC membrane stability (38, 43, 46).
It is vital that Hb be biochemically conducive enough for oxygenation, as this helps RBCs to accomplish its oxygen-transporting-role (48). Hb, having taken on more of a “deoxy” configuration, with diminution in its oxygen saturation status and the presence of heme aggregation, are all suggestive of a disturbance in its “healthy” state in disease, possibly reflecting in its physiology as well. Taking into consideration all the Raman variations across the healthy and disease groups, it is difficult not to conclude that infection does affect RBC biochemistry, either directly or indirectly. Studies have shown that RBCs exhibit programmed death processes such as eryptosis and/or erythrocyte programmed necrosis in malaria and in diseases that generate excessive pro-inflammatory products (49). The results of this study further support this datum. However, in the future, it is to be investigated if distinctive RBC Raman signatures exist with respect to specific infections. Another potential limitation of this study is that the excitation power of the laser beam was set approximately at 10 mW. It is possible that this excitation power, even if stated as non-injurious in many studies (50, 51), can pose as a source of stress to the RBCs, if not damage. This could possibly add on more strain to the already stressed and sensitive RBCs in disease. In this regard, in a future study we intend to utilize laser beams of smaller excitation powers to further investigate RBC Raman signatures in disease.
When a repeat multivariate analysis was performed, considering the picked out Raman peaks that exhibited significant difference among the four populations, a better variance was captured between the groups. This signified that the selective analysis of merely these Raman peaks was adequate to categorize RBCs as healthy or stressed. These identified Raman peaks were the same ones that appeared to be of significance in the micro-Raman analysis of RBCs in jaundice samples, in an earlier study (27). Former reports, pertaining to RBC Raman scattering analysis in eryptosis, also point out changes in these very peaks (34, 52). With the analysis we present in this report and the standardized study we had conducted earlier (27), we hypothesize these peaks as “Raman markers of RBC injury.” Therefore, to identify RBCs under stress/injury, consideration of these Raman peaks would suffice than running chemometrics over all of the Raman peaks in the 550–1,700 cm–1 Raman region. That being said, it is essential to conduct and validate the technique on other pathologies and in vitro experiments of eryptosis, to establish this statement conclusively.
Conclusion
Spectral analysis and the various multivariate analytical methods employed, as was standardized in our earlier study (23) disclosed that RBCs in malaria, dengue and leptospirosis infections endured biomolecular deviances from the normal. Intensity scores derived from the RBC Raman peaks were run through numerous multivariate analytical approaches to confirm the same. As a preliminary study, the systematic use of multivariate tools and the results obtained validates this method to investigate RBC Raman signatures. Deciphering the chemical nature of the RBCs in their exact/precise state is a demanding task. Nevertheless, a tool such as Raman spectroscopy can achieve this, holding great promise to be a potential diagnostic tool in the medical domain.
Data availability statement
The datasets generated and analyzed during this study are available from the corresponding author on reasonable request.
Ethics statement
The studies involving human participants were reviewed and approved by the Kasturba Medical College and Kasturba Hospital Institutional Ethics Committee, Registration No. ECR/146/Inst/KA/2013/RR-16. Written informed consent was obtained from all the volunteers. Blood samples of malaria, dengue and leptospirosis patients were collected from the laboratory of Clinical Hematology. The requirement for informed consent was waived concerning the acquisition of patients’ samples.
Author contributions
SJ, PR, and SC conceived and designed the study. SJ, JL, and NM performed the experiments, interpreted the results, and wrote the manuscript. AB performed the multivariate analysis using GRAMS-IQ and the interpretation of the results. MA contributed to performing the experiments. AK and RV contributed to the statistical analysis and interpretation of results and wrote the manuscript. RR and PB contributed to the conception and design of the project and the interpretation of results. All authors contributed to the article and approved the submitted version.
Funding
We acknowledge the financial support by the Department of Biotechnology, Govt. of India for the Raman Tweezers facility through the sanctioned project BT/PR6413/MED/14/80/2005.
Acknowledgments
We are grateful for the support contributed by the Clinical Hematology of Kasturba Hospital, Manipal, the Department of Microbiology, Kasturba Medical College, Manipal and Manipal Institute of Virology, Manipal Academy of Higher Education, Manipal.
Conflict of interest
The authors declare that the research was conducted in the absence of any commercial or financial relationships that could be construed as a potential conflict of interest.
Publisher’s note
All claims expressed in this article are solely those of the authors and do not necessarily represent those of their affiliated organizations, or those of the publisher, the editors and the reviewers. Any product that may be evaluated in this article, or claim that may be made by its manufacturer, is not guaranteed or endorsed by the publisher.
References
1. Kothari VM, Karnad DR, Bichile LS. Tropical infections in the ICU. J Assoc Physic India (2006) 54:291–8.
2. Wiwanitkit V. Concurrent malaria and dengue infection: a brief summary and comment. Asian Pac J Trop Biomed. (2011) 1:326–7. doi: 10.1016/S2221-1691(11)60053-1
3. Haake DA, Levett PN. Leptospirosis in humans. Curr Top Microbiol Immunol. (2015) 387:65–97. doi: 10.1007/978-3-662-45059-8_5
4. Haldar K, Mohandas N. Malaria, erythrocytic infection, and anemia. Hematology Am Soc Hematol Educ Program. (2009) 2009:87–93. doi: 10.1182/asheducation-2009.1.87
5. Abdullah NH, Mohammad N, Ramli M, Wan Ghazali WS. Haemolytic anaemia precipitated by dengue fever. BMJ Case Rep. (2019) 12:e226760. doi: 10.1136/bcr-2018-226760
6. Trowbridge AA, Green JB III, Bonnett JD, Shohet SB, Ponnappa BD, McCombs WB III. Hemolytic anemia associated with leptospirosis. morphologic and lipid studies. Am J Clin Pathol. (1981) 76:493–8. doi: 10.1093/ajcp/76.4.493
7. Naik, BS. Incidence of jaundice in plasmodium vivax Malaria: a prospective study in Moodabidri, South India. Malay J Med Sci MJMS. (2014) 21:24–7.
8. Scovino AM, Totino P, Morrot A. Eryptosis as a new insight in malaria pathogenesis. Front Immunol. (2022) 13:855795. doi: 10.3389/fimmu.2022.855795
9. Lang F, Lang E, Föller M. Physiology and pathophysiology of eryptosis. Transfus Med Hemother. (2012) 39:308–14. doi: 10.1159/000342534
10. Pretorius E. Erythrocyte deformability and eryptosis during inflammation, and impaired blood rheology. Clin Hemorheol Microcirc. (2018) 69:545–50. doi: 10.3233/CH-189205
11. Abed M, Towhid ST, Mia S, Pakladok T, Alesutan I, Borst O, et al. Sphingomyelinase-induced adhesion of eryptotic erythrocytes to endothelial cells. Am J Physiol Cell Physiol. (2012) 303:C991–9. doi: 10.1152/ajpcell.00239.2012
12. Narayanavari SA, Lourdault K, Sritharan M, Haake DA, Matsunaga J. Role of sph2 gene regulation in hemolytic and sphingomyelinase activities produced by Leptospira interrogans. PLoS Negl Trop Dis. (2015) 9:e0003952. doi: 10.1371/journal.pntd.0003952
13. LaRocca TJ, Stivison EA, Hod EA, Spitalnik SL, Cowan PJ, Randis TM, et al. Human-specific bacterial pore-forming toxins induce programmed necrosis in erythrocytes. mBio. (2014) 5:e01251-14. doi: 10.1128/mBio.01251-14
14. Du P, Li SJ, Ojcius DM, Li KX, Hu WL, Lin X, et al. A novel Fas-binding outer membrane protein and lipopolysaccharide of Leptospira interrogans induce macrophage apoptosis through the Fas/FasL-caspase-8/-3 pathway. Emerg Microbes Infect. (2018) 7:135. doi: 10.1038/s41426-018-0135-9
15. Aye M, Cabot J, William L. Severe dengue fever with haemolytic anaemia-a case study. Trop Med Infect Dis. (2016) 1:6. doi: 10.3390/tropicalmed1010006
16. Sellahewa KH, Kumaratne MP, Halpe S, Marapana K. Case report: a case of acute intravascular hemolysis in dengue fever. Am J Trop Med Hygiene. (2020) 102:355–8. doi: 10.4269/ajtmh.19-0743
17. Soundravally R, Hoti SL, Patil SA, Cleetus CC, Zachariah B, Kadhiravan T, et al. Association between proinflammatory cytokines and lipid peroxidation in patients with severe dengue disease around defervescence. Int J Infectious Dis. IJID. (2014) 18:68–72. doi: 10.1016/j.ijid.2013.09.022
18. Gadia C, Manirakiza A, Tekpa G, Konamna X, Vickos U, Nakoune E. Identification of pathogens for differential diagnosis of fever with jaundice in the Central African Republic: a retrospective assessment, 2008-2010. BMC Infect Dis. (2017) 17:735. doi: 10.1186/s12879-017-2840-8
19. Lang E, Gatidis S, Freise NF, Bock H, Kubitz R, Lauermann C, et al. Conjugated bilirubin triggers anemia by inducing erythrocyte death. Hepatology. (2015) 61:275–84. doi: 10.1002/hep.27338
20. Mendonça VRR, Andrade BB, Souza LCL, Magalhães BM, Mourão MP, Lacerda MV, et al. Unravelling the patterns of host immune responses in Plasmodium vivax malaria and dengue co-infection. Malar J. (2015) 14:315. doi: 10.1186/s12936-015-0835-8
21. Senavirathna I, Rathish D, Agampodi S. Cytokine response in human leptospirosis with different clinical outcomes: a systematic review. BMC Infect Dis. (2020) 20:268. doi: 10.1186/s12879-020-04986-9
22. Totino PR, Daniel-Ribeiro CT, Ferreira-da-Cruz M. Refractoriness of eryptotic red blood cells to Plasmodium falciparum infection: a putative host defense mechanism limiting parasitaemia. PLoS One. (2011) 6:e26575. doi: 10.1371/journal.pone.0026575
23. García-Roa M, Del Carmen Vicente-Ayuso M, Bobes AM, Pedraza AC, González-Fernández A, Martín MP, et al. Red blood cell storage time and transfusion: current practice, concerns and future perspectives. Blood Transfus. (2017) 15:222–31. doi: 10.2450/2017.0345-16
24. Xie C, Goodman C, Dinno MA, Li Y. Real-time Raman spectroscopy of optically trapped living cells and organelles. Opt Express. (2004) 12:6208–14. doi: 10.1364/OPEX.12.006208
25. Bankapur A, Zachariah E, Chidangil S, Valiathan M, Mathur D. Raman tweezers spectroscopy of live. single red and white blood cells. PLoS One. (2010) 5:e10427. doi: 10.1371/journal.pone.0010427
26. Kong K, Kendall C, Stone N, Notingher I. Raman spectroscopy for medical diagnostics–from in-vitro biofluid assays to in-vivo cancer detection. Adv Drug Deliv Rev. (2015) 89:121–34. doi: 10.1016/j.addr.2015.03.009
27. Jacob SS, Bankapur A, Barkur S, Acharya M, Chidangil S, Rao P, et al. Micro-Raman spectroscopy analysis of optically trapped erythrocytes in jaundice. Front Physiol. (2020) 11:821. doi: 10.3389/fphys.2020.00821
28. Barkur S, Bankapur A, Chidangil S, Mathur D. Effect of infrared light on live blood cells: Role of β-carotene. J Photochem Photobiol B Biol. (2017) 171:104–16. doi: 10.1016/j.jphotobiol.2017.04.034
29. Barkur S, Bankapur A, Pradhan M, Chidangil S, Mathur D, Ladiwala U. Probing differentiation in cancer cell lines by single-cell micro-Raman spectroscopy. J Biomed Opt. (2015) 20:085001. doi: 10.1117/1.JBO.20.8.085001
31. Fox, J, Friendly M, Monette G. heplots: Visualizing Tests in Multivariate Linear Models. R package version 1.3-5. (2021). Available online at: https://cran.r-project.org/web/packages/heplots/heplots.pdf (accessed March 19, 2020).
32. Burchett WW, Ellis AR, Harrar SW, Bathke AC. nonparametric inference for multivariate data: the R package npmv. J Stat Softw. (2017) 76:1–18. doi: 10.18637/jss.v076.i04
33. Korkmaz S, Goksuluk D, Zararsiz G. MVN: An R Package for Assessing Multivariate Normality. R J. (2014) 6:151–62. doi: 10.32614/RJ-2014-031
34. Barkur S, Bankapur A, Chidangil S. Raman tweezers spectroscopy study of free radical induced oxidative stress leading to eryptosis. In: Proceedings of the SPIE 10150, Second International Seminar on Photonics, Optics, and Its Applications (ISPhOA 2016). Washington, D.C. (2016). doi: 10.1117/12.2248461
35. Wood BR, McNaughton D. Micro-Raman characterization of high- and low-spin heme moieties within single living erythrocytes. Biopolymers. (2002) 67:259–62. doi: 10.1002/bip.10120
36. Wood BR, Caspers P, Puppels GJ, Pandiancherri S, McNaughton D. Resonance Raman spectroscopy of red blood cells using near-infrared laser excitation. Anal Bioanal Chem. (2007) 387:1691–703. doi: 10.1007/s00216-006-0881-8
37. Wood BR, Tait B, McNaughton D. Micro-Raman characterisation of the R to T state transition of haemoglobin within a single living erythrocyte. Biochim. Biophys Acta Mol Cell Res. (2001) 1539:58–70. doi: 10.1016/S0167-4889(01)00089-1
38. Raj S, Wojdyla M, Petrov D. Studying single red blood cells under a tunable external force by combining passive microrheology with Raman spectroscopy. Cell Biochem Biophys. (2013) 65:347–61. doi: 10.1007/s12013-012-9439-x
39. Luo M, Huang YY, Su BC, Shi YF, Zhang H, Ye XD. Study on RBC oxygen-carrying function with the incubation time. Guang Pu Xue Yu Guang Pu Fen Xi. (2015) 35:3350–5.
40. Wood BR, Hammer L, Davis L, McNaughton D. Raman microspectroscopy and imaging provides insights into heme aggregation and denaturation within human erythrocytes. J Biomed Opt. (2005) 10:014005. doi: 10.1117/1.1854678
41. Lukose J, Shastry S, Mithun N, Mohan G, Ahmed A, Chidangil S. Red blood cells under varying extracellular tonicity conditions: an optical tweezers combined with micro-Raman study. Biomed Phys Eng Express. (2020) 6:015036. doi: 10.1088/2057-1976/ab6e1a
42. Webster GT, Tilley L, Deed S, McNaughton D, Wood BR. Resonance Raman spectroscopy can detect structural changes in haemozoin (malaria pigment) following incubation with chloroquine in infected erythrocytes. FEBS Lett. (2008) 582:1087–92. doi: 10.1016/j.febslet.2008.02.062
43. Goheen SC, Lis LJ, Kucuk O, Westerman MP, Kauffman JW. Compositional dependence of spectral features in the Raman spectra of erythrocyte membranes. J Raman Spectrosc. (1993) 24:275–9. doi: 10.1002/jrs.1250240503
44. Lippert JL, Gorczyca LE, Meiklejohn G. A laser Raman spectroscopic investigation of phospholipid and protein configurations in hemoglobin-free erythrocyte ghosts. Biochim Biophys Acta. (1975) 382:51–7. doi: 10.1016/0005-2736(75)90371-5
45. Deng JL, Wei Q, Zhang MH, Wang YZ, Li YQ. Study of the effect of alcohol on single human red blood cells using near-infrared laser tweezers Raman spectroscopy. J Raman Spectrosc. (2005) 36:257–61. doi: 10.1002/jrs.1301
46. Wu H, Volponi JV, Oliver AE, Parikh AN, Simmons BA, Singh S. In vivo lipidomics using single-cell Raman spectroscopy. Proc Natl Acad Sci U.S.A. (2011) 108:3809–14. doi: 10.1073/pnas.1009043108
47. Gautam R, Oh JY, Marques MB, Dluhy RA, Patel RP. Characterization of storage-induced red blood cell hemolysis using Raman spectroscopy. Lab Med. (2018) 49:298–310. doi: 10.1093/labmed/lmy018
48. Schumacher MA, Dixon MM, Kluger R, Jones RT, Brennan RG. Allosteric transition intermediates modelled by crosslinked haemoglobins. Nature. (1995) 375:84–7. doi: 10.1038/375084a0
49. Dreischer P, Duszenko M, Stein J, Wieder T. Eryptosis: programmed death of nucleus-free, iron-filled blood cells. Cells. (2022) 11:503. doi: 10.3390/cells11030503
50. Bankapur A, Barkur S, Chidangil S, Mathur D. A micro-Raman study of live, single red blood cells (RBCs) treated with AgNO3 nanoparticles. PLoS One. (2014) 9:e103493. doi: 10.1371/journal.pone.0103493
51. Rusciano G, De Luca AC, Pesce G, Sasso A. Raman tweezers as a diagnostic tool of hemoglobin-related blood disorders. Sensors. (2008) 8:7818–32. doi: 10.3390/s8127818
Keywords: red blood cell, micro-Raman spectroscopy, eryptosis, anemia, infectious diseases
Citation: Jacob SS, Lukose J, Bankapur A, Mithun N, Vani Lakshmi R, Acharya M, Rao P, Kamath A, Baby PM, Rao RK and Chidangil S (2022) Micro-Raman spectroscopy study of optically trapped erythrocytes in malaria, dengue and leptospirosis infections. Front. Med. 9:858776. doi: 10.3389/fmed.2022.858776
Received: 20 January 2022; Accepted: 13 September 2022;
Published: 06 October 2022.
Edited by:
Natarajaseenivasan Kalimuthusamy, Bharathidasan University, IndiaReviewed by:
Sivan Padma Priya, Ras al-Khaimah Medical and Health Sciences University, United Arab EmiratesAri Winasti Satyagraha, Eijkman Institute for Molecular Biology, Indonesia
Copyright © 2022 Jacob, Lukose, Bankapur, Mithun, Vani Lakshmi, Acharya, Rao, Kamath, Baby, Rao and Chidangil. This is an open-access article distributed under the terms of the Creative Commons Attribution License (CC BY). The use, distribution or reproduction in other forums is permitted, provided the original author(s) and the copyright owner(s) are credited and that the original publication in this journal is cited, in accordance with accepted academic practice. No use, distribution or reproduction is permitted which does not comply with these terms.
*Correspondence: Sanu Susan Jacob, c2FudS5zdXNhbkBtYW5pcGFsLmVkdQ==