 Ziyan Yu
 Jie Ye
 Fan Lu1,3*
 Meixiao Shen
- 1School of Ophthalmology and Optometry, Wenzhou Medical University, Wenzhou, China
- 2Department of Ophthalmology, The Fourth Affiliated Hospital of China Medical University, Shenyang, China
- 3State Key Laboratory of Optometry, Ophthalmology and Vision Science, Wenzhou, China
Objective: The aim of this study was to explore hotspots and global research trends on optical coherence tomography (OCT) in the ophthalmic imaging field using the bibliometric technique.
Methods: Documents related to OCT in the ophthalmic imaging field between 2011 and 2020 were extracted from the Science Citation Index (SCI) Expanded database. Downloaded raw data were analyzed using the VOSviewer and CiteSpace software. Bibliometric networks, including publication number per year, countries, authors, journals, international collaborations, and keywords were constructed.
Results: A total of 4,270 peer-reviewed documents were retrieved, and annual research output in the past 10 years has increased significantly. The largest publishing country was the United States, and the most productive journal was Investigative Ophthalmology and Visual Science (IOVS). The most active academic institution was the University of California, Los Angeles, and the top rank publishing author was Duker JS. The most co-cited references mainly focused on new emerging OCT techniques such as spectral domain optical coherence tomography (SD-OCT) and optical coherence tomography angiography (OCTA).
Conclusion: The bibliometric analysis of development trends on OCT in the ophthalmic imaging field on various aspects could provide developers or researchers with valuable information to propose future research directions and to pursue further cooperation.
Introduction
Optical coherence tomography (OCT) was introduced in the early 1990's and has become one of the most successful techniques for displaying the three-dimensional (3D) image of optical tissue biopsy in vivo (1). OCT has been applied in clinical research and practice in the ophthalmic field since the 90's. It is a non-invasive, non-contact, and rapid inspection method with a high resolution, and the penetration depth is up to a few millimeters in the eyes (2). OCT can reflect the morphological changes of the retina. It also can measure the thickness and volume of the retina, image the optic nerve disk, and map the ganglion cells in the macular area (3–6). Furthermore, OCT technology can provide 3D structural imaging and functional parameter information of biological tissues. OCT angiography (OCTA) is a non-invasive, new vascular imaging technique that can rapidly image retinal blood vessels, generate high-resolution pictures, and quantify the blood vessel density and blood flow of the retina and choroid via novel algorithms. OCTA is important for early diagnosis, follow-up, and development of new preventive and treatment strategies for fundus and optic nerve diseases (7, 8).
Numerous academic documents about OCT in the ophthalmic imaging field have been published since the 1990's. The bibliometric analysis uses statistical and mathematical methods to explore and analyze large volumes of scientific documents. Mapping knowledge domain (MKD) is a method of revealing scientific hotspots and knowledge structures by using document analysis software (VOSviewer and CiteSpace) to create knowledge mapping and categorize published documents (9, 10). In this research, the Science Citation Index (SCI). Expanded database was selected as a primary data source, and the bibliometric analysis to explore trends in ophthalmic OCT research was performed using the tools of MKD. Evaluating research performance in an academic field is crucial to revealing current research hotspots. At present, the knowledge mapping mainly includes keyword co-occurrence analysis (keywords with high-frequency citations) and keyword burst analysis (keywords with the strongest citation bursts) (11).
This bibliometric analysis was designed to analyze the academic output in the ophthalmic OCT field categorically and to visualize its publication trends, including numbers, source journals, author productivity, co-author productivity, co-citation analysis, and international collaborations within the past 10 years. MKD was performed to highlight underexplored areas of OCT research by illustrating the evolution of research in this field.
Methods
Database Selection and Search Strategy
The online SCI Expanded database was selected as the data source. “Optical coherence tomography” and “OCT” were set as the search keywords. The language type was limited to “English,” and only “article” published from 2011 to 2020 was considered. We also selected “ophthalmology” as a Web of Science category. Scotland, England, Wales, and Northern Ireland were four administrative regions, and articles from these regions were analyzed separately (not as one country like the United Kingdom). Hong Kong was included under People's Republic of China (PRC). Raw data retrieved from the SCI Expanded database were initially downloaded on January 28, 2021. The file was exported as “plain text,” and “full record and cited references” was selected. Basic information of each document, such as countries, organizations, authors, title, journal, abstract, keywords, and references, were extracted.
Mapping Analysis
In this research, a visualized bibliometric analysis was generated using the VOSviewer software (www.vosviewer.com) version 1.6.13 (10). This software is used to construct visualized bibliometric maps and generate node-link maps, including research trends information, such as countries, publications, and researchers, and the network information of the co-cited reference analysis and co-authorship analysis. Keywords are used to express the theme of the scientific literature, and the clustering of similar keywords resulted in co-occurrence keyword clusters, which could be used to explore the knowledge structure and hotspots in this research field. The CiteSpace 5.6.R2 software (Drexel University, Philadelphia, PA) was used to capture keywords with a strong burst, which could be considered as predictors of research frontiers.
Results
Annual Distributions of Publications
Derived from the selection criteria, 4,270 documents were retrieved from the SCI Expanded database related to ophthalmic OCT imaging from 2011 to 2020. The publication number rose gradually from 309 in 2011 to 535 in 2020 (Figure 1A). The top 50 strong citation burst keywords were extracted. Among these keywords, “spectral domain,” “spectral domain OCT,” and “spectral domain Optical Coherence Tomography” showed citation bursts from 2011 to 2015, in line with the rise of published documents (Figure 1B).
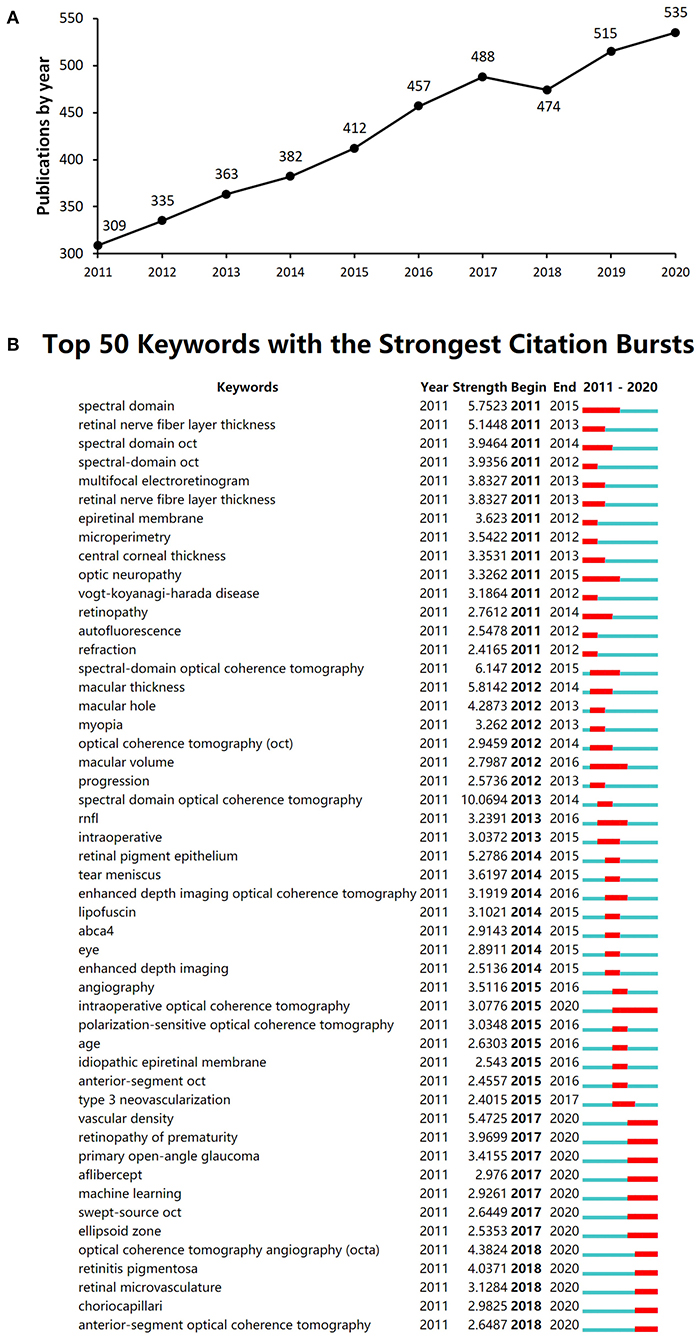
Figure 1. (A) The annual publication number from 2011 to 2020 in the ophthalmic optical coherence tomography (OCT) field. (B) The top 50 burst keywords from 2011 to 2020 in the ophthalmic OCT field.
Top Ten Productive Countries
A total of 4,270 documents originated from 71 countries. The top 10 countries accounted for 97% (4,141) of all documents in the OCT ophthalmic field (Table 1). The United States ranked first (1,371, 32.1%), China (462, 10.8%) ranked second, and Japan (401, 9.4%) ranked third among the top 10 countries. In the citation analysis, the United States (37,578 citations) took the first place, followed by Japan (7,624 citations) and China (7,263 citations). Communication degree among countries was reflected by the country co-authorship analysis. Nodes represent the influence of each country; the larger the node, the greater the influence. Links between nodes revealed the cooperation degree of countries; the distance and strength of links correspond to the closeness of cooperation in the OCT field (Figure 2).
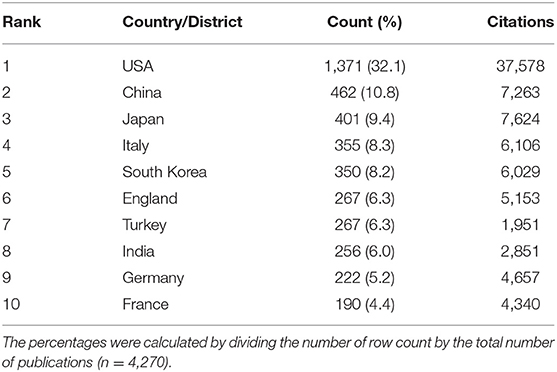
Table 1. Top ten productive countries from 2011 to 2020 in the ophthalmic optical coherence tomography (OCT) field.
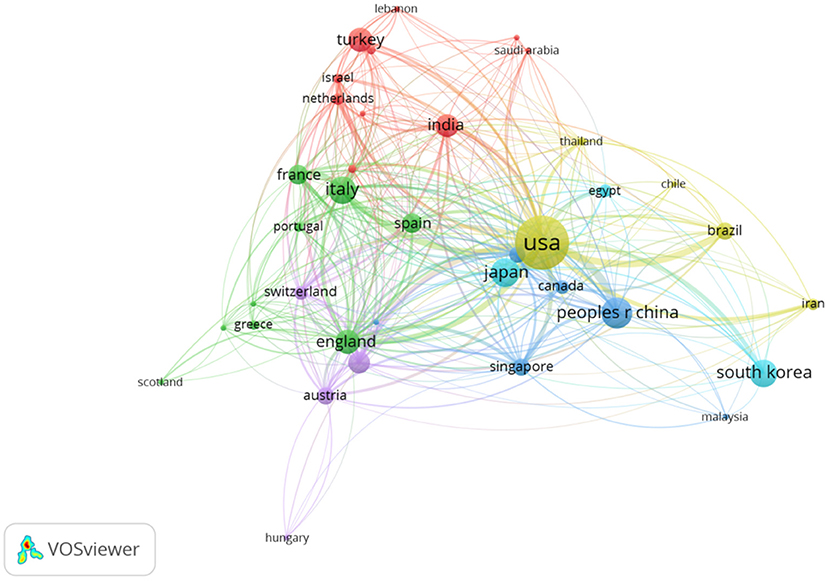
Figure 2. Distribution of main countries from 2011 to 2020 in the ophthalmic OCT field. The minimum number of a country's number was set as 10. A total of 38 countries met the threshold of 71 countries.
Top Ten Organizations
A total of 4,270 documents were obtained from 2,761 organizations, and the top 10 organizations accounted for 20.7% (885 documents) (Table 2). Using the co-authorship analysis, MKD of research organizations' distribution was constructed (Figure 3). The node size represented the number of published documents, and the link strength shows the closeness of cooperation.
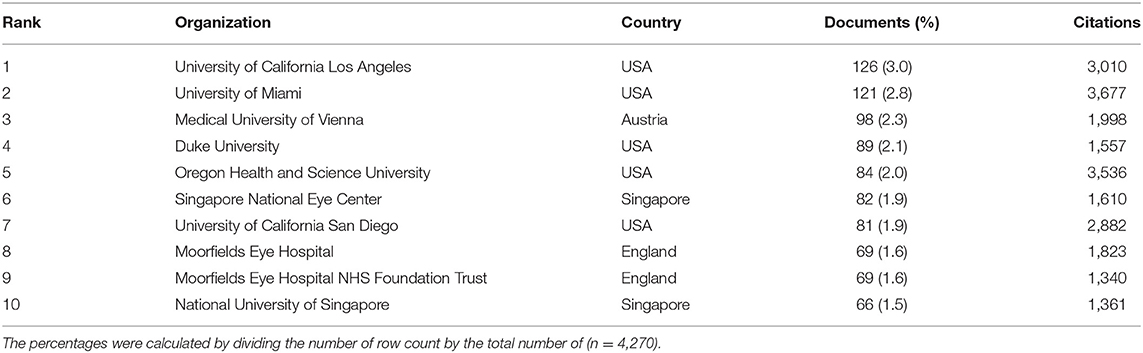
Table 2. Top ten productive organizations from 2011 to 2020 in the ophthalmic OCT field.
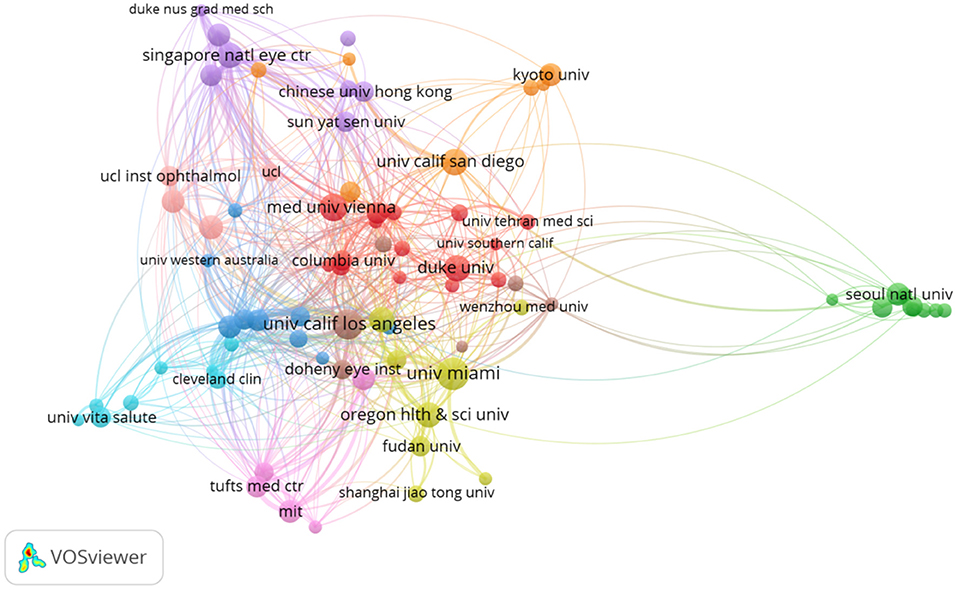
Figure 3. Cooperation network of main research organizations from 2011 to 2020 in the ophthalmic OCT field. The minimum number of documents of an organization was set as 20. A total of 83 organizations of the 2,761 organizations met the threshold.
Distribution of Authors and Co-authors
Approximately 12,960 authors contributed to 4,270 documents. Among these authors, Duker JS (86 articles) contributed the most, followed by Sadda SR (85 articles) and Huang D (80 articles). Author co-citations were analyzed to reveal authors' relative influence in the OCT field. Spaide RF (1,620 co-citations), followed by Jia YL (846 co-citations) and Leung CKS (695 co-citations) were the three top-ranked authors (Table 3). The co-authorship analysis revealed the MKD for distribution of research teams (Figure 4). The size of the node represented the number of documents. The greater links meant the higher density cooperation between these authors.
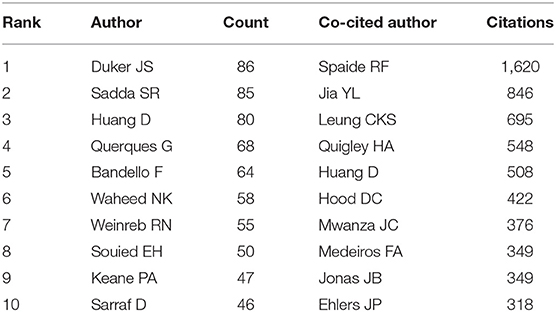
Table 3. Top ten productive authors and co-cited authors from 2011 to 2020 in the ophthalmic OCT field.

Figure 4. Co-authorship network of productive authors from 2011 to 2020 in the ophthalmic OCT field. The minimum number of documents of an author was set as 20. A total of 68 authors met the threshold of the 12,960 authors that were involved in this study.
Distribution of Journals
A total of 4,270 academic documents originated from 66 journals. The top 10 journals are shown in Table 4. The top three journals, Investigative Ophthalmology and Visual Science (512, 12.0%), Retina-The Journal of Retinal and Vitreous Diseases (437, 10.2%), and American Journal of Ophthalmology (305, 7.1%), accounted for 29.4% of all documents.
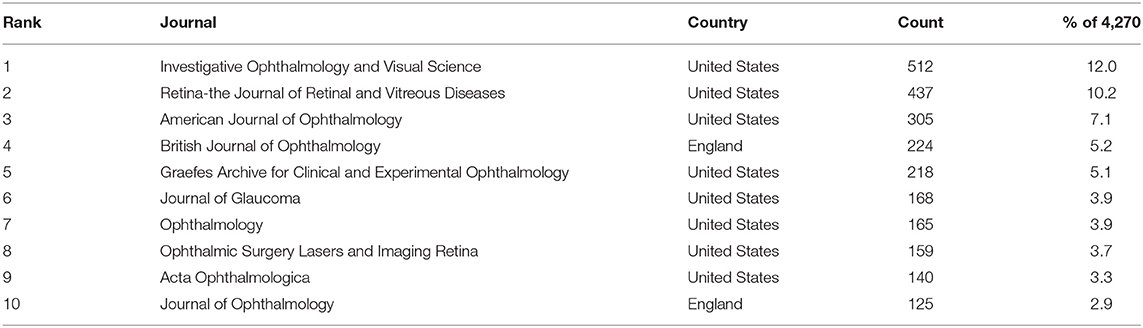
Table 4. Top ten main source journals from 2011 to 2020 in the ophthalmic OCT field.
Distribution of Co-cited References
A total of 44,080 cited references were retrieved in the co-citation analysis. Moreover, 50 was set as the minimum citation number of a cited reference. The top 10 co-cited references are shown in Table 5.
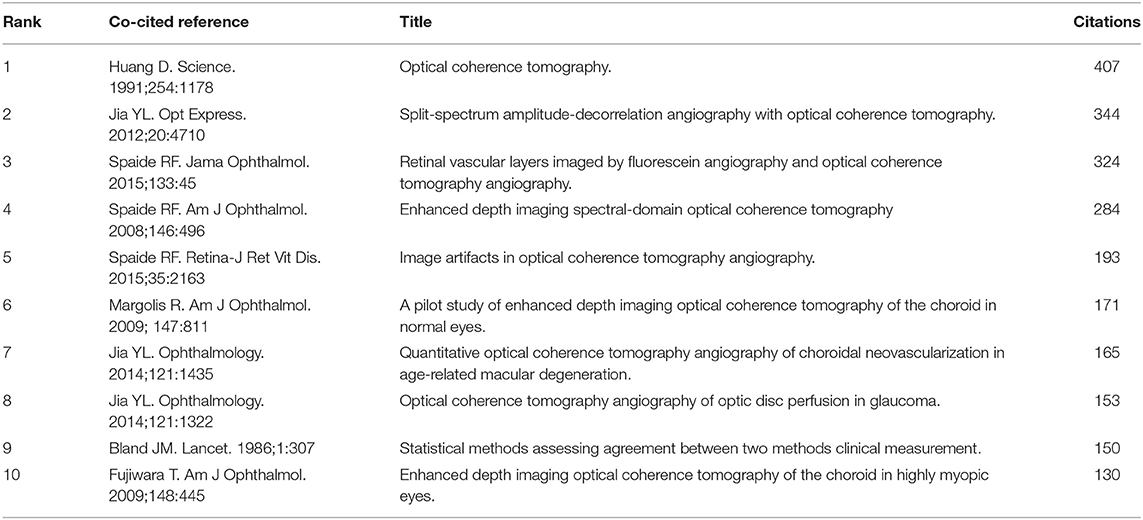
Table 5. Top ten co-cited references in OCT research from 2011 to 2020 in the ophthalmic OCT field.
Distribution of Key Words: Hotspots of OCT Study
Through the co-occurrence analysis of high-frequency keywords, the research hotspots of OCT were identified. The minimum co-occurrence number of a keyword was set as 20. Among the extracted 7,293 keywords that were involved in OCT, 116 keywords met the threshold. Based on the network, the keywords with similarities were clustered. The top 10 keywords for each cluster are listed in Table 6.
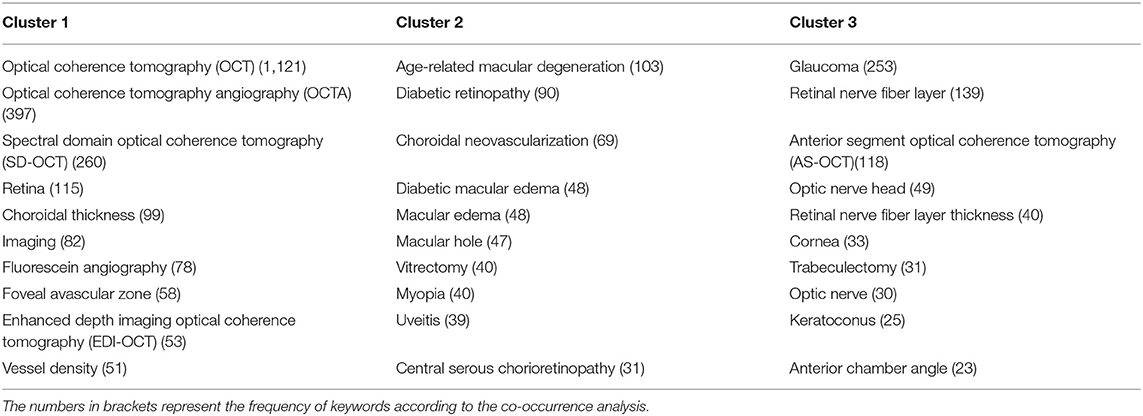
Table 6. Co-occurrence analysis of keywords. Top 10 keywords in the 3 clusters.
Discussion
In the present analysis, 4,270 documents related to ophthalmic OCT imaging from 2011 to 2020 were identified through the SCI Expanded database. As an important research index, the amount of academic documents is an important research index and can indicate the development directions in a research field. The annual publication number rose steadily in the past 10 years, representing the rapid development of OCT in the ophthalmic field. The University of California, Los Angeles, the University of Miami, and the Medical University of Vienna in Australia were the most productive and the most active institutions in international collaborations. The co-authorship and author co-citations analysis could provide information regarding author's contribution and relative influence guiding researchers and scientists to pursue scientific cooperation in the OCT imaging field. The United States, China, and Japan were the leading countries and made a great contribution to the publication in the ophthalmic OCT field (12–20). The United States is the key node cooperating with China, England, Italy, and other countries. Geographical distance may not be an influential factor affecting international cooperation. The co-citation analysis revealed related topics in high-quality academic documents. The top 10 co-cited references were mainly pertained to new technique, which were regarded as milestones in the history of OCT development. Notably, a publication regarding statistical methods used for accessing the degree of agreement ranked top 9 (19).
The keyword co-occurrence analysis and strongest burst keywords represented the evolution trends of research hotspots in this field and were considered to reflect the search theme. Choriocapillari and retinal microvasculature were the latest burst keywords, indicating that new emerging vascular imaging techniques such as en face OCT might be potential research hotspots in the future (21). “Machine learning” is the burst keyword from 2017 to 2020. Artificial intelligence (AI)-based algorithms can enhance quality and efficiency and has been widely used in medical imaging at present (22, 23). Keyword co-occurrence cluster analyses showed that the frontier discipline and internal structure related to the ophthalmic OCT literature mainly formed three clusters (Table 6), and each cluster was summarized in a specific theme. Cluster 1 is linked with imaging technique development [i.e., spectral-domain OCT (SD-OCT), OCTA, swept-source OCT (SS-OCT), and enhanced depth imaging OCT (EDI-OCT)] (24–28). Cluster 2 is linked with retinal and choroidal diseases (e.g., age-related macular degeneration, diabetic retinopathy, high myopia, and uveitis) (29–31). Cluster 3 is linked with glaucoma and cornea diseases (e.g., glaucoma, retinal nerve fiber layer, anterior segment OCT (AS-OCT), and keratoconus) (32, 33). These research hotspots mainly focused on the mechanism, pathology, biological measurement, diagnosis, and treatment guidance of ocular diseases.
However, some methodological limitations may exist in the present analysis. The result only included the perspective of application in the ophthalmic field, although OCT and OCTA are now used extensively in the neurological research field. In addition, the language was restricted to English, and linguistic bias may exist. The SCI was selected in our study, and PubMed, Google Scholar, ProQuest, PsycINFO, and other databases were not included. The SCI Expanded database is enough for bibliometric analysis, but there is minimal difference between SCI Expanded and WoSCC for the retrieved documents' number. Furthermore, some bibliometric experts use “front page” as a filter to improve the bibliometric analysis and to reduce unrelated documents for analysis (34).
Conclusion
This study reviewed academic publications for the past decade in the ophthalmic OCT imaging field to provide a global view of the current research output. The valuable information and guidance provided by the current study are crucial for global ophthalmologists and OCT developers to propose future research directions and to seek collaboration opportunities in the ophthalmic OCT imaging field.
Author Contributions
FL and MS: design of this study and supervision. ZY and JY: literature search and data analysis. ZY, JY, FL, and MS: manuscript writing and editing. All authors approved the final version of the article.
Funding
This study was supported by the Natural Science Foundation of China (NSFC 82000877) and the National Key Project of Research and Development Program of Zhejiang Province (2019C03045). The sponsors did not participate in the design or implementation of this study.
Conflict of Interest
The authors declare that the research was conducted in the absence of any commercial or financial relationships that could be construed as a potential conflict of interest.
Publisher's Note
All claims expressed in this article are solely those of the authors and do not necessarily represent those of their affiliated organizations, or those of the publisher, the editors and the reviewers. Any product that may be evaluated in this article, or claim that may be made by its manufacturer, is not guaranteed or endorsed by the publisher.
Acknowledgments
The authors thank all reviewers for their valuable comments.
References
1. Huang D, Swanson EA, Lin CP, Schuman JS, Stinson WG, Chang W, et al. Optical coherence tomography. Science. (1991) 254:1178–81. doi: 10.1126/science.1957169
2. Drexler W, Fujimoto JG. Optical Coherence Tomography: Technology and Applications. Berlin; Springer (2015).
3. Staurenghi G, Sadda S, Chakravarthy U, Spaide RF. International nomenclature for optical coherence tomography (IN∙OCT) panel. Proposed lexicon for anatomic landmarks in normal posterior segment spectral-domain optical coherence tomography: the IN·OCT consensus. Ophthalmology. (2014) 121:1572–8. doi: 10.1016/j.ophtha.2014.02.023
4. Toosy AT, Mason DF, Miller DH. Optic neuritis. Lancet Neurol. (2014) 13:83–99. doi: 10.1016/S1474-4422(13)70259-X
5. London F, Zéphir H, Drumez E, Labreuche J, Hadhoum N, Lannoy J, et al. Optical coherence tomography: a window to the optic nerve in clinically isolated syndrome. Brain. (2019) 142:903–15. doi: 10.1093/brain/awz038
6. Qian CX, Charran D, Strong CR, Steffens TJ, Jayasundera T, Heckenlively JR. Optical coherence tomography examination of the retinal pigment epithelium in best vitelliform macular dystrophy. Ophthalmology. (2017) 124:456–63. doi: 10.1016/j.ophtha.2016.11.022
7. Ugurlu A, Yilmaz H. Influences of hypomagnesemia on optic nerve and retinal vascular structure determined using optical coherence tomography (OCT) angiography. Curr Eye Res. (2021) 46:579–84. doi: 10.1080/02713683.2020.1857779
8. Lupidi M, Cerquaglia A, Chhablani J, Fiore T, Singh SR, Cardillo Piccolino F, et al. Optical coherence tomography angiography in age-related macular degeneration: The game changer. Eur J Ophthalmol. (2018) 28:349–57. doi: 10.1177/1120672118766807
9. Zyoud SH, Zyoud AH. Coronavirus disease-19 in environmental fields: a bibliometric and visualization mapping analysis. Environ Dev Sustain. (2020) 6:1–29. doi: 10.1007/s10668-020-01004-5
10. Zhang J, Xie J, Hou W, Tu X, Xu J, Song F, et al. Mapping the knowledge structure of research on patient adherence: knowledge domain visualization based co-word analysis and social network analysis. PLoS ONE. (2012) 7:e34497. doi: 10.1371/journal.pone.0034497
11. Liang C, Luo A, Zhong Z. Knowledge mapping of medication literacy study: a visualized analysis using citespace. SAGE Open Med. (2018) 6:2050312118800199. doi: 10.1177/2050312118800199
12. Jia Y, Tan O, Tokayer J, Potsaid B, Wang Y, Liu JJ, et al. Split-spectrum amplitude-decorrelation angiography with optical coherence tomography. Opt Express. (2012) 20:4710–25. doi: 10.1364/OE.20.004710
13. Spaide RF, Klancnik JM Jr, Cooney MJ. Retinal vascular layers imaged by fluorescein angiography and optical coherence tomography angiography. JAMA Ophthalmol. (2015) 133:45–50. doi: 10.1001/jamaophthalmol.2014.3616
14. Spaide RF, Koizumi H, Pozzoni MC. Enhanced depth imaging spectral-domain optical coherence tomography. Am J Ophthalmol. (2008) 146:496–500. doi: 10.1016/j.ajo.2008.05.032
15. Spaide RF, Fujimoto JG, Waheed NK. Image artifacts in optical coherence tomography angiography. Retina. (2015) 35:2163–80. doi: 10.1097/IAE.0000000000000765
16. Margolis R, Spaide RF. A pilot study of enhanced depth imaging optical coherence tomography of the choroid in normal eyes. Am J Ophthalmol. (2009) 147:811–5. doi: 10.1016/j.ajo.2008.12.008
17. Jia Y, Bailey ST, Wilson DJ, Tan O, Klein ML, Flaxel CJ, et al. Quantitative optical coherence tomography angiography of choroidal neovascularization in age-related macular degeneration. Ophthalmology. (2014) 121:1435–44. doi: 10.1016/j.ophtha.2014.01.034
18. Jia Y, Wei E, Wang X, Zhang X, Morrison JC, Parikh M, et al. Optical coherence tomography angiography of optic disc perfusion in glaucoma. Ophthalmology. (2014) 121:1322–32. doi: 10.1016/j.ophtha.2014.01.021
19. Bland JM, Altman DG. Statistical methods for assessing agreement between two methods of clinical measurement. Lancet. (1986) 1:307–10. doi: 10.1016/S0140-6736(86)90837-8
20. Fujiwara T, Imamura Y, Margolis R, Slakter JS, Spaide RF. Enhanced depth imaging optical coherence tomography of the choroid in highly myopic eyes. Am J Ophthalmol. (2009) 148:445–50. doi: 10.1016/j.ajo.2009.04.029
21. Thouvenin O, Grieve K, Xiao P, Apelian C, Boccara AC. En face coherence microscopy [Invited]. Biomed Opt Express. (2017) 8:622–39. doi: 10.1364/BOE.8.000622
22. Ting DSW, Pasquale LR, Peng L, Campbell JP, Lee AY, Raman R, et al. Artificial intelligence and deep learning in ophthalmology. Br J Ophthalmol. (2019) 103:167–75. doi: 10.1136/bjophthalmol-2018-313173
23. Schmetterer L, Pasquale LR, Bressler NM, Webster DR, Abramoff M, Wong TY. Deep learning in ophthalmology: the technical and clinical considerations. Prog Retin Eye Res. (2019) 72:100759. doi: 10.1016/j.preteyeres.2019.04.003
24. Shields CL, Pellegrini M, Ferenczy SR, Shields JA. Enhanced depth imaging optical coherence tomography of intraocular tumors: from placid to seasick to rock and rolling topography–the 2013 Francesco Orzalesi Lecture. Retina. (2014) 34:1495–512. doi: 10.1097/IAE.0000000000000288
25. Say EA, Shah SU, Ferenczy S, Shields CL. Optical coherence tomography of retinal and choroidal tumors. J Ophthalmol. (2012) 2012:385058. doi: 10.1155/2012/385058
26. Lee J, Moon BG, Cho AR, Yoon YH. Optical coherence tomography angiography of DME and its association with anti-VEGF treatment response. Ophthalmology. (2016) 123:2368–75. doi: 10.1016/j.ophtha.2016.07.010
27. Lee EJ, Kim TW, Weinreb RN. Improved reproducibility in measuring the laminar thickness on enhanced depth imaging SD-OCT images using maximum intensity projection. Invest Ophthalmol Vis Sci. (2012) 53:7576–82. doi: 10.1167/iovs.12-10305
28. Hussain MA, Bhuiyan A, Ishikawa H, Theodore Smith R, Schuman JS, Kotagiri R. An automated method for choroidal thickness measurement from enhanced depth imaging optical coherence tomography images. Comput Med Imaging Graph. (2018) 63:41–51. doi: 10.1016/j.compmedimag.2018.01.001
29. Jain S, Kumar V, Salunkhe N, Tewari R, Chandra P, Kumar A. Swept-source OCT analysis of the margin of choroidal coloboma: new insights. Ophthalmol Retina. (2020) 4:92–9. doi: 10.1016/j.oret.2019.08.010
30. Al-Sheikh M, Akil H, Pfau M, Sadda SR. Swept-source OCT angiography imaging of the foveal avascular zone and macular capillary network density in diabetic retinopathy. Invest Ophthalmol Vis Sci. (2016) 57:3907–13. doi: 10.1167/iovs.16-19570
31. Bo Q, Yan Q, Shen M, Song M, Sun M, Yu Y, et al. Appearance of polypoidal lesions in patients with polypoidal choroidal vasculopathy using swept-source optical coherence tomographic angiography. JAMA Ophthalmol. (2019) 137:642–50. doi: 10.1001/jamaophthalmol.2019.0449
32. Ang M, Baskaran M, Werkmeister RM, Chua J, Schmidl D, Aranha Dos Santos V, et al. Anterior segment optical coherence tomography. Prog Retin Eye Res. (2018) 66:132–56. doi: 10.1016/j.preteyeres.2018.04.002
33. Liu J, Frangi AF, Baskaran M, Aung T. Segmentation and quantification for angle-closure glaucoma assessment in anterior segment OCT. IEEE Trans Med Imaging. (2017) 36:1930–8. doi: 10.1109/TMI.2017.2703147
Keywords: bibliometric analysis, optical coherence tomography (OCT), VOSviewer, ophthalmology (MeSH), OCTA
Citation: Yu Z, Ye J, Lu F and Shen M (2022) Trends in Research Related to Ophthalmic OCT Imaging From 2011 to 2020: A Bibliometric Analysis. Front. Med. 9:820706. doi: 10.3389/fmed.2022.820706
Received: 23 November 2021; Accepted: 17 February 2022;
Published: 27 April 2022.
Edited by:
Zhenzhen Liu, Sun Yat-sen University, ChinaReviewed by:
Olwen C. Murphy, Johns Hopkins University, United StatesZahra Amini, Isfahan University of Medical Sciences, Iran
Copyright © 2022 Yu, Ye, Lu and Shen. This is an open-access article distributed under the terms of the Creative Commons Attribution License (CC BY). The use, distribution or reproduction in other forums is permitted, provided the original author(s) and the copyright owner(s) are credited and that the original publication in this journal is cited, in accordance with accepted academic practice. No use, distribution or reproduction is permitted which does not comply with these terms.
*Correspondence: Meixiao Shen, c214NzdAc29odS5jb20=; Fan Lu, bHVmYW42MkBtYWlsLmV5ZS5hYy5jbg==