- 1Department of Geriatric Psychiatry, Shanghai Mental Health Center, Shanghai Jiao Tong University School of Medicine, Shanghai, China
- 2Alzheimer’s Disease and Related Disorders Center, Shanghai Jiao Tong University, Shanghai, China
Background: Recent Alzheimer’s disease (AD) hypotheses implicate that hepatic metabolic disorders might contribute to the disease pathogenesis of AD, but the mechanism remains unclear.
Aims: To investigate whether the elevated aspartate aminotransferase (AST) and Alanine aminotransferase (ALT) ratio is associated with future cognitive decline, and to explore the possible mechanisms of liver enzymes affecting cognitive function.
Methods: Three different clinical cohorts were included in the current study, including one cross-sectional study (Cohort 1) and two longitudinal follow-up studies (Cohort 2 and 3). All participants completed a detailed clinical evaluation, neuropsychological tests, and liver enzyme tests. In addition, some of them also underwent structural magnetic resonance imaging (MRI) scans.
Results: Cohort 1 was derived from the CRC2017ZD02 program, including 135 amnestic mild cognitive impairment (aMCI) patients, 22 AD patients, and 319 normal controls. In this cross-sectional study, we found that the AST/ALT ratio was associated with AD (p = 0.014, OR = 1.848, 95%CI: 1.133∼3.012), but not aMCI; Cohort 2 was derived from the Shanghai Brain Health Program. A total of 260 community elderly people with normal cognitive function were included in the study and followed up for 2 years. In this 2-year longitudinal follow-up study, we found that a higher AST/ALT ratio was a risk factor for future development of aMCI (p = 0.014, HR = 1.848, 95%CI: 1.133∼3.021); Cohort 3 was derived from the China longitudinal aging study (CLAS) Program. A total of 94 community elderly people with normal cognitive function were followed up for 7 years, and all of them completed MRI scans. In this 7-year longitudinal follow-up study, we found that a higher AST/ALT ratio was a risk factor for future development of aMCI (p = 0.006, HR = 2.247, 95%CI: 1.248∼4.049), and the AST/ALT ratio was negatively correlated with right hippocampal volume (r = −0.148, p = 0.043).
Conclusion: An increased ratio of AST to ALT is associated with a higher risk of cognitive impairment and may impair cognitive function by affecting hippocampal volume.
Introduction
Alzheimer’s disease (AD) is a progressive brain degenerative disease, which is the most common type of dementia in the world (1). At present, more than 35 million people are suffering from AD in the world, and this number is expected to double by 2030 (2). The pathological features of AD include the accumulation of tau and amyloid β as well as neuroinflammation (3). In addition, nitric oxide, inflammatory mediators, and reactive oxygen species might also contribute to the development of AD (4). There is increasing evidence that patients with Alzheimer’s disease (AD) may exhibit metabolic disorders (5), and the liver plays a critical role in the pathological process of AD (6). For example, Manivannan et al. found that the liver tissue of AD patients contained more environmental pollutants than age-matched controls (7). Giambattistelli et al. found that AD patients had significantly reduced plasma albumin levels, and prolonged prothrombin time-prothrombin time (PT) time (8). Wang et al. found that there were significant differences between AD transgenic mice and wild-type mice in the metabolite of liver and brain tissues, and multiple metabolite biomarker candidates had good identification abilities (9). Similarly, many studies have also shown that patients with cirrhotic often have changes in brain structure (10, 11). However, the mechanism by which the liver affects cognitive decline is not clear.
Alanine aminotransferase (ALT) and aspartate aminotransferase (AST) are widely used in general clinical practice to measure liver injury and have been proved to be associated with metabolic diseases, cardiovascular diseases (12), non-alcoholic fatty liver disease (NAFLD) (13), and upper tract urothelial cancer (14). Many studies have suggested that 40 U/L is the upper limit for both normal ALT and AST levels. However, these upper limits might not be adequate to exclude liver disease and to predict a risk of death from liver disease (12, 15). Weng et al. (16) found that elevated AST/ALT ratios (henceforth AST/ALT) were independently associated with an increased risk of developing cardiovascular disease (CVD) within 10 years in men. Zhou et al. (17) pointed out that the AST/ALT ratio was an independent factor in predicting the incidence of prostatic cancer (PCa). Canat et al. (18) suggested that an increased preoperative AST/ALT ratio had a significant association with renal capsule infiltration, renal vein invasion, and renal pelvis involvement in patients with non-metastatic renal cell carcinoma (RCC). However, until now, no studies have explored the plasma AST/ALT ratio and the risk of cognitive impairment. Therefore, we used three cohort studies to investigate the association between the AST/ALT ratio and cognitive impairment, and to explore the possible mechanisms by which abnormal liver function regulates cognitive function. Since AST and ALT are mainly related to Alzheimer’s disease, we mainly discuss the influence of liver enzymes on Alzheimer’s disease and its continuum (aMCI) in this study.
Materials and Methods
Participants
Data were obtained from the China Longitudinal Aging Study (CLAS) (19), the Brain Health Cohort study in Shanghai1 and the Clinical Research Center Project of Shanghai Mental Health Center (CRC2017ZD02). A total of three different cohorts were included in the current study. Ethical approval was obtained from the Ethics Committee of the Shanghai Mental Health Center, and all participants signed informed consent prior to the study.
Cohort 1 (the Clinical Research Center Project of Shanghai Mental Health Center)
Cohort 1 was derived from the CRC2017ZD02 program and consisted of 476 elderly people, including 135 amnestic mild cognitive impairment (aMCI) patients, 22 AD patients, and 319 normal controls. This cross-sectional study was conducted in Shanghai (China) between 2013 and 2015, and all the subjects were elderly people in the community who were not taking cognitive drugs. By using standardized questionnaires, we collected their general demographic information (such as age, gender, education, BMI), daily living information (such as smoking, drinking, drinking tea, hobbies and exercise) and disease related information (such as hypertension, diabetes, hyperlipidemia and heart disease). In addition, we also measured their liver metabolism related indicators, such as AST, ALT, high density lipoprotein, low density lipoprotein, fasting blood glucose, triglyceride, cholesterol and APOE E4.
Cohort 2 (Shanghai Elderly Brain Health Cohort)
Cohort 2 was derived from the Shanghai Brain Health Program. A total of 260 community elderly people with normal cognitive function were included in the study and followed up for 2 years. This project was launched in 2016, which was a prospective and observational cohort study. The specific content of this project includes understanding the mortality, prevalence, incidence, and population distribution characteristics of mild cognitive impairment and Alzheimer’s disease among the elderly over 55 years old in Shanghai communities. The inclusion criteria were as follows: (1) ≥55 years; (2) permanent population of Shanghai; (3) no evidence of serious mental illness, such as intellectual disability and schizophrenia; (4) no evidence of serious physical illness; (5) agreed to participate in the study. Exclusion criteria were as follows: (1) <55 years old; (2) floating population; (3) serious mental illness and physical illness or acute stress state, for example, acute medical disorders; and (4) the guardians or the participants or refused to participate in the study. More details could be found at the following website (see text footnote 1).
Cohort 3 (the China Longitudinal Aging Study)
Cohort 3 was derived from the China longitudinal aging study (CLAS) Program (19). In the current study, a total of 94 community elderly people with normal cognitive function were followed for 7 years. The biggest difference between Cohort 3 and Cohort 2 was that this cohort had T1 structural magnetic resonance (MRI) at baseline.
Diagnostic Criteria
Diagnostic Criteria for Alzheimer’s Disease
The AD patients were assessed by a medical doctor specialized in dementia disorders. All participants with AD met the DSM-IV criteria for dementia as well as the NINCDS-ADRDA criteria for AD (20). All patients with AD should meet either a positive of amyloid PET scans or a positive of Aβ 42 protein in the CNS.
Diagnostic Criteria for Mild Cognitive Impairment Due to Alzheimer’s Disease Amnestic Mild Cognitive Impairment
The diagnosis of aMCI was based on the recommendations from the national institute on aging-Alzheimer’s association workgroups on diagnostic guidelines for Alzheimer’s disease (21): (1) concern regarding a change in cognition; (2) impairment in one or more cognitive domains; (3) preservation of independence in functional abilities; (4) not demented; (5) scored <26 points on the MoCA at the screening visit (22).
Diagnostic Criteria for the Normal Elderly
Subjects would be considered normal elderly if they were (1) age 55 or above; (2) scored 26–30 points on the Montreal Cognitive Assessment (MoCA) at the screening visit (22); (3) without cognitive symptoms as diagnosed by a physician; (4) without visual or hearing impairment; (5) did not meet the diagnosis of amnestic mild cognitive impairment (MCI) or dementia.
Exclusion Criteria
Subjects should be excluded if they have the following situations: (1) under 55 years old; (2) received hormone replacement therapy; (3) took oral contraceptives; (4) with positive hepatitis B and hepatitis C viral antigens; (5) were diagnosed with fatty liver; (6) presence of an acute illness or serious mental illness (e.g., Myocardial infarction, stroke, acute infection, delirium, major depression, schizophrenia, learning disability); (7) refuse to collect plasma; (8) Misuse of alcohol or substances; (9) frontotemporal dementia, vascular dementia, and Lewy body or Parkinson dementia; (10) major depression according to geriatric depression scale (GDS 20/30) or DSM IV; (11) other diseases that might interfere with cognitive evaluation and liver function.
Sociodemographic and Disease-Related Information
Through face-to-face interviews, we obtained the subjects’ daily life information, such as whether they smoke, drink alcohol and exercise. The way of inquiry was as follows (take smoking as an example): Do you smoke? If yes, please answer how often you smoke per week. Through their medical records and self-reports, we also obtained information about the subjects’ diseases, such as high blood pressure, diabetes, and heart disease.
Blood Biochemical Index
All participants fasted at 10 p.m. and were tested for plasma markers the following day. Alanine aminotransferase (AST), Alanine aminotransferase (ALT), fasting plasma glucose, triglyceride, total cholesterol, high density lipoprotein, and low density lipoprotein reagents were provided by Shanghai Kehua Bio-Engineering Co., Ltd., and detection was performed using a Hitachi 7600 automatic biochemical analyzer.
T1 Structural Magnetic Resonance
All the subjects in Cohort 3 were scanned on a 3.0-tesla MRI scanner (Siemens MAGNETOM VERIO 3.0T, Germen). The parameters of T1-weighted 3D magnetization prepared rapid gradient echo (MPRAGE) sequences were as follows: Matrix size = 240 × 256; TE = 2.98 ms; TR = 2,300 ms; flip angle of 9°; field of view (FOV) = 240 × 256 mm; slice thickness = 1.2 mm. The Learning Embedding for Atlas Propagation (LEAP) algorithm was used to ascertain volumetric data (23). The whole brain volume, hippocampus volume and amygdala volume of each individual was extracted directly using FreeSurfer (24). The selection of target brain regions, such as hippocampus and amygdala, was based on previous studies (25–27).
Neuropsychological Tests
At baseline, all the subjects completed a battery of neuropsychological assessments which have been described previously (28), including a Chinese version of Montreal Cognitive Assessment (MoCA) (29), a Chinese version of the Rey Auditory-Verbal Learning Test (RAVLT), and a Chinese Version of Verbal Associates task. In addition, the Geriatric Depression Scale (GDS) (30) was used to exclude depression.
Statistical Analysis
Continuous variables are expressed as mean ± standard deviation, while categorical variables are expressed as frequencies (%). The Kruskal-Wallis H (skewed distribution) test one-way ANOVA (normal distribution), and chi-square test (categorical variables) were used to determine any significant differences among the AD group, the aMCI group and the normal group. A general linear regression model was used to compare AST/ALT ratios in the AD, aMCI, and normal cognitive groups. Then logistics regression analysis was used to explore the relationship between the AST/ALT ratio and aMCI or AD (Cohort 1). In the cohort 2 and 3, we used the ROC curve was used to investigate the sensitivity and specificity of plasma AST/ASLT ratios in predicting the future occurrence of aMCI. The COX regression models were used to examine the association between the plasma AST/ALT ratio and the risk of cognitive impairment (whether to convert to aMCI as the dependent variable, the transition time was the time variable) (Cohort 2 and 3). Finally, partial correlation analysis was used to explore the association between AST/ALT ratio and brain structure, during which hypertension and exercise were controlled (Cohort 3).
Results
Results Associated With Cohort 1
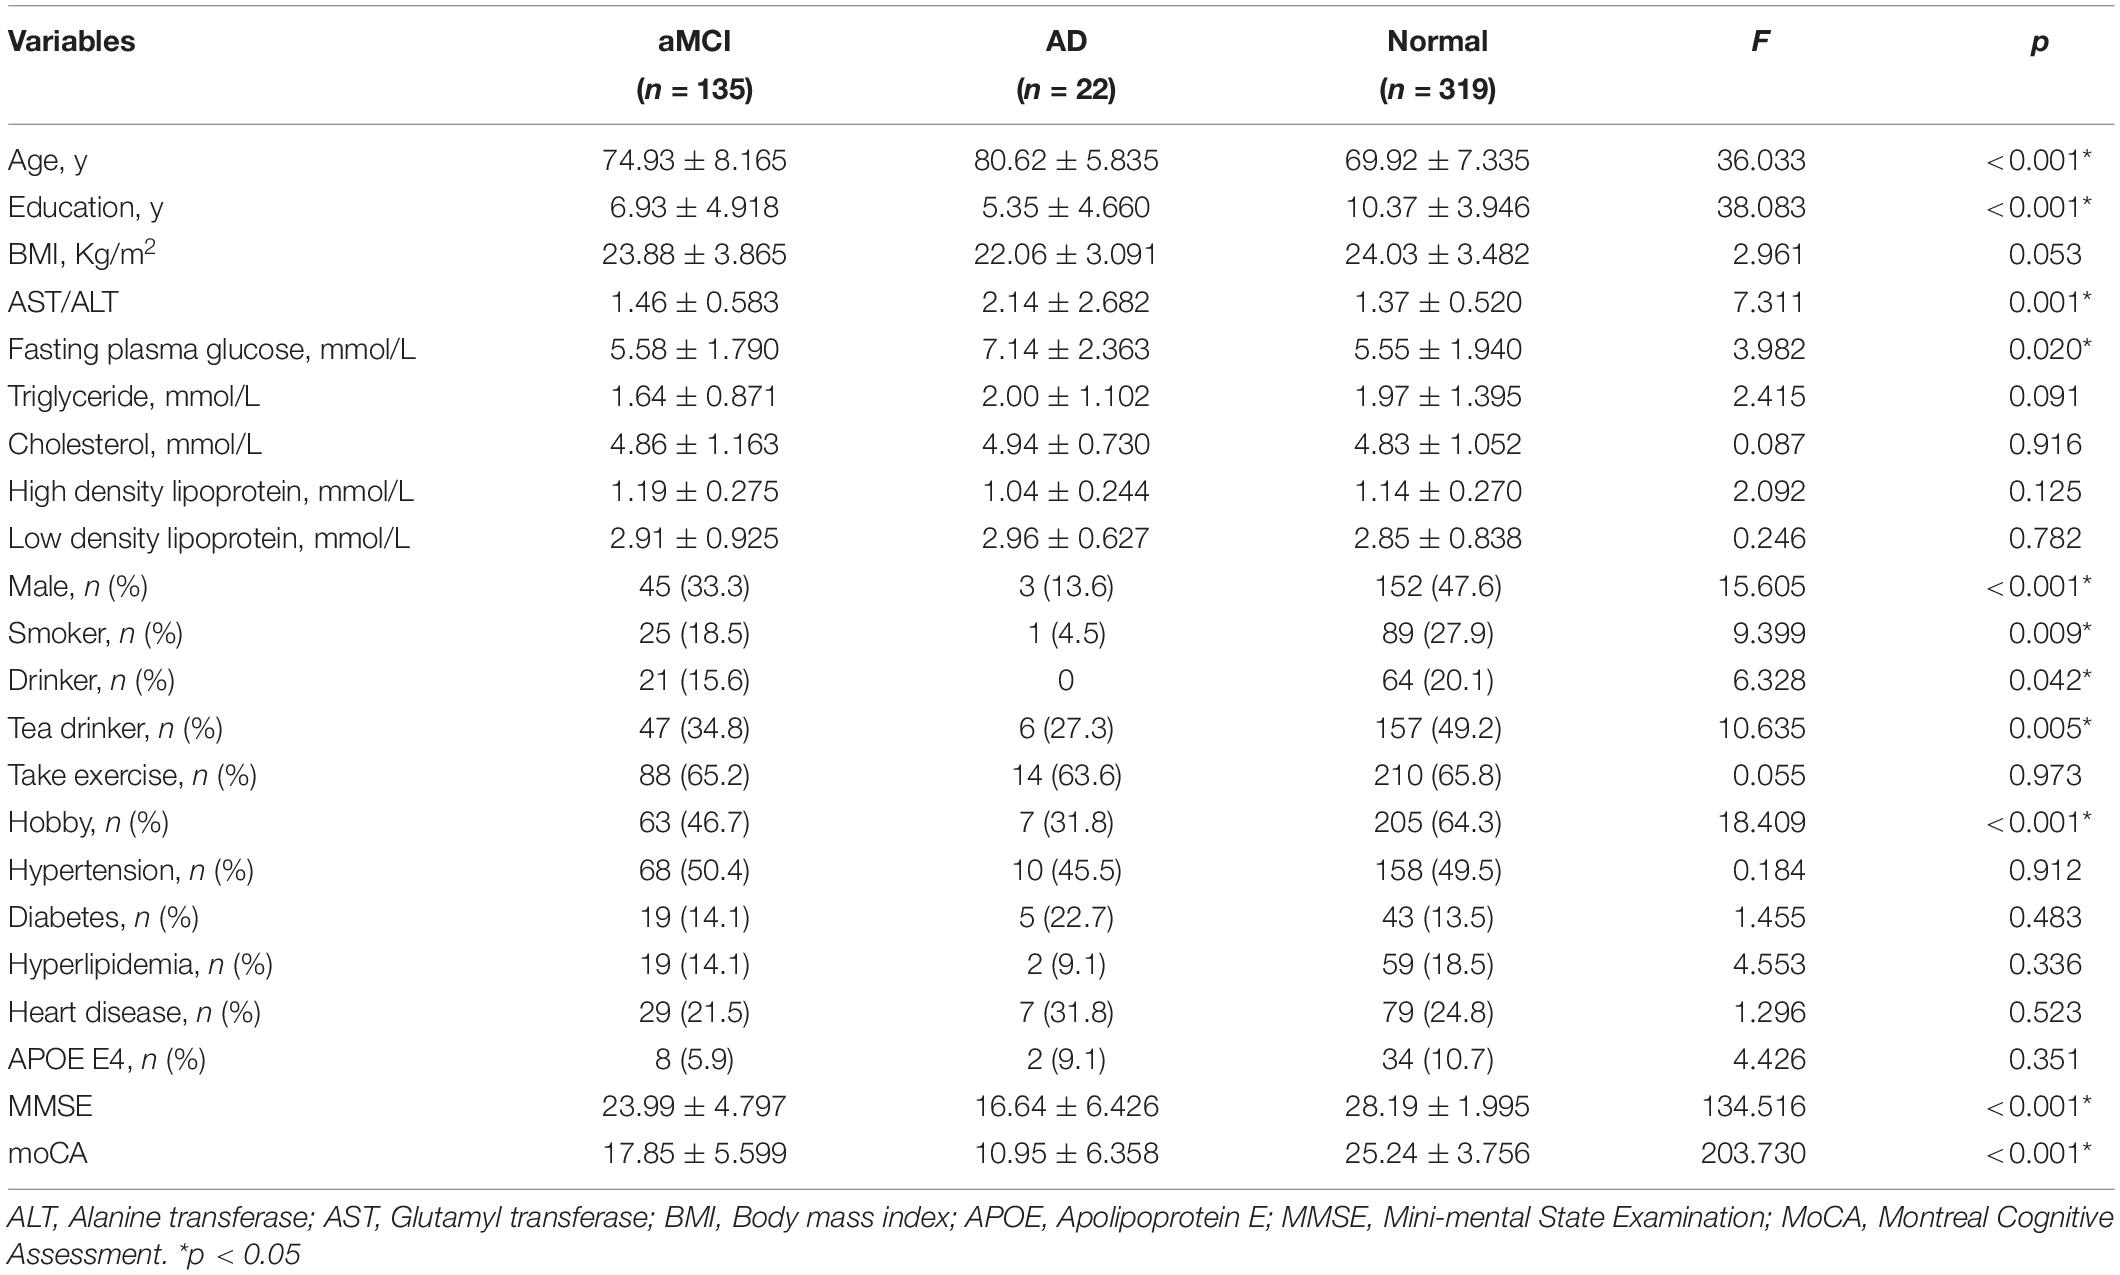
There were significant differences (p < 0.05) in age, education, plasma AST/ALT ratio, fasting plasma glucose, gender, smoker, drinker, hobby, MMSE scores and MoCA scores between AD, aMCI and the normal group, while there was no significant difference (p > 0.05) in BMI, triglyceride, cholesterol, high density lipoprotein, low density lipoprotein, take exercise, hypertension, diabetes, hyperlipidemia, heart disease, and APOE E4 among the three groups. Table 1 presents the results. By using a general linear regression model and controlling for gender, age, education, smoking, drinking alcohol, drinking tea, hobbies, and fasting blood glucose, we found that the plasma AST/ALT ratio in patients with AD was significantly higher (p < 0.05) than that in the normal group and the aMCI group, but there was no statistical difference (p > 0.05) between the normal group and the aMCI group. Figure 1 presents the results. By using multiple logistic regression analysis (no variables were controlled in the first step), we found that a higher AST/ALT ratio was associated with AD (p = 0.014, OR = 1.848, 95%CI: 1.133∼3.012), but not aMCI. However, when we put all the different variables into the logistics regression equation, we found no correlation between AST/ALT and AD or aMCI. Table 2 presents the results.
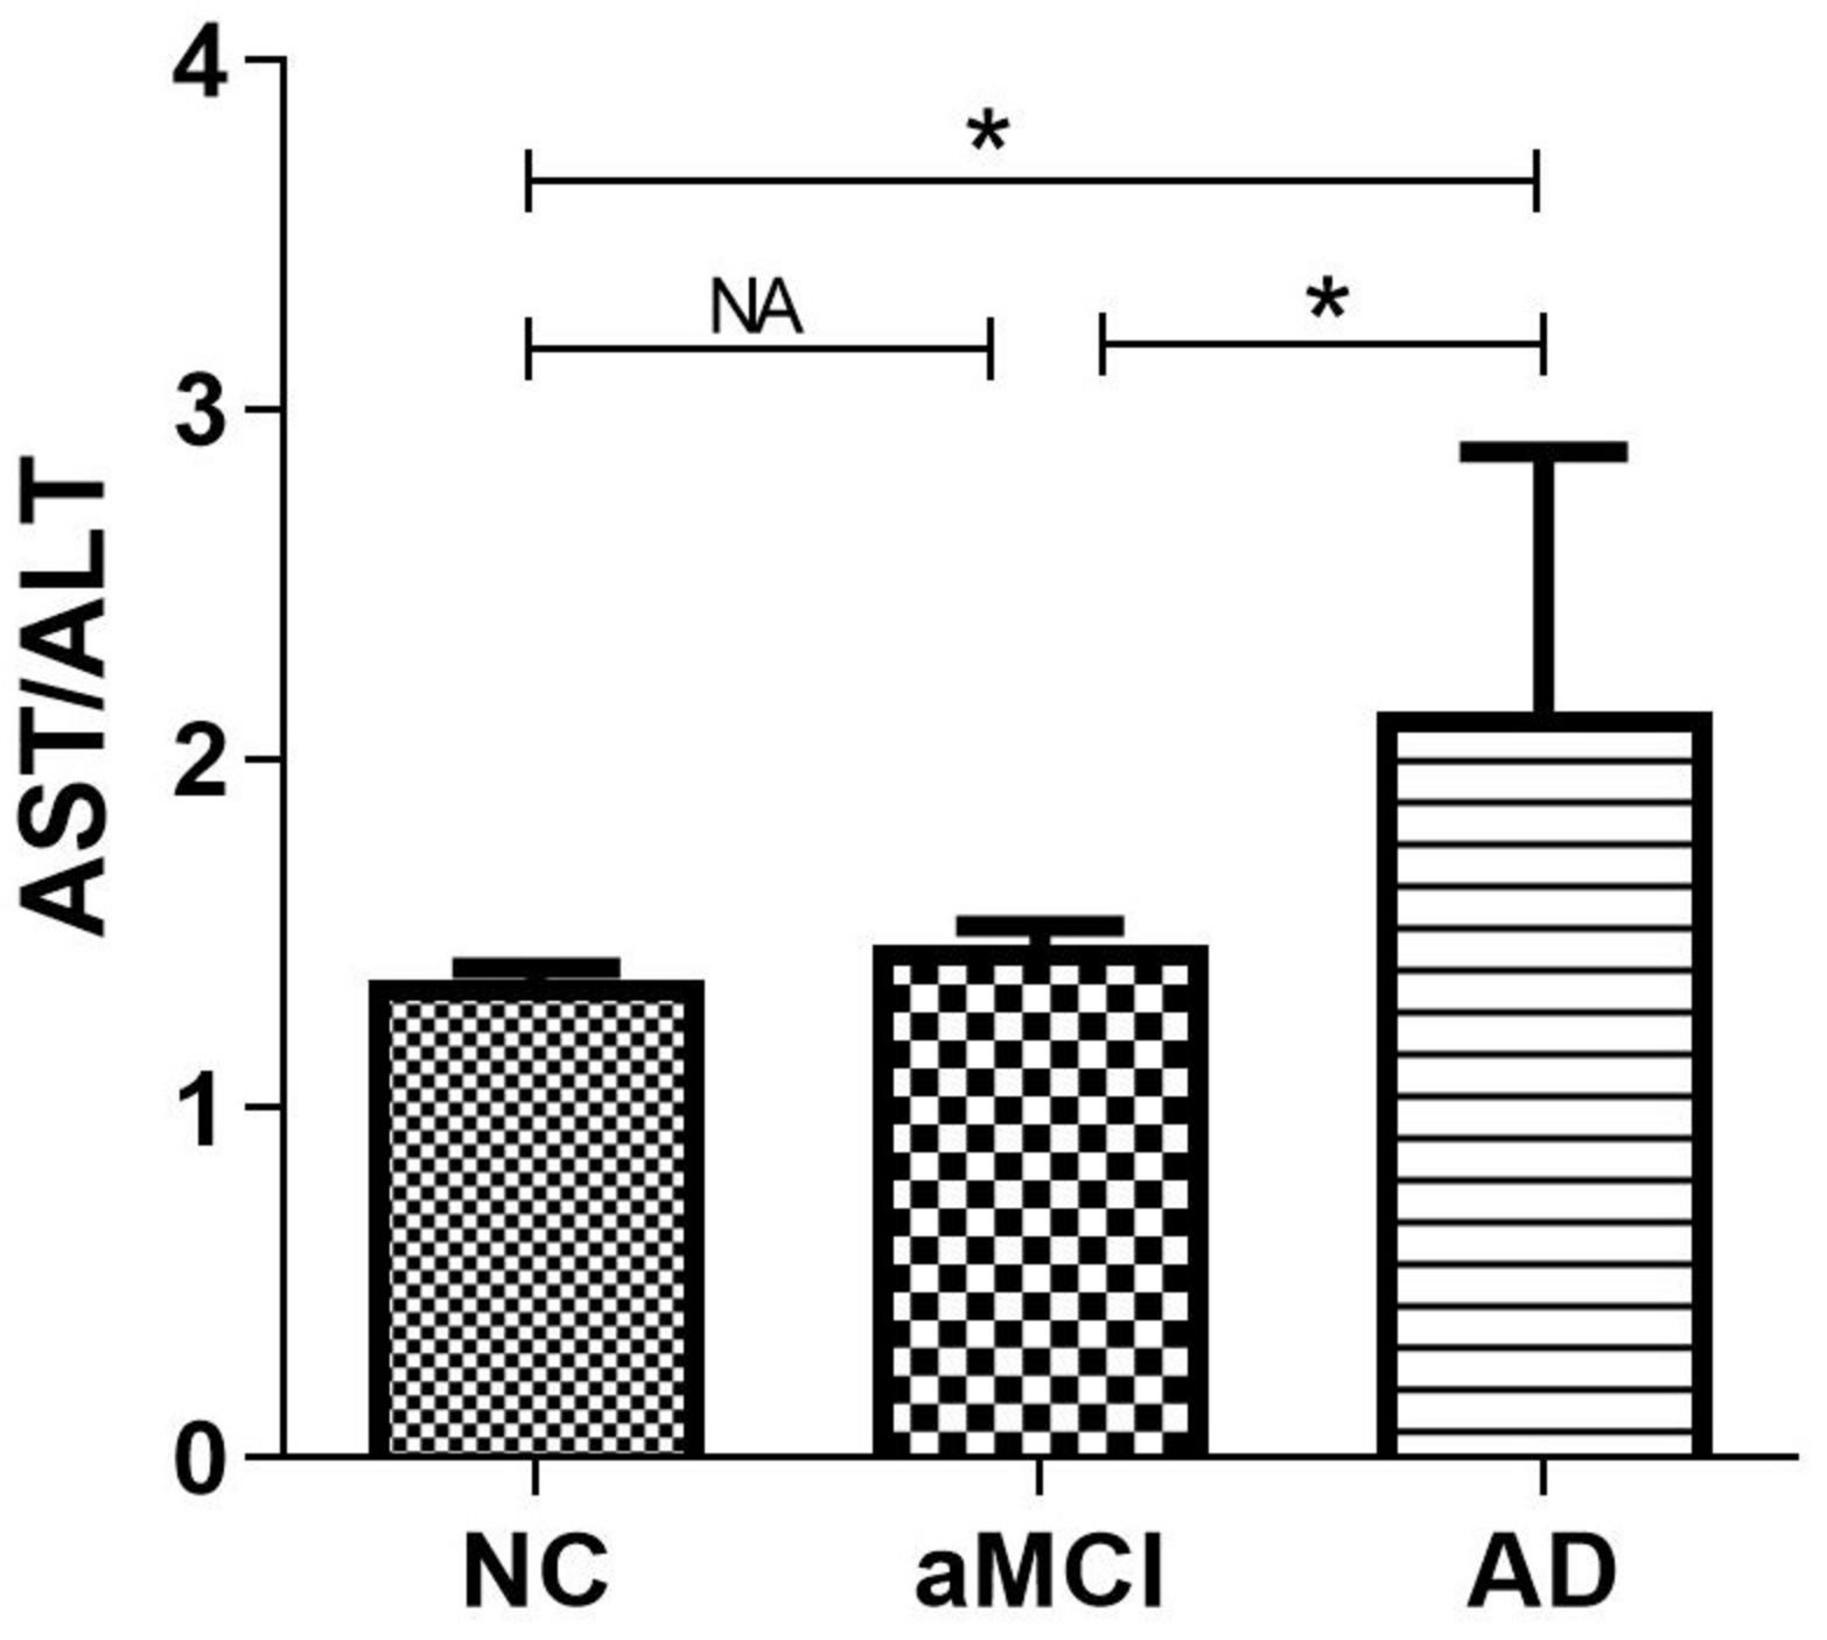
Figure 1. Compare the differences of AST/ALT among three groups. *p < 0.05; NA, p < 0.05; AST, aspartate aminotransferase; ALT, Alanine aminotransferase.
Results Associated With Cohort 2
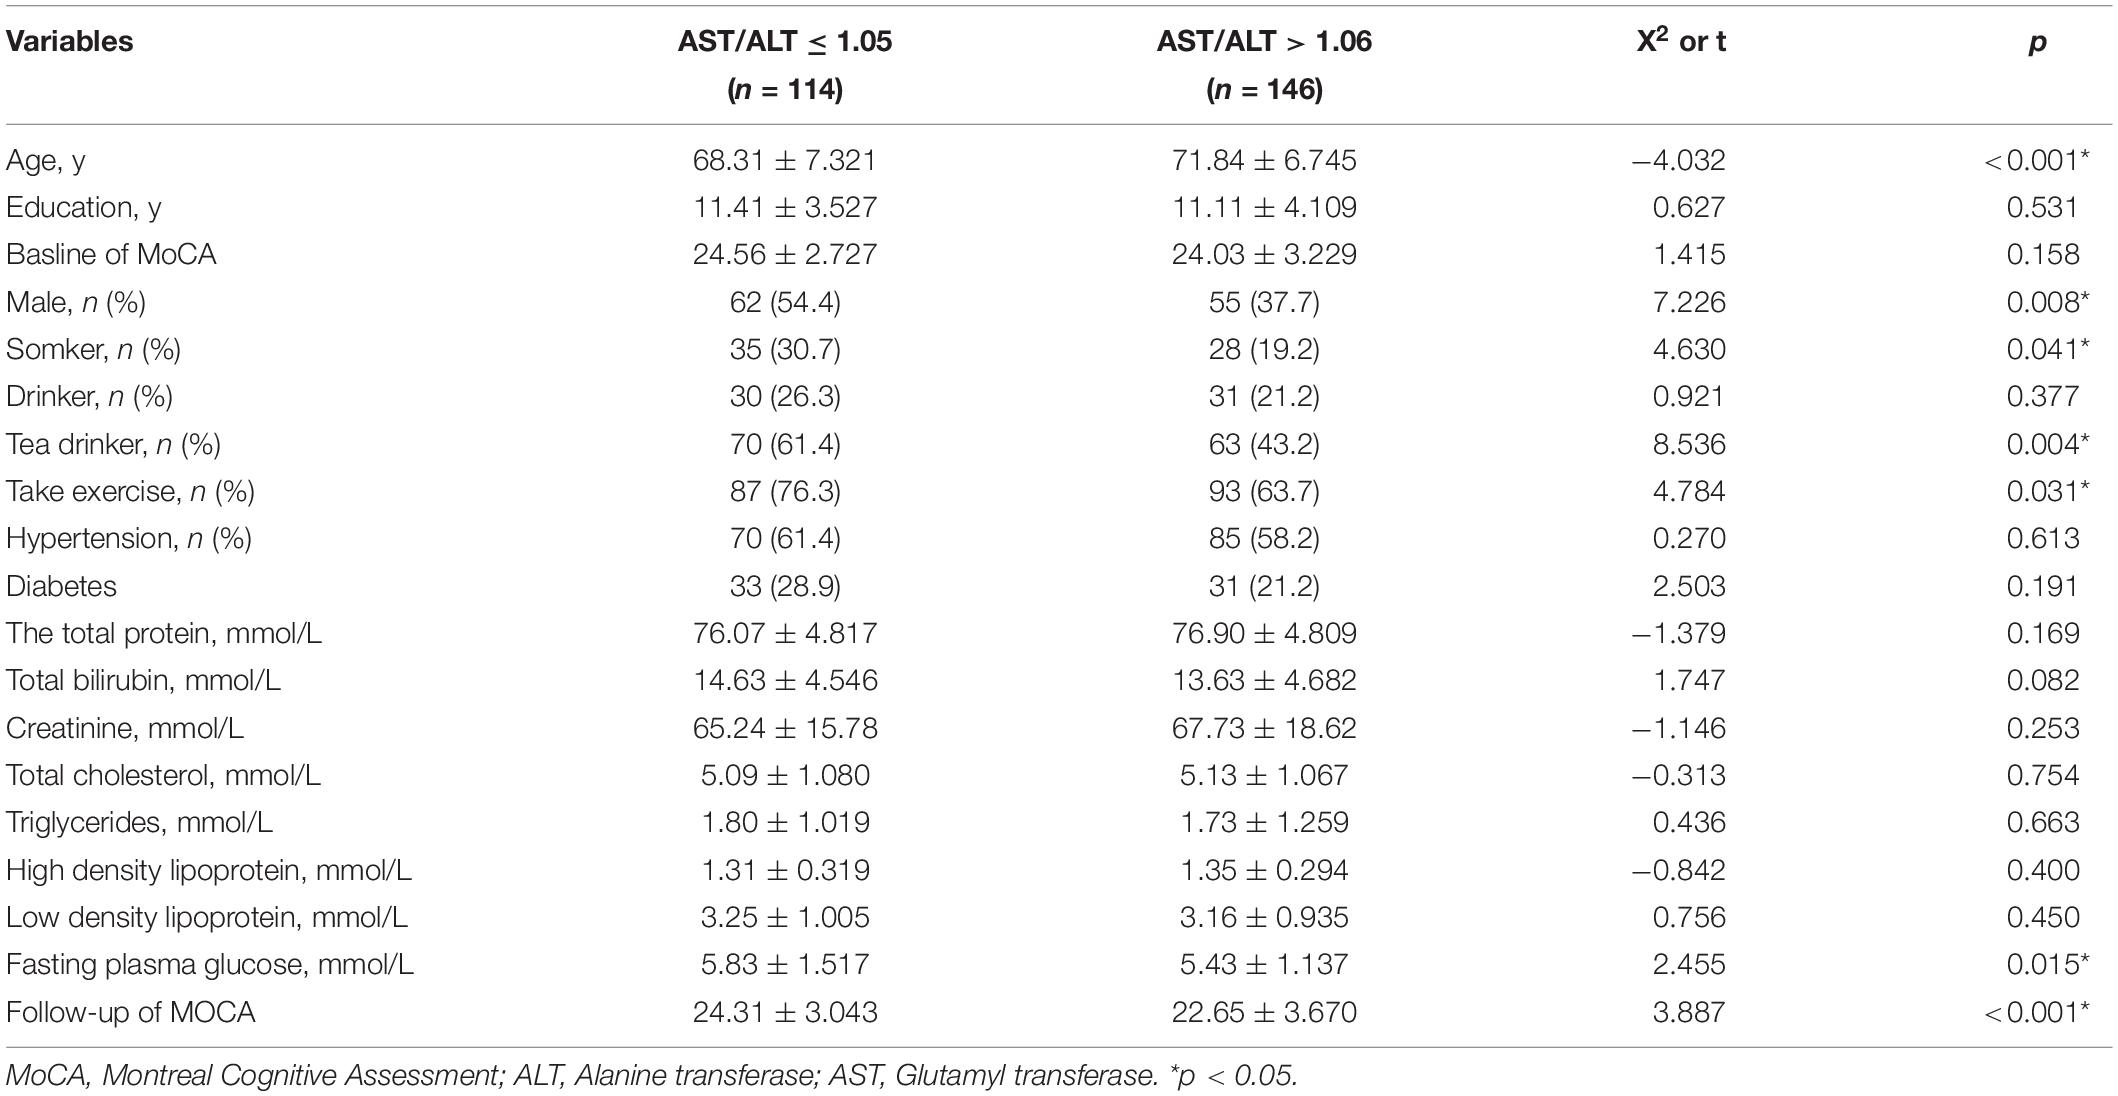
By using the ROC curve, we decided that the recommended cutoff value of AST/ALT for predicting the future occurrence of aMCI was 1.05 (sensitivity, 0.718; specificity, 0.505; the area under the ROC curve was 0.622; p = 0.002; 95%: 0.549∼0.695) (Figure 2). According to this cutoff value, the study population was divided into a lower AST/ALT ratio group and a higher AST/ALT ratio group. The average age of the lower AST/ALT group was significantly lower than that of the higher AST/ALT group, while the proportion of male, smokers, exercisers, fasting blood glucose and follow-up MOCA scores of the lower AST/ALT group were higher than those of the higher AST/ALT group (p < 0.05). There were no statistically significant differences (p > 0.05) in education, baseline MOCA score, alcohol intake, hypertension, diabetes, the total protein, total bilirubin, creatinine, total cholesterol, triglycerides, high density lipoprotein, or low density lipoprotein between the two groups. Table 3 presents the results. By using COX regression analysis, with future conversion to MCI as the dependent variable and transition time as the time variable, we found that high AST/ALT ratio was a risk factor for aMCI (p = 0.014, HR = 1.848, 95%CI: 1.133∼3.021). Table 4 and Figure 3 present the results.
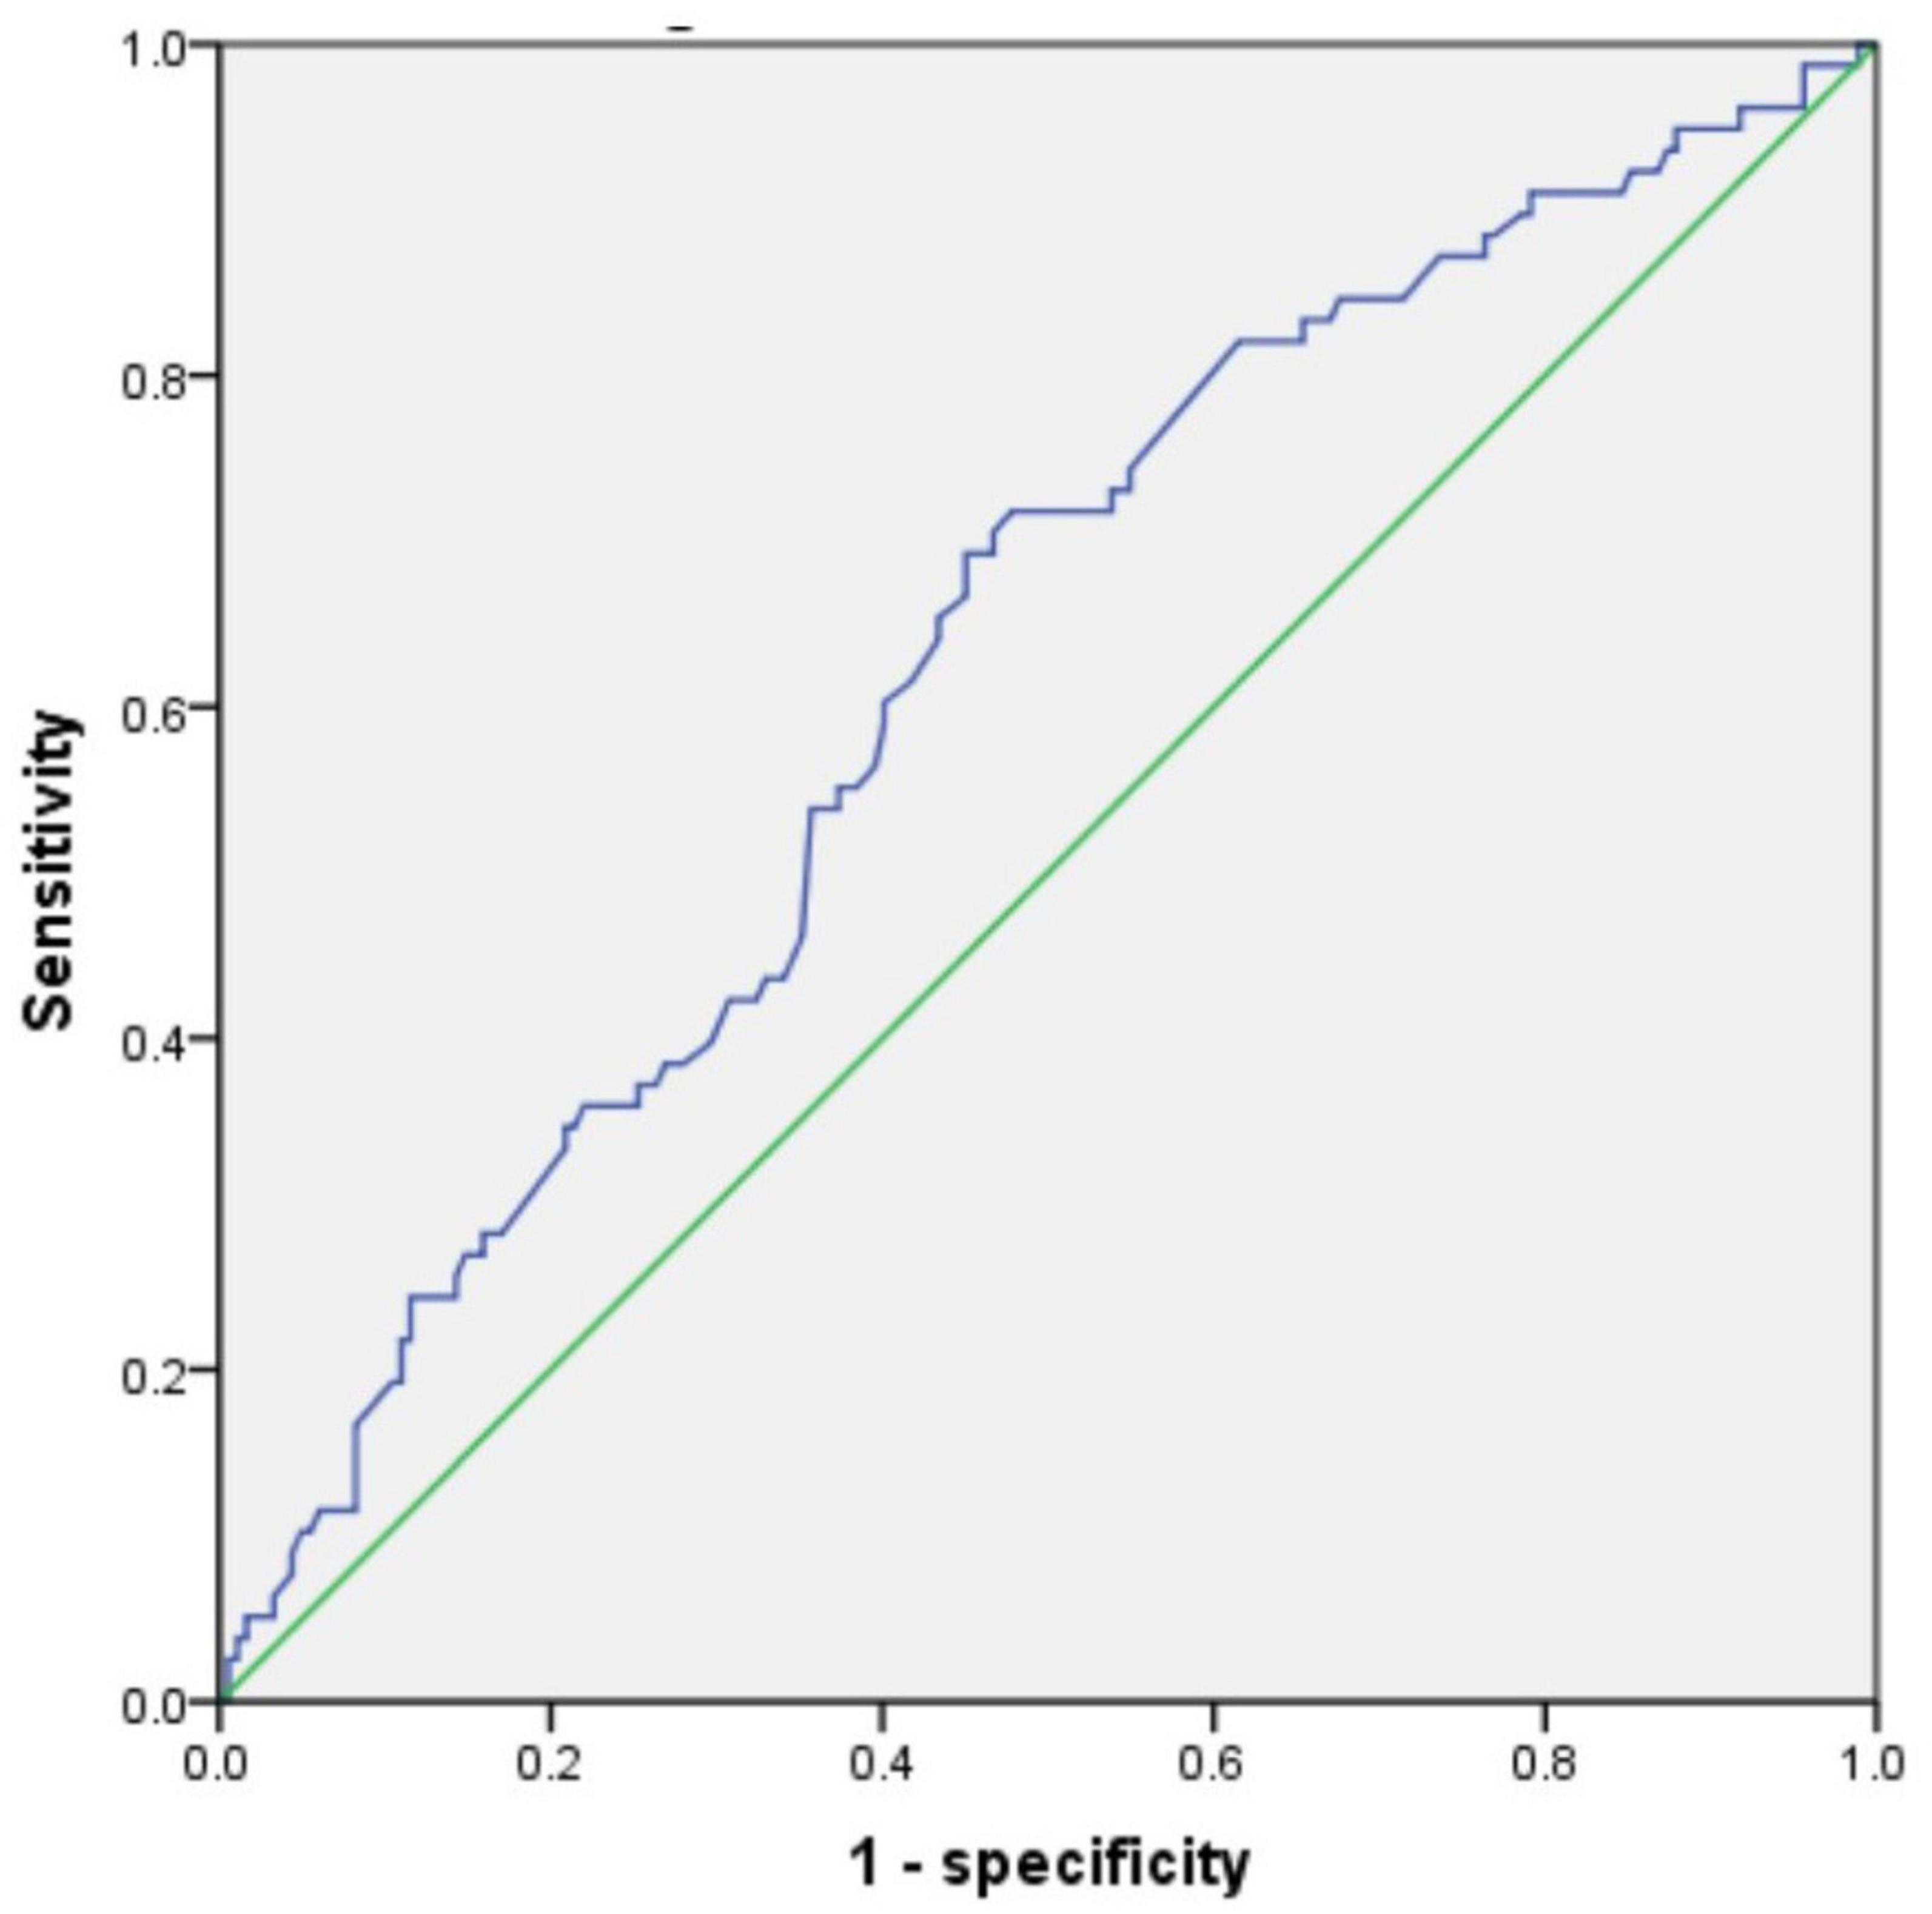
Figure 2. The ROC curve of AST/ALT for predicting the future occurrence of aMCI. AST, aspartate aminotransferase; ALT, Alanine aminotransferase.
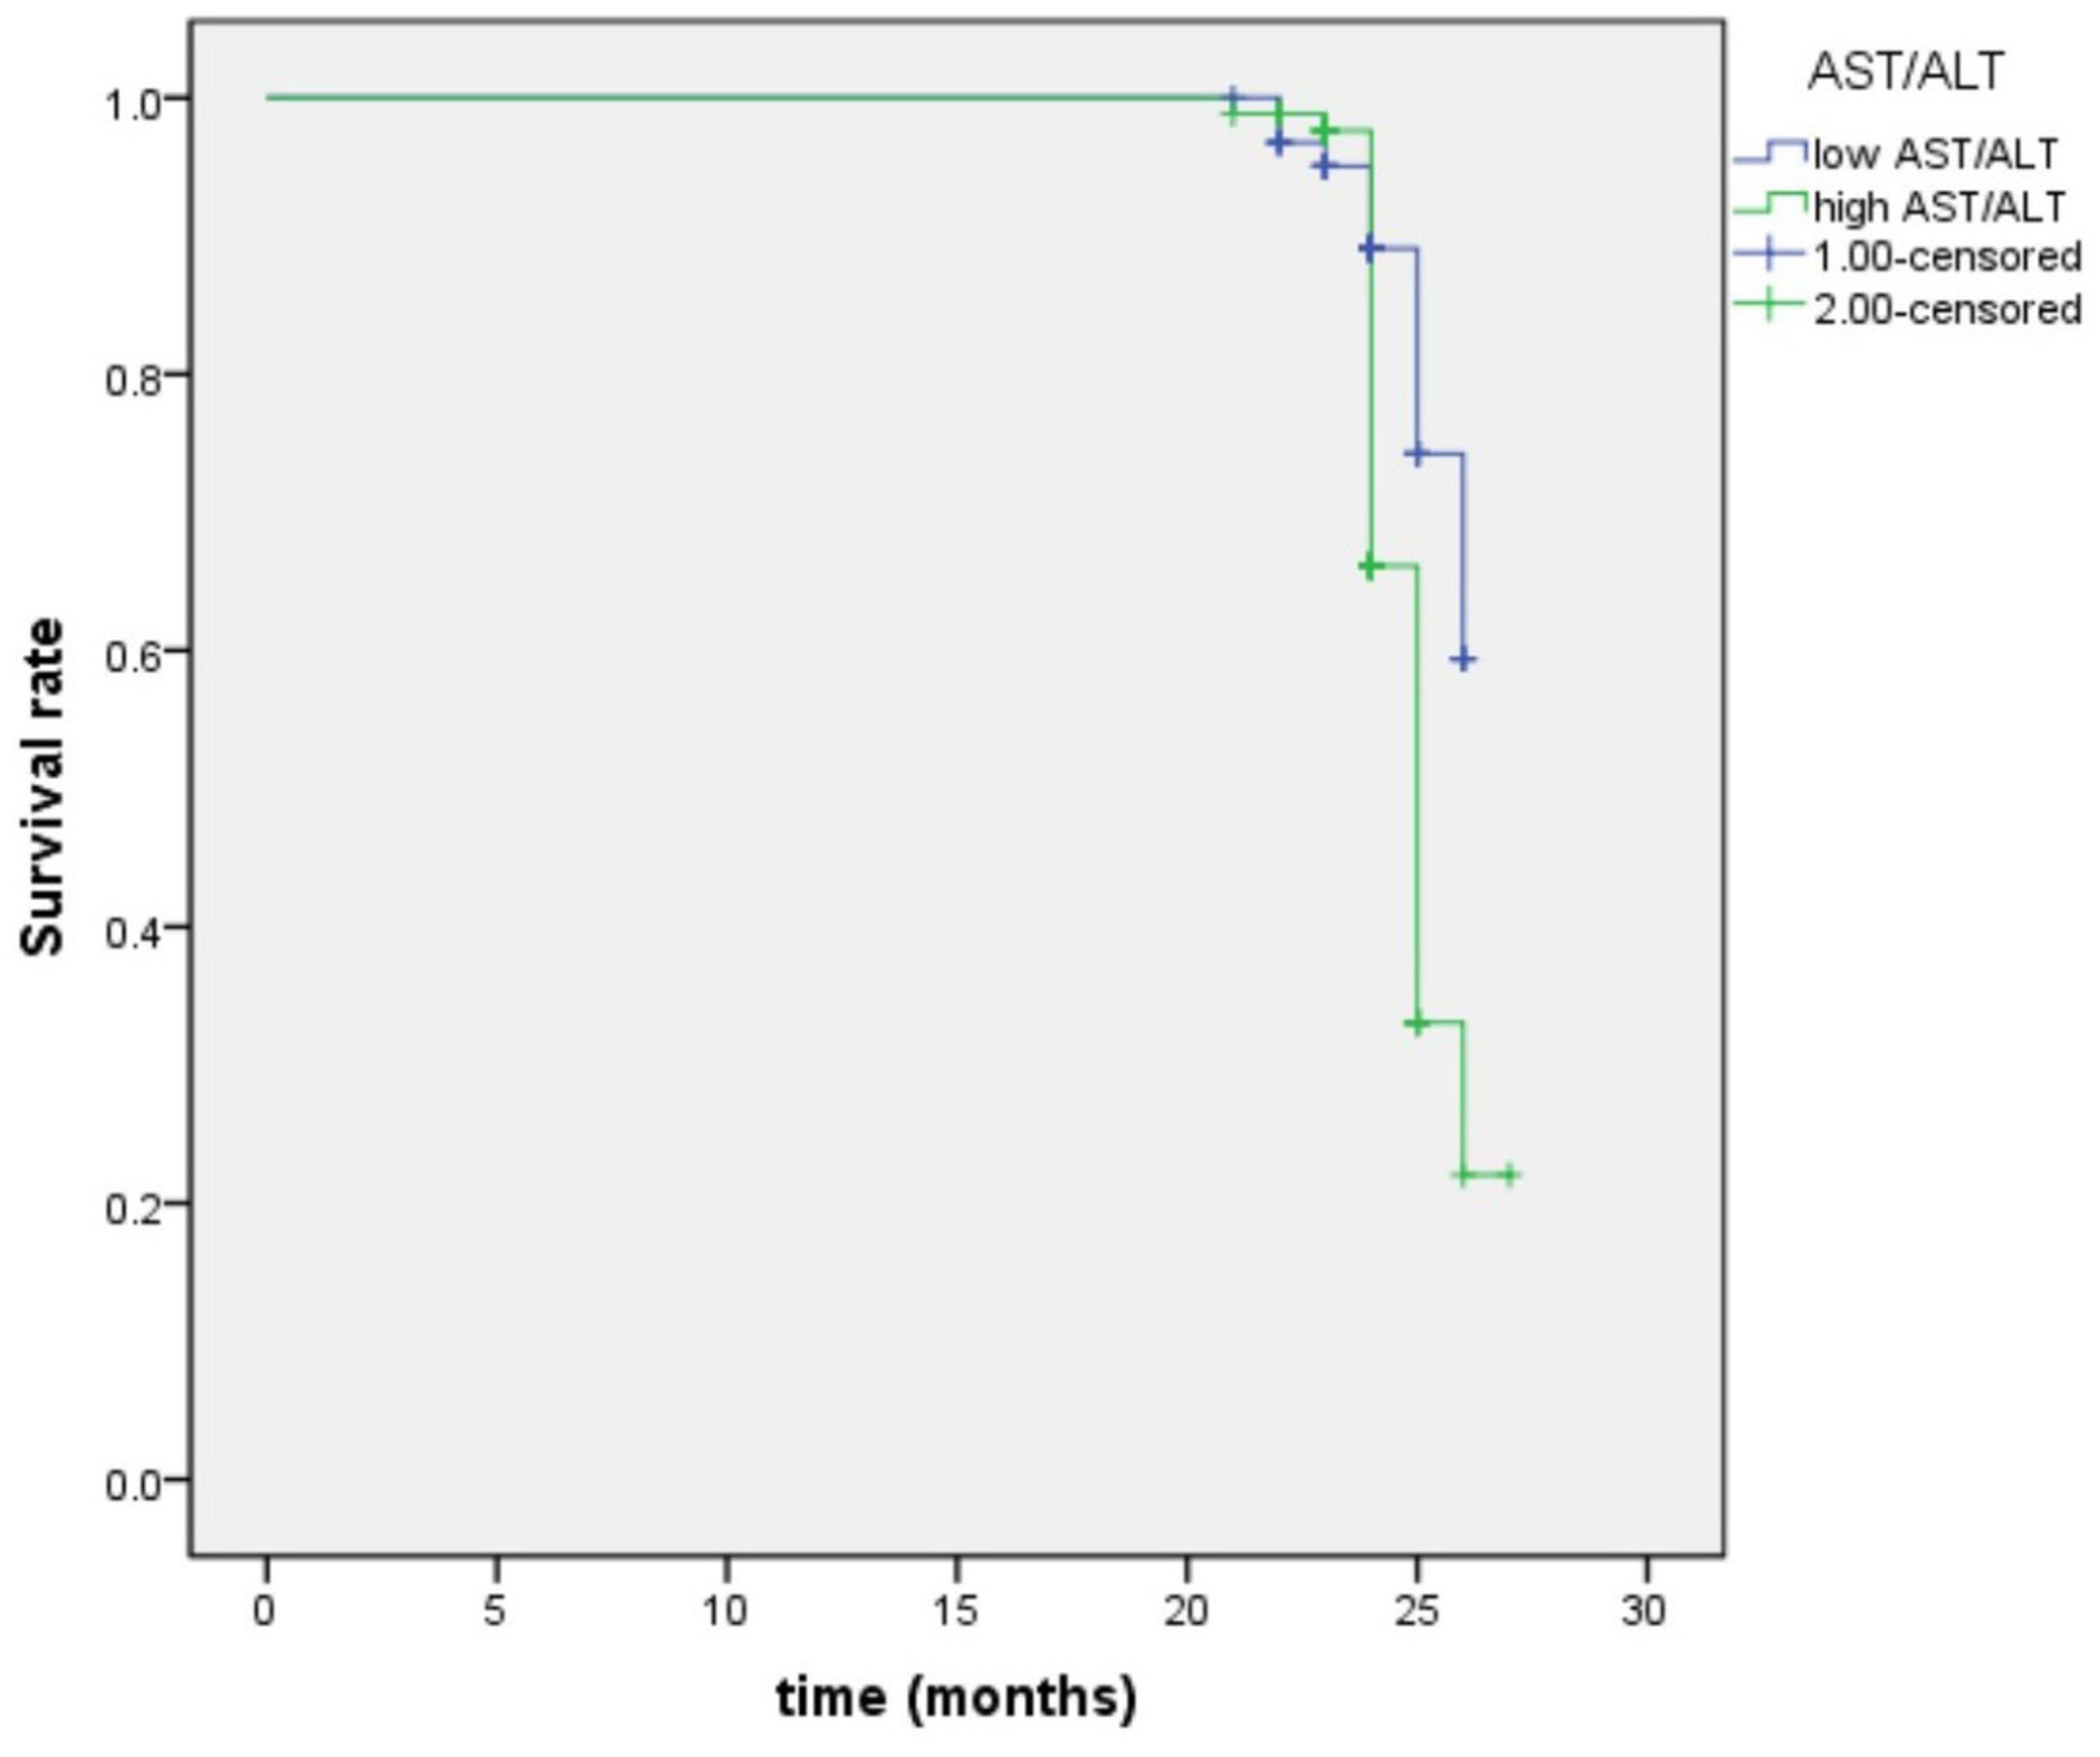
Figure 3. Survival regression curve of AST/ALT ratio predicting future incidence of aMCI. AST, aspartate aminotransferase; ALT, Alanine aminotransferase.
Results Associated With Cohort 3
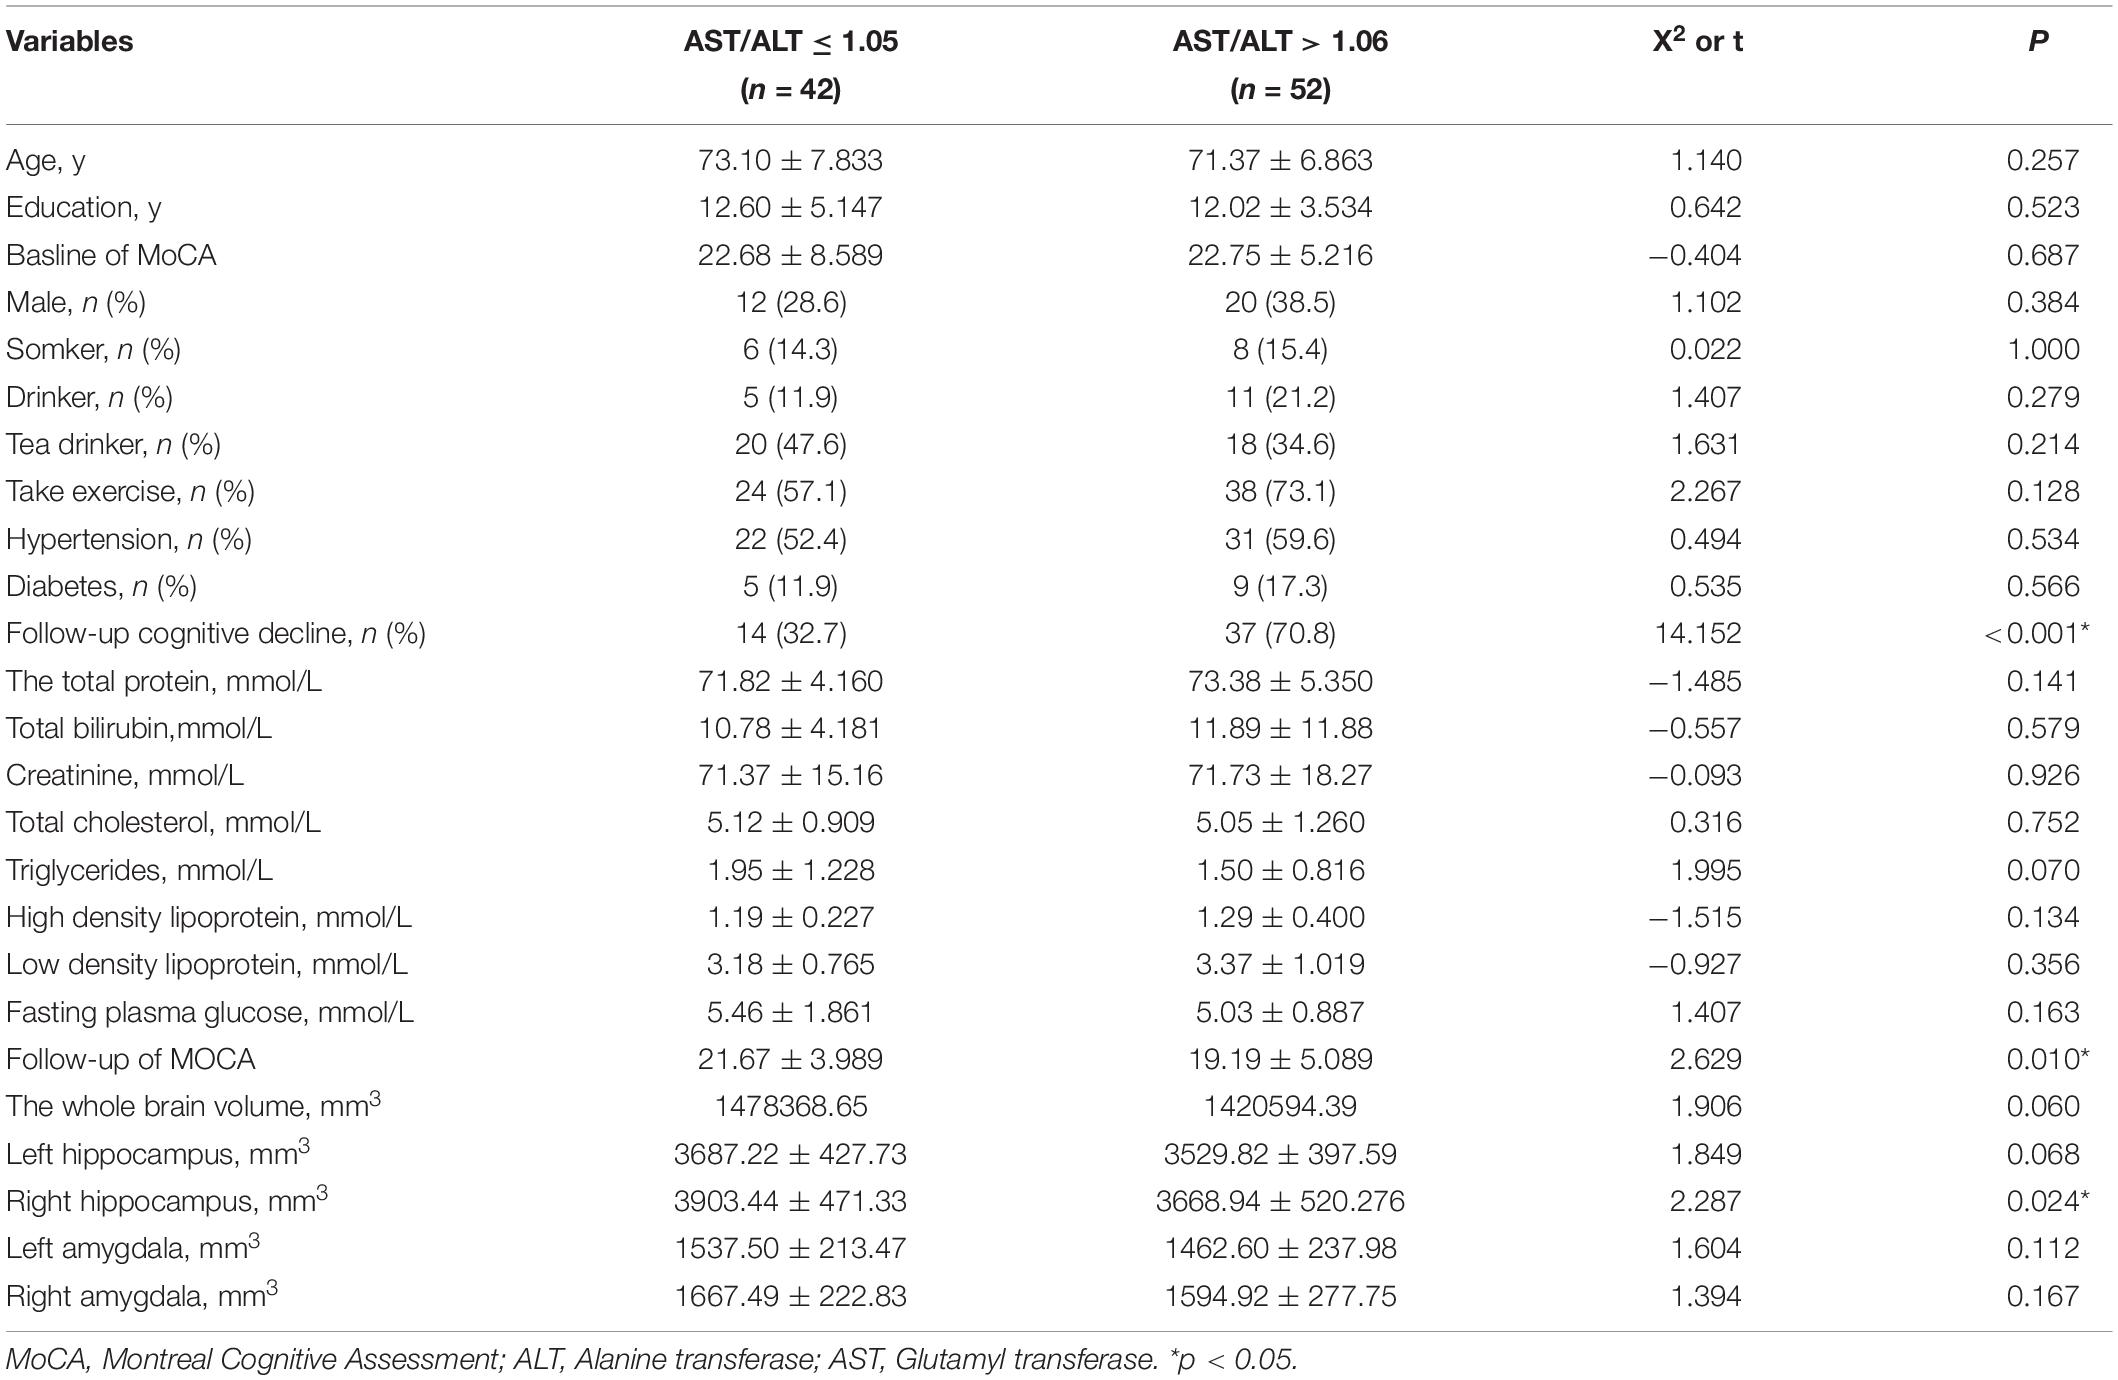
Based on the results of the study on cohort 2, 1.05 was still used as the threshold for AST/ALT ratio in cohort 3. The ROC curve indicated that AST/ALT predicted the area under the curve of MCI was 0.765 (p < 0.001; 95%: 0.610∼0.861) (Figure 4). The right baseline hippocampal volume of the low AST/ALT group was significantly larger than that of the high AST/ALT group, and the follow-up MOCA score was also significantly higher than that of the high AST/ALT group, with a lower rate of cognitive decline (p < 0.05), while there was no statistically significant differences (p > 0.05) in age, education, baseline MOCA score, gender, smoker, alcohol intake, tea drinker, take exercise, hypertension, diabetes, the total protein, total bilirubin, creatinine, total cholesterol, triglycerides, high density lipoprotein, low density lipoprotein, the whole brain volume, left hippocampus, left amygdala or right amygdala between the two groups. Table 5 presents the results. By using COX regression analysis, with future conversion to aMCI as the dependent variable and transition time as the time variable and controlled for the right baseline hippocampal volume, we found that high AST/ALT ratio was a risk factor for aMCI (p = 0.006, HR = 2.247, 95%CI: 1.248∼4.049) (Table 6). Correlation analysis showed that AST/ALT was negatively correlated with right hippocampal volume (r = −0.148, p = 0.043). Figure 5 presents the results.
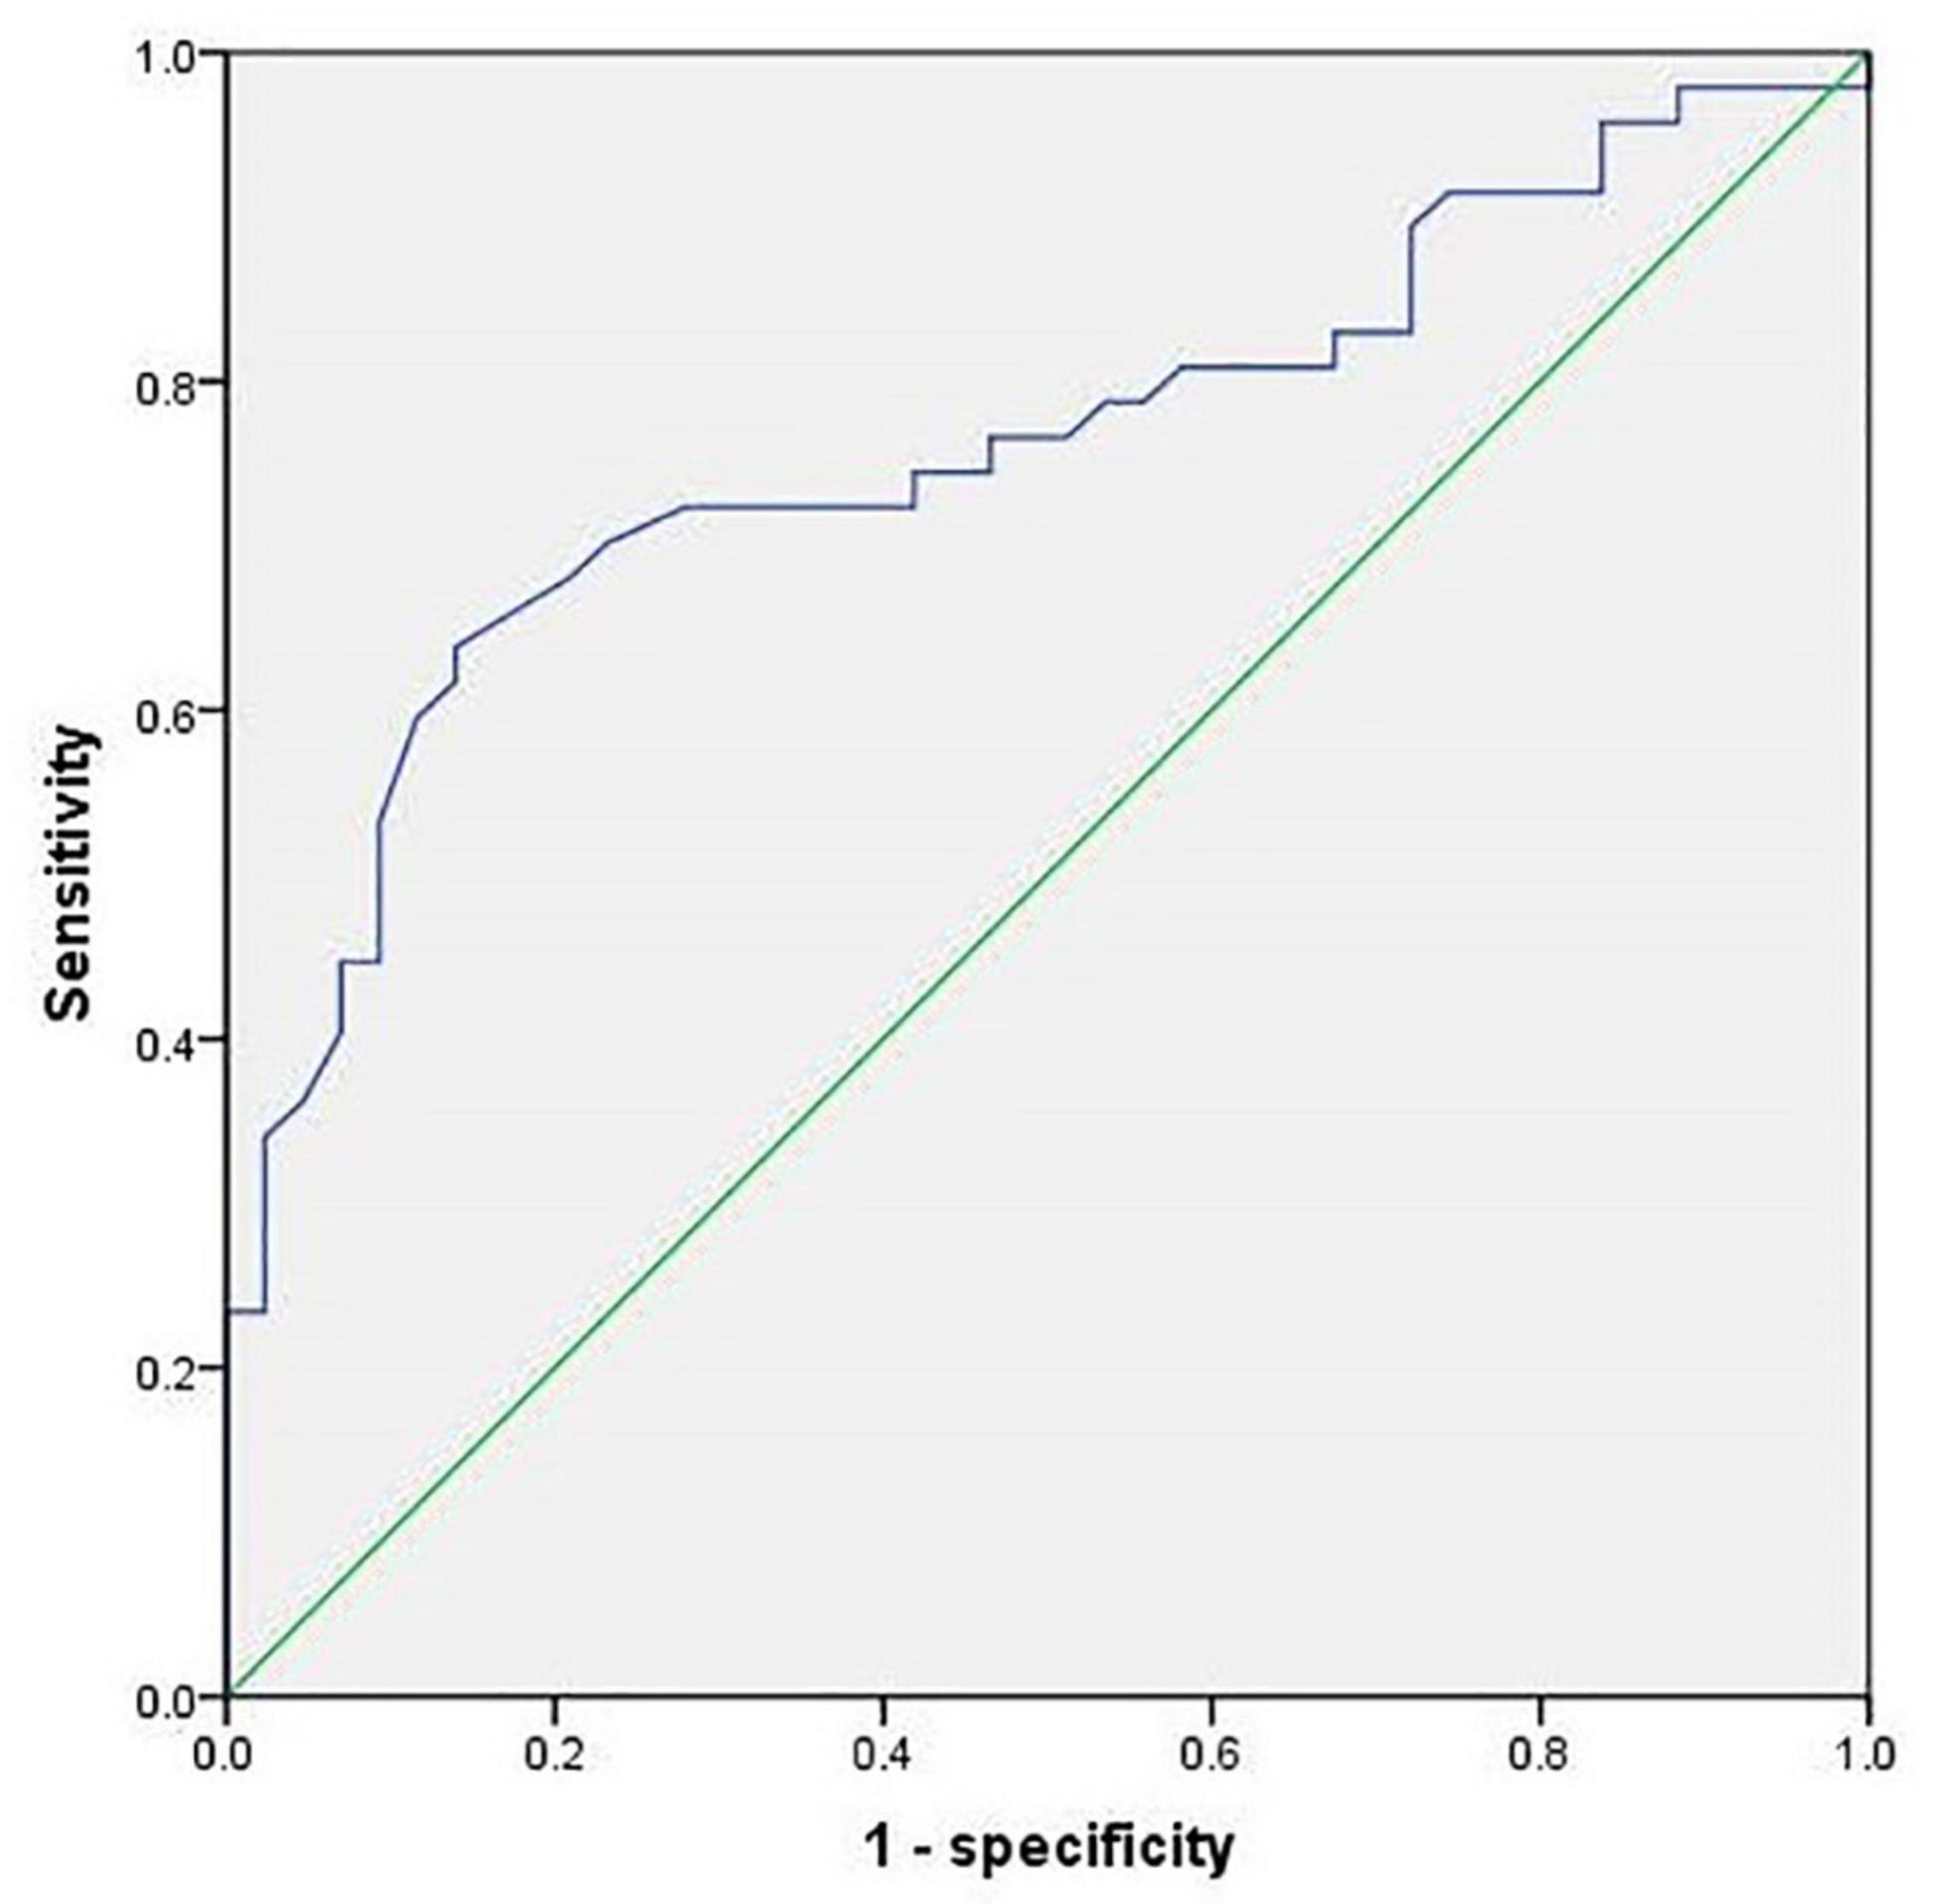
Figure 4. ROC curve of AST/ALT ratio to predict aMCI (cohort 3). AST, aspartate aminotransferase; ALT, Alanine aminotransferase.
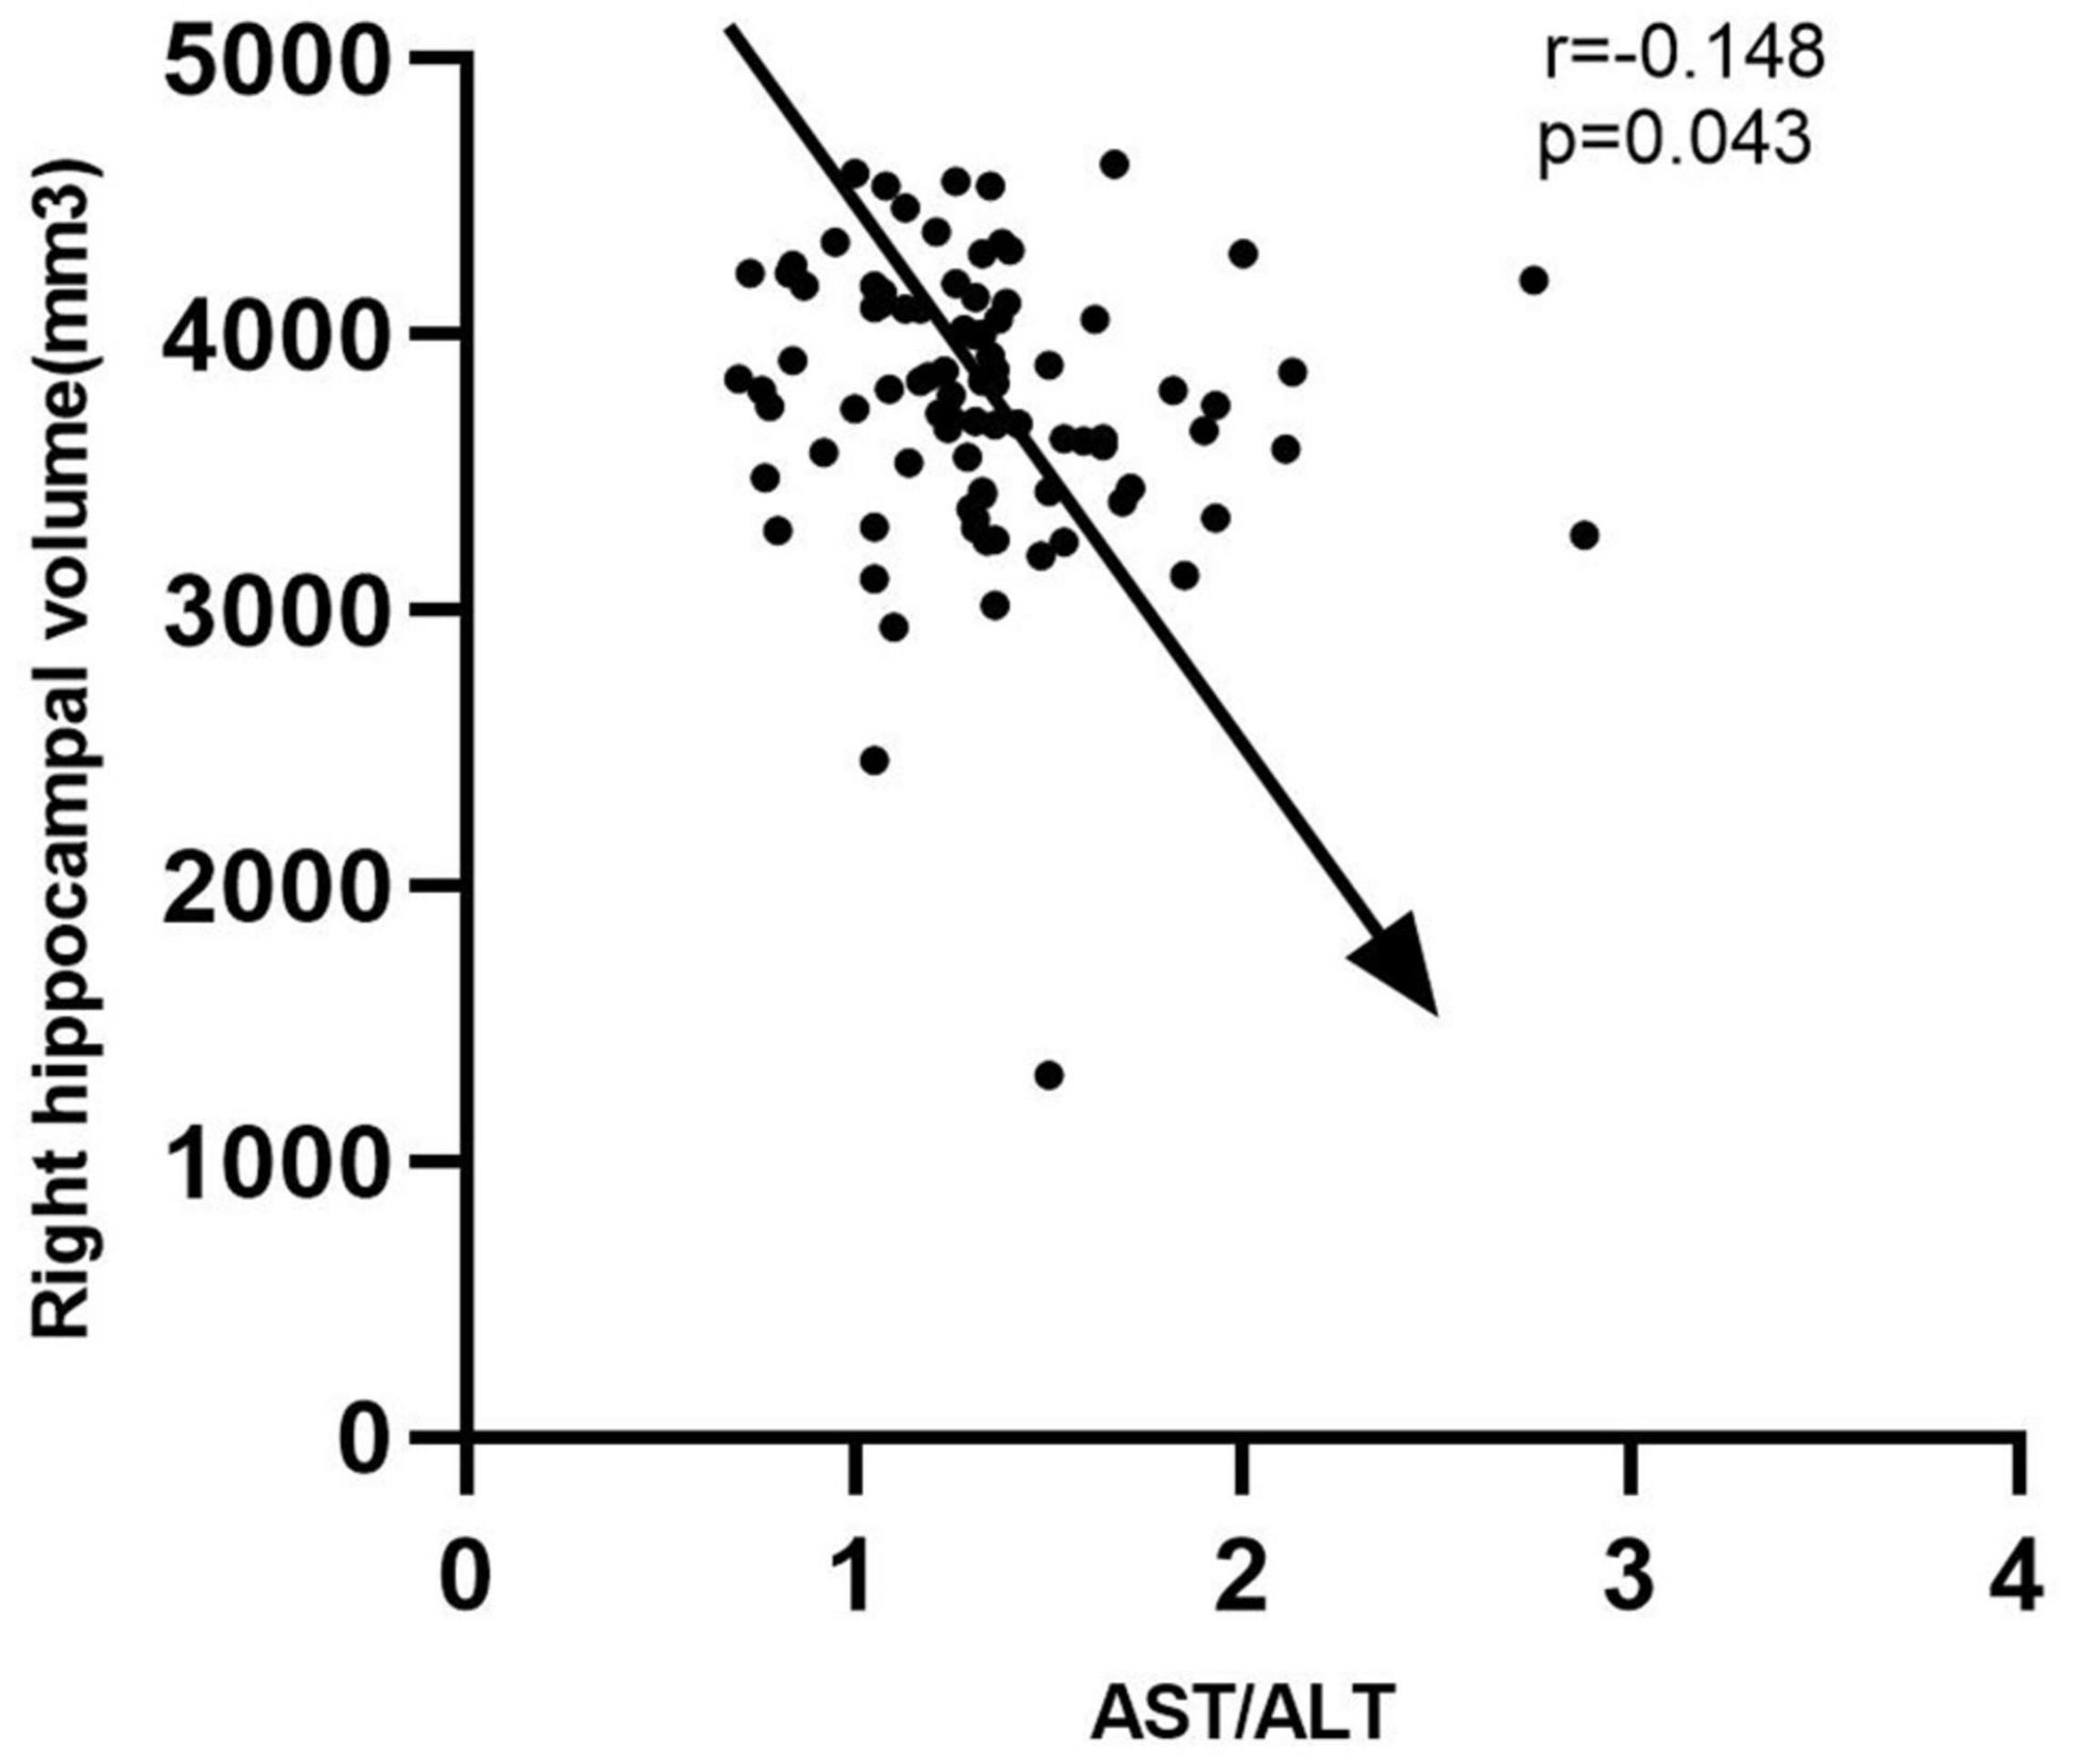
Figure 5. Correlation between AST/ALT ratio and right hippocampus volume. AST, aspartate aminotransferase; ALT, Alanine aminotransferase.
Discussion
To my knowledge, this is the first study to examine the plasma AST/ALT ratio and the future risk of cognitive impairment, and we have come to several interesting conclusions: (1) elevated plasma AST/ALT was associated with AD but not with aMCI (Cohort 1); (2) elevated plasma AST/ALT was a risk factor for future cognitive impairment in older adults with normal baseline cognitive function (Cohort 2 and Cohort 3); (3) elevated plasma AST/ALT may contribute to cognitive impairment by affecting right hippocampal volume (Cohort 3).
About 80% of AST is present in the mitochondria of hepatocytes, while ALT is mainly present in the non-mitochondria of hepatocytes. When liver cells are damaged, AST and ALT are released from the serum, resulting in elevated serum AST and ALT levels (31). On the other hand, as liver function declines, so does the AST clearance rate (32). Therefore, serum AST level was significantly higher than serum ALT level. The ratio between the activity of AST and ALT in serum, also known as the De Ritis ratio, was first described by Fernando De Ritis in 1957. It is often used to assess liver function and reflect the severity of liver disease (33). What’s more, AST and ALT have also known to play an important role in glutamate production, which is considered as the main excitatory neurotransmitter of the central nervous system and have many critical roles in brain function.
The relationship between cognitive function and AST/ALT is extremely complex, and the mechanism is unknown. In Yoshihiro K’s study, they found that plasma AST and ALT levels were significantly negatively correlated with verbal, visual, general memory and delayed recall (34). In our study (Cohort 1), we found that the plasma AST/ALT ratio in AD patients was significantly higher than that in aMCI patients and normal controls, and was negatively correlated with the MOCA score, so our conclusions were partially consistent. To further investigate whether the plasma AST/ALT ratio could be used to predict clinical outcomes in elderly people with normal baseline cognitive function, we introduced two additional longitudinal follow-up studies (one for 2 years and the other for 7 years). The results of both cohorts (Cohort 2 and Cohort 3) suggest that an elevated AST/ALT ratio was a risk factor for future cognitive impairment. The three cohort studies mentioned above were intrinsically related, but they also had different and respective emphases, and their conclusions drawn were inconsistent. The possible heterogeneity of MCI patients might explain the discrepancies between the three studies (no differences were observed between patients without impairment and those with aMCI in the first sample, but differences were observed in the later samples). Since there were no similar longitudinal studies, we could not judge whether our findings were consistent with those of others.
Structural abnormalities in the human brain have been identified as effective biomarkers for AD, especially in its prodromal phase, and have been included in the diagnostic criteria for AD (35). The medial temporal lobe (MTL), such as the hippocampus and amygdala, are particularly interested anatomical structures in AD research, mainly because they actively participate in memory. Morphological abnormalities, including overall volume and local shape, caused by neuropathology of Alzheimer’s disease in the hippocampus and amygdala have been extensively studied (36–38). In general, such abnormalities are usually assessed by magnetic resonance imaging (MRI), such as T1-weighted imaging (39).
In the Cohort 3, we found that the right hippocampal volume of the low AST/ALT group was significantly higher than that of the high AST/ALT group, and interestingly, the AST/ALT ratio was significantly negatively correlated with the right hippocampal volume. Therefore, we proposed our study hypothesis that AST/ALT might influence the onset of cognitive impairment by influencing the volume of the right hippocampus. In Naglich A’s study (40), they found that AST/ALT was significantly associated with right and left hippocampal volume among participants aged =50. Lu et al. found that the plasma AST/ALT ratio was closely correlated with the structural change of thalamus (41). Haliloglu et al. found that AST/ALT values were significantly correlated with caudate-right lobe ratio (C/R) (42). Therefore, our conclusions were consistent.
We admit that our research has some limitations: first, the sample size was relatively small, thus limiting its reliability; second, in addition to AST and ALT, we did not include other liver metabolic indicators, such as fatty liver, etc.; third, AST and ALT were state variables that could be influenced by many other factors. During the follow-up, we only collected baseline data and could not understand the relationship between dynamic changes in liver function and cognitive function.
Conclusion
In summary, we found that AST/ALT was a risk factor for cognitive impairment, and the mechanism might be related to the right hippocampus atrophy induced by AST/ALT.
Data Availability Statement
The original contributions presented in the study are included in the article/supplementary material, further inquiries can be directed to the corresponding author/s.
Ethics Statement
The studies involving human participants were reviewed and approved by the Ethics Committee of the Shanghai Mental Health Center, and all participants signed informed consent prior to the study. The patients/participants provided their written informed consent to participate in this study. Written informed consent was obtained from the individual(s) for the publication of any potentially identifiable images or data included in this article.
Author Contributions
WL and LY contributed to the study concept and design. SX and LS analyzed the data and drafted the manuscript. All authors have read and approved the final manuscript.
Funding
This study was supported by grants from the clinical research center project of Shanghai Mental Health Center (CRC2017ZD02), Shanghai Clinical Research Center for Mental Health (19MC1911100), the Cultivation of Multidisciplinary Interdisciplinary Project in Shanghai Jiaotong University (YG2019QNA10), the Feixiang Program of Shanghai Mental Health Center (2020-FX-03), Chinese Academy of Sciences (XDA12040101), Shanghai Clinical Research Center for Mental Health (SCRC-MH, 19MC1911100), the National Natural Science Foundation of China (82001123 and 82101564), the Shanghai Science and Technology Committee (20Y11906800), and the Feixiang Program of Shanghai Mental Health Center (2018-FX-05). We also thank Shanghai Brain Health Foundation (SHBHF2016001) for the support.
Conflict of Interest
The authors declare that the research was conducted in the absence of any commercial or financial relationships that could be construed as a potential conflict of interest.
Publisher’s Note
All claims expressed in this article are solely those of the authors and do not necessarily represent those of their affiliated organizations, or those of the publisher, the editors and the reviewers. Any product that may be evaluated in this article, or claim that may be made by its manufacturer, is not guaranteed or endorsed by the publisher.
Footnotes
References
1. Soria Lopez JA, González HM, Léger GC. Alzheimer’s disease. In: Dekosky ST, Asthana S editors. Handbook of Clinical Neurology. (Vol. 167), Amsterdam: Elsevier (2019). p. 231–55. doi: 10.1016/B978-0-12-804766-8.00013-3
2. Zhang J, Zhang L, Sun X, Yang Y, Kong L, Lu C, et al. Acetylcholinesterase inhibitors for Alzheimer’s disease treatment ameliorate acetaminophen-induced liver injury in mice via central cholinergic system regulation. J Pharmacol Exp Ther. (2016) 359:374–82. doi: 10.1124/jpet.116.233841
3. Liao F, Yoon H, Kim J. Apolipoprotein E metabolism and functions in brain and its role in Alzheimer’s disease. Curr Opin Lipidol. (2017) 28:60–7. doi: 10.1097/MOL.0000000000000383
4. Zhao Y, Raichle ME, Wen J, Benzinger TL, Fagan AM, Hassenstab J, et al. In vivo detection of microstructural correlates of brain pathology in preclinical and early Alzheimer disease with magnetic resonance imaging. Neuroimage. (2017) 148:296–304. doi: 10.1016/j.neuroimage.2016.12.026
5. Toledo JB, Arnold M, Kastenmüller G, Chang R, Baillie RA, Han X, et al. Metabolic network failures in Alzheimer’s disease: a biochemical road map. Alzheimers Dement. (2017) 13:965–84. doi: 10.1016/j.jalz.2017.01.020
6. Estrada LD, Ahumada P, Cabrera D, Arab JP. Liver Dysfunction as a novel player in Alzheimer’s progression: looking outside the brain. Front Aging Neurosci. (2019) 11:174. doi: 10.3389/fnagi.2019.00174
7. Manivannan B, Yegambaram M, Supowit S, Beach TG, Halden RU. Assessment of persistent, bioaccumulative and toxic organic environmental pollutants in liver and adipose tissue of Alzheimer’s disease patients and age-matched controls. Curr Alzheimer Res. (2019) 16:1039–49. doi: 10.2174/1567205016666191010114744
8. Giambattistelli F, Bucossi S, Salustri C, Panetta V, Mariani S, Siotto M, et al. Effects of hemochromatosis and transferrin gene mutations on iron dyshomeostasis, liver dysfunction and on the risk of Alzheimer’s disease. Neurobiol Aging. (2012) 33:1633–41. doi: 10.1016/j.neurobiolaging.2011.03.005
9. Wang X, Han W, Yang J, Westaway D, Li L. Development of chemical isotope labeling LC-MS for tissue metabolomics and its application for brain and liver metabolome profiling in Alzheimer’s disease mouse model. Anal Chim Acta. (2019) 1050:95–104. doi: 10.1016/j.aca.2018.10.060
10. Chen HJ, Zhu XQ, Shu H, Yang M, Zhang Y, Ding J, et al. Structural and functional cerebral impairments in cirrhotic patients with a history of overt hepatic encephalopathy. Eur J Radiol. (2012) 81:2463–9. doi: 10.1016/j.ejrad.2011.10.008
11. García-García R, Cruz-Gómez ÁJ, Mangas-Losada A, Urios A, Forn C, Escudero-Garcia D, et al. Reduced resting state connectivity and gray matter volume correlate with cognitive impairment in minimal hepatic encephalopathy. PLoS One. (2017) 12:e0186463. doi: 10.1371/journal.pone.0186463
12. Goessling W, Massaro JM, Vasan RS, D’Agostino RB Sr., Ellison RC, Fox CS. Aminotransferase levels and 20-year risk of metabolic syndrome, diabetes, and cardiovascular disease. Gastroenterology. (2008) 135:1935–1944,1944.e1. doi: 10.1053/j.gastro.2008.09.018
13. Ricchi P, Meloni A, Spasiano A, Costantini S, Pepe A, Cinque P, et al. The impact of liver steatosis on the ability of serum ferritin levels to be predictive of liver iron concentration in non-transfusion-dependent thalassaemia patients. Br J Haematol. (2018) 180:721–6. doi: 10.1111/bjh.15083
14. Lee H, Choi YH, Sung HH, Han DH, Jeon HG, Chang Jeong B, et al. De Ritis Ratio (AST/ALT) as a significant prognostic factor in patients with upper tract urothelial cancer treated with surgery. Clin Genitourin Cancer. (2017) 15:e379–85. doi: 10.1016/j.clgc.2016.08.023
15. Verslype C. Evaluation of abnormal liver-enzyme results in asymptomatic patients. Acta Clin Belg. (2004) 59:285–9. doi: 10.1179/acb.2004.042
16. Weng SF, Kai J, Guha IN, Qureshi N. The value of aspartate aminotransferase and alanine aminotransferase in cardiovascular disease risk assessment. Open heart. (2015) 2:e000272. doi: 10.1136/openhrt-2015-000272
17. Zhou J, He Z, Ma S, Liu R. AST/ALT ratio as a significant predictor of the incidence risk of prostate cancer. Cancer Med. (2020) 9:5672–7. doi: 10.1002/cam4.3086
18. Canat L, Ataly HA, Agalarov S, Alkan I, Altunrende F. The effect of AST/ALT (De Ritis) ratio on survival and its relation to tumor histopathological variables in patients with localized renal cell carcinoma. International Braz J. (2018) 44:288–95. doi: 10.1590/S1677-5538.IBJU.2017.0173
19. Xiao S, Li J, Tang M, Chen W, Bao F, Wang H, et al. Methodology of China’s national study on the evaluation, early recognition, and treatment of psychological problems in the elderly: the China longitudinal aging study (CLAS). Shanghai Arch Psychiat. (2013) 25:91–8. doi: 10.3969/j.issn.1002-0829.2013.02.005
20. McKhann G, Drachman D, Folstein M, Katzman R, Price D, Stadlan EM. Clinical diagnosis of Alzheimer’s disease: report of the NINCDS-ADRDA work group under the auspices of department of health and human services task force on Alzheimer’s disease. Neurology. (1984) 34:939–44. doi: 10.1212/wnl.34.7.939
21. Albert MS, DeKosky ST, Dickson D, Dubois B, Feldman HH, Fox NC, et al. The diagnosis of mild cognitive impairment due to Alzheimer’s disease: recommendations from the national institute on aging-Alzheimer’s association workgroups on diagnostic guidelines for Alzheimer’s disease. Alzheimers Dement. (2011) 7:270–9. doi: 10.1016/j.jalz.2011.03.008
22. Wong A, Law LS, Liu W, Wang Z, Lo ES, Lau A, et al. Montreal cognitive assessment: one cutoff never fits all. Stroke. (2015) 46:3547–50. doi: 10.1161/STROKEAHA.115.011226
23. Wolz R, Schwarz AJ, Yu P, Cole PE, Rueckert D, Jack CR Jr., et al. Robustness of automated hippocampal volumetry across magnetic resonance field strengths and repeat images. Alzheimers Dement. (2014) 10:430.e–8.e. doi: 10.1016/j.jalz.2013.09.014
24. Dale AM, Fischl B, Sereno MI. Cortical surface-based analysis. I. Segmentation and surface reconstruction. Neuroimage. (1999) 9:179–94. doi: 10.1006/nimg.1998.0395
25. Dong Q, Zhang W, Wu J, Li B, Schron EH, McMahon T, et al. Applying surface-based hippocampal morphometry to study APOE-E4 allele dose effects in cognitively unimpaired subjects. Neuroimage Clin. (2019) 22:101744. doi: 10.1016/j.nicl.2019.101744
26. Vecchio F, Miraglia F, Piludu F, Granata G, Romanello R, Caulo M, et al. “Small World” architecture in brain connectivity and hippocampal volume in Alzheimer’s disease: a study via graph theory from EEG data. Brain Imaging Behav. (2017) 11:473–85. doi: 10.1007/s11682-016-9528-3
27. Yue L, Wang T, Wang J, Li G, Wang J, Li X, et al. Asymmetry of hippocampus and amygdala defect in subjective cognitive decline among the community dwelling Chinese. Front Psychiatry. (2018) 9:226. doi: 10.3389/fpsyt.2018.00226
28. Xiao S, Lewis M, Mellor D, McCabe M, Byrne L, Wang T, et al. The China longitudinal ageing study: overview of the demographic, psychosocial and cognitive data of the Shanghai sample. J Ment Health. (2016) 25:131–6. doi: 10.3109/09638237.2015.1124385
29. Chen KL, Xu Y, Chu AQ, Ding D, Liang XN, Nasreddine ZS, et al. Validation of the Chinese version of montreal cognitive assessment basic for screening mild cognitive impairment. J Am Geriatr Soc. (2016) 64:e285–90. doi: 10.1111/jgs.14530
30. Yesavage JA, Brink TL, Rose TL, Lum O, Huang V, Adey M, et al. Development and validation of a geriatric depression screening scale: a preliminary report. J Psychiatr Res. (1982) 17:37–49. doi: 10.1016/0022-3956(82)90033-4
31. Yang JG, He XF, Huang B, Zhang HA, He YK. Rule of changes in serum GGT levels and GGT/ALT and AST/ALT ratios in primary hepatic carcinoma patients with different AFP levels. Cancer Biomark. (2018) 21:743–6. doi: 10.3233/CBM-170088
32. Okuda M, Li K, Beard MR, Showalter LA, Scholle F, Lemon SM, et al. Mitochondrial injury, oxidative stress, and antioxidant gene expression are induced by hepatitis C virus core protein. Gastroenterology. (2002) 122:366–75. doi: 10.1053/gast.2002.30983
33. Liu Y, Zhao P, Cheng M, Yu L, Cheng Z, Fan L, et al. AST to ALT ratio and arterial stiffness in non-fatty liver Japanese population:a secondary analysis based on a cross-sectional study. Lipids Health Dis. (2018) 17:275. doi: 10.1186/s12944-018-0920-4
34. Kamada Y, Hashimoto R, Yamamori H, Yasuda Y, Takehara T, Fujita Y, et al. Impact of plasma transaminase levels on the peripheral blood glutamate levels and memory functions in healthy subjects. BBA Clin. (2016) 5:101–7. doi: 10.1016/j.bbacli.2016.02.004
35. Dubois B, Feldman HH, Jacova C, Dekosky ST, Barberger-Gateau P, Cummings J, et al. Research criteria for the diagnosis of Alzheimer’s disease: revising the NINCDS-ADRDA criteria. Lancet Neurol. (2007) 6:734–46. doi: 10.1016/S1474-4422(07)70178-3
36. Manna A, Piras F, Caltagirone C, Bossù P, Sensi SL, Spalletta G. Left hippocampus-amygdala complex macro- and microstructural variation is associated with BDNF plasma levels in healthy elderly individuals. Brain Behav. (2015) 5:e00334. doi: 10.1002/brb3.334
37. Pedraza O, Bowers D, Gilmore R. Asymmetry of the hippocampus and amygdala in MRI volumetric measurements of normal adults. J Int Neuropsychol Soc. (2004) 10:664–78. doi: 10.1017/S1355617704105080
38. Laakso MP, Soininen H, Partanen K, Helkala EL, Hartikainen P, Vainio P, et al. Volumes of hippocampus, amygdala and frontal lobes in the MRI-based diagnosis of early Alzheimer’s disease: correlation with memory functions. J Neural Transm Park Dis Dement Sect. (1995) 9:73–86. doi: 10.1007/BF02252964
39. Tang X, Qin Y, Wu J, Zhang M, Zhu W, Miller MI. Shape and diffusion tensor imaging based integrative analysis of the hippocampus and the amygdala in Alzheimer’s disease. Magn Reson Imaging. (2016) 34:1087–99. doi: 10.1016/j.mri.2016.05.001
40. Naglich A, Van Enkevort E, Adinoff B, Brown ES. Association of biological markers of Alcohol consumption and self-reported drinking with hippocampal volume in a population-based sample of adults. Alcohol Alcohol. (2018) 53:539–47. doi: 10.1093/alcalc/agy041
41. Lu CQ, Jiao Y, Meng XP, Cai Y, Luan Y, Xu XM, et al. Structural change of thalamus in cirrhotic patients with or without minimal hepatic encephalopathy and the relationship between thalamus volume and clinical indexes related to cirrhosis. Neuroimage Clin. (2018) 20:800–7. doi: 10.1016/j.nicl.2018.09.015
Keywords: AST, ALT, hippocampal, cognitive function, elderly
Citation: Li W, Yue L, Sun L and Xiao S (2022) An Increased Aspartate to Alanine Aminotransferase Ratio Is Associated With a Higher Risk of Cognitive Impairment. Front. Med. 9:780174. doi: 10.3389/fmed.2022.780174
Received: 20 September 2021; Accepted: 03 March 2022;
Published: 07 April 2022.
Edited by:
Tzvi Dwolatzky, Technion Israel Institute of Technology, IsraelReviewed by:
Santiago Galdo-Alvarez, University of Santiago de Compostela, SpainXiaolong Zhao, Sichuan Academy of Medical Sciences and Sichuan Provincial People’s Hospital, China
Copyright © 2022 Li, Yue, Sun and Xiao. This is an open-access article distributed under the terms of the Creative Commons Attribution License (CC BY). The use, distribution or reproduction in other forums is permitted, provided the original author(s) and the copyright owner(s) are credited and that the original publication in this journal is cited, in accordance with accepted academic practice. No use, distribution or reproduction is permitted which does not comply with these terms.
*Correspondence: Lin Sun, eGlhb3N1YW4yMDA0QDEyNi5jb20=; Shifu Xiao, eGlhb3NoaWZ1QG1zbi5jb20=
†These authors have contributed equally to this work
 Wei Li
 Ling Yue
 Lin Sun
 Shifu Xiao