
94% of researchers rate our articles as excellent or good
Learn more about the work of our research integrity team to safeguard the quality of each article we publish.
Find out more
ORIGINAL RESEARCH article
Front. Med., 20 September 2022
Sec. Nephrology
Volume 9 - 2022 | https://doi.org/10.3389/fmed.2022.1018083
This article is part of the Research TopicAdvances in Chronic Kidney Disease Diagnosis and TherapyView all 9 articles
 Qing Zhu1,2†
 Yuan Chen1,3†
 Xintian Cai1,2Li Cai2Jing Hong2Qin Luo2Yingli Ren2Yanying Guo1,3*†
 Nanfang Li2*†
Background: Triglyceride–glucose (TyG) index has been reported to be associated with cardiovascular disease (CVD). However, few studies have focused on TyG index and the risk of chronic kidney disease (CKD). Thus, this study aims to explore the relationship between TyG index and CKD.
Methods: A total of 2,033 participants with hypertension between January 2012 and May 2019 were included in the longitudinal observational study. All patients are grouped according to the TyG index quartile. CKD was defined as estimated glomerular filtration rate (eGFR) < 60 ml/min per 1.73 m2 and/or positive proteinuria. Multivariate Cox proportional hazards models were used to investigate the relationship between TyG index and CKD.
Results: During a median follow-up of 31 months, 302 participants developed CKD, with a mean age of 55.5 years and median TyG of 8.94. Compared with those in the lowest quartile of TyG index, participants in the highest quartile of TyG index exhibited 1.63-fold higher hazard ratio (95% CI: 1.14–2.33, P = 0.007) for presence of CKD. And restricted cubic spline analysis showed the relationship between TyG index and CKD is non-linear (P non-linearity = 0.021). The hazard ratio for CKD first fell and after rising until around 8.94 of TyG index and started to increase rapidly afterward (P for TyG < 0.001).
Conclusion: Higher TyG index is associated with the increased risk for CKD. Early intervention of metabolic factors may prevent the occurrence of CKD, thereby reducing the incidence of CVD and premature death.
Chronic kidney disease (CKD) is an important and common condition globally and was association with cardiovascular events and premature death (1, 2). Both early prevention and treatment of CKD are critical.
CKD occurs commonly in the general adult population, and is closely related to hypertension and diabetes mellitus (DM) (3). Previous studies have shown that patients with hypertension and DM have a higher incidence of renal dysfunction than patients with either hypertension or DM alone (4, 5), suggesting higher risk for CKD in patients with coexistent hypertension and DM. Hypertension and DM are both heterogeneous polygenic genetic diseases, and their common familial aggregation and sequential coexistence are very high (6, 7), indicating that they may have a common pathogenesis. The main and core comorbidity mechanisms are insulin resistance (IR) (8, 9). IR could lead to vascular damage and is associated with several groups of abnormal syndromes that include obesity, DM, cardiovascular disease (CVD), CKD and other abnormalities (10, 11). Therefore, monitoring IR is of great significance for the prevention and treatment of hypertension, DM, and their complications (12).
Triglyceride-glucose (TyG) index, calculated with fasting plasma glucose and triglycerides, had been shown to be significantly associated with insulin resistance and proposed as reliable surrogate marker of IR (13). Recently, lots of studies have indicated the association of TyG index with myocardial infarction, arterial stiffness, stroke, and nephritic microvascular damage (13–16). However, few studies have focused on the association between TyG index and the risk of CKD, specifically in patients with hypertension and abnormal glucose metabolism, a high-risk group for CKD. Thus, the present study was aimed to investigate the relationship of TyG index at baseline with the risk of CKD based on a retrospective cohort study.
Participants were inpatients from Hypertension Center of People’s Hospital of Xinjiang Uygur Autonomous Region in this retrospective study. The study design have been reported elsewhere (17, 18). In brief, a total of 2,946 participants aged ≥ 18 years who diagnosed with hypertension and abnormal glucose metabolism between January 2012 and May 2019, were identified. Individuals diagnosed secondary hypertension, history of CVD within last 3 months (including acute coronary syndrome, coronary revascularization, and coronary bypass operation, heart failure and acute cerebrovascular disease), or malignant tumor, or with CKD at baseline (n = 410), or missing baseline data (n = 77) were excluded. Finally, we collected the outcome data for 2,459 patients (Figure 1).
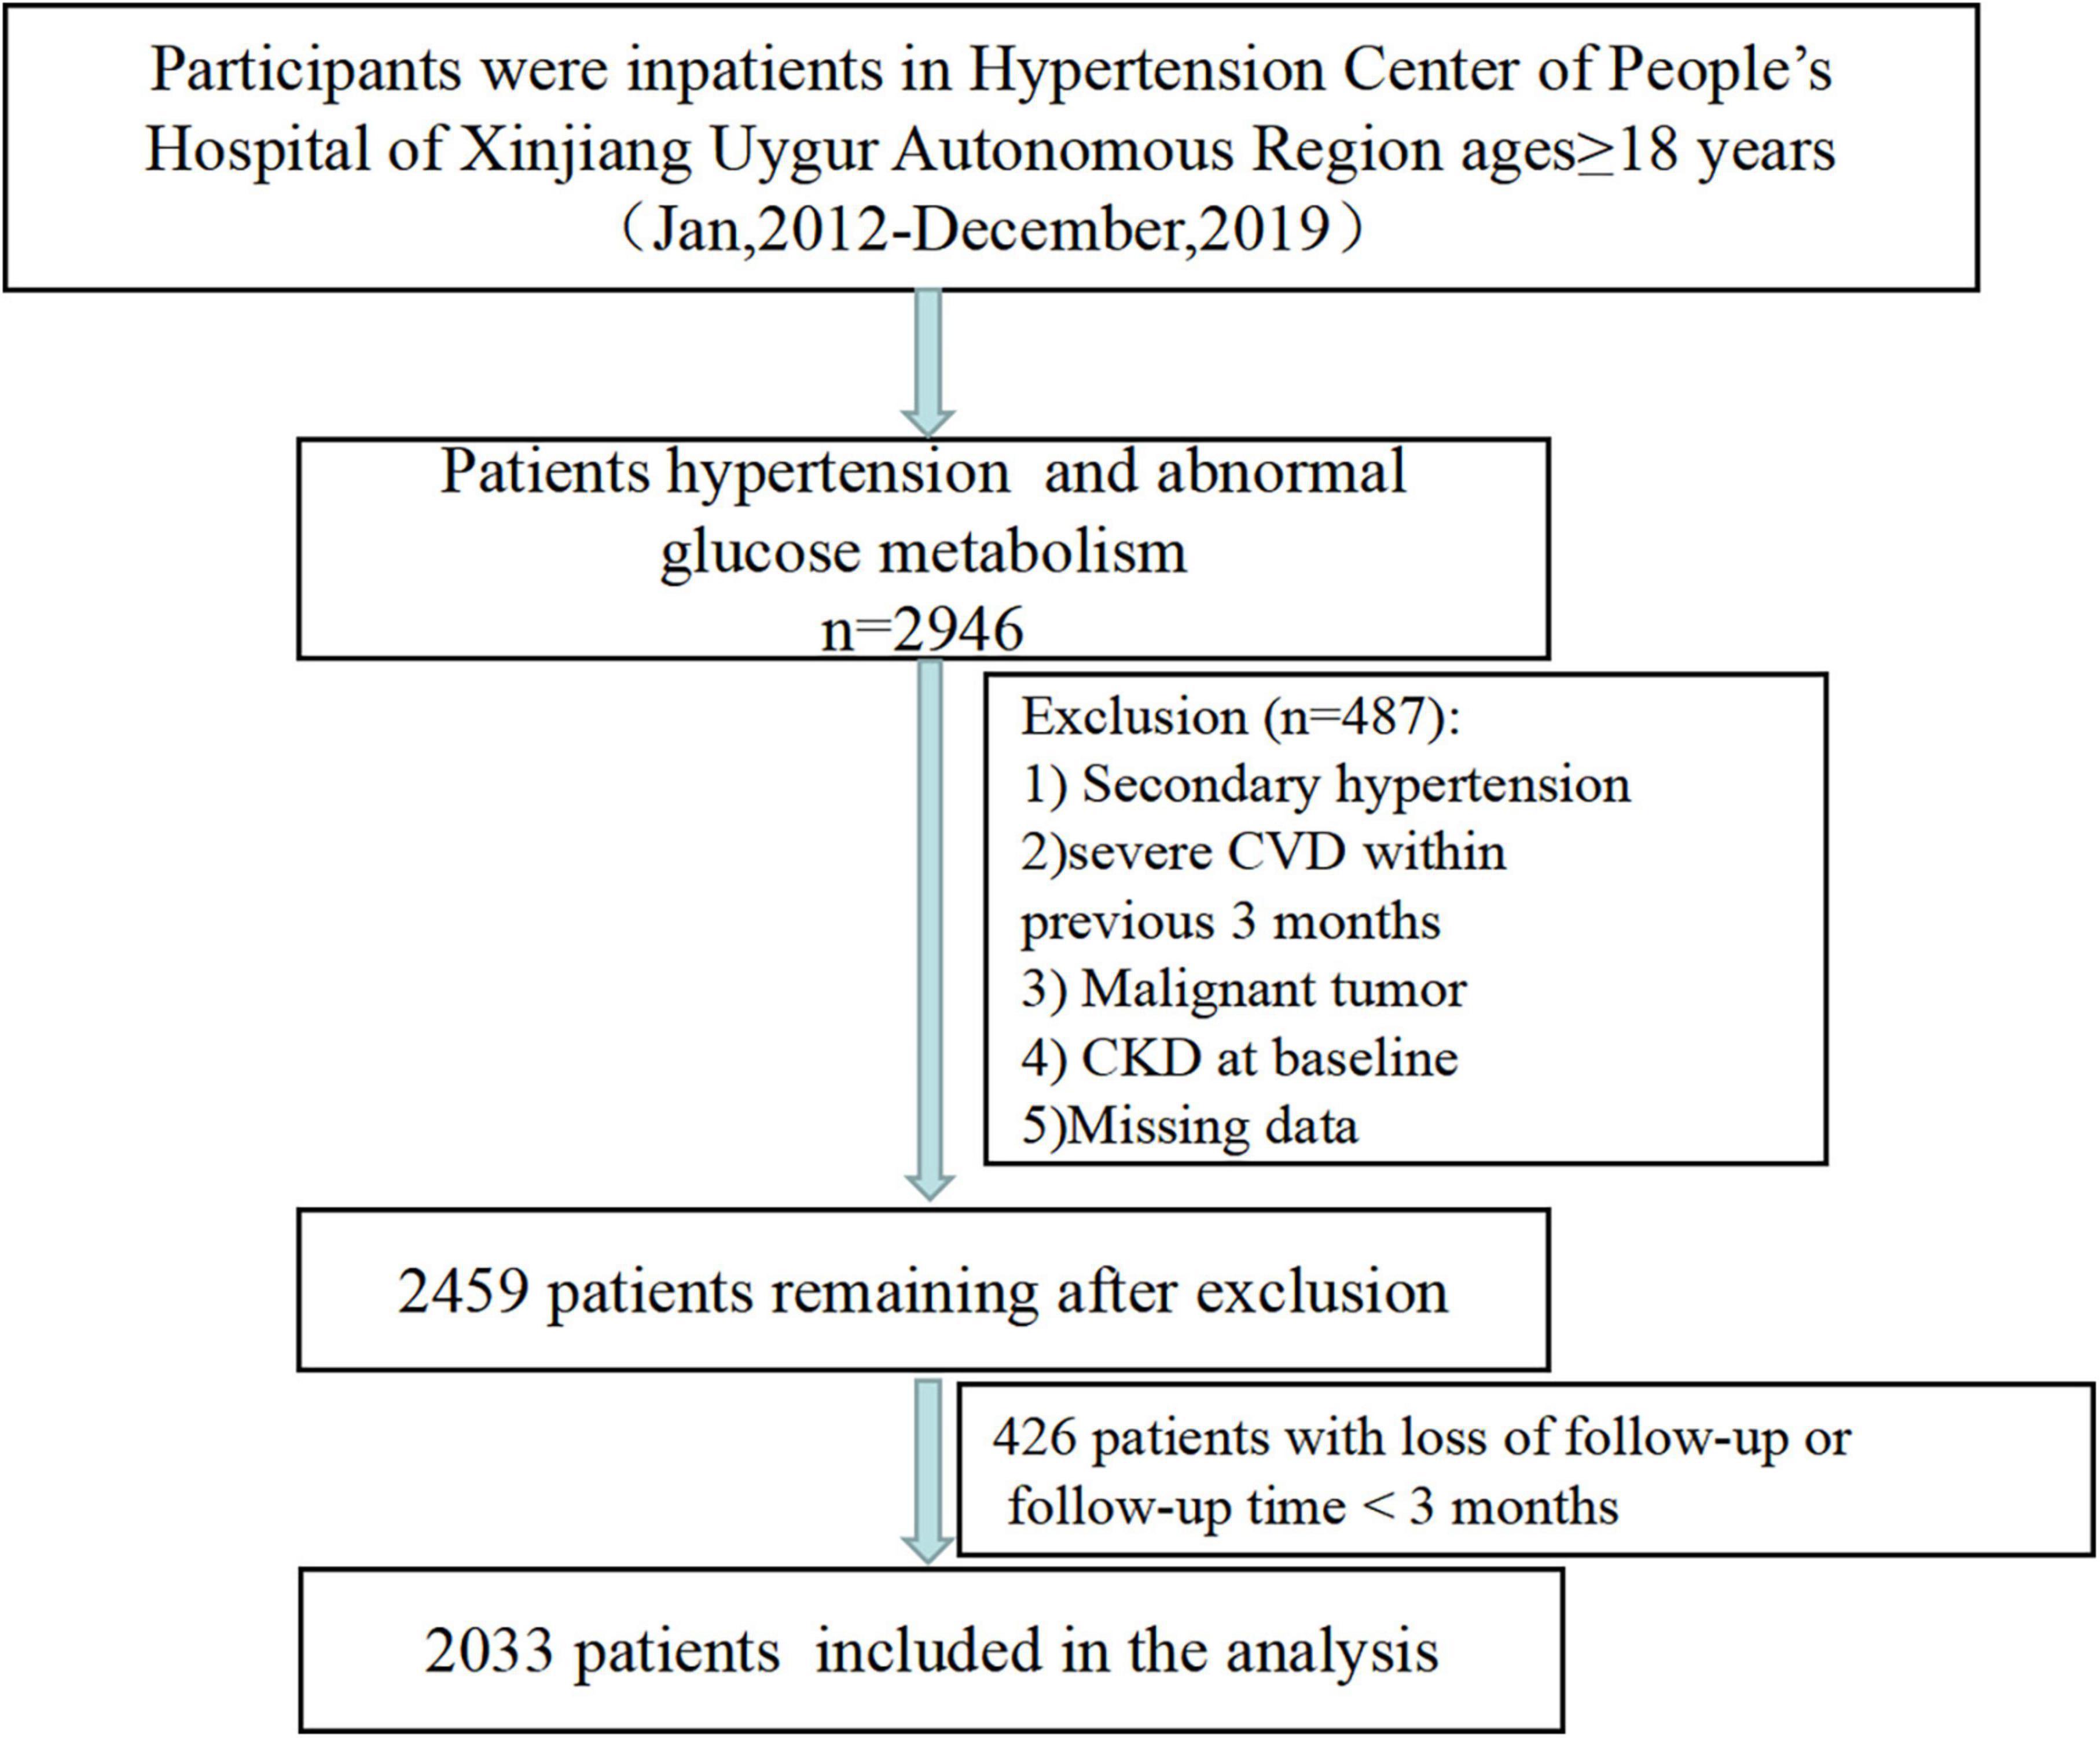
Figure 1. Patient screening flowchart.
Fasting blood glucose (FBG) and triglyceride (TG) levels were measured by the hexokinase/glucose-6-phosphate dehydrogenase method and the enzymatic colorimetric method, respectively. TyG index was calculated as ln [TG (mg/dL) × FBG (mg/dL)/2]. The units of TG and FBG were converted from mmol/L to mg/dL before calculation (For TG: 1 mmol/l = 88.57 mg/dl; For FBG, 1 mmol/l = 18 mg/dL).
Diagnostic criteria for hypertension and abnormal glucose metabolism [including impaired fasting glucose (IFG), impaired glucose tolerance (IGT), and diagnosed DM] have been described in previous studies (17, 18).
Follow-up data were obtained through outpatient or rehospitalization follow-up records, or annual physical examination data. At the same time, for patients with rehospitalization, we also extracted the diagnostic name and diagnostic disease Code (ICD-10) from the patient’s electronic medical record to identify definite CKD to exclude false positive cases caused by transient creatinine elevation or proteinuria of various causes. Retrospective follow-up data were collected until the outcome (new-onset CKD) or until the end of the study (May 31, 2021). Patients were considered lost to follow-up if there were no records of any follow-up visits after discharge and no annual health examination data. In addition, patients who were followed up for less than 3 months after baseline were also considered lost to follow-up. A total of 426 patients were lost to follow-up (Figure 1).
If a participant experienced the outcomes more than once during follow-up, only the first outcome was used for analysis. For those without CKD during follow-up, the data of the last follow-up was included in the analysis (17, 18).
CKD was defined as eGFR < 60 mL/min/1.73 m2 and/or proteinuria during follow up. We used the modification of diet in renal disease (MDRD) equation to evaluate eGFR. The qualitative results of urinary protein ≥ 1 + by urine dipstick were considered to be proteinuria.
SPSS (version 23.0) and R (version 4.0.5) software were used to analyze data. Continuous variables were expressed as mean (standard deviation) or median (interquartile range), and categorical variables were presented as frequencies with the percentages. Differences of all variables were compared and tested using the analysis of variance (ANOVA) or non-parametric Kruskal-Wallis H-test or a Chi-square test, accordingly. The cumulative incidence of CKD was estimated using the Kaplan–Meier method and differences among groups were evaluated by the log-rank test. Multivariate Cox proportional hazard regressions were constructed to estimate the association of TyG index with CKD by calculating the hazard ratio (HR) and 95% confidence interval (CI). Adjustment of covariates was based on the results of comparison between groups and multi-variable linear regression analysis. Multicollinearity was judged if the tolerance was less than 0.1 and the variance inflation factors (VIF) is greater than 3. Model 1 adjusted for sex, age, smoke, drink, BMI, duration of hypertension, duration of diabetes (known risk factors for CKD); Model 2 adjusted for variables in Model 1 plus SBP, DBP, LDL-C, HDL-C, Cr, BUN, and UA (all non-collinearity variables, and with P < 0.05 in baseline and univariable Cox analysis). Model 3 further adjusted for all included factors (in Model 2 plus lipid-lowering drugs, antidiabetic drugs, and antihypertensive drugs). Multivariate linear regression was used to evaluate the association between TyG index with eGFR by calculating the B coefficients and 95% CI.
In addition, restricted cubic spline analysis was performed to explore the dose-response relationship between TyG index with CKD, and eGFR. Two-tailed p-value < 0.05 was considered statistically significant.
Additionally, stratification analyses and sensitivity analyses were performed to further determine the relationship by excluding individuals with follow-up time less than 12 months.
A total of 2,033 participants were successfully followed up and included in the current study (Figure 1), with complete data of FBG and TG. The mean age was 55.53 ± 11.05 years 56.5% were men, 58.1% had diagnosed DM and mean BP were 148/88 mmHg. Baseline characteristics by quartiles of the TyG index were shown in Table 1. Participants with the highest TyG index tended to be younger, men, more current smokers, and alcohol drinkers, have higher prevalence of diabetes, FBG, HbA1c, TC, TG, LDL-C, and UA levels, have lower HDL-C levels, compared with participants in the lowest quartile group.
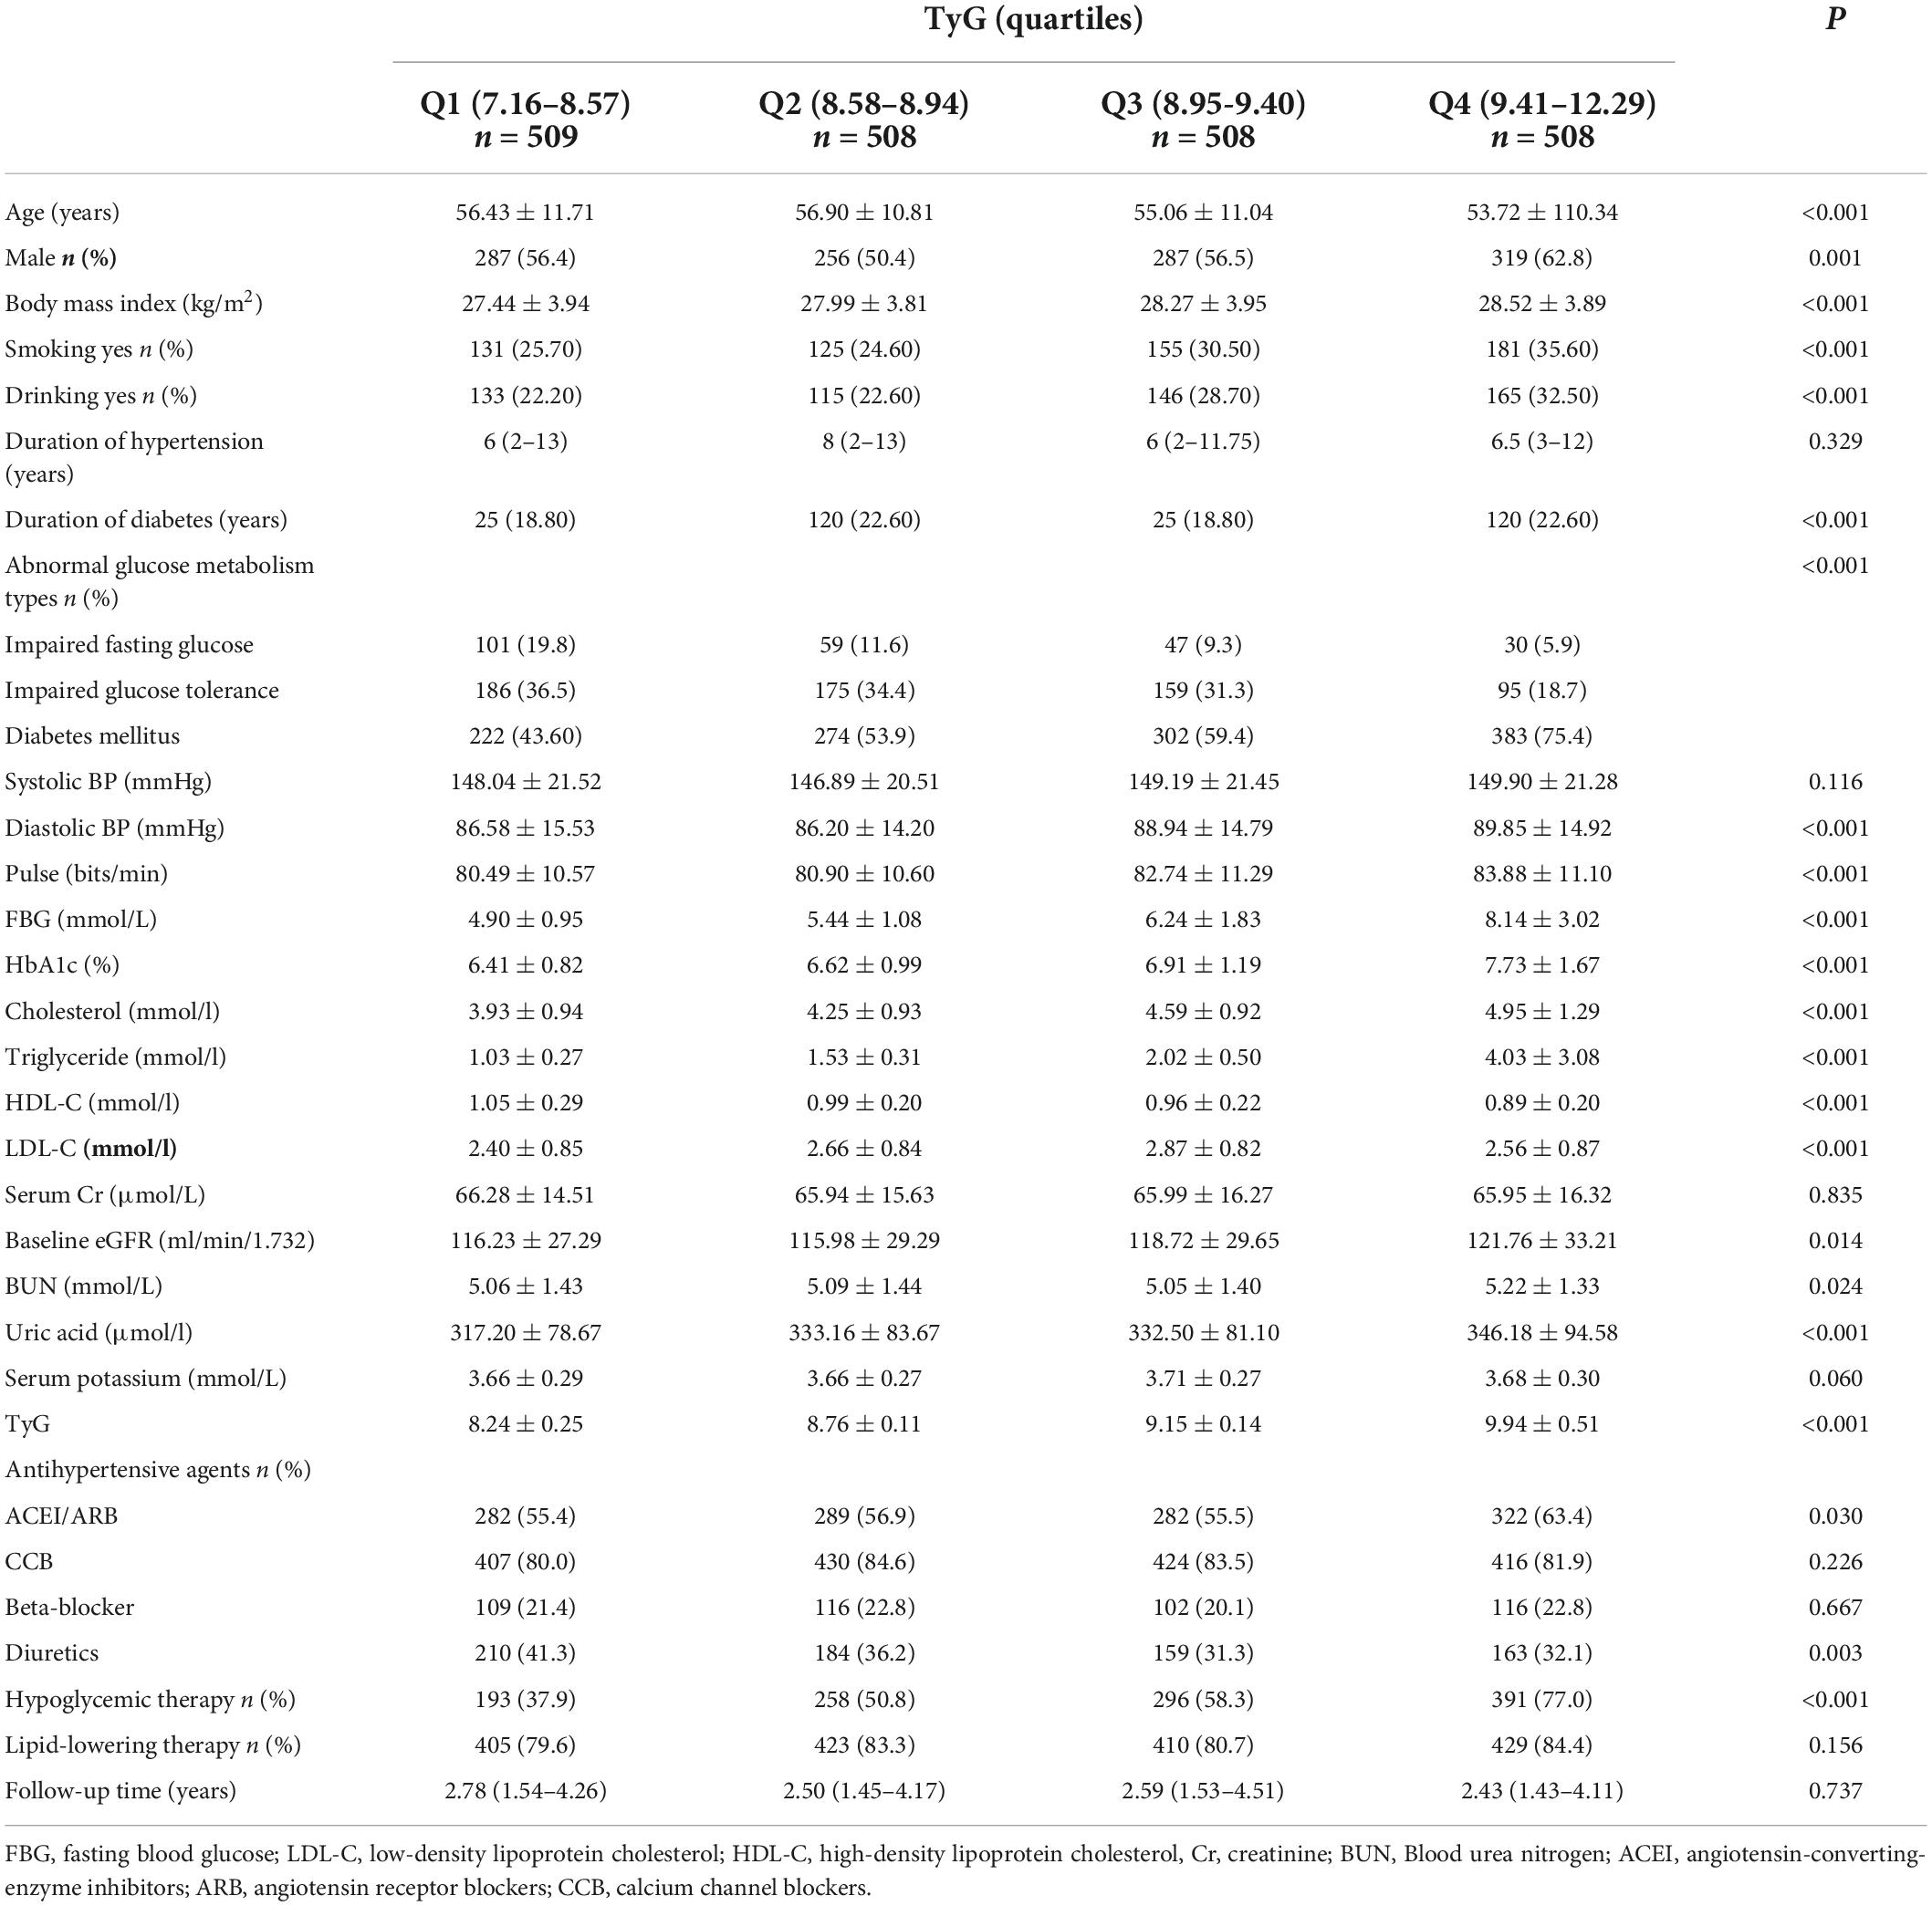
Table 1. Baseline characteristics of participants according to quartiles of TyG index.
In addition, baseline characteristics by CKD and not CKD were shown in Supplementary Table 1.
During a median follow-up of 31 (interquartile range: 18–51) months, 302 patients subsequently developed CKD. The incidence of CKD increased with increasing TyG index quartiles, from 37.39 in quartile 1 to 68.95 per 1,000 person-years in quartile 4. Participants in quartile 4 of TyG index had a higher risk for CKD, compared to participants in the other groups (log-rank test, P < 0.001; Figure 2).
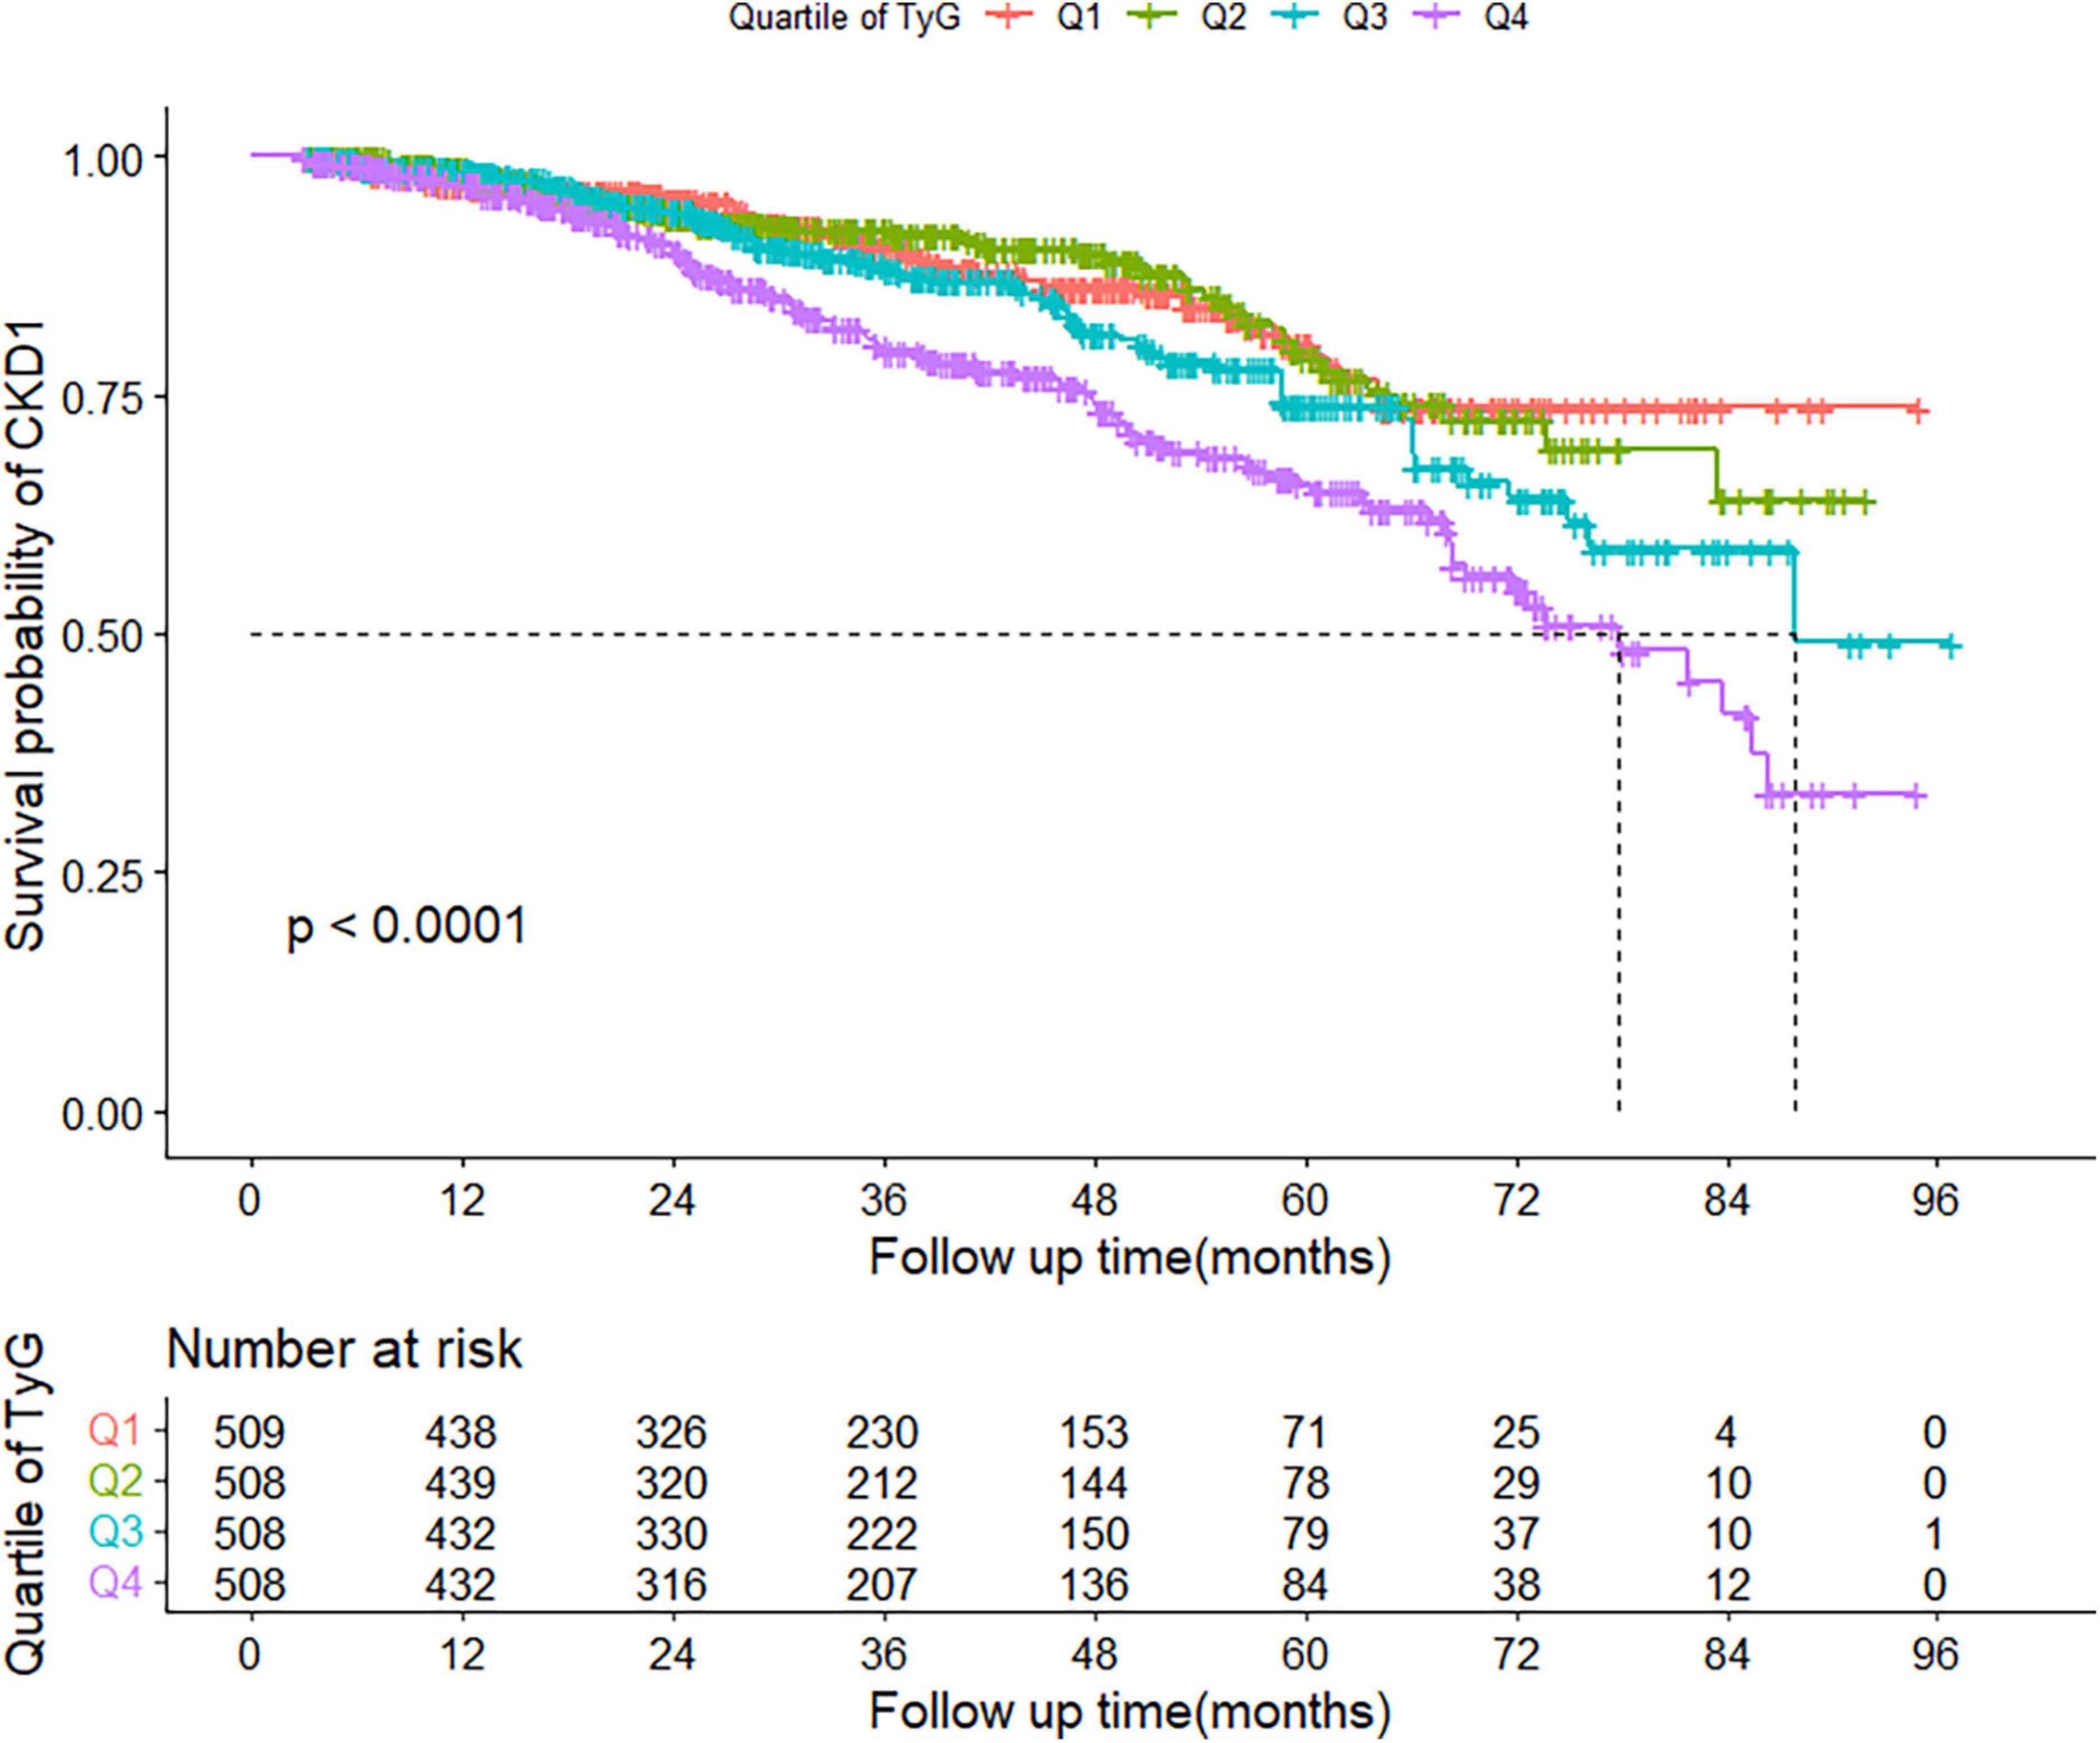
Figure 2. Kaplan–Meier curve of cumulative incidence of CKD based on quartiles of TyG index; P-value was generated based on log-rank test. CKD, chronic kidney disease.
In the collinearity test, FBG, TG, TyG, TC, and LDL-C showed VIF greater than 3; therefore, we excluded FBG, TG and TC in further analysis (shown in Supplementary Table 2).
The association between TyG index and CKD was shown in Table 2. Unadjusted Cox regression showed that TyG index had a positive association with CKD. After adjusting for different confounders (Model 1 and Model 2), this association still exists. Even after all covariates (Model 3), the risk for CKD increased 30% (95% CI, 1.10–1.15, P = 0.003) with each one-unit increase of TyG index. Taking the lowest quartile as a reference, the adjusted HRs (95% CIs) in the second, third and highest quartiles of TyG index were 0.97 (0.67–1.43), 1.22 (0.84–1.75), and 1.63 (1.14–2.33), respectively. P for trend was <0.05. The results were similar for its median, tertile, and for each 1 SD increment (Table 2).
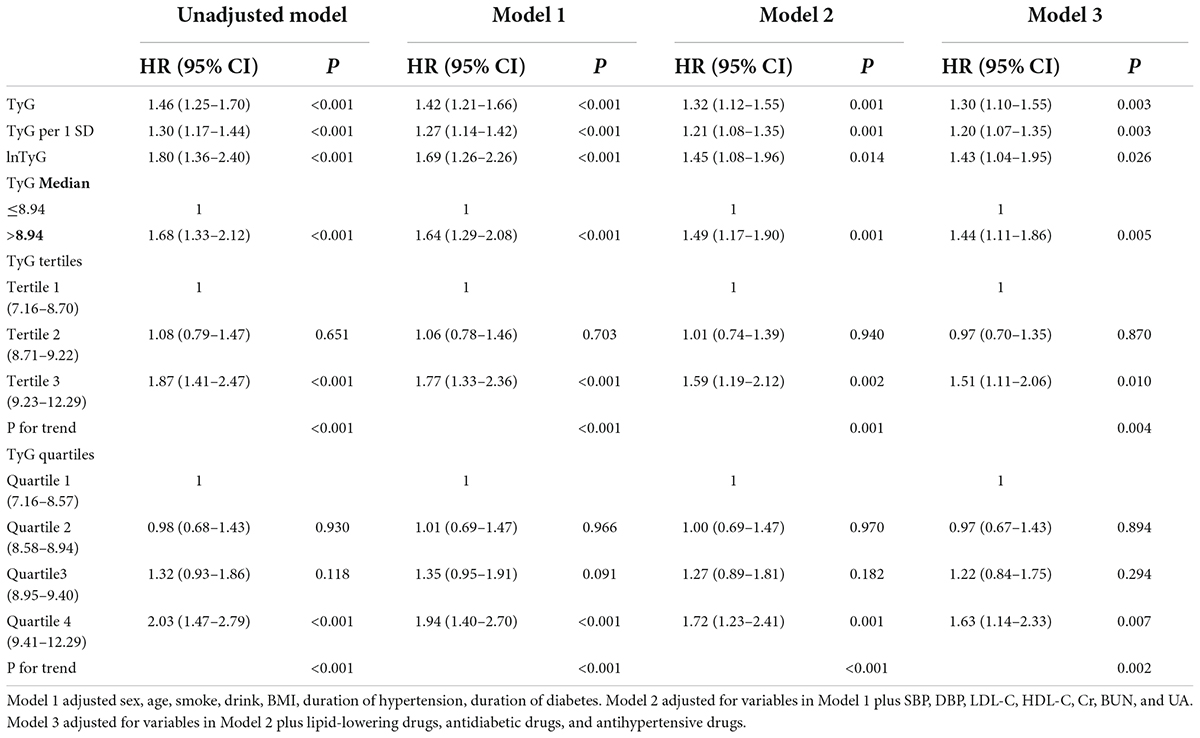
Table 2. Association between TyG and CKD.
Interestingly, restricted cubic spline analysis showed the relationship between TyG index and the risk of CKD is non-linear (P non-linearity = 0.018) (Figure 3). The HR for CKD first fell and after rising until around 8.94 of TyG index (TyG median) and started to increase rapidly afterward (P for TyG < 0.001). When further analyzed the relationship between TyG and eGFR by multivariate linear regression, the results showed that per 1-unit increase of TyG index induced about 2 unit decrease of Egfr (β: –2.12,95% CI:–4.01 to –0.23, P = 0.037). And, restricted cubic spline analysis also showed the relationship between TyG index and eGFR is non-linear (P = 0.026) (Figure 4).
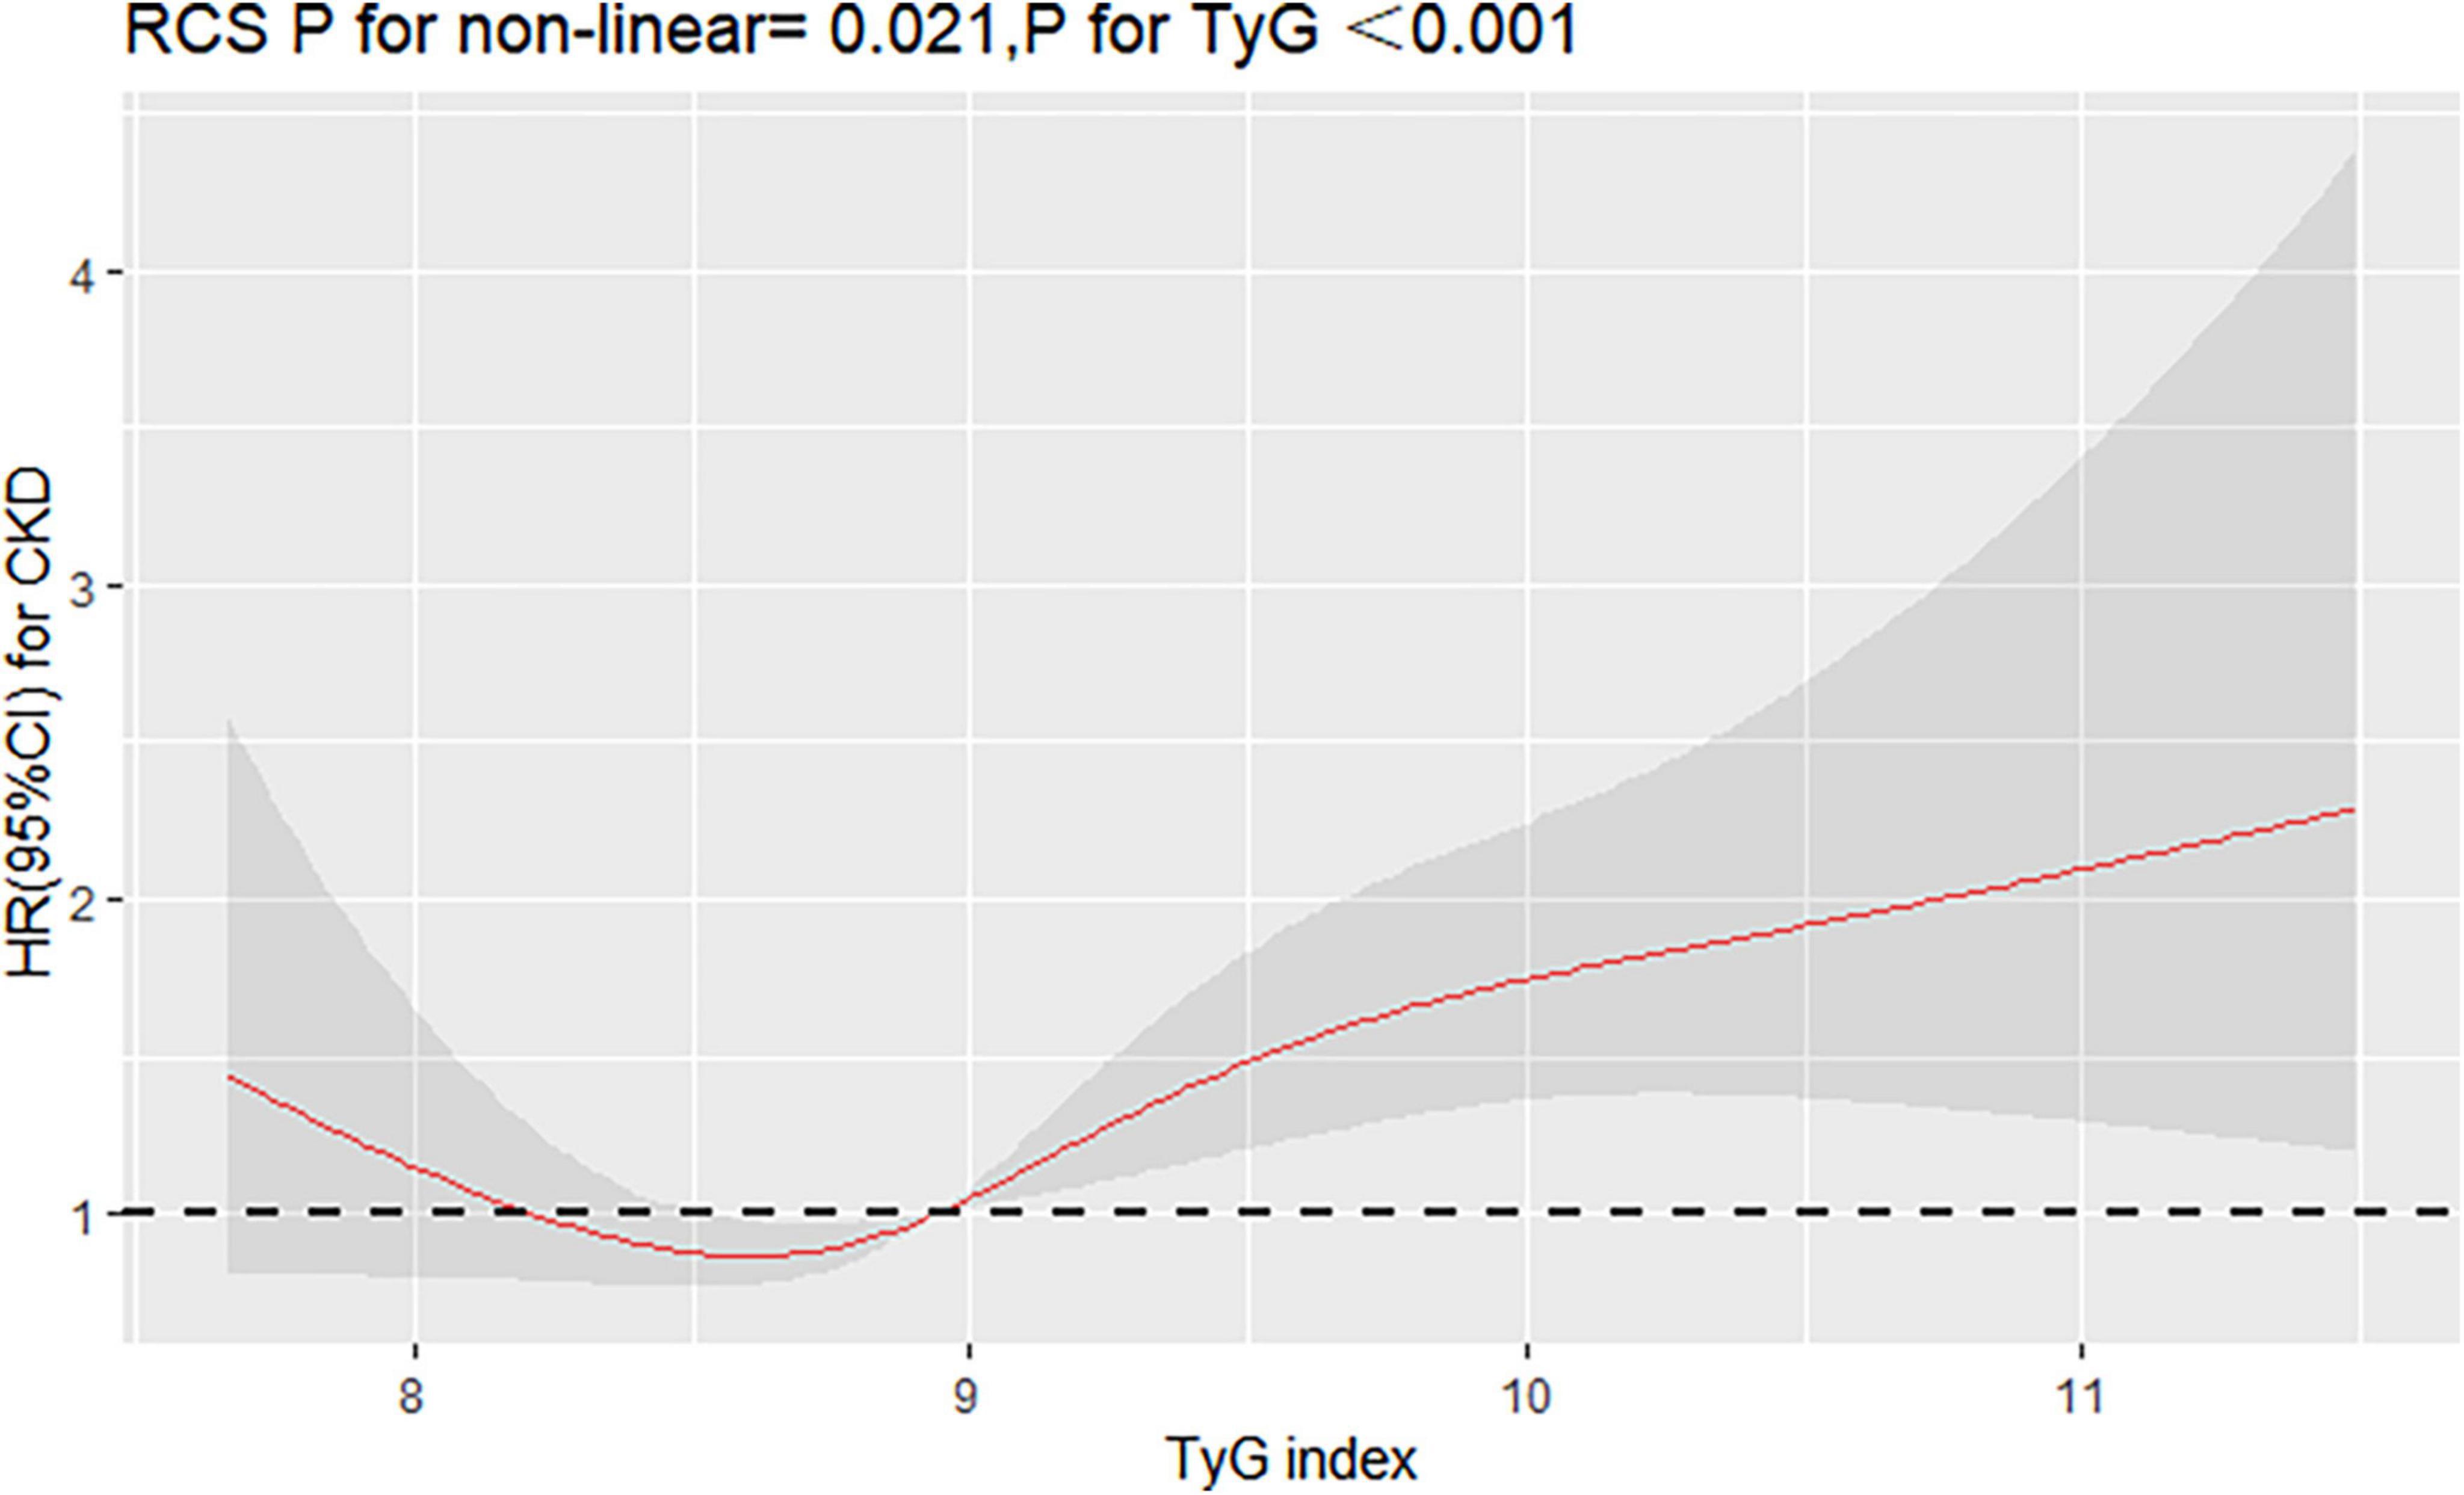
Figure 3. Restricted cubic splines (RCS) for the shape of the association of TyG with CKD. It was used a multivariate Cox regression model of restricted cubic spline with 4 knots (at the 5th, 35th, 65th, and 95th percentiles) of TyG adjusting for potential covariates (including sex, age, smoke, drink, BMI, duration of hypertension, duration of diabetes, SBP, DBP, LDL-C, HDL-C, Cr, BUN, UA, lipid-lowering drugs, antidiabetic drugs, and antihypertensive drugs). The reference point for TyG index was 8.94 (the median of TyG).

Figure 4. Restricted cubic splines (RCS) for the shape of the association of TyG with eGFR. It was used a multivariate linear regression model of RCS with 4 knots (at the 5th, 35th, 65th, and 95th percentiles) of TyG adjusting for potential covariates (the same as Figure 3). The curve was centered at the median value of 8.94.
We performed a series of stratified analysis, and none of the variables significantly modified the association between TyG index and CKD (P for all interaction > 0.05) (Figure 5). Also, sensitivity analysis after excluding individuals with follow-up less than 12 months, showed that relationship between TyG index and CKD was still stable (for TyG as continuous variable, adjusted HR:1.30,95% CI:1.10–1.55, P = 0.003; for TyG categorical variable, adjusted HR:1.44, 95% CI: 1.11–1.86, P = 0.005), as in Table 3.
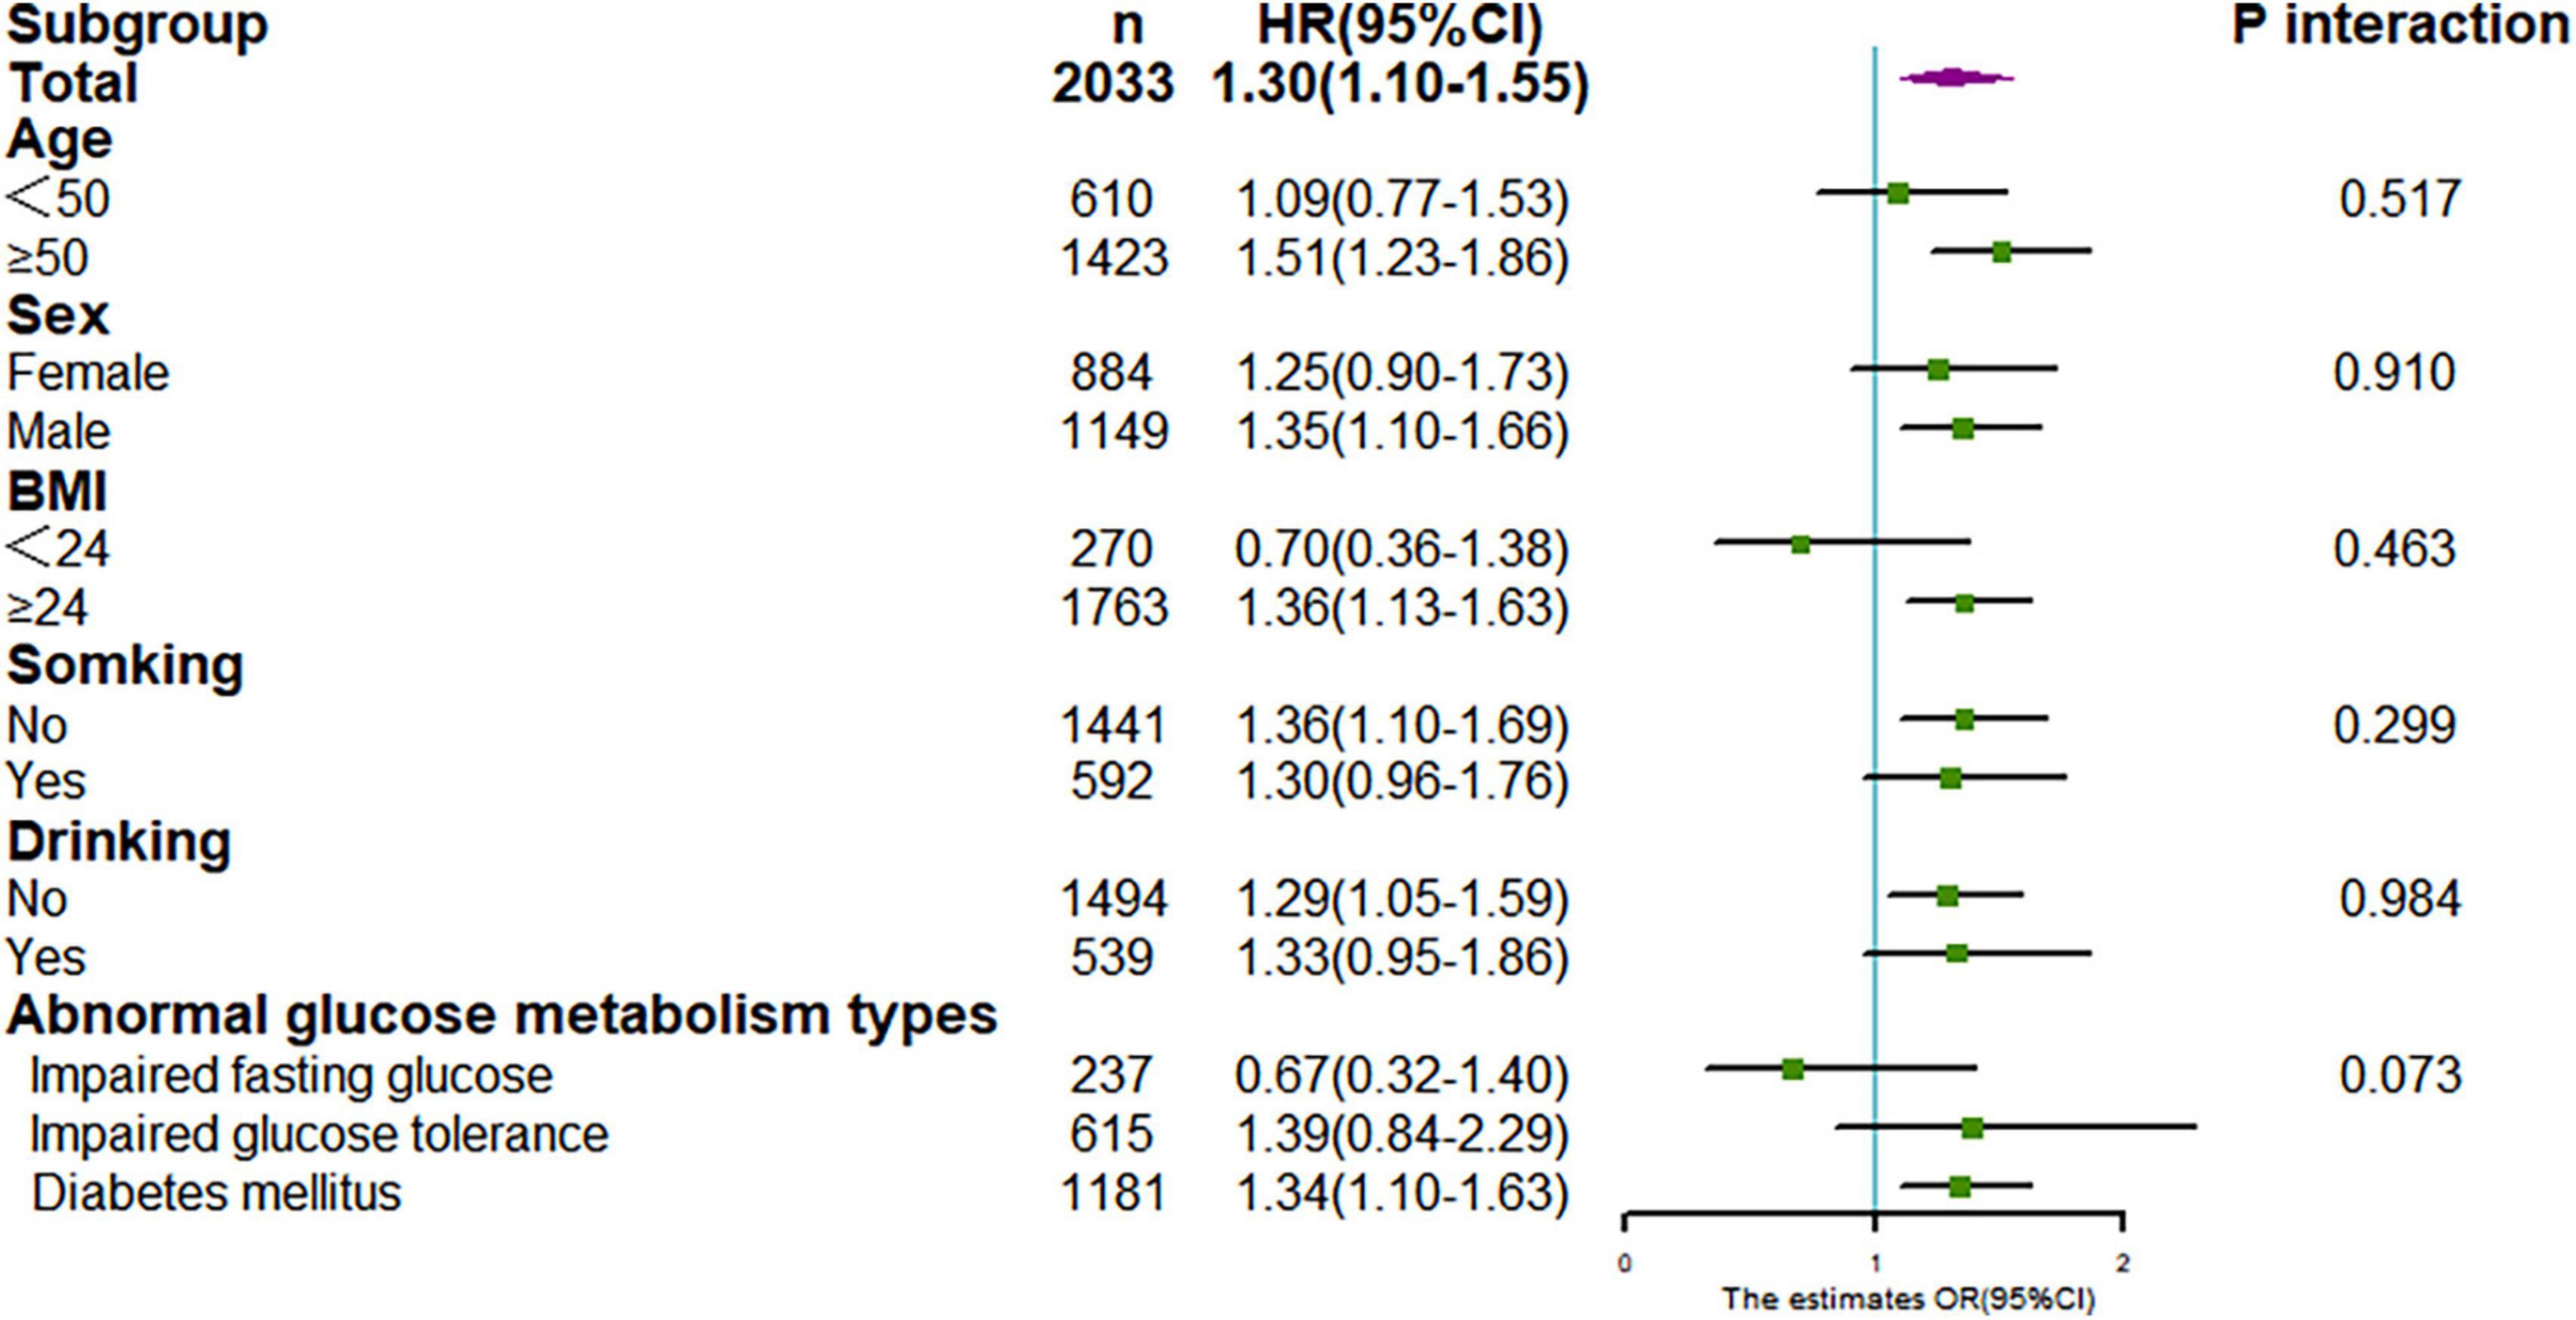
Figure 5. Stratification analysis on association between TyG with CKD. Results were derived from multivariate Cox regression and presented as hazard ratio (adjusting covariates: sex, age, smoke, drink, BMI, duration of hypertension, duration of diabetes, SBP, DBP, LDL-C, HDL-C, Cr, BUN, UA, lipid-lowering drugs, antidiabetic drugs, and antihypertensive drugs).
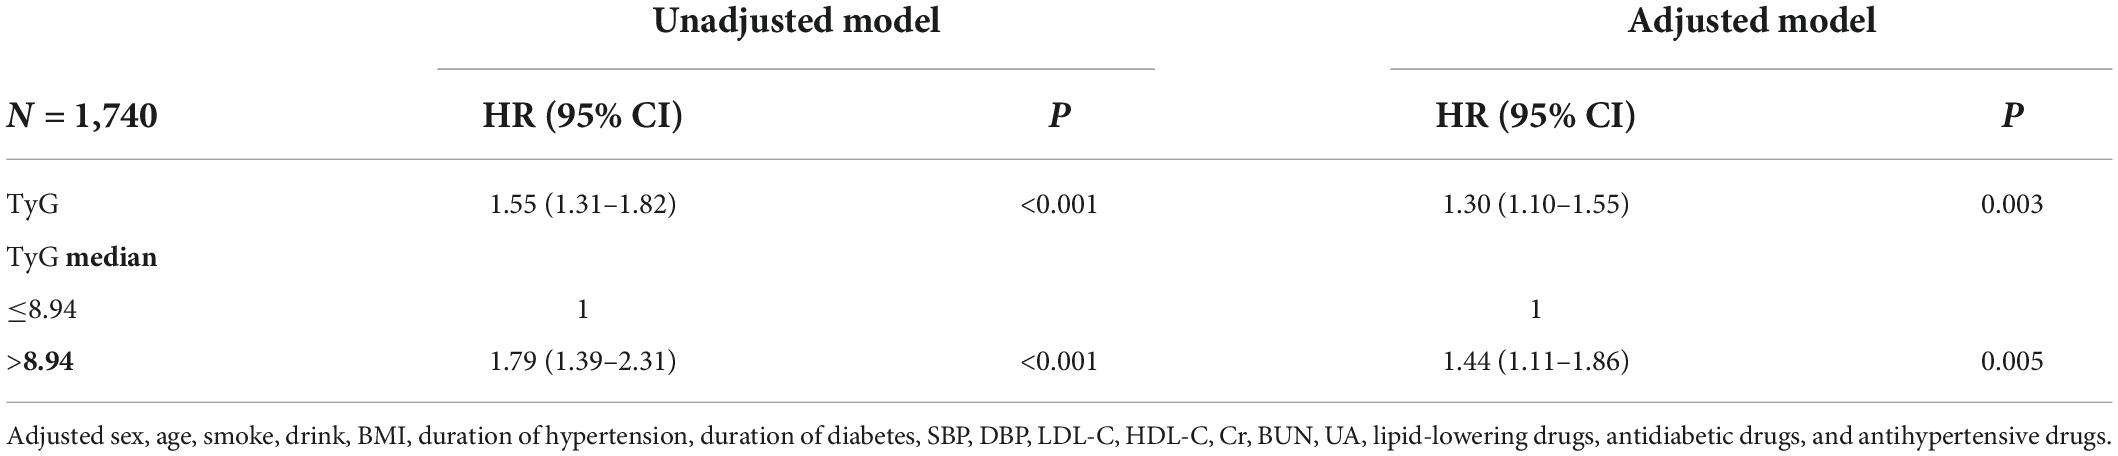
Table 3. Sensitivity analyses after excluding patients with follow up less than 12 months.
In this study, we identified a significant relationship of the TyG index with CKD in hypertensive patients with abnormal glucose metabolism, independent of other conventional risk factors. The TyG index in the form of both quartiles and continuous variables was related to CKD. Interestingly, we found the relationship between TyG index and the risk of CKD is non-linear and presents a U-shaped curve. The results were stable and were not modified by gender, age, or BMI, etc. Hence, identification of patients with TyG abnormalities, especially > 8.94, and intervention at an early stage is desirable for prevention of CKD.
First, IR is associated with an increased risk of metabolic diseases, such as hypertension, abnormal glucose metabolism, hyperuricemia, and dyslipidemia (19, 20), which are also risk factors for CKD (21). Second, animal and human studies demonstrated that hyper-insulinemia increases sodium reabsorption, induces glomerular hyperfiltration, which increases renal injury (22–24). Excess can lead to kidney damage. Third, IR can cause and accelerate the progression of CKD by damaging podocytes and basement membrane through chronic inflammation and oxidative stress (25, 26).
Homeostasis model assessment of IR, calculated by insulin and FBG, is often used to assess IR. However, the insulin is not routinely measured in clinical practice, leading that Homeostasis model assessment of IR is inappropriate for clinical practice (13). Therefore, researchers began to study a simple, reliable, and surrogate marker of IR, as TyG.
Our study that baseline TyG index was associated with an increased risk of CKD, which is supported by several studies in general cohorts and patients with DM (27–29), and the results were consistent across genders. However, in a cross-sectional study, only among participants aged over 65 years, higher levels of TyG were correlated with CKD in hypertensive patients (27). However, our study did not find significant difference in the risk of CKD with TyG in different age groups, P interaction > 0.05. It may be related to different study designs. Cross-sectional studies could not explain the causal relationship between them, and there were some uncontrolled confounding biases.
Interestingly, our study found a non-linear relationship between TyG index and CKD. With the gradual increase of TyG level, the risk of CKD first fell and after rising until around 8.94 of TyG index and started to increase rapidly afterward. This is similar to the study from China (30). As the TyG quartile increased, the risk of abnormal eGFR also appeared to decrease first and then increase in the study population. On the one hand, as we expected, patients with higher TyG had an increased risk of CKD. On the other hand, our results also suggest that lower TyG levels may increase the risk of CKD. Further studies are needed to elucidate the pathogenesis.
The present study has several strengths. First, we used a longitudinal design to evaluate the association between TyG index and CKD. Second, the study population cohort was at high risk for CKD, and the results may contribute to the prevention and treatment of CKD. Last, this study contributes to expand on reproducible, low-cost, monitoring-tools for the assessment and stratification of patients with a higher CKD risk. However, there were also several limitations in this study: (1) The study was conducted in a single center. However, it was conducted in a regional center for hypertension with patients of a large age range and from all over Xinjiang. (2) The portion of lost to follow-up may potentially bias the results. To minimize the bias, we combined rehospitalization and annual health check-up data to reduce the loss of follow-up rate (17.3% in this study), and there was no significant difference between included subjects and lost follow-up individuals for most baseline information. (3) Although we adjusted for potential risk factors for CKD, other unmeasured or residual confounders, such as genetic susceptibility, may well have affected the findings. However, because the population studied was quite homogeneous, the findings are likely to be stable and reliable. In addition, more attention should be paid to the relationship between cumulative exposure of TyG and CKD in future.
In conclusion, we found that an elevated TyG index is independently associated with a higher risk of CKD in hypertensive patients with abnormal glucose metabolism. Early intervention of metabolic factors in this high-risk population may prevent the occurrence of CKD, thereby reducing the incidence of CVD and premature death.
The raw data supporting the conclusions of this article will be made available by the authors, without undue reservation.
Written informed consent was obtained from the individual(s) for the publication of any potentially identifiable images or data included in this article.
NL and YG contributed to the study concept and design. QZ, YC, LC, JH, and YR contributed to data collection. QZ and YC analyzed the data together and drafted the manuscript. XC, LC, and QL gave important suggestions and did significant changes. All authors reviewed and approved the final manuscript.
This study was supported by the Key Research and Development Projects of Xinjiang Uygur Autonomous Region of China with (grant no. 2022B03009-1).
We thank Mengyue Lin from our center for his assistance during the data extraction and analysis.
The authors declare that the research was conducted in the absence of any commercial or financial relationships that could be construed as a potential conflict of interest.
All claims expressed in this article are solely those of the authors and do not necessarily represent those of their affiliated organizations, or those of the publisher, the editors and the reviewers. Any product that may be evaluated in this article, or claim that may be made by its manufacturer, is not guaranteed or endorsed by the publisher.
The Supplementary Material for this article can be found online at: https://www.frontiersin.org/articles/10.3389/fmed.2022.1018083/full#supplementary-material
BMI, Body mass index; BUN, blood urea nitrogen; CI, Confidence interval; CKD, chronic kidney disease; Cr, creatinine; CVD, Cardiovascular disease; DBP, Diastolic blood pressure; DM, diabetes mellitus; FBG, Fasting blood glucose; HbA1c, glycated hemoglobin; HDL-C, High-density lipoprotein cholesterol; HR, Hazard ratio; IR, Insulin resistance; LDL-C, Low-density lipoprotein cholesterol; SBP, Systolic blood pressure; TC, Total cholesterol; TG, Triglyceride; TyG, Triglyceride-glucose; UA, uric acid.
1. Woo KT, Choong HL, Wong KS, Tan HB, Chan CM. The contribution of chronic kidney disease to the global burden of major noncommunicable diseases. Kidney Int. (2012) 81:1044–5. doi: 10.1038/ki.2012.39
2. Herzog CA, Asinger RW, Berger AK, Charytan DM, Díez J, Hart RG, et al. Cardiovascular disease in chronic kidney disease. A clinical update from kidney disease: Improving global outcomes (KDIGO). Kidney Int. (2011) 80:572–86. doi: 10.1038/ki.2011.223
3. Kalantar-Zadeh K, Jafar TH, Nitsch D, Neuen BL, Perkovic V. Chronic kidney disease. Lancet. (2021) 398:786–802. doi: 10.1016/S0140-6736(21)00519-5
4. Lin M, Heizhati M, Wang L, Gan L, Li M, Yang W, et al. Prevalence and associated factors of kidney dysfunction in patients with hypertension and/or diabetes mellitus from a primary care population in northwest China. Int J Gen Med. (2021) 14:7567–78. doi: 10.2147/IJGM.S329604
5. Tannor EK, Sarfo FS, Mobula LM, Sarfo-Kantanka O, Adu-Gyamfi R, Plange-Rhule J. Prevalence and predictors of chronic kidney disease among Ghanaian patients with hypertension and diabetes mellitus: A multicenter cross-sectional study. J Clin Hypertens. (2019) 21:1542–50. doi: 10.1111/jch.13672.PMID
6. Akther J, Das A, Rahman MA, Saha SK, Hosen MI, Ebihara A, et al. Non-coding single nucleotide variants of renin and the (Pro)renin receptor are associated with polygenic diseases in a bangladeshi population. Biochem Genet. (2021) 59:1116–45. doi: 10.1007/s10528-021-10049-8
7. Palmieri V, Bella JN, Arnett DK, Liu JE, Oberman A, Schuck MY, et al. Effect of type 2 diabetes mellitus on left ventricular geometry and systolic function in hypertensive subjects: Hypertension genetic epidemiology network (HyperGEN) study. Circulation. (2001) 103:102–7. doi: 10.1161/01.cir.103.1.102
8. Barroso I, Gurnell M, Crowley VE, Agostini M, Schwabe JW, Soos MA, et al. Dominant negative mutations in human PPARgamma associated with severe insulin resistance, diabetes mellitus and hypertension. Nature. (1999) 402:880–3. doi: 10.1038/47254
9. Wang B, Yang Y, Li X. Interaction of hypertension and insulin resistance exacerbates the occurrence of diabetes mellitus in healthy individuals. J Diabetes Res. (2022) 2022:9289812. doi: 10.1155/2022/9289812
10. Santos IS, Bittencourt MS, Goulart AC, Schmidt MI, Diniz MFHS, Lotufo PA, et al. Insulin resistance is associated with carotid intima-media thickness in non-diabetic subjects. A cross-sectional analysis of the ELSA-Brasil cohort baseline. Atherosclerosis. (2017) 260:34–40. doi: 10.1016/j.atherosclerosis.2017.03.011
11. Ormazabal V, Nair S, Elfeky O, Aguayo C, Salomon C, Zuñiga FA. Association between insulin resistance and the development of cardiovascular disease. Cardiovasc Diabetol. (2018) 17:122. doi: 10.1186/s12933-018-0762-4.PMID:30170598
12. Pan Y, Zhong S, Zhou K, Tian Z, Chen F, Liu Z, et al. Association between diabetes complications and the triglyceride-glucose index in hospitalized patients with type 2 diabetes. J Diabetes Res. (2021) 2021:8757996. doi: 10.1155/2021/8757996
13. Tian X, Zuo Y, Chen S, Liu Q, Tao B, Wu S, et al. Triglyceride-glucose index is associated with the risk of myocardial infarction: An 11-year prospective study in the Kailuan cohort. Cardiovasc Diabetol. (2021) 20:19. doi: 10.1186/s12933-020-01210-5.PMID
14. Wu S, Xu L, Wu M, Chen S, Wang Y, Tian Y. Association between triglyceride-glucose index and risk of arterial stiffness: A cohort study. Cardiovasc Diabetol. (2021) 20:146. doi: 10.1186/s12933-021-01342-2
15. Zhang B, Liu L, Ruan H, Zhu Q, Yu D, Yang Y, et al. Triglyceride-glucose index linked to hospital mortality in critically Ill stroke: An observational multicentre study on eICU database. Front Med. (2020) 7:591036. doi: 10.3389/fmed.2020.591036
16. Zhao S, Yu S, Chi C, Fan X, Tang J, Ji H, et al. Association between macro– and microvascular damage and the triglyceride glucose index in community-dwelling elderly individuals: The Northern Shanghai study. Cardiovasc Diabetol. (2019) 18:95. doi: 10.1186/s12933-019-0898-x
17. Lin M, Heizhati M, Gan L, Yao X, Luo Q, Zhang D, et al. Higher aldosterone is associated with increased renal impairment risk in patients with hypertension and abnormal glucose metabolism: A longitudinal study. J Hypertens. (2022) 40:561–9. doi: 10.1097/HJH.0000000000003049
18. Lin M, Heizhati M, Gan L, Hong J, Wu T, Xiamili Z, et al. Higher plasma renin activity is associated with increased kidney damage risk in patients with hypertension and glucose metabolic disorders. J Clin Hypertens. (2022) 24:750–9. doi: 10.1111/jch.14492
19. Erichsen JM, Fadel JR, Reagan LP. Peripheral versus central insulin and leptin resistance: Role in metabolic disorders, cognition, and neuropsychiatric diseases. Neuropharmacology. (2022) 203:108877. doi: 10.1016/j.neuropharm.2021.108877
20. Morales-Villegas E. Dyslipidemia hypertension and diabetes metaflammation. A unique mechanism for 3 risk factors. Curr Hypertens Rev. (2014). [Epub ahead of print].
21. Yang S, Kwak S, Song YH, Han SS, Lee HS, Kang S, et al. Association of longitudinal trajectories of insulin resistance with adverse renal outcomes. Diabetes Care. (2022) 45:1268–75. doi: 10.2337/dc21-2521
22. Esteghamati A, Ashraf H, Nakhjavani M, Najafian B, Hamidi S, Abbasi M. Insulin resistance is an independent correlate of increased urine albumin excretion: A cross-sectional study in Iranian Type 2 diabetic patients. Diabet Med. (2009) 26:177–81. doi: 10.1111/j.1464-5491.2008.02653.x
23. Dengel DR, Goldberg AP, Mayuga RS, Kairis GM, Weir MR. Insulin resistance, elevated glomerular filtration fraction, and renal injury. Hypertension. (1996) 28:127–32. doi: 10.1161/01.hyp.28.1.127
24. Andronico G, Ferraro-Mortellaro R, Mangano MT, Romé M, Raspanti F, Pinto A, et al. Insulin resistance and glomerular hemodynamics in essential hypertension. Kidney Int. (2002) 62:1005–9.
25. Polianskyte-Prause Z, Tolvanen TA, Lindfors S, Kon K, Hautala LC, Wang H, et al. Ebselen enhances insulin sensitivity and decreases oxidative stress by inhibiting SHIP2 and protects from inflammation in diabetic mice. Int J Biol Sci. (2022) 18:1852–64. doi: 10.7150/ijbs.66314
26. Du J, Fan LM, Mai A, Li JM. Crucial roles of Nox2-derived oxidative stress in deteriorating the function of insulin receptors and endothelium in dietary obesity of middle-aged mice. Br J Pharmacol. (2013) 170:1064–77. doi: 10.1111/bph.12336
27. Shi Y, Hu L, Li M, Zhou W, Wang T, Zhu L, et al. Association between the surrogate markers of insulin resistance and chronic kidney disease in Chinese hypertensive patients. Front Med. (2022) 9:831648. doi: 10.3389/fmed.2022.831648
28. Chen T, Wang X, Wang X, Chen H, Xiao H, Tang H, et al. Comparison of novel metabolic indices in estimation of chronic kidney diseases in a southern Chinese population. Diabetes Metab Syndr Obes. (2020) 13:4919–27. doi: 10.2147/DMSO.S286565
29. Okamura T, Hashimoto Y, Hamaguchi M, Obora A, Kojima T, Fukui M. Triglyceride-glucose index is a predictor of incident chronic kidney disease: A population-based longitudinal study. Clin Exp Nephrol. (2019) 23:948–55. doi: 10.1007/s10157-019-01729-2
30. Xu X, Tang X, Che H, Guan C, Zhao N, Fu S, et al. [Triglyceride-glucose product is an independent risk factor for predicting chronic kidney disease in middle-aged and elderly population: A prospective cohort study]. J Southern Med Univ. (2021) 41:1600–8. doi: 10.12122/j.issn.1673-4254.2021.11.02
Keywords: triglyceride-glucose index, diabetes, chronic kidney disease, hypertension, insulin resistance
Citation: Zhu Q, Chen Y, Cai X, Cai L, Hong J, Luo Q, Ren Y, Guo Y and Li N (2022) The non-linear relationship between triglyceride-glucose index and risk of chronic kidney disease in hypertensive patients with abnormal glucose metabolism: A cohort study. Front. Med. 9:1018083. doi: 10.3389/fmed.2022.1018083
Received: 12 August 2022; Accepted: 05 September 2022;
Published: 20 September 2022.
Edited by:
Hamad Ali, Kuwait University, KuwaitReviewed by:
Barrak Alahmad, Harvard University, United StatesCopyright © 2022 Zhu, Chen, Cai, Cai, Hong, Luo, Ren, Guo and Li. This is an open-access article distributed under the terms of the Creative Commons Attribution License (CC BY). The use, distribution or reproduction in other forums is permitted, provided the original author(s) and the copyright owner(s) are credited and that the original publication in this journal is cited, in accordance with accepted academic practice. No use, distribution or reproduction is permitted which does not comply with these terms.
*Correspondence: Yanying Guo, Z3VvemV5YW5nQDEyNi5jb20=; Nanfang Li, bG5hbmZhbmcyMDE2QHNpbmEuY29t; orcid/0000-0003-1505-8566
†These authors have contributed equally to this work
Disclaimer: All claims expressed in this article are solely those of the authors and do not necessarily represent those of their affiliated organizations, or those of the publisher, the editors and the reviewers. Any product that may be evaluated in this article or claim that may be made by its manufacturer is not guaranteed or endorsed by the publisher.
Research integrity at Frontiers
Learn more about the work of our research integrity team to safeguard the quality of each article we publish.