 Yuwen Chen1†
 Yiziting Zhu2†
 Kunhua Zhong1Zhiyong Yang3Yujie Li3Xin Shu3Dandan Wang3Peng Deng3Xuehong Bai3Jianteng Gu3
 Kaizhi Lu3Ju Zhang1
 Lei Zhao4
 Tao Zhu5Ke Wei2*
 Bin Yi3*
- 1Chongqing Institute of Green and Intelligent Technology, Chinese Academy of Sciences (CAS), Chongqing, China
- 2Department of Anesthesiology, The First Affiliated Hospital of Chongqing Medical University, Chongqing, China
- 3Department of Anesthesiology, Southwest Hospital, Third Military Medical University, Chongqing, China
- 4Department of Anesthesiology, Xuanwu Hospital, Capital Medical University, Beijing, China
- 5Department of Anesthesiology, West China Hospital of Sichuan University, Chengdu, China
Enhanced recovery after surgery (ERAS) can accelerate patient recovery. However, little research has been done on optimizing the ERAS-related measures and how the measures interact with each other. The Bayesian network (BN) is a graphical model that describes the dependencies between variables and is also a model for uncertainty reasoning. In this study, we aimed to develop a method for optimizing anesthetic decisions in ERAS and then investigate the relationship between anesthetic decisions and outcomes. First, assuming that the indicators used were independent, the effects of combinations of single indicators were analyzed based on BN. Additionally, the impact indicators for outcomes were selected with statistical tests. Then, based on the previously selected indicators, the Bayesian network was constructed using the proposed structure learning method based on Strongly Connected Components (SCC) Local Structure determination by Hill Climbing Twice (LSHCT) and adjusted according to the expert’s knowledge. Finally, the relationship is analyzed. The proposed method is validated by the real clinical data of patients with benign gynecological tumors from 3 hospitals in China. Postoperative length of stay (LOS) and total cost (TC) were chosen as the outcomes. Experimental results show that the ERAS protocol has some pivotal indicators influencing LOS and TC. Identifying the relationship between these indicators can help anesthesiologists optimize the ERAS protocol and make individualized decisions.
Introduction
Enhanced recovery after surgery (ERAS) is a clinical strategy designed to reduce patients’ stress responses to surgery and preserve their physiological state as much as possible. It includes a series of medical decisions in the perioperative period that can facilitate the rapid recovery of patients undergoing surgery. Implementing the ERAS protocol can result in shorter hospital stays, less postoperative pain, lower complication rates, and earlier initiation of feeding and ambulation (1, 2). For patients with different demographic characteristics, different treatment options, and postoperative complications, cooperation and specialization of multiple departments are required (3). ERAS has been applied in many departments (4–8), and previous ERAS studies have mainly verified its efficacy and safety of the ERAS protocol. Meanwhile, the feasibility and safety of monotherapy or equivalent measures have been investigated. A few studies explored the interaction between various indicators in ERAS and optimizing ERAS strategies.
Anesthetic decision-making is an integral part of the perioperative period and essential to ERAS implementation (9). The anesthesia decisions mainly involved intraoperative management and postoperative analgesia, such as intraoperative blood pressure, urine volume, non-steroidal drugs, and compound nerve blocks. There are significant links between patient recovery and anesthesia (10, 11). For gynecologic surgeries, the choice of anesthetic can influence postoperative outcomes. Prophylactic dexamethasone administration and propofol infusion have been shown to reduce the incidence of nausea and vomiting after laparoscopic gynecological operations (12, 13), as well as other studies related to pain control (14). However, no studies have systematically assessed the effects of a series of anesthesia decision indicators, the interaction between these indicators, or the overall influence of indicator combinations. In addition, some of the indicators may not be necessary. In clinical practice, optimizing the anesthetic part of ERAS and recognizing the interaction can enhance decision-making efficiency.
Optimizing the anesthetic decision-making in the ERAS protocol can be viewed as a multivariate analysis to determine the indicators that have a greater impact on the patient’s prognosis and recommend their combinations. For previous studies, traditional statistical methods mainly use multivariate analysis and logistic regression analysis to find indicators with statistical differences. However, the variable relationship in clinical decision-making is complex and uncertain, making it prone to problems such as insufficient fitting and low accuracy. Bayesian Network (BN) is a type of machine learning (ML) that has been applied to the medical field, such as disease diagnosis (15, 16), risk prediction (17, 18). Its core lies in probabilistic methods (19, 20). BN is a graphical model that describes the dependencies between data variables and is also a model for uncertainty reasoning. Based on probabilistic reasoning, BN can identify causal relationships between nodes and give the conditional probability of each node. Therefore, BN has advantages when variables have a relationship or uncertainty (21, 22). There is a lot of room for developing the BN algorithm for anesthesia decision-making in ERAS.
In this study, we aimed to develop a method for anesthesia decision optimization in ERAS and then investigate the relationship between anesthetic decisions and outcomes in patients with benign gynecological tumors based on the proposed method. By finding impact indicators in the anesthetic part of ERAS, we conducted a BN analysis of these indicators and made recommendations to improve the outcomes.
Method description
Our method for anesthesia decision optimization in ERAS consists of two main steps: (1) extraction of key indicators of anesthesia decision making and (2) building a decision graph based on the anesthesia Bayesian decision intervention model. As shown in Figure 1, we first use Bayesian network and statistical tests to select indicators. Then, we propose a Bayesian decision intervention model for anesthesia based on the LSHCT method to construct a decision graph. Python 3.9 was used to construct the BN model.
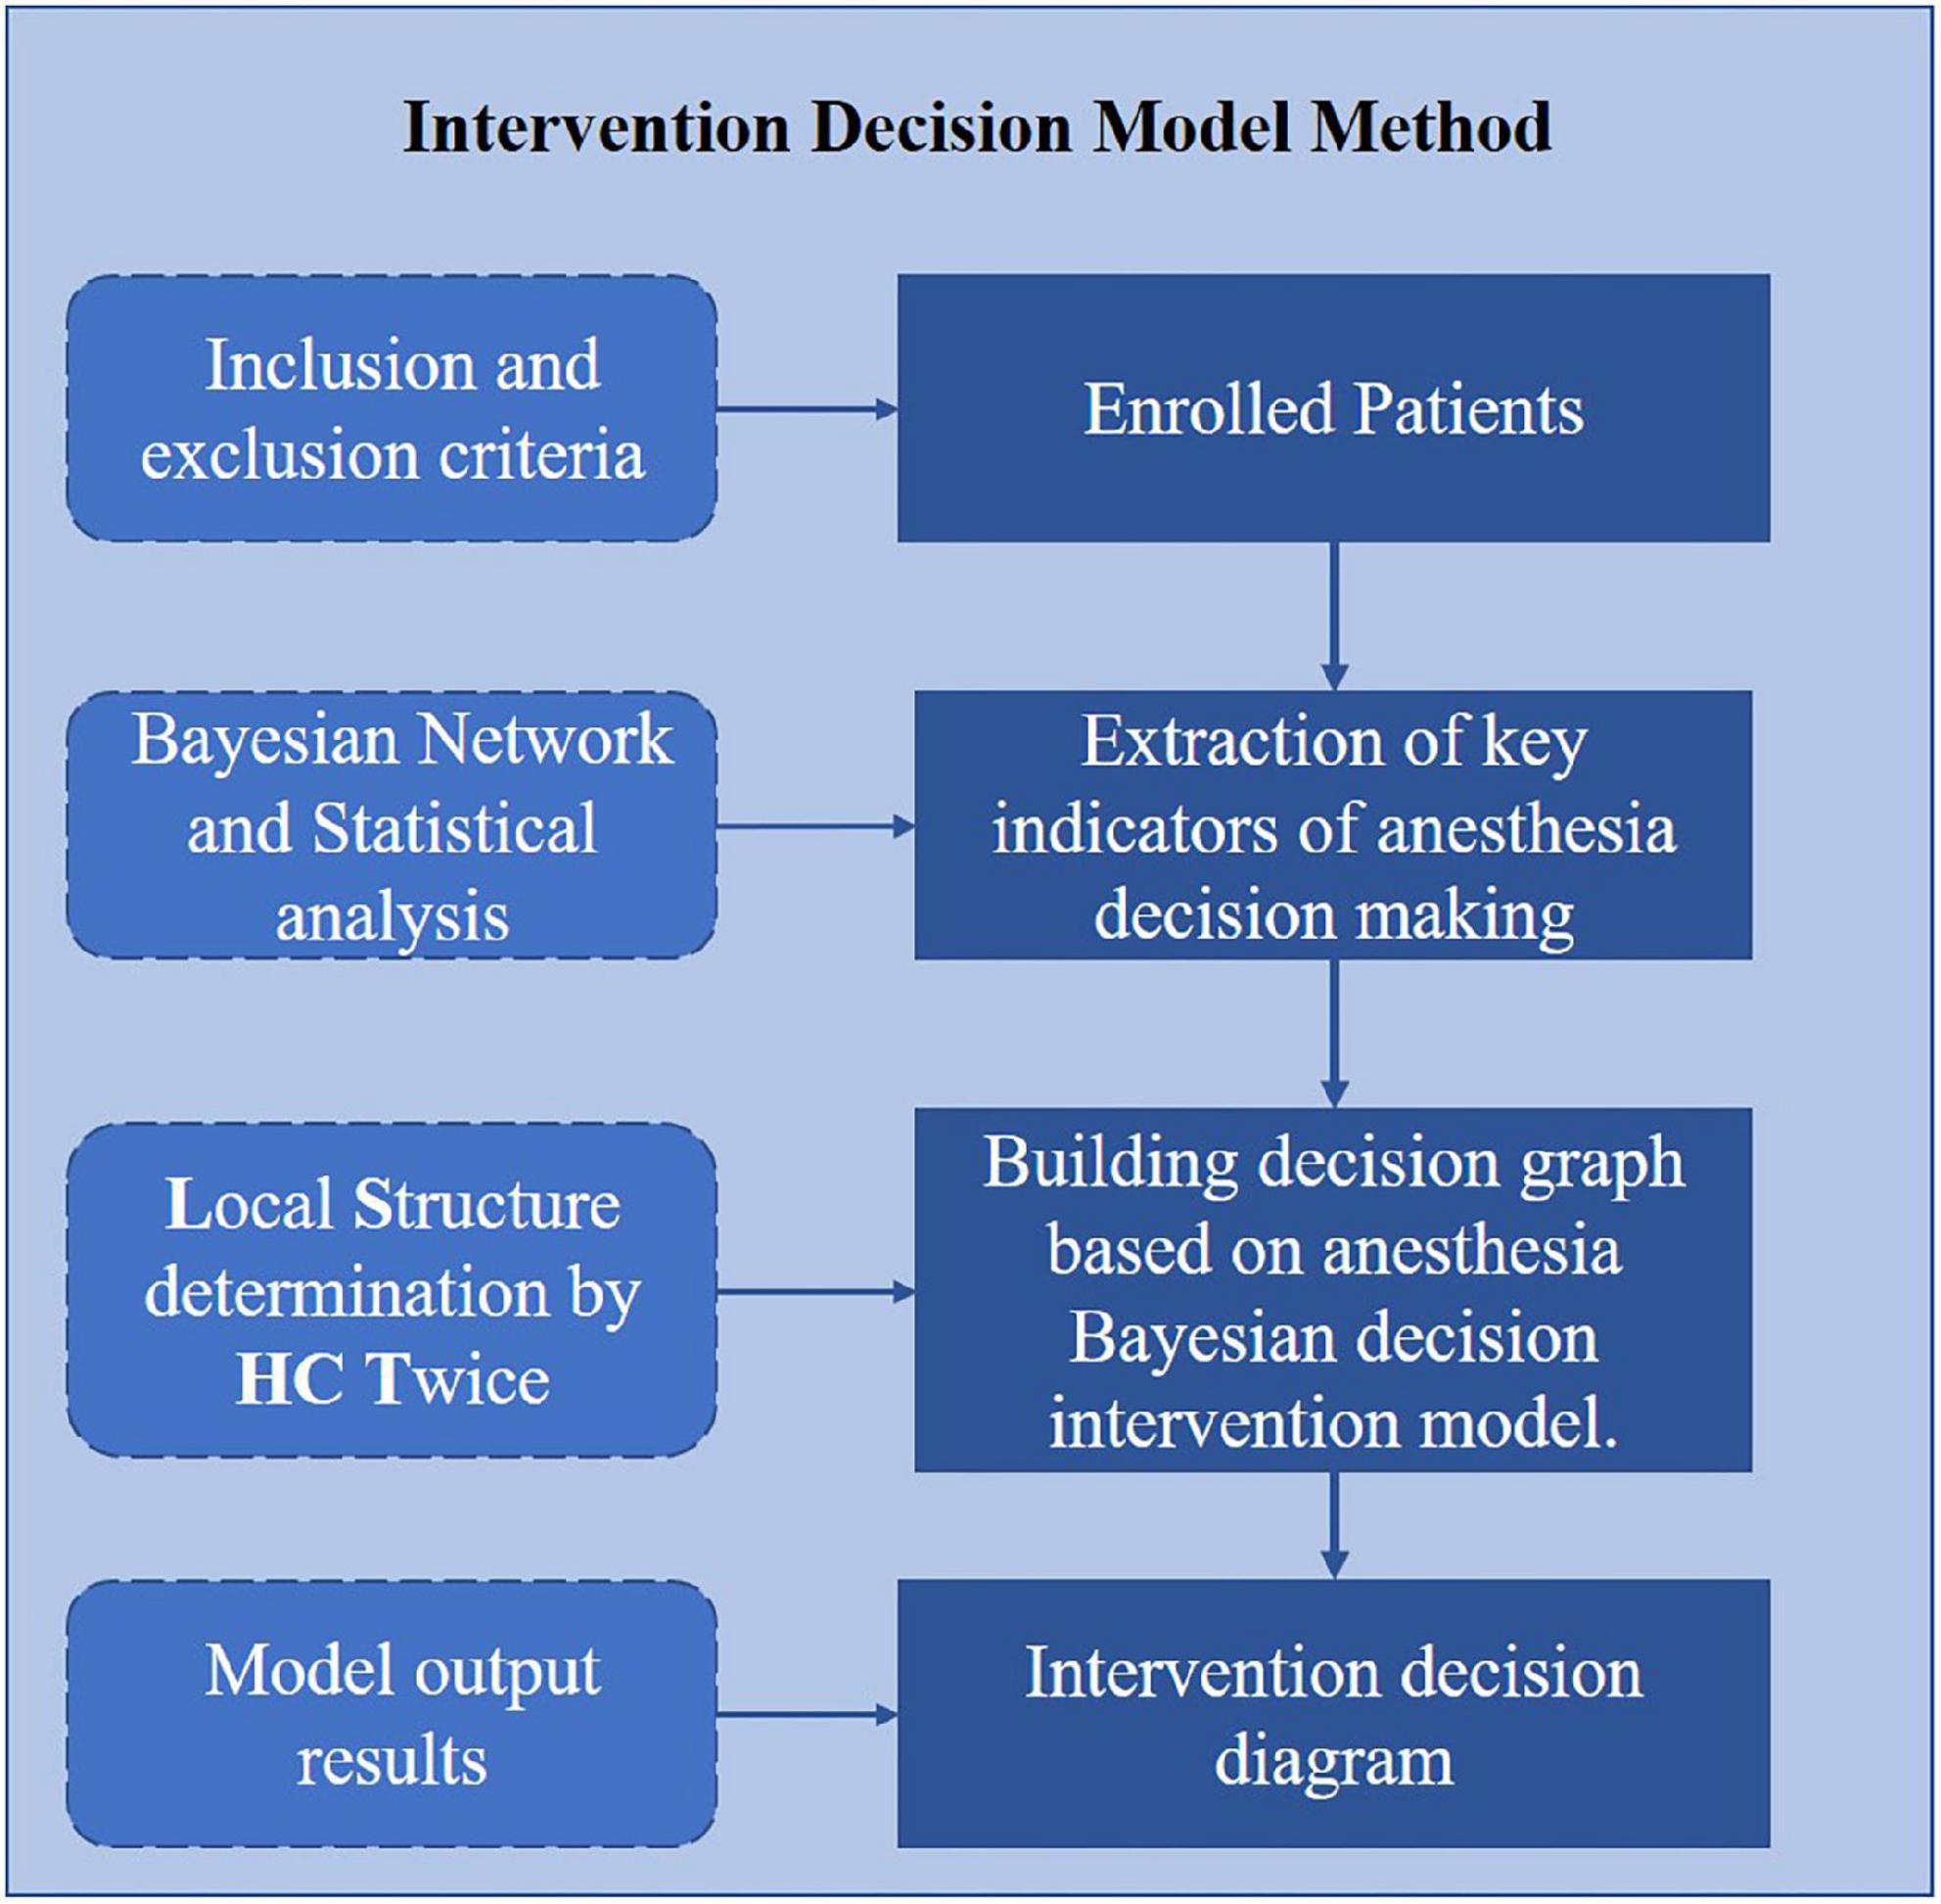
Figure 1. Study protocol.
The model is described in detail as follows:
Extraction of key indicators of anesthesia decision making
Now, machine learning has been widely used in the field of computers, which can be optimized. They are applied to things such as Web service and feature extraction, including Quality-of-Service (QoS) prediction (23), improving the quality of online streaming feature selection (OSFS) with missing data (24), handling the data streams with a varying feature space based on Generative Learning with Streaming Capricious (GLSC) (25), etc. ML can also be used in the optimization of medical decision-making. In this study, we chose the Bayesian Network (BN). BN is a graphical model to describe the dependency relationship between data variables, as well as a model for uncertainty reasoning. BN provides a convenient framework for people to express the dependency relationship, making the logic of uncertainty reasoning clearer and more understandable. From a statistical point of view, BN is a graphical probability model. Pearl et al. from the University of California proposed the Bayesian Network model for the first time in 1988 (26). They applied BN to the expert system successfully, making it a popular method for uncertain expert knowledge and reasoning.
BN consists of two parts: network structure and network parameters. The network structure of BN is a Directed Acyclic Graph (DAG). Each node in the DAG represents a variable in a specific domain. The directed arc between nodes represents the dependency relationship among nodes, which is the qualitative characterization of the relationship between nodes. Each node has a conditional probability distribution function associated with it (the node without a parent node is represented as a prior distribution function), namely the network parameter, which quantitatively describes the dependency relationship between the variable node and its parent node. If the variable is discrete, the network parameters are represented as conditional probability tables of this node for a given parent node. In BN, there is no specific input node or output node, and any node can be used as an input node or output node.
Definition: a directed acyclic graph that meets the following four conditions is called the Bayesian Network (27):
(1) There is a set of variables V = {Xi}, i = 1,2,⋯,n, and there is the set of directed edges between the corresponding nodes of variables E;
(2) The value of each variable can be either discrete or continuous;
(3) A directed acyclic graph G = < V,E > is formed by the nodes corresponding to variables and the directed edges between nodes, where V is the node-set, and E is the directed edge set, reflecting the causal dependence between nodes;
(4) A conditional probability distribution table P(Xi|Pa(Xi)) is corresponding to each node X_i and its parent node set Pa(Xi), and it satisfies .
The BN has been widely used in clinical diagnosis (28) and gene analysis (29). The main research content of the BN includes structure learning, parameter learning, and inference. Among them, structure learning is the basis of parameter learning and inference. BN structure learning refers to using the data sample set and combining the prior knowledge as much as possible to obtain the optimal topological structure. Learning BNs from data is a special case of ML. The approximate learning methods of learning BN structure from complete data include the conditional independence test-based method, the score search-based method, and the hybrid method (30). The method based on score search regards network structure learning as an optimization problem, and its goal is to search for the network structure with the highest score. With the increasing of the nodes number, the network structure space to be searched increases exponentially, which has been proved to be an NP-Hard problem (31). Heuristic search is usually used, which makes it easy to fall into an optimal local solution. This study proposed a new structural learning method based on the idea of divide and conquer.
The data of the enrolled patients were used to construct a simple BN, which assumed that the indicators used were independent of each other, as shown in Figure 2. The BN parameters were learned by the Bayesian estimation method with the clinical case dataset. The effects of combinations of single indicators on outcomes were analyzed, and the method gave the groups’ results and their probabilities. The probability of state-0 (optimal state) of the outcome node in the conditional probability table was ranked, and the combinations of values of the corresponding indicators with a probability greater than 0.9 were retained. Then, the influence of single indicator nodes would be calculated. To select the indicators and their grades:
(1) Sort each indicator by p values;
(2) Choose the grade of each indicator that accounted for the largest proportion of postoperative LOS-state-0 and TC-state-0, where LOS, where LOS and TC are the abbreviations of “length of stay” and “total cost,” respectively, and state-0 is the optimal state of corresponding indicators;
(3) Combined the indicators with specific grades starting from the one with the smallest P value until the last one;
(4) Perform a screening in the retained groups (probability > 0.9);
(5) Perform a statistical test and combine the selected indicators with statistical differences.
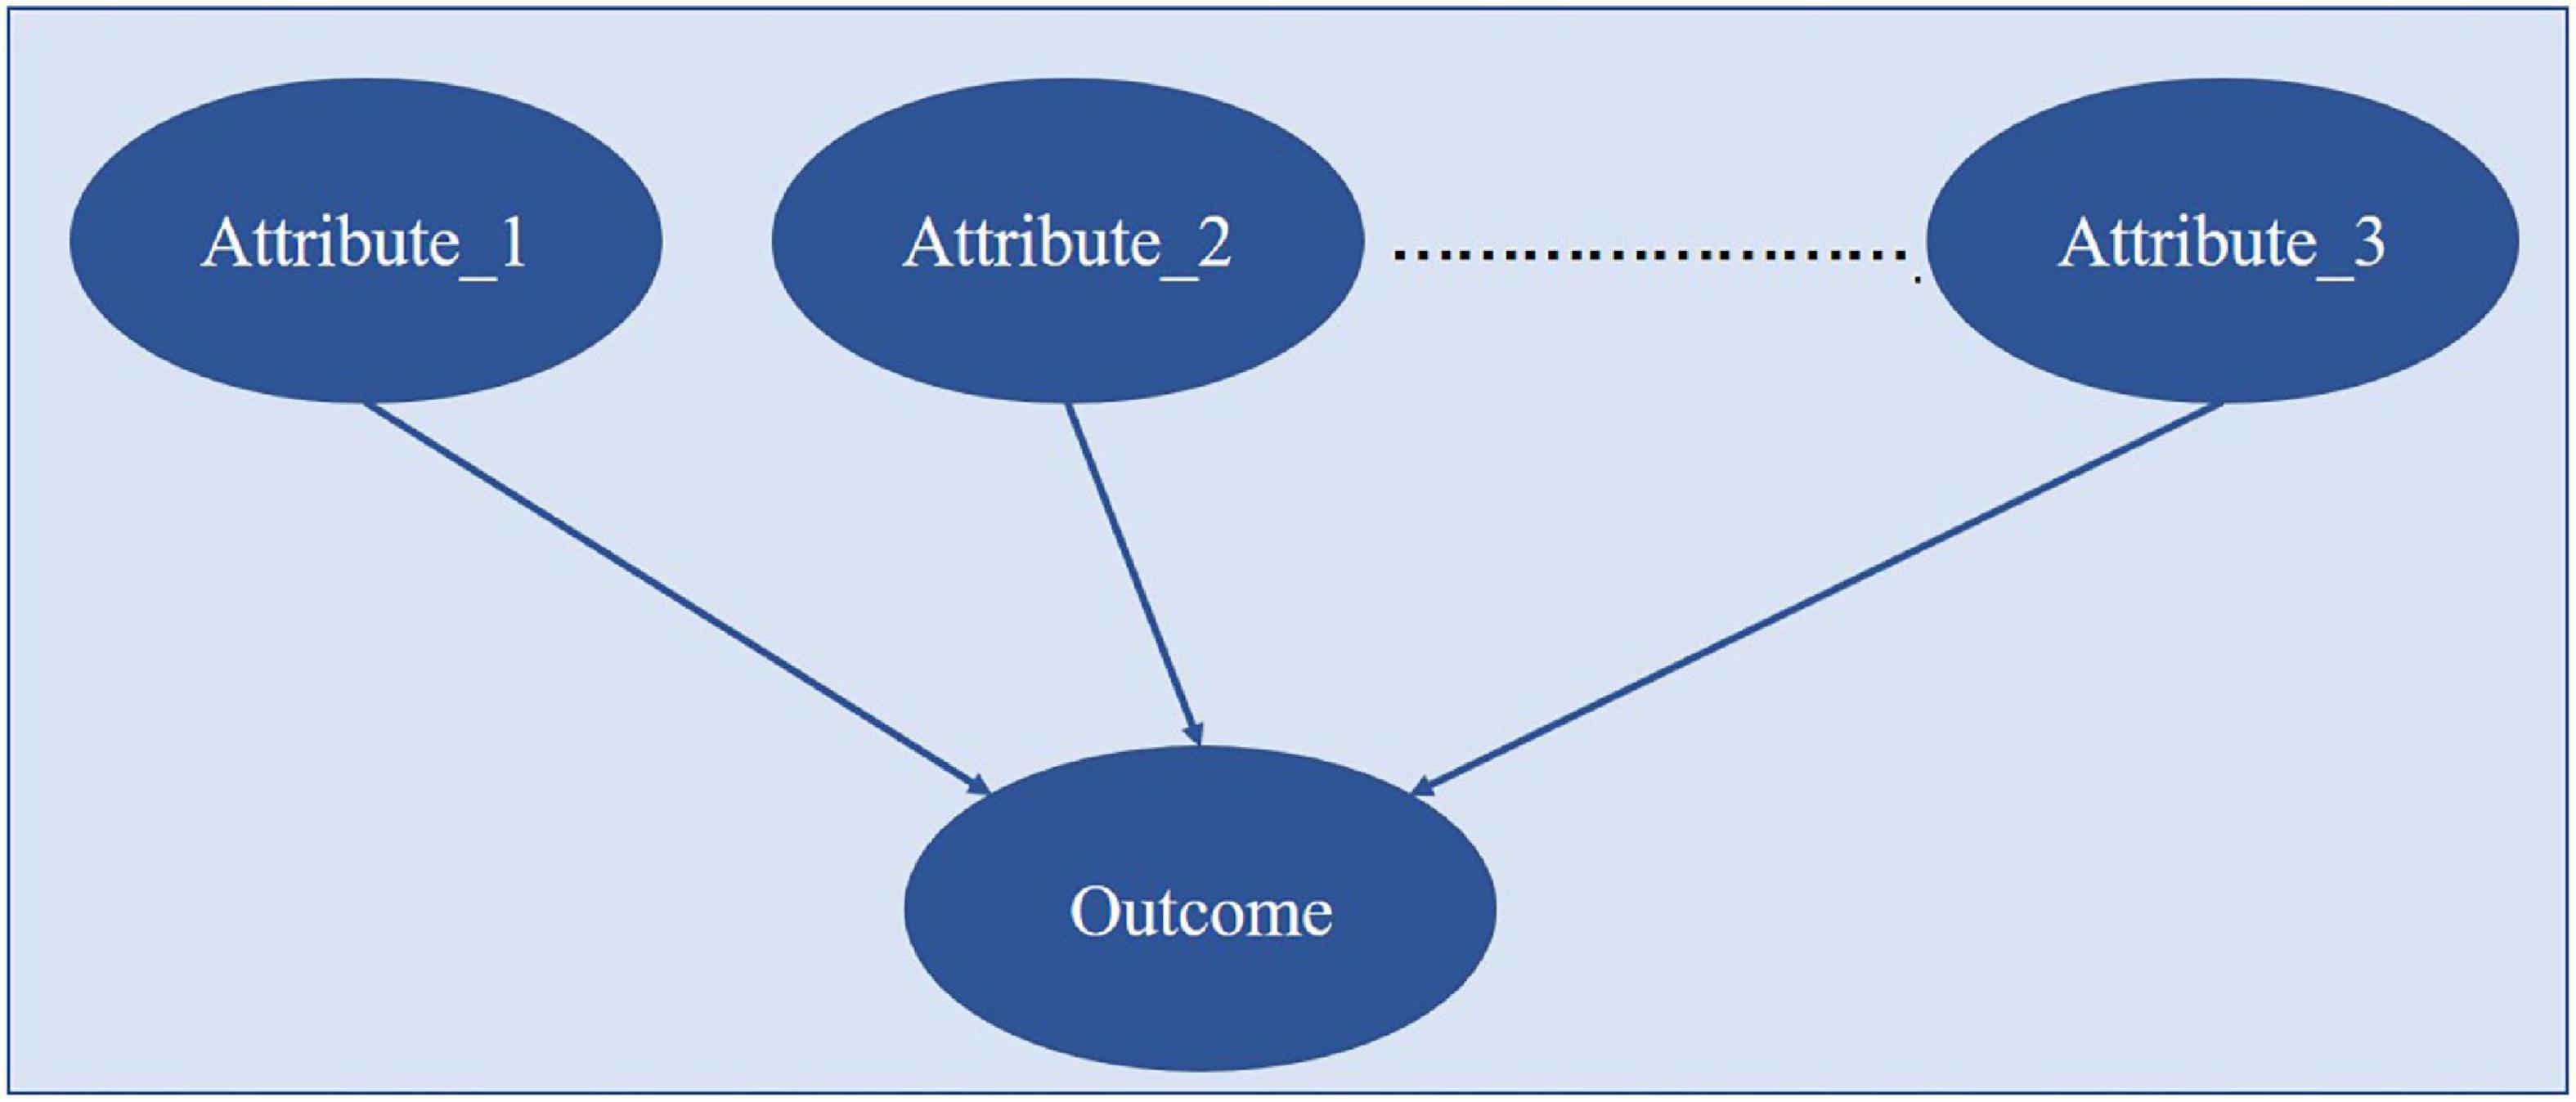
Figure 2. The analysis of indicator combination of BN structure.
Anesthesia Bayesian decision intervention model based on the LSHCT method
With the results of indicator selection, we combined an improved BN structure learning method based on Strongly Connected Components (SCC) Local Structure determination by Hill Climbing Twice (LSHCT) and expert knowledge to build a BN and optimized anesthesia decision-making in ERAS. This step used BN to analyze the relationship between the selected indicators. First, the BN structure is automatically learned from clinical data by LSHCT and then adjusted reasonably based on experts’ experience.
In BN, each node represents a random variable or data indicator. In this paper, with a divide-and-conquer strategy, we proposed a novel BN structure learning method by LSHCT. This is a score-based search method, and its core idea is to split the overall construction of the BN structure into the sub-BNs construction, fusion, and revision, as shown in Figure 3.
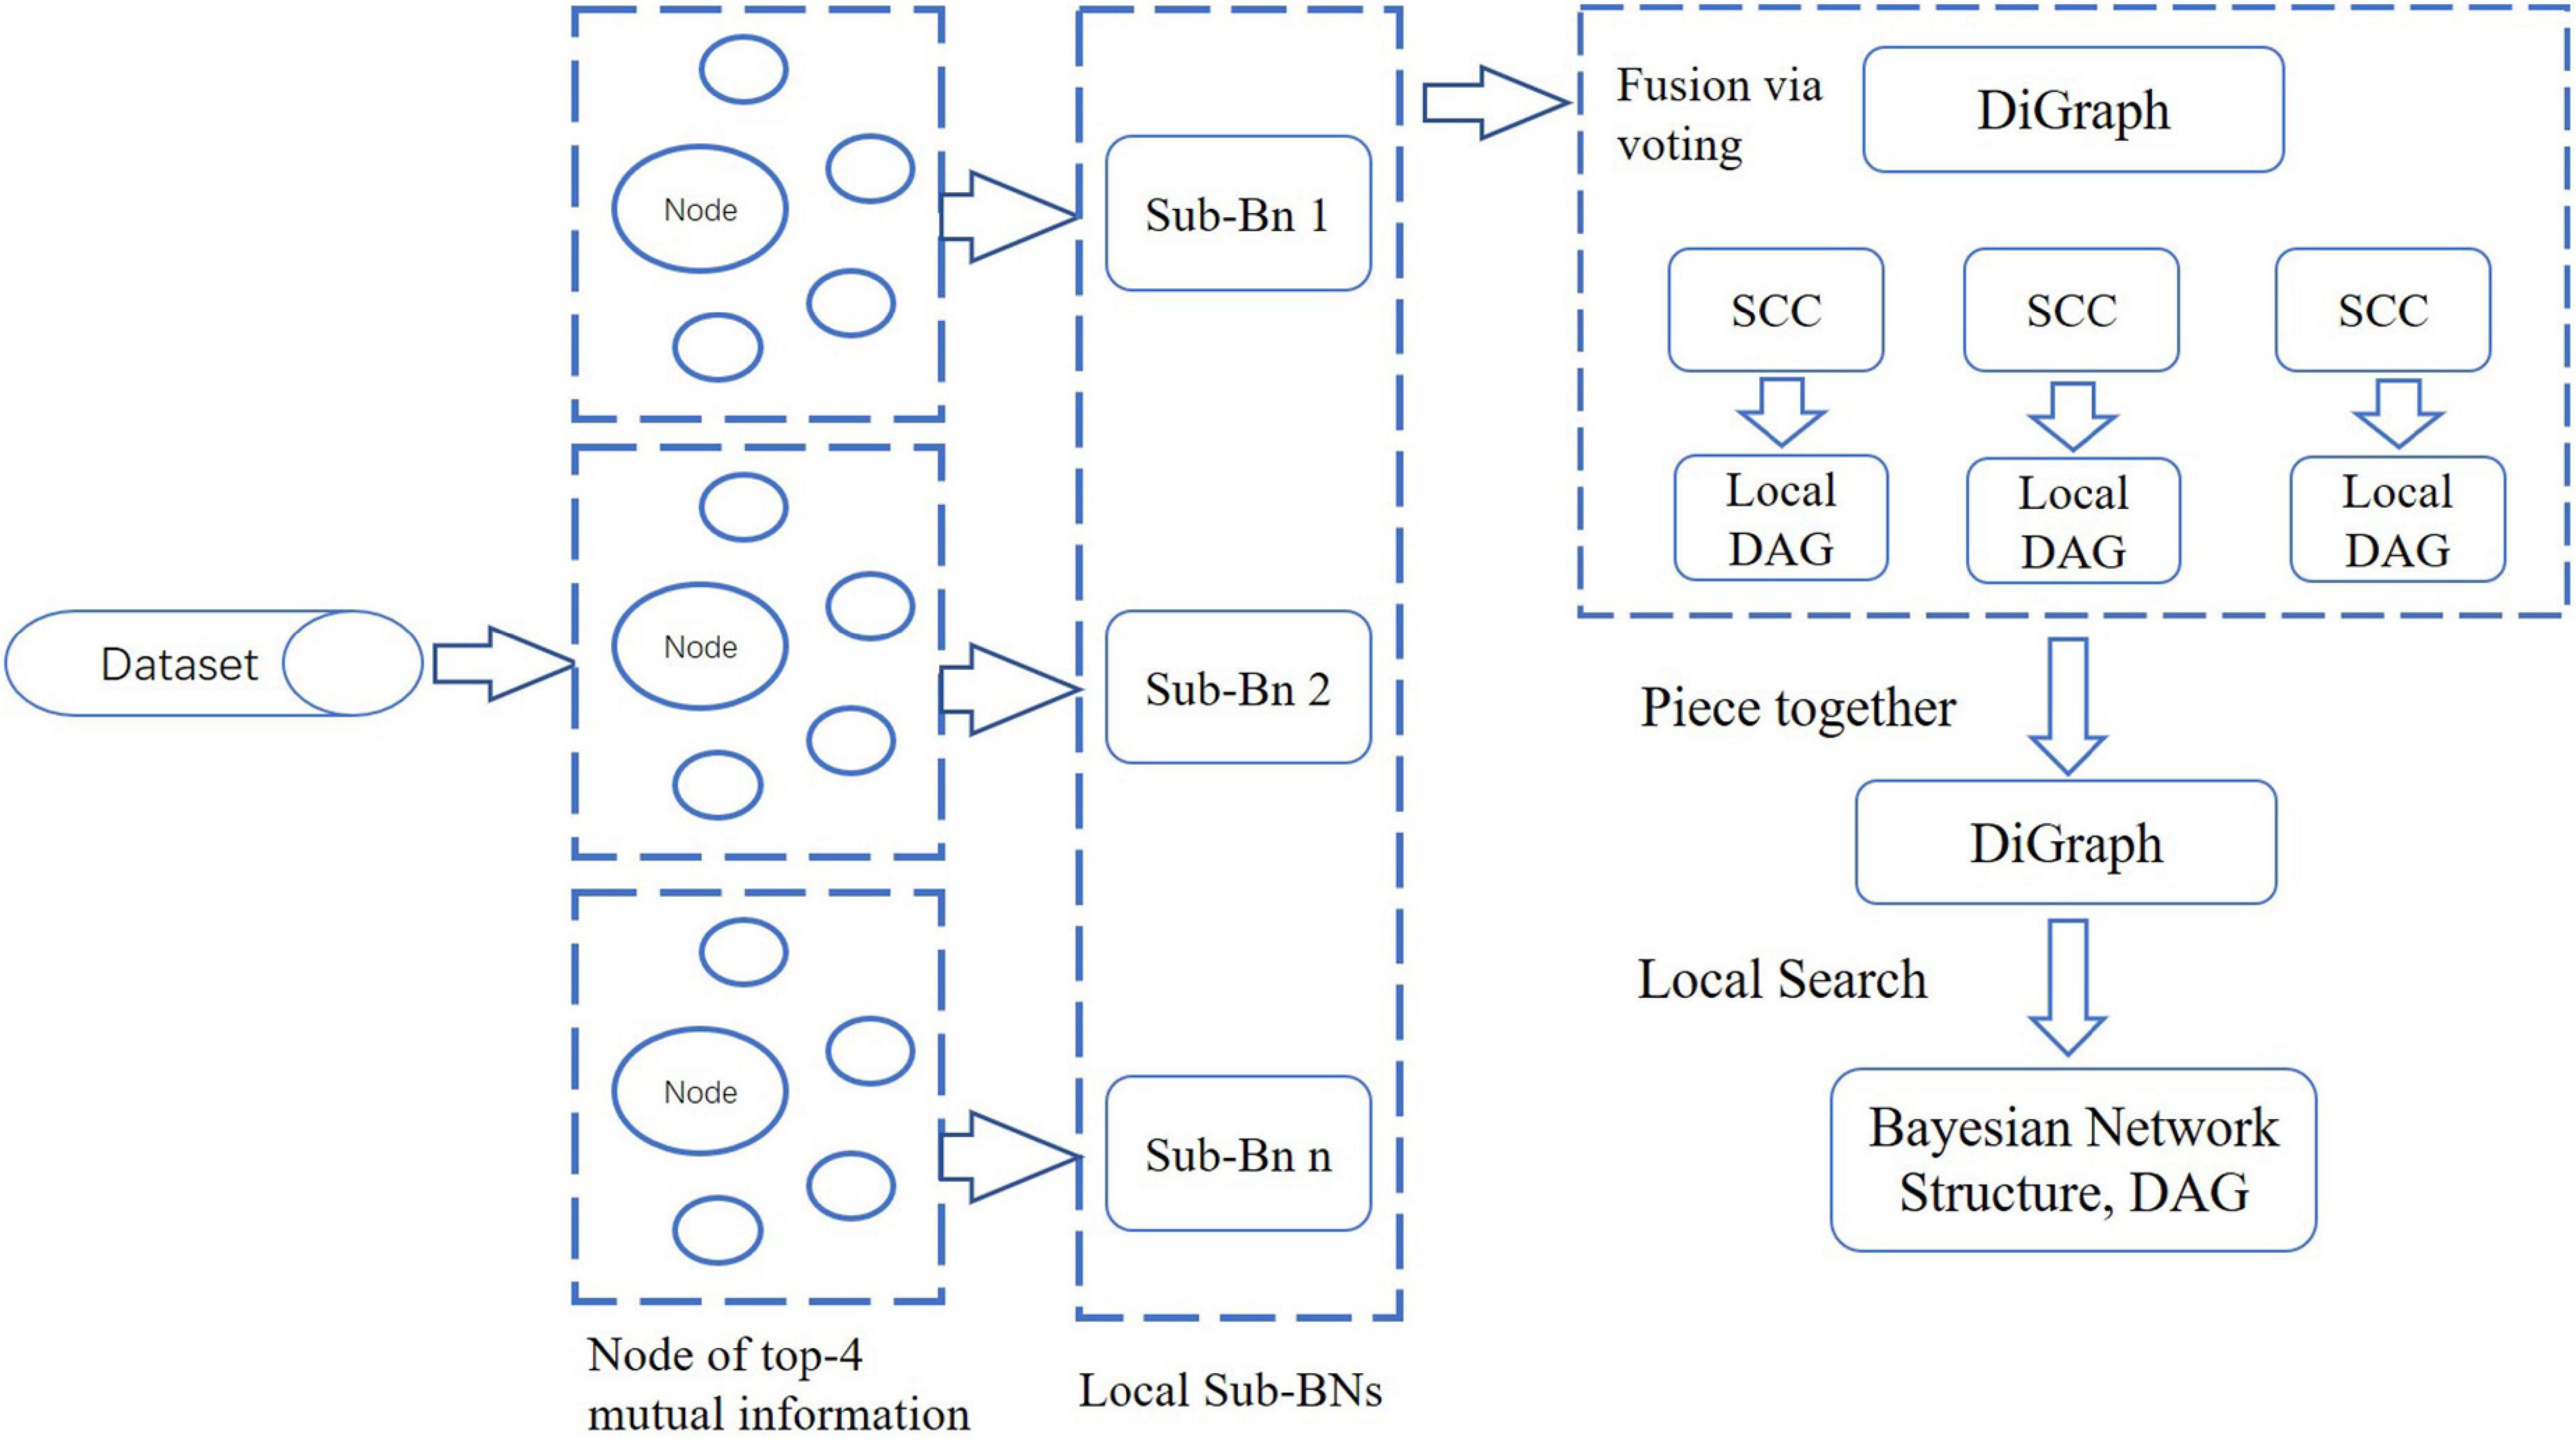
Figure 3. Flow diagram of the LSHCT method.
LSHCT consists of the following steps:
(1) Calculate the mutual information matrix between each pair of nodes, which is a symmetric matrix.
(2) For each node, select the four nodes with the most mutual information, and build a sub-BN for these five nodes.
(3) Piece together all the sub-BNs. The direction of the edge between a pair of nodes is determined by voting when both directions exist. And then, we obtained a directed graph which may not be a directed acyclic graph (DAG).
(4) Search all SCC in the directed graph obtained in the previous step.
(5) Convert each SCC into an undirected graph as the skeleton of the local structure. Determine the direction of the edges in the skeleton by the Hill Climbing (HC) algorithm twice. For the first time, the skeleton is used as the white list of the HC algorithm by converting each edge of the skeleton into two edges in opposite directions. For the second time, the result of our previous HC algorithm is used as the initial network structure.
(6) After determining the local structure of all SCC, it is already a DAG as a whole. Taking this as the initial network structure, we further use the local search method to obtain the network structure with a maximum score as the final result.
The Bayesian Network constructed by the LSHCT method was adopted to analyze the association relationship between selected indicators. The process consists of the following steps:
Step 1: According to the above methods, select indicator sets based on p values for different outcomes.
Step 2: The corresponding data sets were constructed by integrating indicators and outcomes according to different outcomes (postoperative hospitalization duration/total cost).
Step 3: Data preprocessing (same as the first use of the BN). As all the indexes were nominal, there was no need to preprocess the data for each indicator. The outcomes are of numerical type, which we assigned to two categories based on the mean value. One feature of Bayesian networks is that they allow the presence of missing values, so we retain the missing values in the dataset.
Step 4: Learn the BN structure by the LSHCT method, and output the graph of the BN structure, namely the dependency relationship between selected indicators.
Experiment and results
Dataset
This study conducted an experiment in three hospitals in China (Southwest Hospital of Third Military Medical University, Xuan Wu Hospital of Capital Medical University, and West China Hospital of Sichuan University). According to the regulation of the People’s Republic of China on the administration of human genetic resources, the collection of raw data was subject to approval by the science and technology administrative department of the state council (AQ: 2020SQCJ7444). Ethical approval was obtained, and the informed consent requirement was waived (Certification Number: KY201936, certification number: 2019-132, and certification number: 2021-349, respectively). The registration has been completed on the website of the China Clinical Trial Registry Center (ChiCTR1900023927).
Inclusion and exclusion criteria
Inclusion criteria were as follows: (1) age: 18–80 years old; (2) Patients who underwent laparoscopic myomectomy and bilateral uterine adnexectomy and were diagnosed as benign gynecological tumors; (3) general anesthesia (without compound another anesthesia method). Moreover, the exclusion criteria were as follows: (1) patients with severe heart, lung, and kidney diseases before the operation, ASA grade ≥ 4; (2) patients with systemic metastases of malignant tumors; patients undergoing extensive hysterectomy + omentum resection + pelvic lymph node dissection; (3) patients who were converted from laparoscopic to laparotomy during surgery; patients undergoing the surgery which involved greater than or equal to two surgical departments; (4) patients undergoing rescue measures for critical diseases such as cardiac arrest, liver failure, and anaphylactic shock during the operation; and (5) patients with a large amount of incomplete medical records.
Patients and data collection
A dataset (n = 49,768, surgical patients only) constructed from three hospitals was used to search for patients according to inclusion and exclusion criteria. Finally, we enrolled 1,827 patients. The detailed process of data collection is shown in Figure 4. The figure shows the protocol for constructing the dataset (n = 49,768) and outputting the patients (n = 4,269) with the inclusion criteria. Then, we excluded the patients (n = 2,442) according to the exclusion criteria. Finally, we got 1,827 patients.
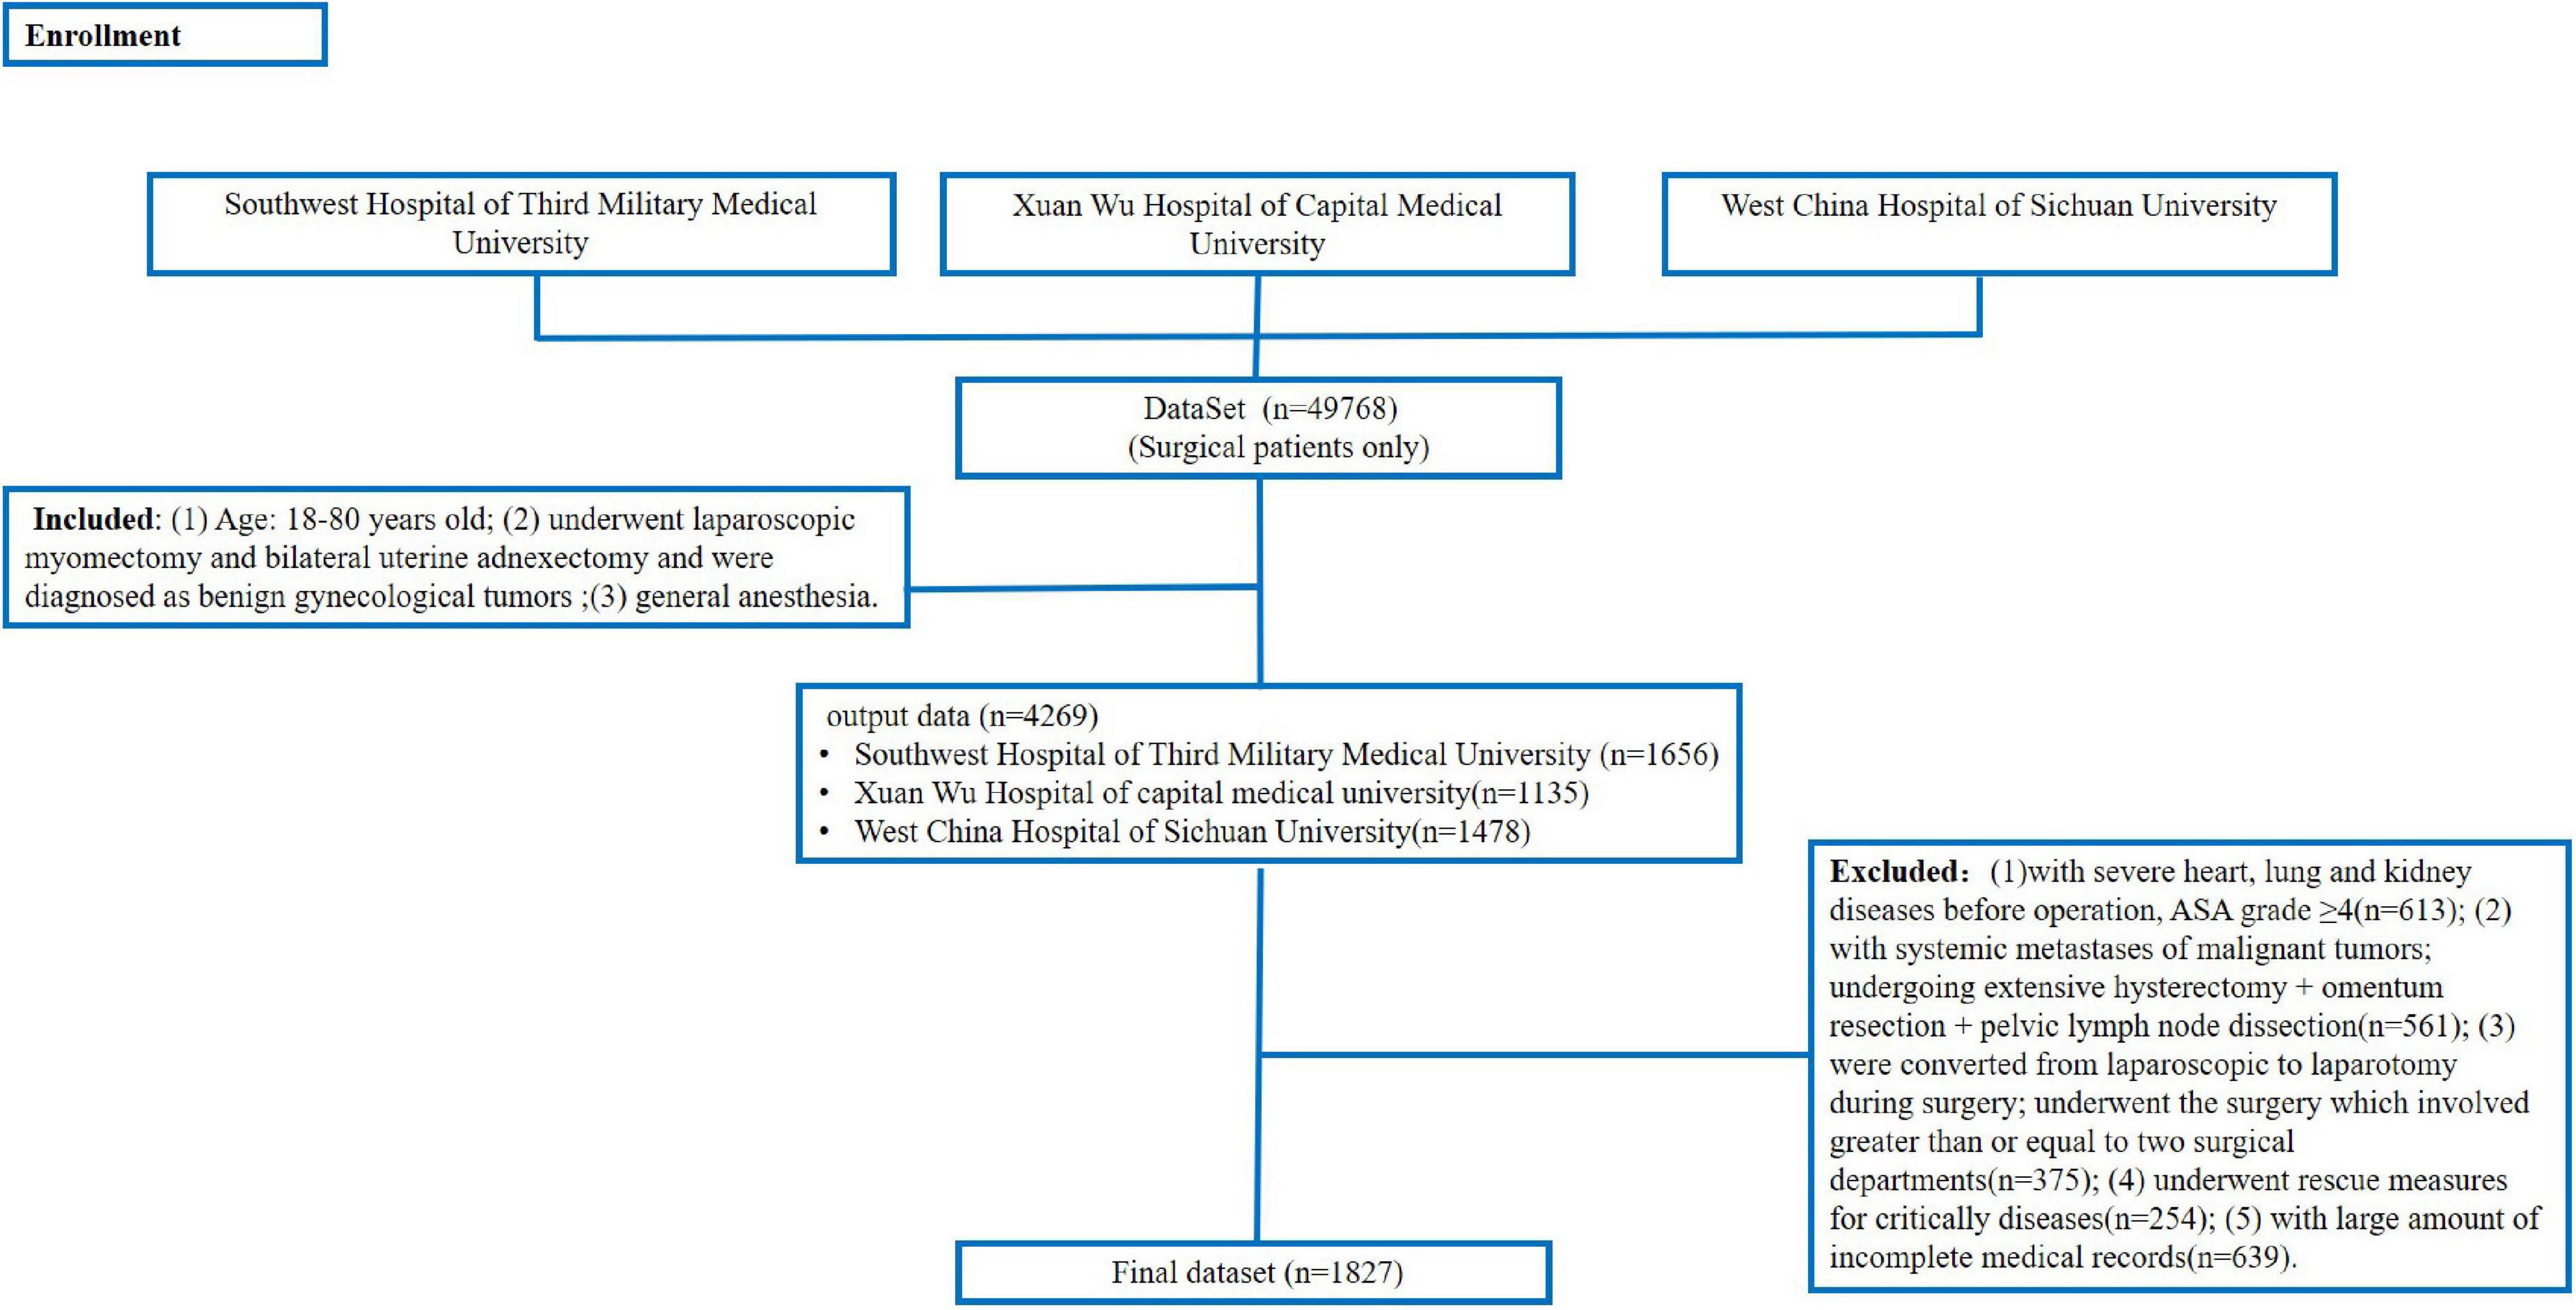
Figure 4. The process of enrollment.
The information about these patients included two parts: (1) general information and perioperative data of patients: patient’s ID number, medical record number, age, height, weight, and other information such as preoperative hemoglobin (Hb), preoperative systolic blood pressure (SBP), preoperative diastolic blood pressure (DBP), preoperative mean blood pressure (MBP), length of operation, intraoperative urine volume, intraoperative colloid volume, intraoperative crystalloid volume, intraoperative blood gas times, postoperative Hb; (2) indicators related to anesthesia. We initially sorted out more than 50 questions related to anesthetic decision-making, according to previous domestic and foreign literature reports combined with the clinical practice. Through the screening process by panels of anesthesiologists and gynecologists, we finally determined 18 indicators that obtained attention with more than 50%. The outcomes were decided as “postoperative length of stay (LOS)” and “total cost (TC).” The meaning and explanation of these indicators and outcomes are described in Table 1.
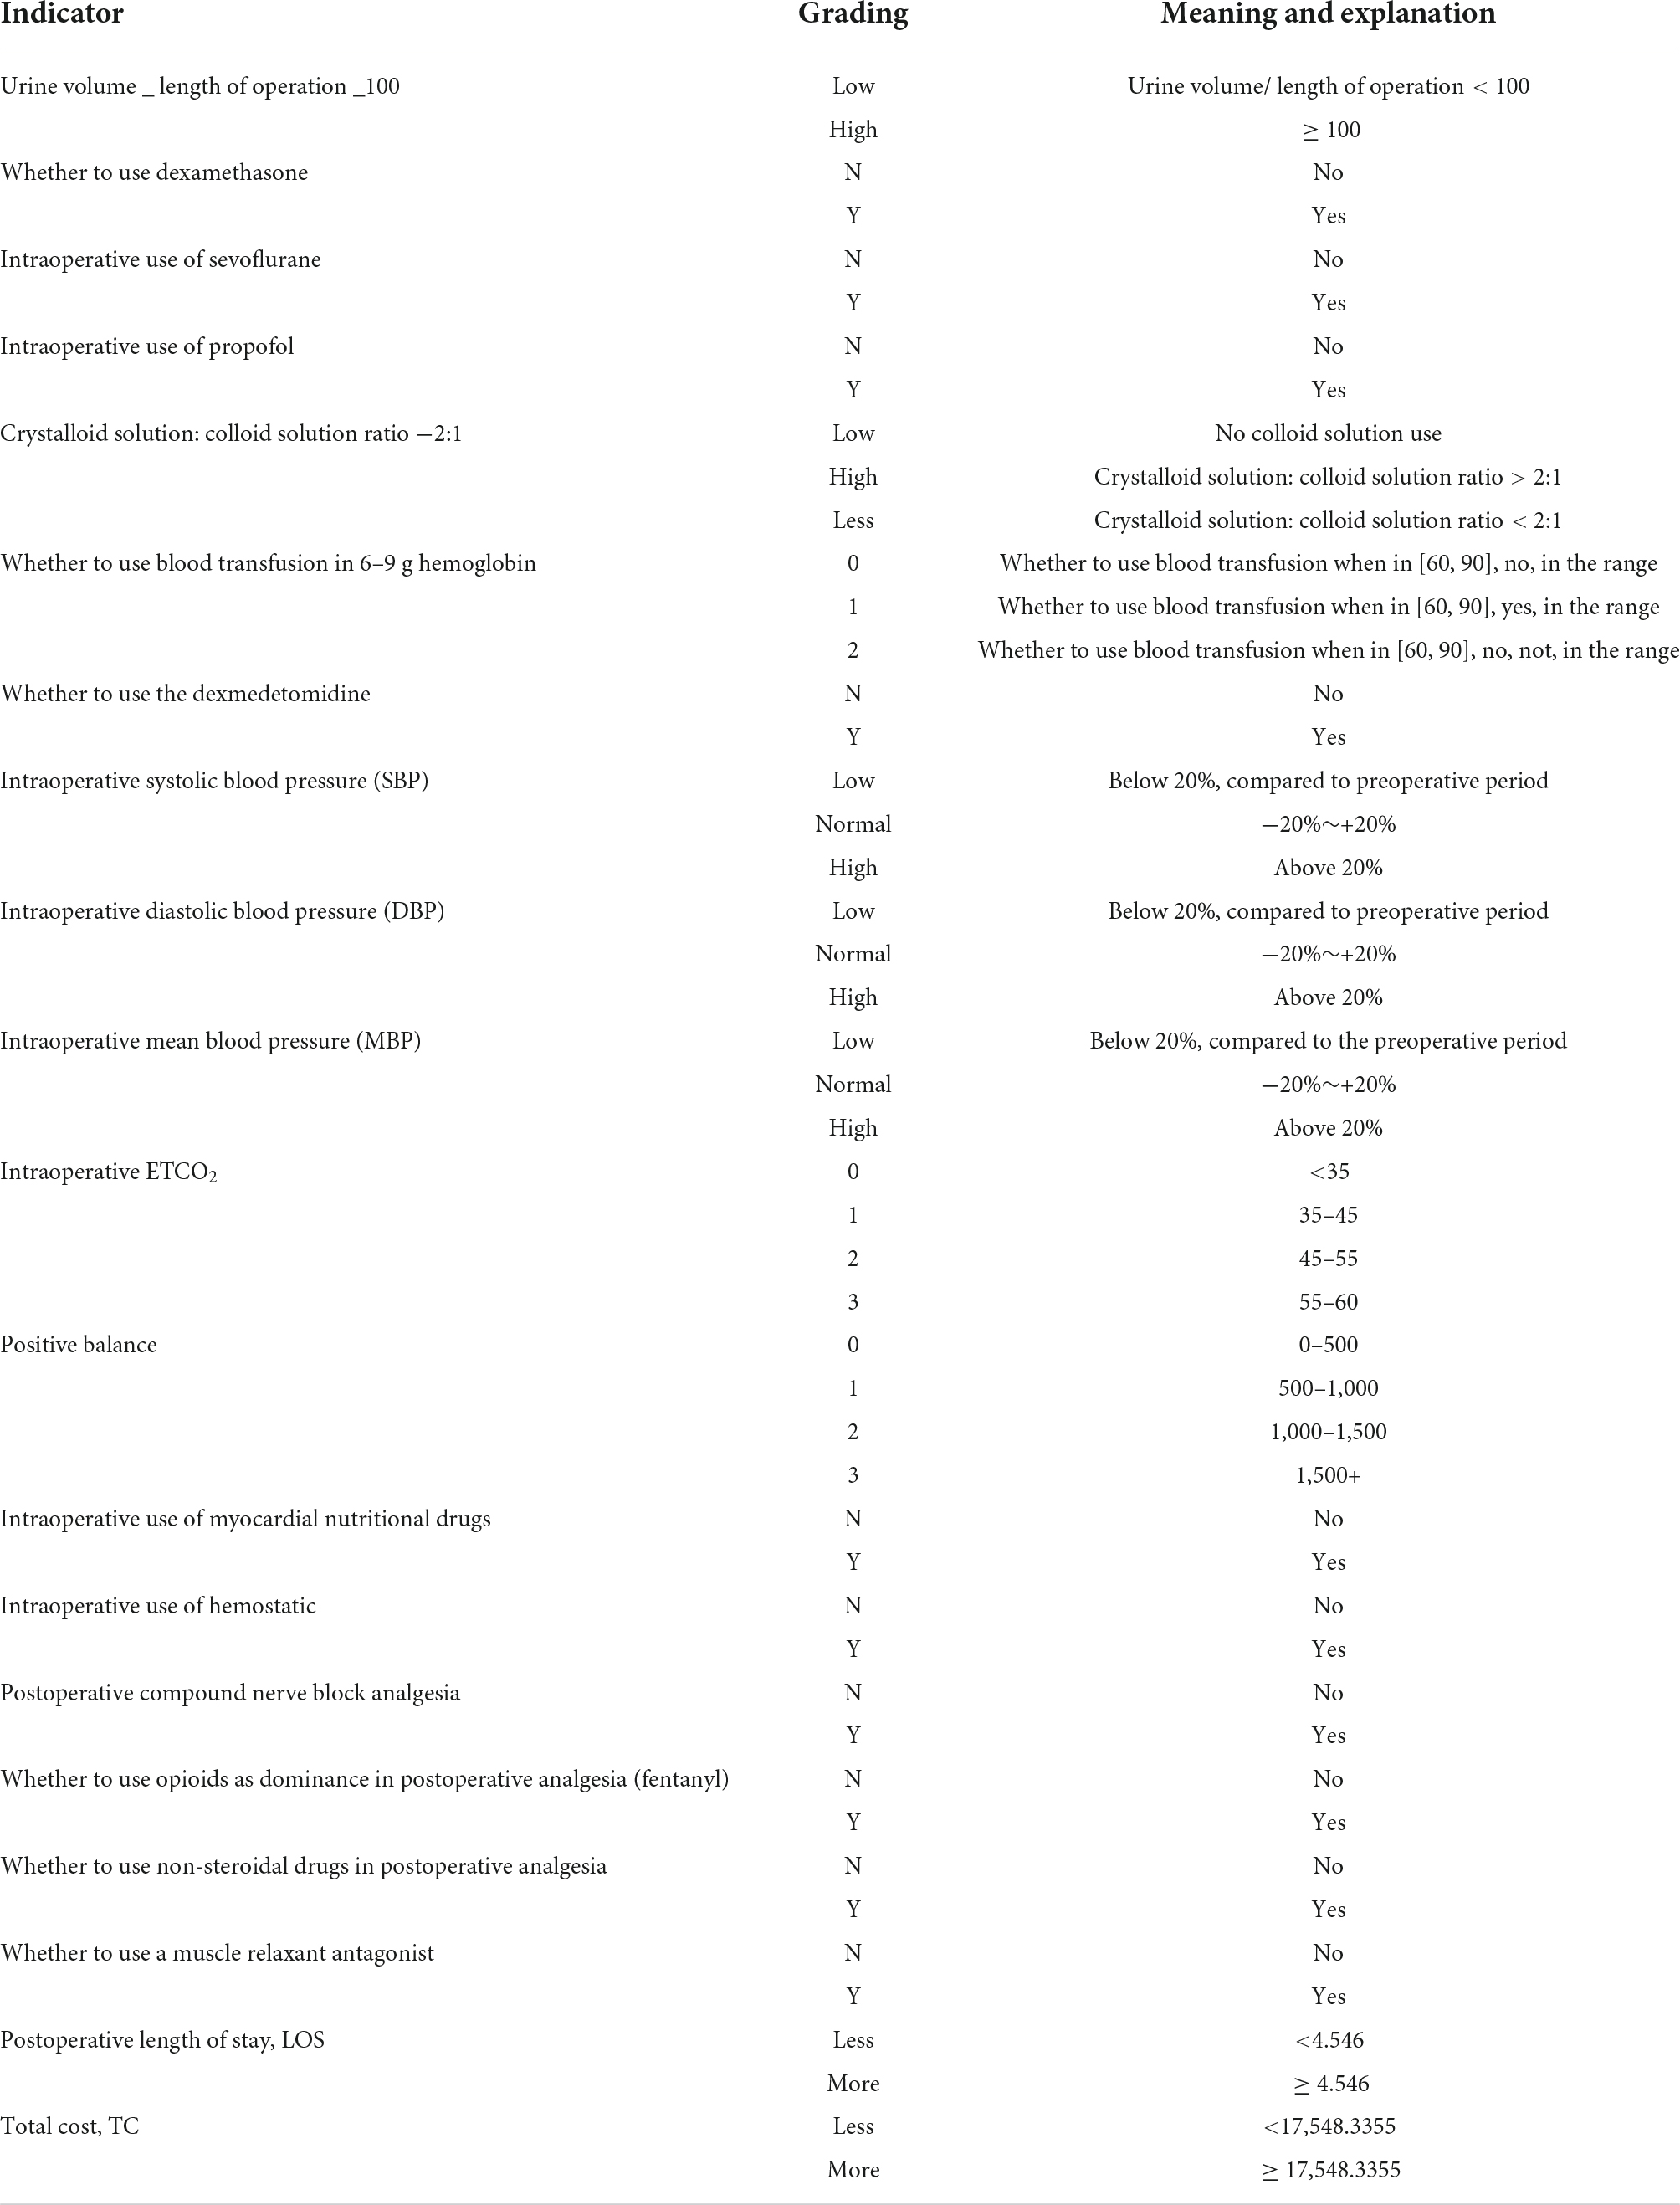
Table 1. The meaning and explanation of the value of each indicator.
Statistical analysis of key indicators of anesthesia decision-making
Measurement data were recorded as mean ± standard deviation or median (interquartile range). A T-test or Mann–Whitney U-test was used to analyze the differences between measurement data. The chi-square or Fisher’s exact test were used to analyze the differences between counting data. All the tests were two-sided, and P < 0.05 was considered statistically significant. SPSS25.0 statistical software was used for analysis.
Our study ultimately analyzed 1,827 patients and grouped them according to the outcomes: LOS-state 0 < 4.546 d, state 1 ≥ 4.546 d; TC-state-0 < 17,548.3355 Yuan, and state-1 ≥ 17,548.3355 Yuan. The probability that the LOS is less than 4.546 days was 62.56% (1,143/1,827), and the probability that the TC is less than 17,548.3355 Yuan was 54.02% (987/1,827).
For the general condition of the patients, most characteristics of the patients were statistically significant, except for the preoperative SBP, preoperative DBP, and preoperative MBP between LOS groups and the BMI, preoperative Hb, and preoperative DBP between TC groups, P > 0.05, as shown in Table 2.
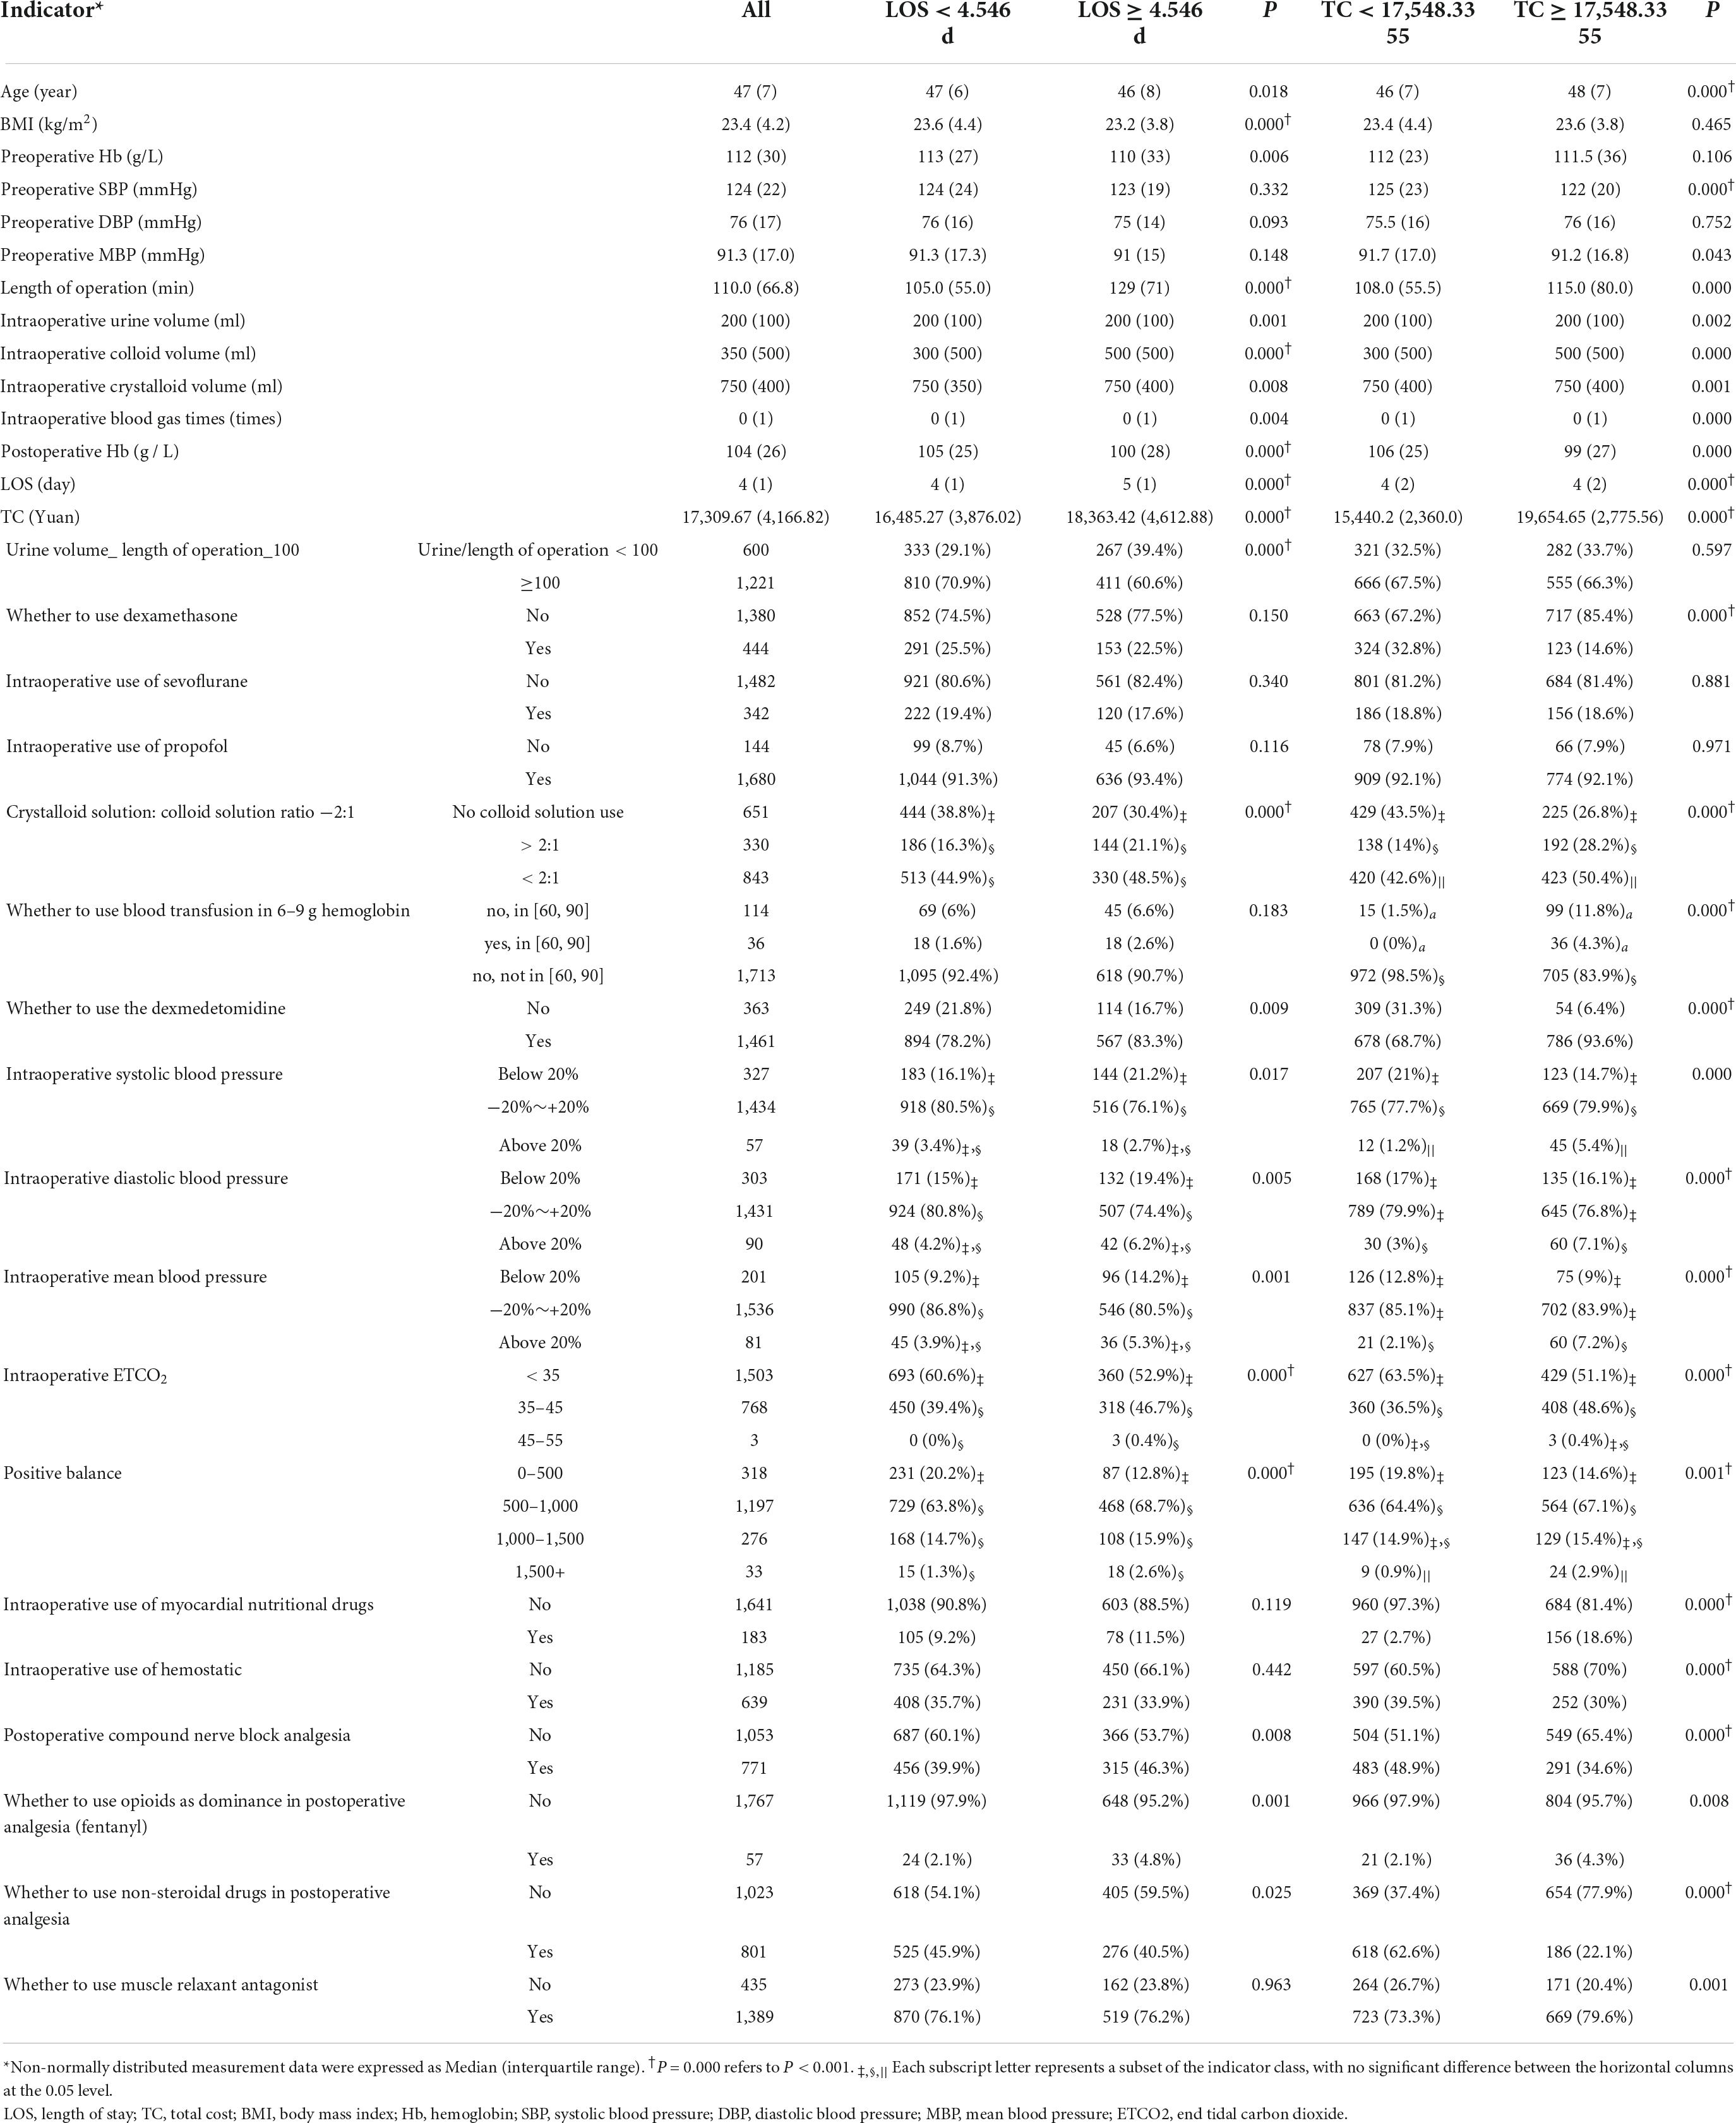
Table 2. The comparisons of the general conditions of patients and the indicators associated with anesthetic decision-making.
Among the 18 indicators associated with anesthesia decision-making, 11 indicators, including “urine volume_ length of operation_100,” “crystalloid solution: colloid solution ratio −2:1,” “whether to use dexmedetomidine,” “intraoperative SBP,” “intraoperative DBP,” “intraoperative MBP,” “intraoperative ETCO2,” “positive balance,” “postoperative compound nerve block analgesia,” “whether to use opioids as dominance in postoperative analgesia (fentanyl)” and “whether to use non-steroidal drugs in postoperative analgesia,” had significant differences between LOS groups, P < 0.05, as shown in Table 2. There were 15 indicators in TC groups that made a statistical difference, P < 0.05, as shown in Table 2.
Selection results of key indicators for anesthesia decision-making
There were 18 indicators in total. The BN shown in Figure 2 was used to learn model parameters based on the case dataset and then rank the indicator combinations by the state-0 (optimal state) probability of the resulting node according to the conditional probability table. We retained the combinations with a probability value > 0.9. There were 957 combinations in LOS-state-0 and 558 combinations in LOS-state 1. There were 840 combinations in state-0 and 681 groups in state-1 (sub-optimal state) for the TC group. We conducted a single indicator analysis of these groups, as shown in Tables 3, 4.
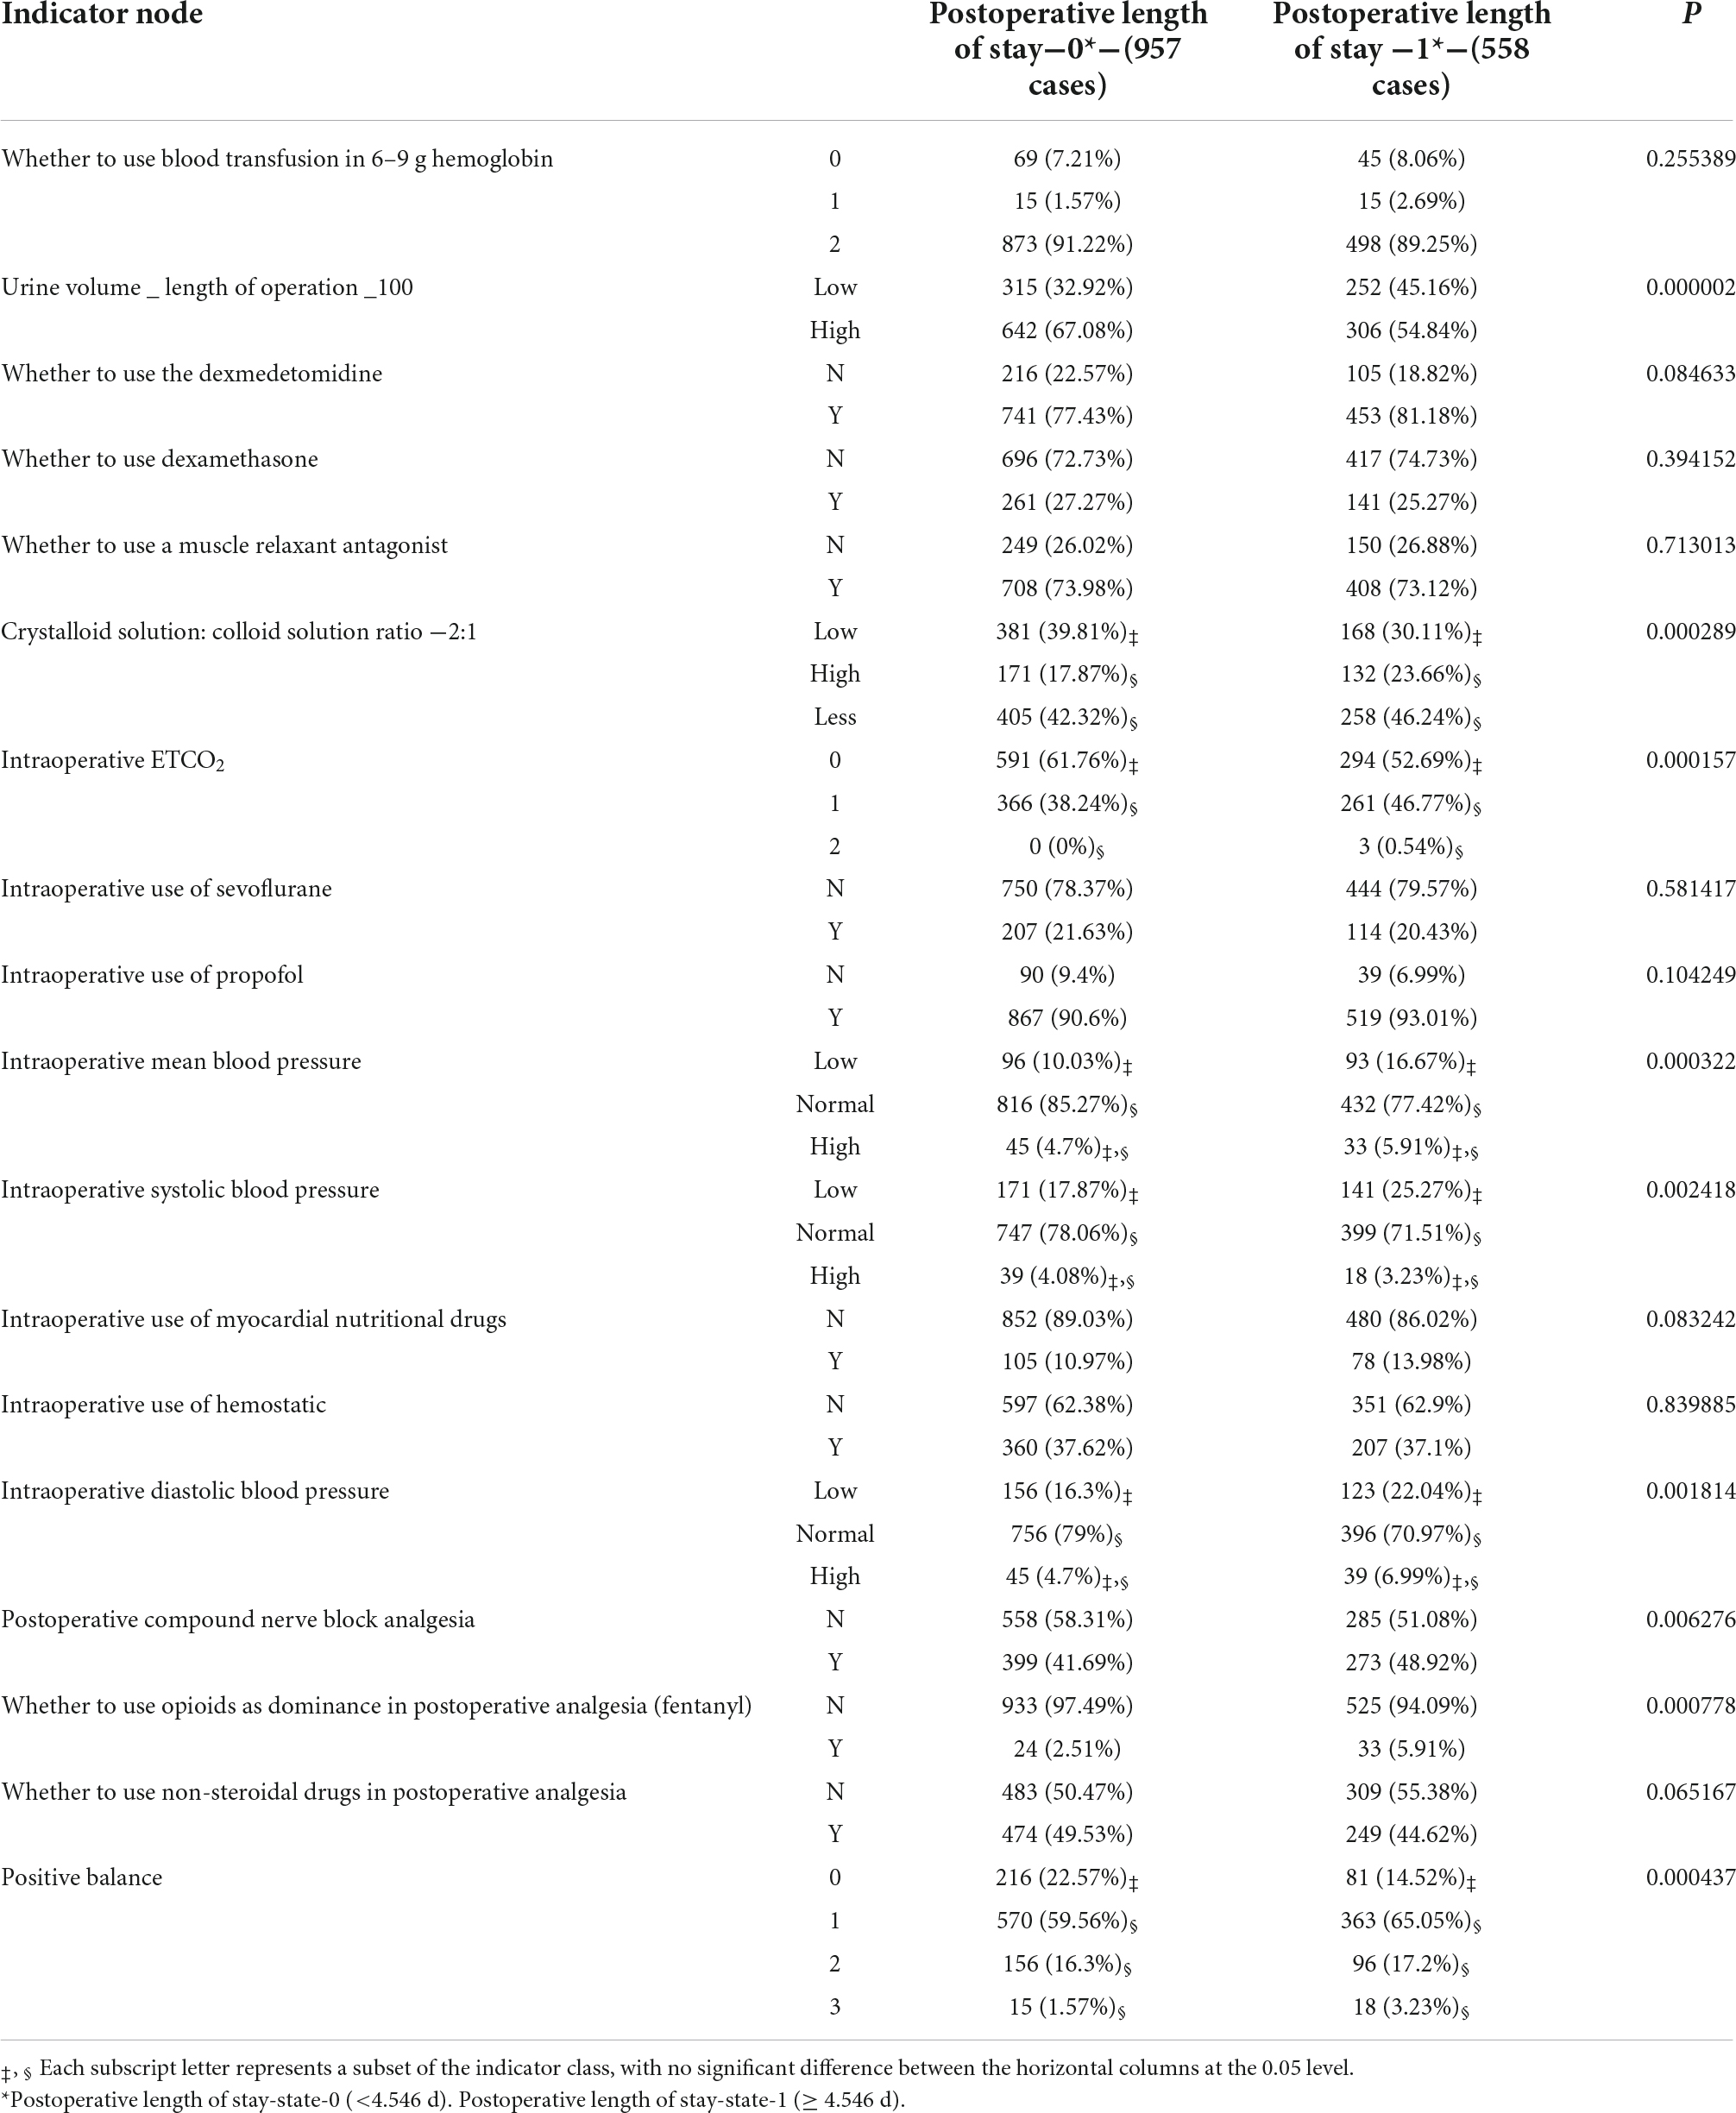
Table 3. The influence of Bayesian indicator nodes for the postoperative length of stay.
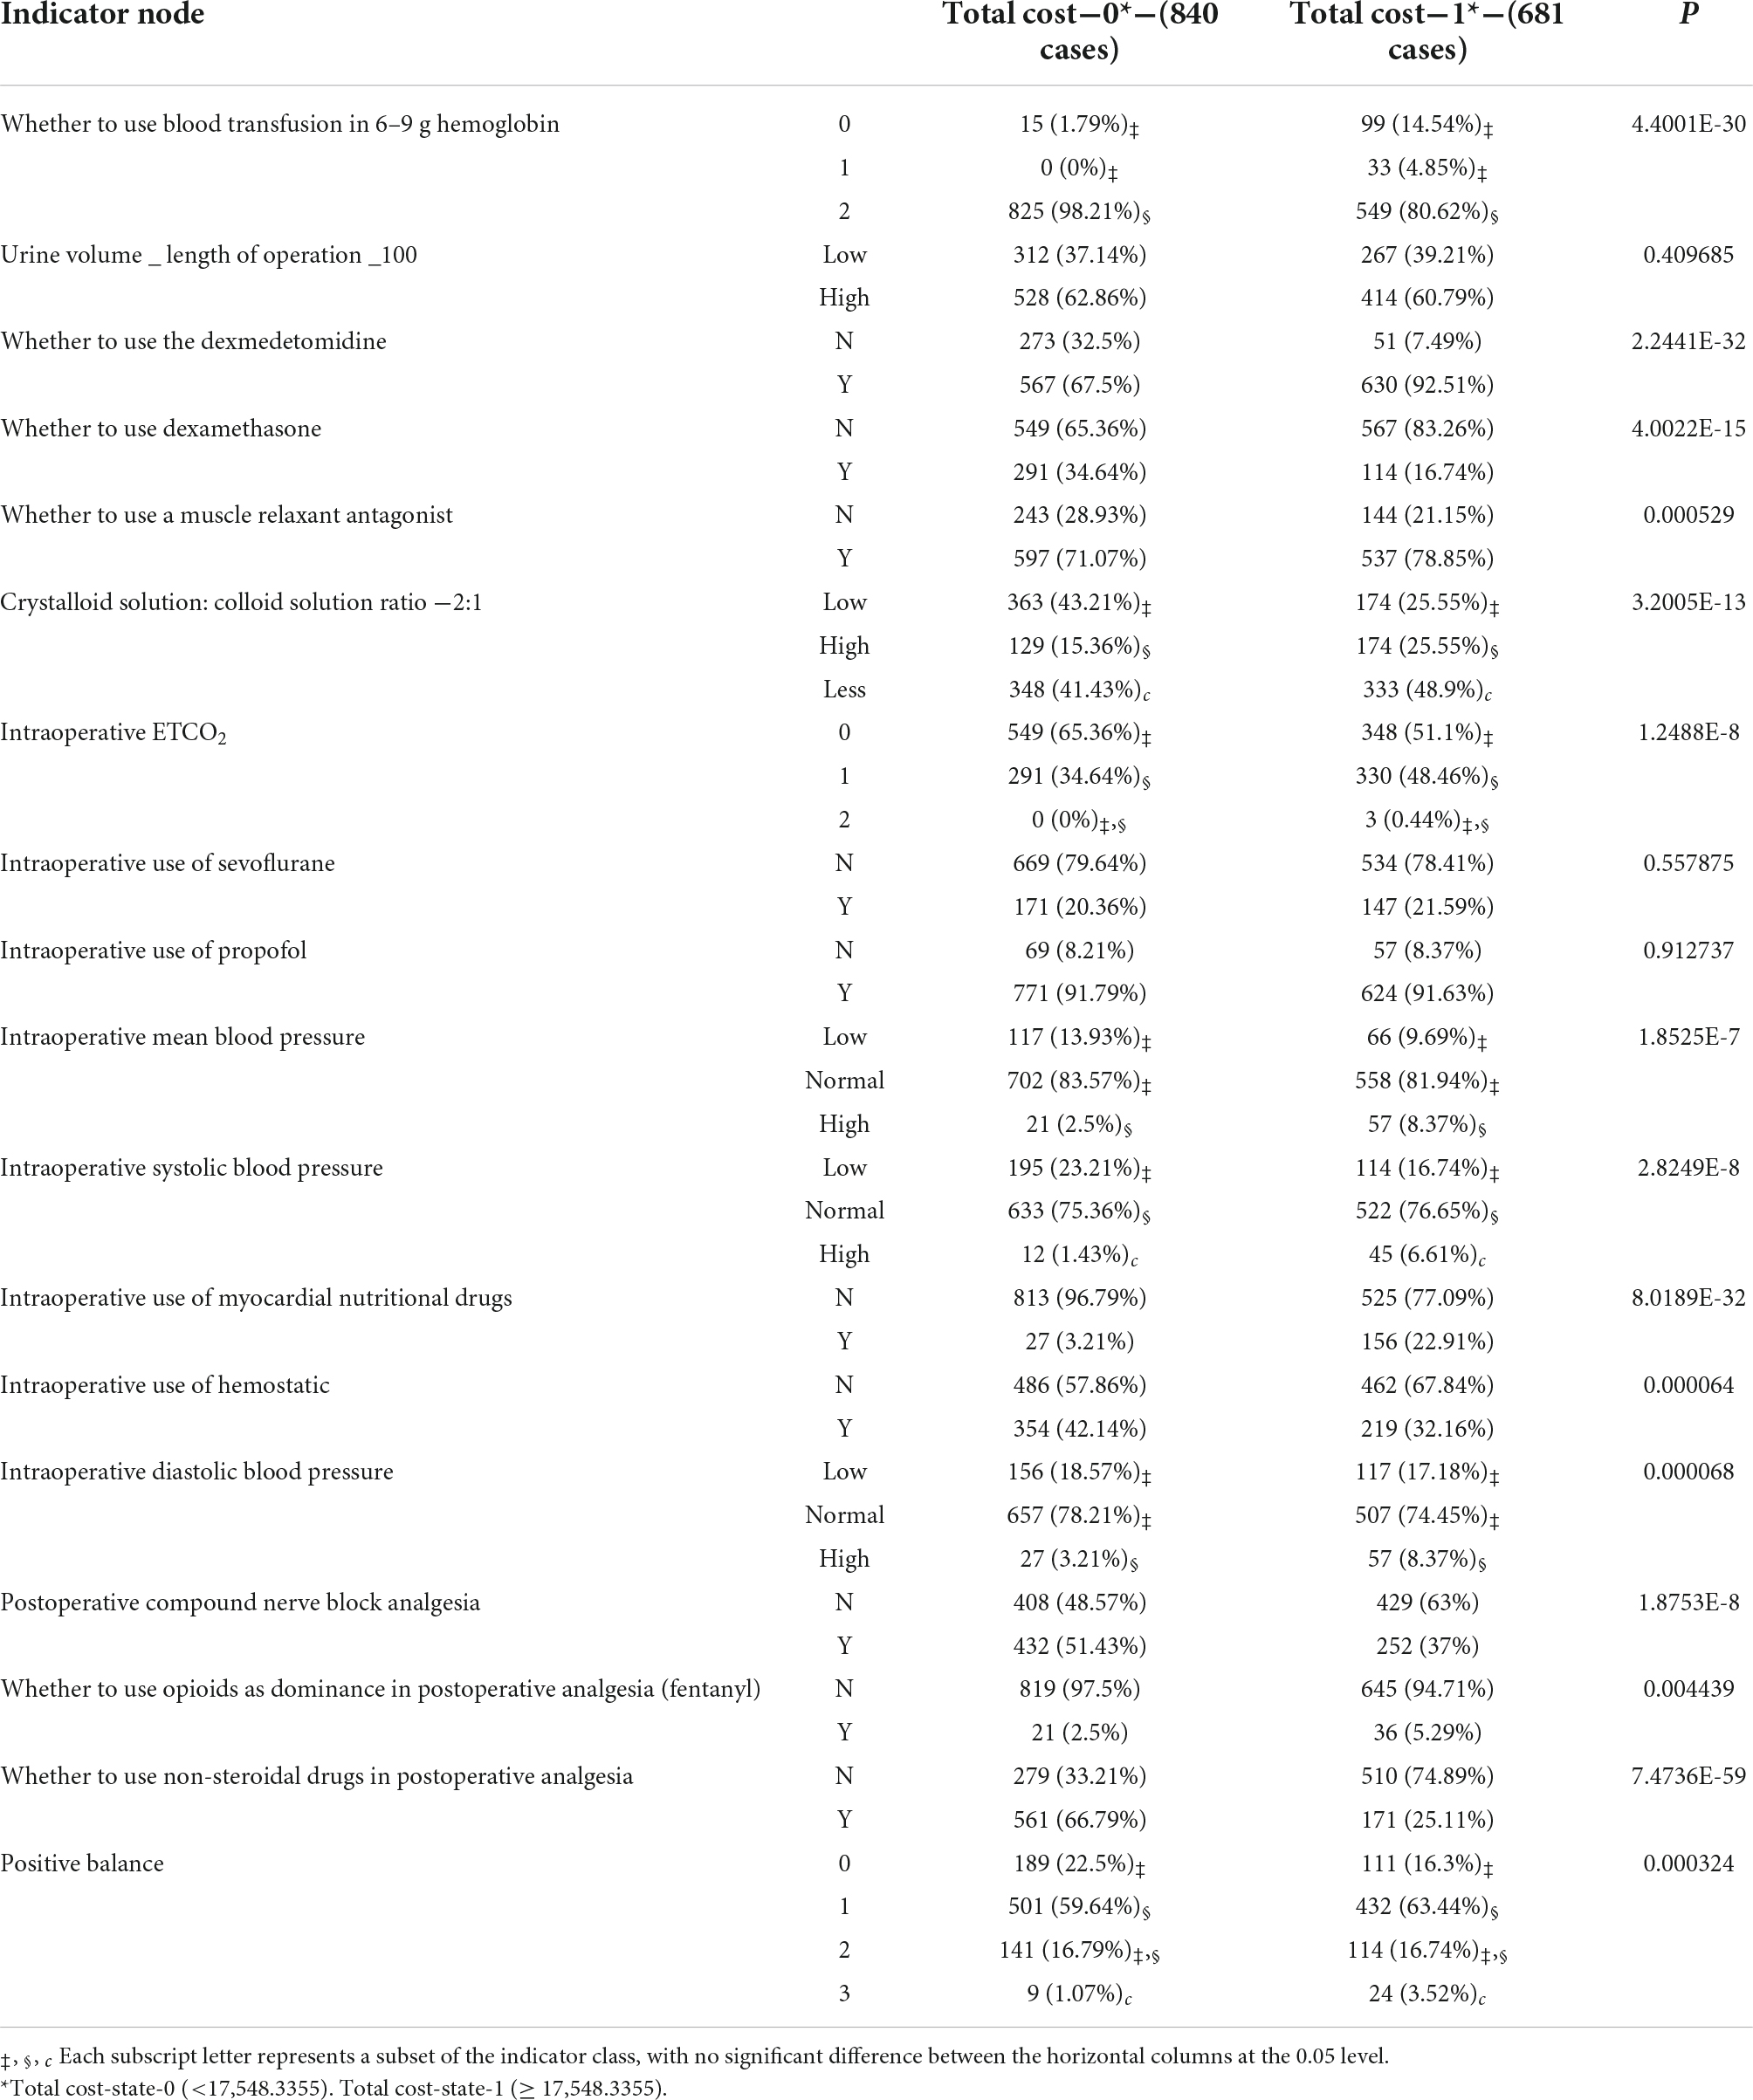
Table 4. The influence of Bayesian indicator nodes on the total cost.
According to the combination of indicators, we got the following results: (1) for LOS group: “urine volume_length of operation _100-High,” “intraoperative ETCO2-0,” “crystalloid solution: colloid solution ratio −2:1-Less,” “intraoperative MBP-Normal,” “positive balance-1,” “whether to use opioids as dominance in postoperative analgesia (fentanyl)-N,” “intraoperative DBP-Normal,” “intraoperative SBP-Normal,” “postoperative compound nerve block analgesia-N,” P < 0.05 (see Table 5); (2) for TC group: “whether to use non-steroidal drugs in postoperative analgesia-Y,” “whether to use the dexmedetomidine-Y,” “intraoperative use of myocardial nutritional drugs-N,” “whether to use blood transfusion in 6–9 g hemoglobin-2,” “whether to use dexamethasone-N,” “crystalloid solution: colloid solution ratio −2:1-Low,” “intraoperative ETCO2-0,” “postoperative compound nerve block analgesia-Y,” “intraoperative SBP-Normal,” “intraoperative MBP-Normal,” “intraoperative use of hemostatic-N,” “intraoperative DBP-Normal,” P < 0.05 (see Table 5).
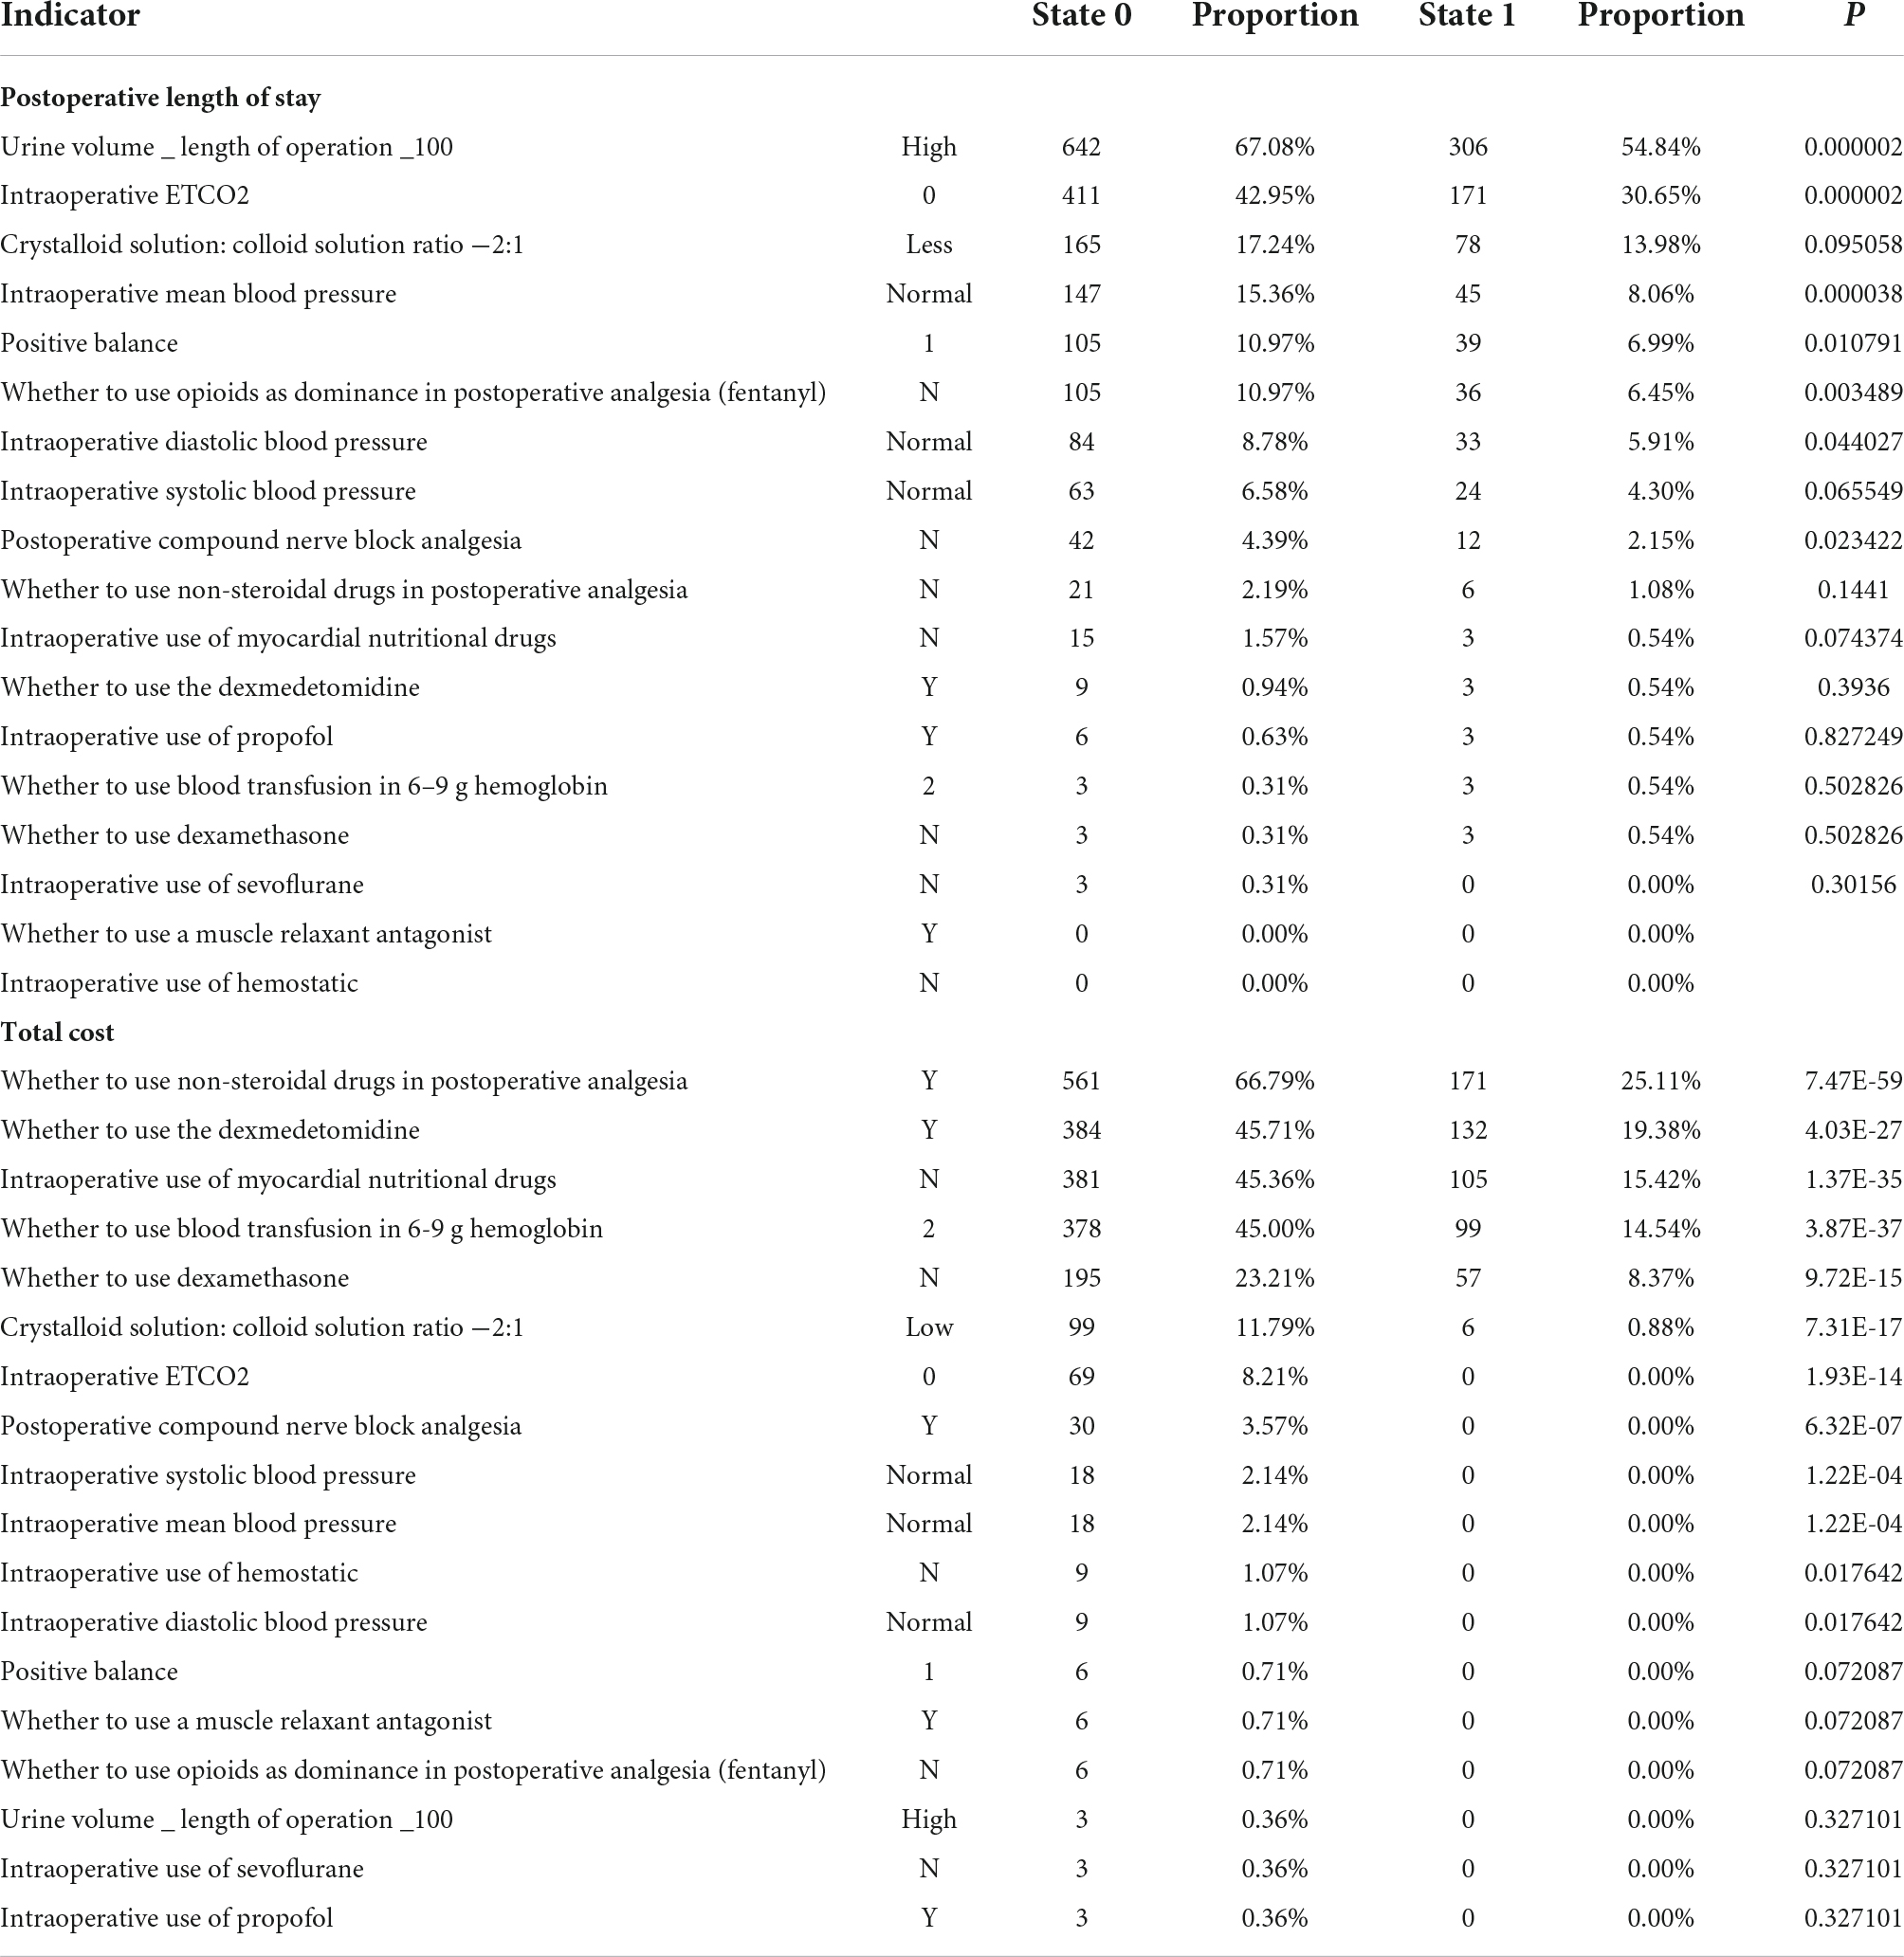
Table 5. The influence of the combination of multiple indicators for the postoperative length of stay and total cost.
Anesthesia Bayesian decision intervention model results for length of stay and total cost
Based on the anesthesia Bayesian decision intervention model, we constructed the DAG decision structure for gynecological tumor diseases. We would manually make some adjustments according to the actual clinical significance. For LOS (length of stay), we got the following indicators: “positive balance,” “intraoperative ETCO2,” “whether to use opioids as dominance in postoperative analgesia (fentanyl),” “crystalloid solution: colloid solution ratio −2:1,” “urine volume _ length of operation _100” and “postoperative compound nerve block analgesia.” For TC (total cost), the results of the indicators are as follows: “intraoperative mean blood pressure,” “intraoperative systolic blood pressure,” “whether to use dexamethasone,” “whether to use non-steroidal drugs in postoperative analgesia,” “whether to use blood transfusion in 6–9 g hemoglobin,” “whether to use dexmedetomidine,” “postoperative compound nerve block analgesia,” “intraoperative use of myocardial nutritional drugs,” and “crystalloid solution: colloid solution ratio −2:1.”
The relationships of the selected indicators are shown in Figure 5. As shown in Figure 5A, it included six indicators for the outcome, including postoperative length of stay. As shown in Figure 5B, the total cost included nine indicators for the outcome, total cost. The directed arc between nodes represented the dependency relationship among nodes.
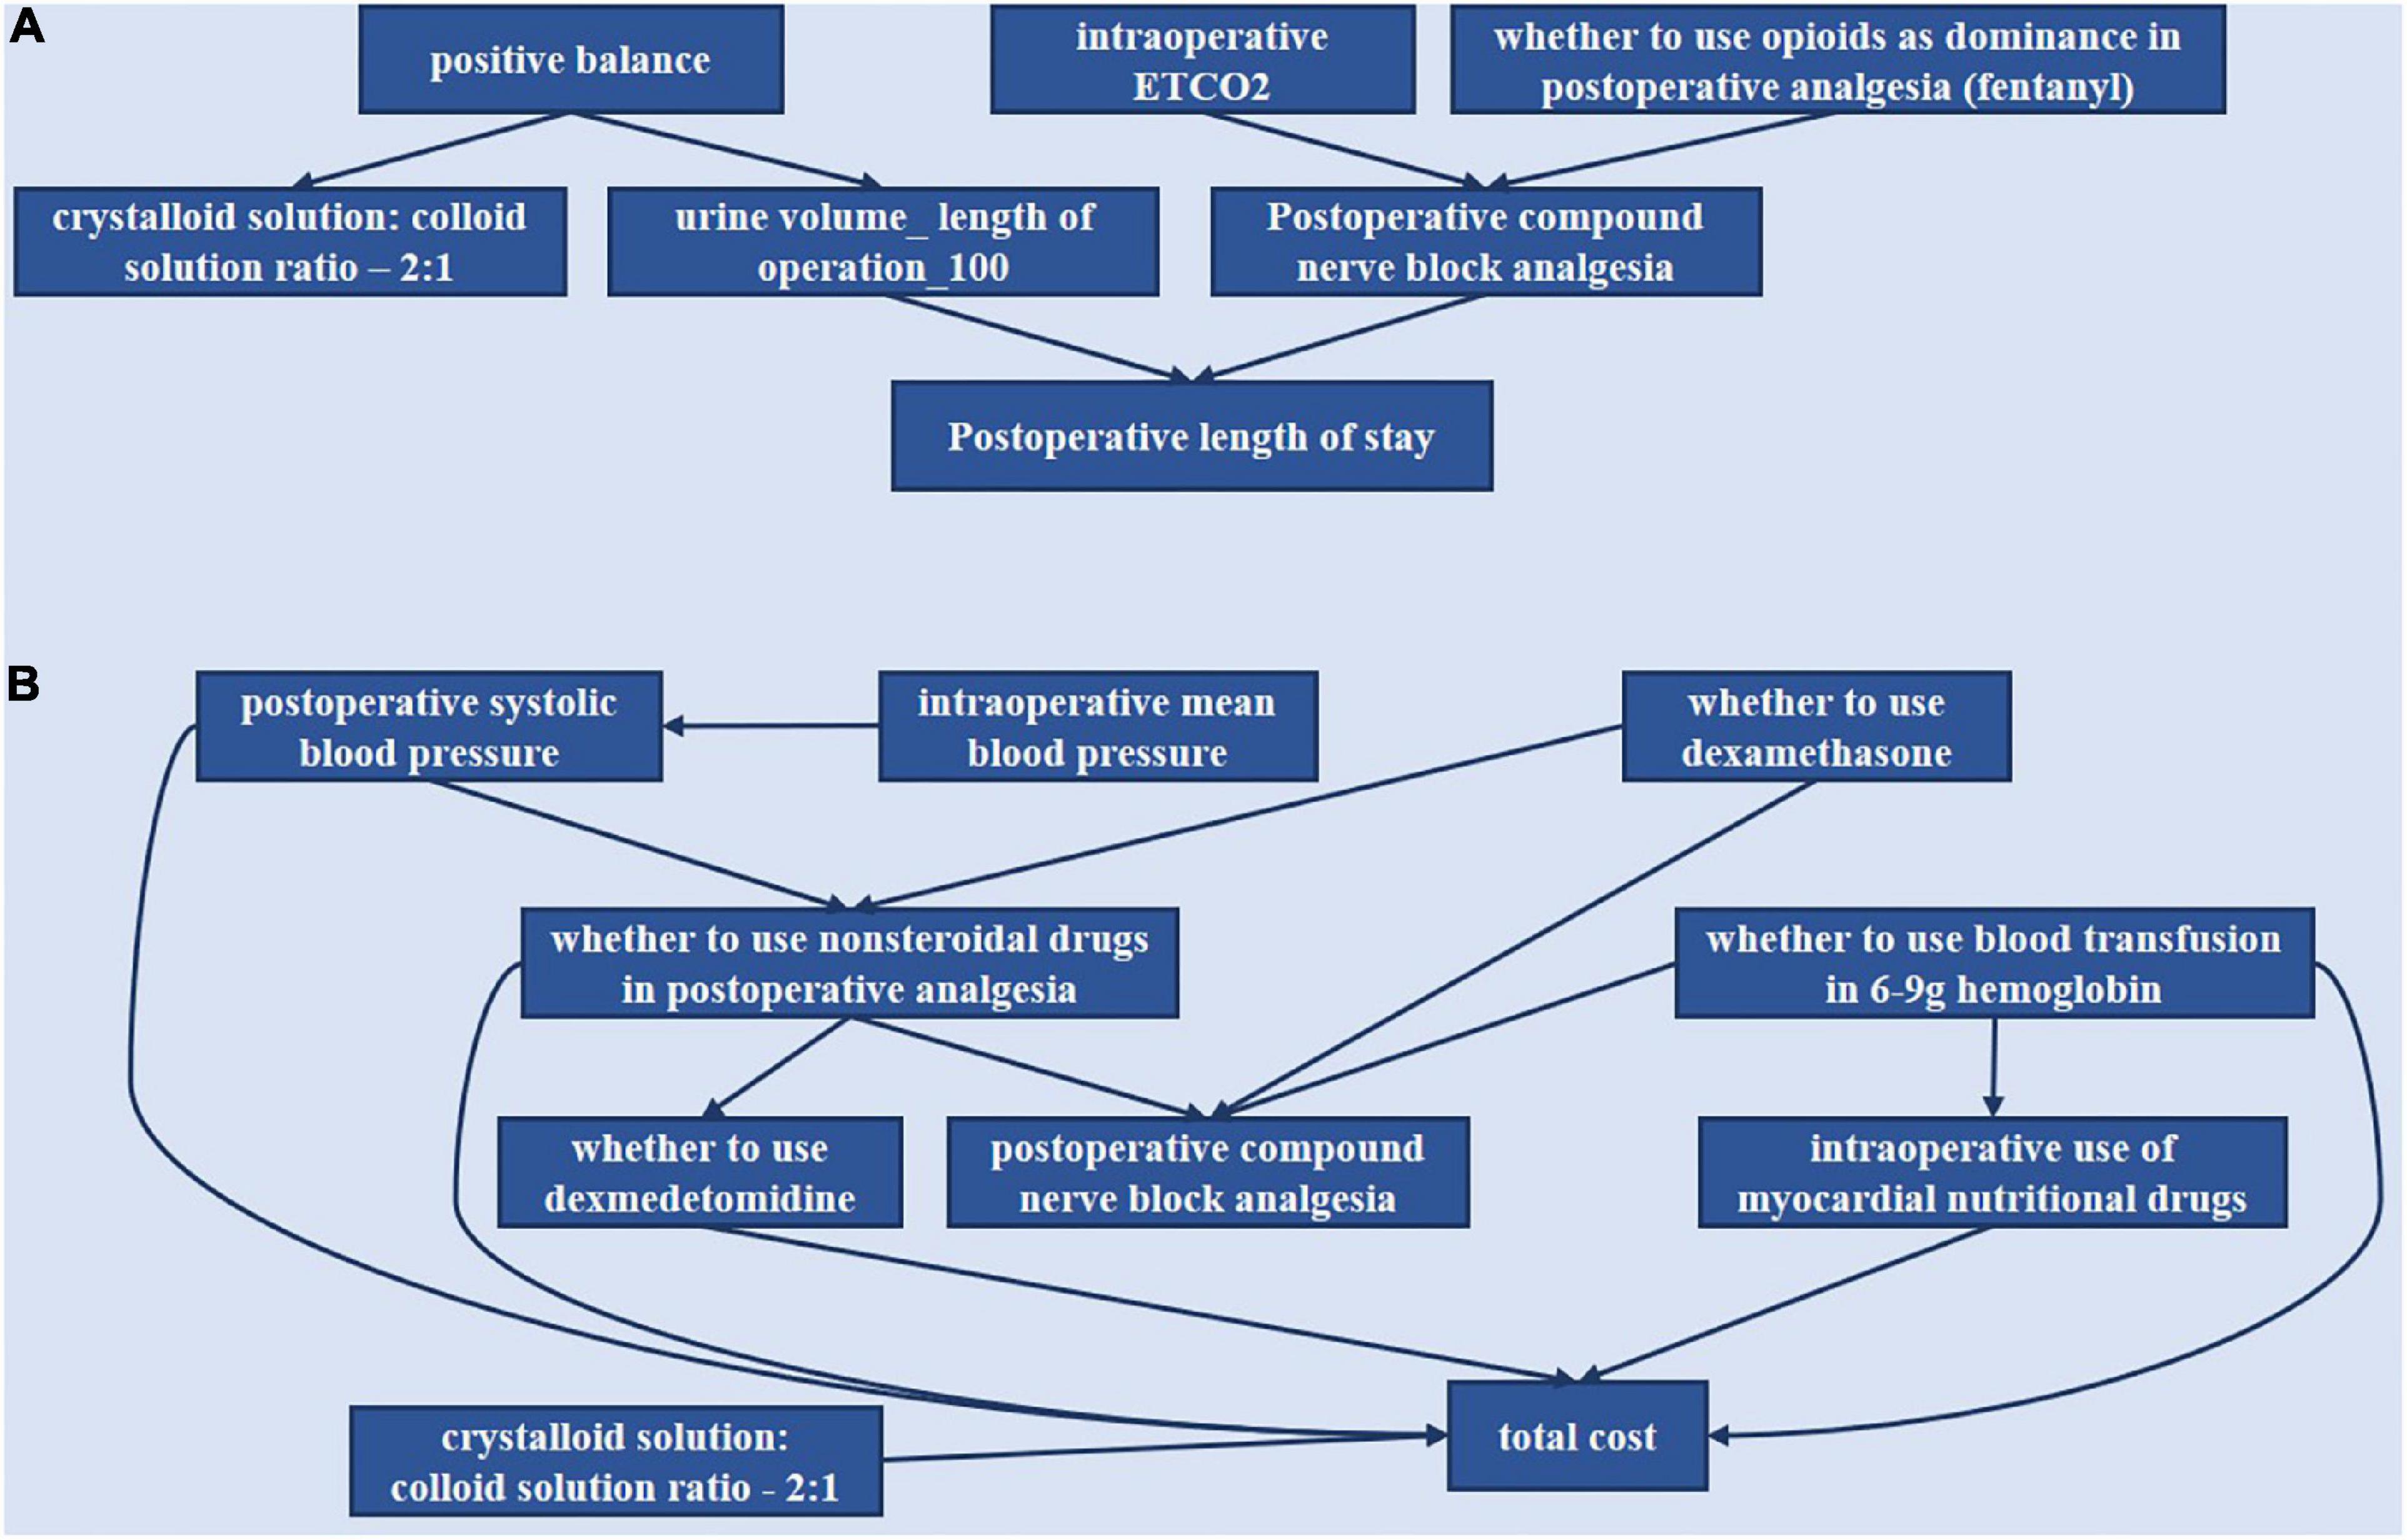
Figure 5. Bayesian causal network of various indicators of the postoperative length of stay and total cost. (A) Postoperative length of stay. (B) Total cost.
“Positive balance” was the parent node of “crystalloid solution: colloid solution ratio −2:1” and “urine volume—length of operation −100.” “Intraoperative ETCO2” and “whether to use opioids as dominance in postoperative analgesia (fentanyl)” could affect LOS through modulation of “postoperative compound nerve block analgesia.”
“Whether to use dexamethasone” was the parent node of “whether to use non-steroidal drugs in postoperative analgesia” and “postoperative compound nerve block analgesia.” “Whether to use non-steroidal drugs” was the parent node of “whether to use dexmedetomidine,” “postoperative compound nerve block analgesia,” and “total cost.” “Intraoperative mean blood pressure” could affect “total cost” through “intraoperative systolic blood pressure,” which was the parent node of “whether to use non-steroidal drugs” and “total cost.” “Whether to use blood transfusion in 6–9 g hemoglobin” was the parent node of “intraoperative use of myocardial nutritional drugs,” “postoperative compound nerve block analgesia,” and “total cost.” Then “whether to use dexmedetomidine,” “intraoperative use of myocardial nutritional drugs,” and “crystalloid solution: colloid solution ratio −2:1” could directly affect “total cost.”
Discussion
This study analyzed 1,827 patients undergoing laparoscopic gynecological surgery using BN based on 18 selected indicators related to anesthesia decision-making. Then, combining the selected indicators with specific grades and validation in patient data, we found that some of these impact indicators can improve the outcomes when combined. Finally, the DAGs of BN showed the interaction between the impact indicators through the arrows.
For the impact indicators we found, there is some clinical significance, and previous studies also proved it. For laparoscopic surgery, pneumoperitoneum is important and associated with ETCO2, and it did make a difference in our study. A previous study showed that low-pressure pneumoperitoneum was associated with improved parietal peritoneal perfusion (32), which may reduce clinically relevant complications. The “urine volume_length of operation_100” and “crystalloid solution: colloid solution ratio −2:1” also made sense. For urine volume, it can be influenced by fluid management such as restrictive fluid management strategy, open fluid management strategy or goal-directed fluid therapy (GDFT). Additionally, GDFT can reduce LOS and postoperative complications (33). At the same time, positive balance and blood pressure are also related to fluid management strategies. For an operative time, one study demonstrated that operative times > 120 min and 151–180 min, and ≥ 181 min predicted prolonged LOS (34). Another study indicated a significant association between high fluid volume given on the day of surgery and increased LOS and total costs (35). The above findings are consistent with our studies.
Differences also exist between our results and clinical practice. Our study recommended not using postoperative compound nerve block. However, nerve block has been reported to be effective in reducing pain and decreasing LOS or complication rates (36). Since the included patients are those with benign tumors undergoing laparoscopic surgery, they may not experience severe pain, and normal analgesic therapy can achieve satisfactory results. For TC, we found that indicators affecting total cost were mostly related to drug use. Our study recommends using dexmedetomidine to decrease TC. However, using common sense, we know that dexmedetomidine is expensive and leads to high costs. Perhaps, the cost could be decreased by reducing other complications. A previous study has shown that dexmedetomidine could attenuate the incidence of PONV (37).
Through the directed acyclic graph of BN analysis, we can predict the continuous impact of decisions on related indicators. Our study indicated that “positive balance” could affect the “crystalloid solution: colloid solution ratio −2:1” and “urine volume—length of operation −100” whist “urine volume—length of operation −100” can affect “postoperative length of stay.” It is consistent with clinical practice, while fluid management can influence patient recovery (35). “Intraoperative ETCO2” and “whether to use opioids as dominance in postoperative analgesia (fentanyl)” can affect “postoperative length of stay” by the modulation of “postoperative compound nerve block analgesia.” It has been proven that post-laparoscopic residual pneumoperitoneum volume was correlated with shoulder pain after laparoscopy (38, 39). Thus, “intraoperative ETCO2” was associated with analgesic planning. Then a study reported that multimodal analgesia improved postoperative pain control and minimized opioid-related adverse effects for all types of gynecological surgeries (14). This can also show that these indicators have interacted.
“Whether to use dexamethasone” was the parent node of “postoperative compound nerve block analgesia” and “whether to use non-steroidal drugs in postoperative analgesia,” the latter of which can affect “whether to use dexmedetomidine,” “postoperative compound nerve block analgesia” and “total cost.” This relationship suggests that the measures that control pain and postoperative nausea and vomiting affect the total cost. In addition, “intraoperative mean blood pressure” could affect “total cost” through “intraoperative systolic blood pressure,” which was the parent node of “whether to use non-steroidal drugs” and “total cost.” This correlation implies that blood pressure control may also influence the total cost. In addition, “crystalloid solution: colloid solution ratio −2:1” can independently affect “total cost.” So maybe there is room to explore the “crystalloid solution: colloid solution ratio −2:1” contribution to cost.
Machine learning has been applied to disease diagnosis, risk prediction, image recognition, and more. As a combination of probability theory and graph theory, BN has also played a corresponding role in the medical field (19, 40–44). However, the application of BN analysis for anesthesia decision-making in ERAS has not been reported yet. We investigated the indicators of anesthesia decision-making using BN analysis to identify the indicators that significantly impact anesthesia decision-making outcomes and study their combinations’ impact. Furthermore, the causal structure was explicitly represented, and the model can be learned from data, expert knowledge (no data), or a combination of the two approaches (19). Our research can be used to support clinical anesthesia decision-making based on the recommended indicators to achieve the optimal anesthetic part of ERAS.
However, our study still has some limitations. We only enrolled patients with benign tumors who participated in fewer ERAS measures. More patients diagnosed with other diseases must be included in the next step. In addition, the length of stay and total cost were analyzed separately, and the relationship between them was not explored. The next step is to investigate multiple outcomes in a single model. Moreover, this study was for anesthesiologists; we were most involved in intraoperative management and postoperative analgesia, which indicates a lack of preoperative measures. We need to include more indicators for the optimization of the whole ERAS.
Conclusion
We used the BN to study the relationship between anesthesia-related ERAS measures, postoperative length of stay, and total cost. Some indicators can affect the outcomes, and their combinations can reduce LOS and TC. The relationship between the indicators in DAGs provides new ideas for clinical work. This strategy is a new attempt at the Bayesian algorithm in ERAS, breaking through traditional statistical methods’ limitations. It provides a feasible plan for the anesthesiologist to optimize ERAS protocols and make individualized decisions.
Data availability statement
The data analyzed in this study is subject to the following licenses/restrictions: According to the regulation of the People’s Republic of China on the administration of human genetic resources, the collection of raw data was subject to approval by the science and technology administrative department of the state council (AQ: 2020SQCJ7444). Requests to access these datasets should be directed to BY, eWliaW4xOTc0QDE2My5jb20=.
Ethics statement
The studies involving human participants were reviewed and approved by ethics committee of the First Affiliated Hospital of Army Medical University, ethics committee of Xuanwu Hospital of Capital Medical University, and ethics committee on Biomedical Research, West China Hospital of Sichuan University. Written informed consent for participation was not required for this study in accordance with the national legislation and the institutional requirements.
Author contributions
BY, KW, and YC: study concept and design. YZ, YC, KZ, XS, DW, PD, XB, LZ, TZ, ZY, and YL: acquisition of data. YZ, YC, KZ, ZY, and YL: analysis and interpretation of data. JZ, YC, JG, and KL: technical support. BY and YC: funding acquisition. YZ, YC, and KZ: writing original manuscript. ZY and YL: revision of manuscript. All authors contributed to the article and approved the submitted version.
Funding
The work was supported by the National Key R&D Program of China (No. 2018YFC0116704 from YC), the National Key R&D Program of China (No. 2018YFC0116702 from BY), the Youth Innovation Promotion Association of the Chinese Academy of Sciences (No. 2020377 from YC), and National Natural Science Foundation of China (No. 82070630 from BY).
Acknowledgments
We would like to thank the participants of this study.
Conflict of interest
The authors declare that the research was conducted in the absence of any commercial or financial relationships that could be construed as a potential conflict of interest.
Publisher’s note
All claims expressed in this article are solely those of the authors and do not necessarily represent those of their affiliated organizations, or those of the publisher, the editors and the reviewers. Any product that may be evaluated in this article, or claim that may be made by its manufacturer, is not guaranteed or endorsed by the publisher.
References
1. Greco M, Capretti G, Beretta L, Gemma M, Pecorelli N, Braga M. Enhanced recovery program in colorectal surgery: A meta-analysis of randomized controlled trials. World J Surg. (2014) 38:1531–41. doi: 10.1007/s00268-013-2416-8
2. Varadhan KK, Neal KR, Dejong CH, Fearon KC, Ljungqvist O, Lobo DN. The enhanced recovery after surgery (ERAS) pathway for patients undergoing major elective open colorectal surgery: A meta-analysis of randomized controlled trials. Clin Nutr. (2010) 29:434–40. doi: 10.1016/j.clnu.2010.01.004
3. Smith TW JR., Wang X, Singer MA, Godellas CV, Vaince FT. Enhanced recovery after surgery: A clinical review of implementation across multiple surgical subspecialties. Am J Surg. (2020) 219:530–4. doi: 10.1016/j.amjsurg.2019.11.009
4. Wei C, Wan F, Zhao H, Ma J, Gao Z, Lin C. Application of enhanced recovery after surgery in patients undergoing radical cystectomy. J Int Med Res. (2018) 46:5011–8. doi: 10.1177/0300060518789035
5. Chiu C, Aleshi P, Esserman LJ, Inglis-Arkell C, Yap E, Whitlock EL, et al. Improved analgesia and reduced post-operative nausea and vomiting after implementation of an enhanced recovery after surgery (ERAS) pathway for total mastectomy. BMC Anesthesiol. (2018) 18:41. doi: 10.1186/s12871-018-0505-9
6. Gonzalez M, Abdelnour-Berchtold E, Perentes JY, Doucet V, Zellweger M, Marcucci C, et al. An enhanced recovery after surgery program for video-assisted thoracoscopic surgery anatomical lung resections is cost-effective. J Thorac Dis. (2018) 10:5879–88. doi: 10.21037/jtd.2018.09.100
7. Ruiz-Tovar J, Garcia A, Ferrigni C, Gonzalez J, Castellon C, Duran M. Impact of implementation of an enhanced recovery after surgery (ERAS) program in laparoscopic Roux-en-Y gastric bypass: A prospective randomized clinical trial. Surg Obes Relat Dis. (2019) 15:228–35. doi: 10.1016/j.soard.2018.11.002
8. Jiang HH, Jian XF, Shangguan YF, Qing J, Chen LB. Effects of enhanced recovery after surgery in total knee arthroplasty for patients older than 65 years. Orthop Surg. (2019) 11:229–35. doi: 10.1111/os.12441
9. Dunkman WJ, Manning MW. Enhanced recovery after surgery and multimodal strategies for analgesia. Surg Clin North Am. (2018) 98:1171–84. doi: 10.1016/j.suc.2018.07.005
10. Tan M, Law LS, Gan TJ. Optimizing pain management to facilitate enhanced recovery after surgery pathways. Can J Anaesth. (2015) 62:203–18. doi: 10.1007/s12630-014-0275-x
11. Grant MC, Pio Roda CM, Canner JK, Sommer P, Galante D, Hobson D, et al. The impact of anesthesia-influenced process measure compliance on length of stay: Results from an enhanced recovery after surgery for colorectal surgery cohort. Anesth Analg. (2019) 128:68–74. doi: 10.1213/ANE.0000000000003458
12. Bhakta P, Ghosh BR, Singh U, Govind PS, Gupta A, Kapoor KS, et al. Incidence of postoperative nausea and vomiting following gynecological laparoscopy: A comparison of standard anesthetic technique and propofol infusion. Acta Anesthesiol Taiwan (2016) 54:108–13. doi: 10.1016/j.aat.2016.10.002
13. Wang B, He KH, Jiang MB, Liu C, Min S. Effect of prophylactic dexamethasone on nausea and vomiting after laparoscopic gynecological operation: Meta-analysis. Middle East J Anaesthesiol. (2011) 21:397–402.
14. Munro A, Sjaus A, George RB. Anesthesia and analgesia for gynecological surgery. Curr Opin Anaesthesiol. (2018) 31:274–9. doi: 10.1097/ACO.0000000000000584
15. Seixas FL, Zadrozny B, Laks J, Conci A, Muchaluat Saade DC. A Bayesian network decision model for supporting the diagnosis of dementia, Alzheimer’s disease and mild cognitive impairment. Comput Biol Med. (2014) 51:140–58. doi: 10.1016/j.compbiomed.2014.04.010
16. Jamilloux Y, Romain-Scelle N, Rabilloud M, Morel C, Kodjikian L, Maucort-Boulch D, et al. Development and validation of a Bayesian network for supporting the etiological diagnosis of uveitis. J Clin Med. (2021) 10:3398. doi: 10.3390/jcm10153398
17. Park E, Chang HJ, Nam HS. A Bayesian network model for predicting post-stroke outcomes with available risk factors. Front Neurol. (2018) 9:699. doi: 10.3389/fneur.2018.00699
18. Siga MM, Ducher M, Florens N, Roth H, Mahloul N, Fouque D, et al. Prediction of all-cause mortality in haemodialysis patients using a Bayesian network. Nephrol Dial Transplant. (2020) 35:1420–5. doi: 10.1093/ndt/gfz295
19. Arora P, Boyne D, Slater JJ, Gupta A, Brenner DR, Druzdzel MJ. Bayesian networks for risk prediction using real-world data: A tool for precision medicine. Value Health (2019) 22:439–45. doi: 10.1016/j.jval.2019.01.006
20. Onisko A, Druzdzel MJ, Austin RM. Application of Bayesian network modeling to pathology informatics. Diagn Cytopathol. (2019) 47:41–7. doi: 10.1002/dc.23993
21. Cao Y, Raoof M, Szabo E, Ottosson J, NäSLUND I. Using Bayesian networks to predict long-term health-related quality of life and comorbidity after bariatric surgery: A study based on the scandinavian obesity surgery registry. J Clin Med. (2020) 9:1895. doi: 10.3390/jcm9061895
22. Lucas P. Bayesian analysis, pattern analysis, and data mining in health care. Curr Opin Crit Care. (2004) 10:399–403. doi: 10.1097/01.ccx.0000141546.74590.d6
23. Wu D, Zhang P, He Y, Luo X. A double-space and double-norm ensembled latent factor model for highly accurate web service QoS prediction. Proceedings of the IEEE Transactions on Services Computing. Los Alamitos, CA: IEEE (2022). p. 90720–1314. doi: 10.1109/TSC.2022.3178543
24. Wu D, He Y, Luo X, Zhou M. A Latent factor analysis-based approach to online sparse streaming feature selection. Proceedings of the IEEE Transactions on Systems, Man, and Cybernetics: Systems. Piscataway, NJ: IEEE (2021). p. 08855–14141. doi: 10.1109/TSMC.2021.3096065
25. He Y, Wu B, Wu D, Beyazit E, Chen S, Wu X. Toward mining capricious data streams: A generative approach. IEEE Trans Neural Netw Learn Syst. (2021) 32:1228–40. doi: 10.1109/TNNLS.2020.2981386
26. Pearl J. Probabilistic reasoning in intelligent systems: Networks of plausible inference. Burlington, MA: Morgan Kaufmann (1988). doi: 10.1016/B978-0-08-051489-5.50008-4
27. Jensen FV, Nielsen TD. Bayesian networks and decision graphs. Berlin: Springer (2001). doi: 10.1007/978-1-4757-3502-4
28. Kyrimi E, Mossadegh S, Tai N, Marsh W. An incremental explanation of inference in Bayesian networks for increasing model trustworthiness and supporting clinical decision making. Artif Intell Med. (2020) 103:101812. doi: 10.1016/j.artmed.2020.101812
29. Adabor ES, Acquaah-Mensah GK. Restricted-derestricted dynamic Bayesian network inference of transcriptional regulatory relationships among genes in cancer. Comput Biol Chem. (2019) 79:155–64. doi: 10.1016/j.compbiolchem.2019.02.006
30. Lv Z, Li Y, Wang H, Di R. Overview of bayesian network structure learning. J Xian Technol Univ. (2021) 41:1–17.
31. Chickering DM, Heckerman D, Meek C. Large-sample learning of Bayesian networks is NP-hard. J. Mach. Learn. Res. (2004) 5:1287–330.
32. Albers KI, Polat F, Loonen T, Graat LJ, Mulier JP, Snoeck MM, et al. Visualising improved peritoneal perfusion at lower intra-abdominal pressure by fluorescent imaging during laparoscopic surgery: A randomised controlled study. Int J Surg. (2020) 77:8–13. doi: 10.1016/j.ijsu.2020.03.019
33. Muñoz JL, Gabaldón T, Miranda E, Berrio DL, Ruiz-Tovar J, Ronda JM, et al. Goal-directed fluid therapy on laparoscopic sleeve gastrectomy in morbidly obese patients. Obes Surg. (2016) 26:2648–53. doi: 10.1007/s11695-016-2145-9
34. Smith CG, Davenport DL, Hoffman MR. Characteristics associated with prolonged length of stay after myomectomy for uterine myomas. J Minim Invasive Gynecol. (2019) 26:1303–10. doi: 10.1016/j.jmig.2018.12.015
35. Thacker JK, Mountford WK, Ernst FR, Krukas MR, Mythen MM. Perioperative fluid utilization variability and association with outcomes: Considerations for enhanced recovery efforts in sample US surgical populations. Ann Surg. (2016) 263:502–10. doi: 10.1097/SLA.0000000000001402
36. Brogi E, Kazan R, Cyr S, Giunta F, Hemmerling TM. Transversus abdominal plane block for postoperative analgesia: A systematic review and meta-analysis of randomized-controlled trials. Can J Anaesth. (2016) 63:1184–96. doi: 10.1007/s12630-016-0679-x
37. Zhong WG, Ge XY, Zhu H, Liang X, Gong HX, Zhong M, et al. Dexmedetomidine for antiemesis in gynecologic surgery: A meta-analysis of randomized controlled trials. Int J Clin Exp Med. (2015) 8:14566–76.
38. Song T, Kim KH, Lee KW. The intensity of postlaparoscopic shoulder pain is positively correlated with the amount of residual pneumoperitoneum. J Minim Invasive Gynecol. (2017) 24:984.e–9.e. doi: 10.1016/j.jmig.2017.06.002
39. Sroussi J, Elies A, Rigouzzo A, Louvet N, Mezzadri M, Fazel A, et al. Low pressure gynecological laparoscopy (7mmHg) with AirSeal(®) System versus a standard insufflation (15mmHg): A pilot study in 60 patients. J Gynecol Obstet Hum Reprod. (2017) 46:155–8. doi: 10.1016/j.jogoh.2016.09.003
40. Bielza C, Larrañaga P. Bayesian networks in neuroscience: A survey. Front Comput Neurosci. (2014) 8:131. doi: 10.3389/fncom.2014.00131
41. Waleska Simões P, Mazzuchello LL, Toniazzo De Abreu LL, Garcia D, Dos Passos MG, Venson R, et al. A comparative study of bayes net, naive bayes and averaged one-dependence estimators for osteoporosis analysis. Stud Health Technol Inform (2015) 216:1075. doi: 10.3823/1839
42. Kalet AM, Doctor JN, Gennari JH, Phillips MH. Developing Bayesian networks from a dependency-layered ontology: A proof-of-concept in radiation oncology. Med Phys (2017) 44:4350–9. doi: 10.1002/mp.12340
43. Jiang W, Shen Y, Ding Y, Ye C, Zheng Y, Zhao P, et al. A naive Bayes algorithm for tissue origin diagnosis (TOD-Bayes) of synchronous multifocal tumors in the hepatobiliary and pancreatic system. Int J Cancer. (2018) 142:357–68. doi: 10.1002/ijc.31054
Keywords: Bayesian network, enhanced recovery after surgery, decision-making, gynecological tumor, machine learning
Citation: Chen Y, Zhu Y, Zhong K, Yang Z, Li Y, Shu X, Wang D, Deng P, Bai X, Gu J, Lu K, Zhang J, Zhao L, Zhu T, Wei K and Yi B (2022) Optimization of anesthetic decision-making in ERAS using Bayesian network. Front. Med. 9:1005901. doi: 10.3389/fmed.2022.1005901
Received: 28 July 2022; Accepted: 24 August 2022;
Published: 14 September 2022.
Edited by:
Yi He, Old Dominion University, United StatesReviewed by:
Chao Jiang, Auburn University, United StatesTaige Wang, University of Cincinnati, United States
Huyong Yan, Chongqing Technology and Business University, China
Le Sun, Sungkyunkwan University, South Korea
Ji Xu, Guizhou University, China
Copyright © 2022 Chen, Zhu, Zhong, Yang, Li, Shu, Wang, Deng, Bai, Gu, Lu, Zhang, Zhao, Zhu, Wei and Yi. This is an open-access article distributed under the terms of the Creative Commons Attribution License (CC BY). The use, distribution or reproduction in other forums is permitted, provided the original author(s) and the copyright owner(s) are credited and that the original publication in this journal is cited, in accordance with accepted academic practice. No use, distribution or reproduction is permitted which does not comply with these terms.
*Correspondence: Ke Wei, d2syMDI0NDhAaG9zcGl0YWwtY3FtdS5jb20=; Bin Yi, eWliaW4xOTc0QDE2My5jb20=
†These authors have contributed equally to this work and share first authorship