
94% of researchers rate our articles as excellent or good
Learn more about the work of our research integrity team to safeguard the quality of each article we publish.
Find out more
ORIGINAL RESEARCH article
Front. Med., 11 November 2021
Sec. Translational Medicine
Volume 8 - 2021 | https://doi.org/10.3389/fmed.2021.739624
This article is part of the Research TopicNovel Therapeutics in Solid TumorsView all 5 articles
 Yulian Zhang1,2†
 Qi Wang1†
 Zai Wang3
 Chuanpeng Zhang1,2Xiaoli Xu1Jun Xu1
 Hongxiang Ren1Xu Shao1
 Xueke Zhen1Li Zhang1,2,4Yanbing Yu1,2,4*
We sought to clarify the clinical relationship between REST/NRSF expression and the prognosis of glioma and explore the REST-associated competitive endogenous RNA (ceRNA) network in glioma. We downloaded RNA-seq, miRNA-seq and correlated clinical data of 670 glioma patients from The Cancer Genome Atlas and analyzed the correlation between REST expression, clinical characteristics and prognosis. Differentially expressed genes (DEGs) were identified with DESeq2 and analyzed with Gene Ontology (GO) and the Kyoto Encyclopedia of Genes and Genomes (KEGG) using the Profiler package. Starbase was used to explore the regulatory interaction between REST and miRNAs or LncRNAs. The lncRNA-miRNA-REST ceRNA network was constructed with Cytoscape. RT-qPCR, WB, CCK8, wound-healing, and luciferase assays were performed to validate the ceRNA network. Results showed that REST expression was significantly higher in glioma patients than normal samples. Higher REST expression was significantly associated with worse overall survival, progression-free interval, and worse disease-specific survival in glioma patients. The DEGs of mRNA, miRNA, and lncRNA were identified, and GO and KEGG enrichment analyses were performed. Finally, REST-associated ceRNA networks, including NR2F2-AS1-miR129-REST and HOTAIRM1-miR137-REST, were experimentally validated. Thus, REST may be a prognostic biomarker and therapeutic target in glioma, and its regulatory network validated in this study may provide insights into glioma's molecular regulatory mechanisms.
Glioma is the most common primary intracranial tumor worldwide. Although surgery combined with chemotherapy and radiation can prolong the recurrence and survival time, the overall treatment for glioma remains unsatisfactory, and high recurrence rate and high mortality remain common (1, 2).
Repressor element 1 (RE-1) silencing transcription factor (REST), also known as neuron-restrictive silencer factor (NRSF), is an important negative neuronal transcriptional regulator and plays a pivotal role in the regulation of ion channel expression, synaptic plasticity, neurotransmitter receptors and the terminal differentiation of neurons (3–5). REST exerts its effects in brain development, neural differentiation, neurodegenerative diseases, aging and brain tumors (6, 7). REST often functions as an oncogene in tumors including small cell lung cancer (8), ovarian cancer (9) and oral squamous cell carcinoma (10). With regards to central nervous system (CNS) tumors, several studies have found that REST expression level is high in neuroblastoma (4, 11, 12), medulloblastoma (13) and glioblastoma (GBM) (14–17). Moreover, downregulation of REST inhibits the self-renewal potential and tumor-initiating capacity of GBM cells (15). While regulating thousands of target genes, REST itself is also involved in various regulatory mechanisms, including ubiquitination (18), proteasome degradation and nuclear translocation (19). REST has been considered an important therapeutic target for the treatment of glioma. Therefore, understanding REST function and how REST is regulated are especially important problem in molecular biological research.
However, the clinical relevance, gene function, and the regulatory mechanism of REST-associated ceRNA network remain unknown in glioma. In this study, we analyzed the clinical relevance of REST expression, identified REST-associated differential expression genes (DEGs) and performed functional enrichment analysis, and explored the REST-associated ceRNA regulatory network in glioma with its associated differentially expressed (DE)-RNAs, based on The Cancer Genome Atlas (TCGA) database. Our findings may provide new insights into the clinical prognostic value and regulatory mechanisms of REST in glioma.
All microarray expression data, including RNA-seq and miRNA-seq, and their correlated clinical data were download from The Cancer Genome Atlas (20) (TCGA) database (LGG and GBM datasets). After invalid information was discarded, 670 RNA-seq data of glioma patients with clinical information were finally obtained. RNA-seq data of level 3 HTSeq-FPKM were transformed into TPM (transcripts per million reads) format for subsequent analysis. The clinical data which were “Unavailable” or “Unknown” were considered as missing values. The prognosis data, such as overall survival (OS), progression-free interval (PFI) and disease-specific survival (DSS), were obtained from the study of Liu (21). The RNA-seq data of normal brain samples from standardized Genotype-Tissue Expression (GTEx) (22) were considered as normal controls and were obtained from the Xena (23) database (https://xenabrowser.net/).
The data were divided into high and low REST expression groups, and the expression profile data of the top 30% (0–30%) and the bottom 30% (70–100%) were extracted for subsequent analysis. The DESeq2 package (24) was used to identify the DEGs of glioma. HTSeq counts were used for the analysis of DE-mRNAs and DE-lncRNAs, while miRNA-seq counts were used for the analysis of DE-miRNAs. |logFC| > 1.5 and adjusted p < 0.05 was set as the cut-off criteria for DEGs, and the results were visualized with volcano plot and heatmap.
The Cluster Profiler package (25) was used for functional enrichment analysis. To explore the possible functions, annotations of the REST-related DEGs, GO enrichment analysis and KEGG pathway enrichment analysis were conducted and visualized.
Differences in REST protein expression between glioma and normal brain tissues were examined by immunohistochemistry (IHC) images from the HPA database (26). The staining intensity evaluation was determined from the HPA (https://www.proteinatlas.org).
Starbase (27) (http://starbase.sysu.edu.cn/) was used to explore the regulatory interaction between REST and miRNA or lncRNA, and the lncRNA-miRNA-REST ceRNA network was constructed with Cytoscape software (28).
Human cell lines U251, T98G, and 293T were purchased from ATCC and cultured in DMEM medium (Invitrogen, Thermo Fisher Scientific, USA). Culture media contained 10% fetal bovine serum (FBS) (Gibco) plus penicillin Streptomycin (Gibco), GlutaMAX(Gibco), and MEM non-Essential Amino Acids (MEM-NEAA) (Gibco). The above cells were all incubated in an incubator at 37°C with 5% CO2.
The mimics of miRNAs and siRNA were obtained from GenePharma Co. Ltd (Shanghai, China). The primers of all the genes were synthesized from TsingKe Biological Technology (Beijing, China). All the sequences were displayed in Supplementary Table 1. Transfection of miRNAs and siRNA was performed using Lipofectamine 3000 (Invitrogen, Carlsbad, CA, USA) when the cell density reached approximately 50%-70%(usually 24 h after inoculation) following instruction of manufacture, transfection of plasmid was performed using Hieff TransTM Liposomal Transfection Reagent (YEASEN, Shanghai, China), according to the manufacturer's instructions. The concentrations of the siRNA and miRNA used in transfection was 5 pmol/well for 96-well-plate (40 pmol/well for 12-well-plate and 100 pmol/well for 6-well-plate, respectively) following the manufacturer's instructions (GenePharma Co. Ltd, Shanghai, China).
The methods of RNA extraction and real-time RT-PCR analysis were performed as previously described (29). Briefly, total RNA was extracted and converted into complementary DNA (cDNA). Quantitative PCR (qPCR) was performed using QuantiNova SYBR Green PCR Kit (QIAGEN, Hilden, Germany). Quantifications were normalized and calculated by the 2−ΔΔCt method.
Western blot was performed as previously (29). Briefly, total protein was quantified using bicinchoninic acid (BCA) method and separated using 10% SDS-PAGE. Then the gels were transferred to PVDF membranes. After blocked with 5% skim milk in TBST, the membranes were incubated with the primary antibodies: GAPDH (1:6000; Proteintech, USA) and REST (1:2000; Proteintech, USA) overnight at 4°C. After washing with TBST, the membranes were reacted with the secondary antibody. Finally, enhanced chemiluminescence (ECL) kit (MD Millipore, Germany) was used to measure the signals in the Bio-Rad ChemiDocXRS Imaging system (Bio-Rad, Hercules, CA, USA) and calculated with Image J software.
The proliferative capacity of glioma cells was determined using the CCK8 kit (DOJINDO, Japan). After cell transfection, log phase grown cells were implanted in 96-well-plates with 3,000 cells per well. At 0, 24, 48, and 72 h post-transfection, 10 μl CCK-8 reaction solution was added to each well. The plates were then placed back in the incubator for 1 h. Finally, the absorbance of each well was measured at 450 nm using a multifunctional enzyme marker.
After cell transfection, cells were digested and resuspended with serum-free DMEM culture medium, inoculated into 6-well-plates at a cell count of 150,000 per well, and cell transfection was performed at 24 h. When the cells were grown to fusion (usually 48 h after inoculation), a 200 ul pipette tip was used to make a vertical “wound” in the cell layer. This was followed by incubation with DMEM containing 2% FBS to eliminate the effect of proliferation on the migratory phenotype. Scratch pictures were collected at 0, 24, 48, and 96 h (until the scratch healed in the experimental or control group). Image J software was applied to calculate the scratch healing area. Scratch healing ratio of X h = (0 h scratch area–X h scratch area)/0 h scratch area.
The methods of luciferase assay were performed as previously described (29). Direct target sites were predicted based on TargetScan (http://www.targetscan.org/vert_72/) and starBase v2.0 (http://starbase.sysu.edu.cn/) (27). The luciferase plasmid was constructed, and the 3′-UTR sequences of REST and lncRNAs were cloned into psiCHECK-2 promoter vector (Promega) by Ruibio Biotech (Beijing, China).
All statistical analyses were performed with R (v3.6.2) or GraphPad Prism 8.0 (GraphPad Inc., California, CA, USA). Wilcoxon rank sum test was used to analyze the expression of glioma and normal samples. Receiver operating characteristic (ROC) and the area under curve (AUC) were used to test the diagnostic value of REST expression for glioma. Kruskal–Wallis test and Wilcoxon signed-rank test were used to analyze the correlation between REST expression and clinical characteristics. Spearman rank correlation was used to analyze the correlation between REST expression and hub genes in ceRNA network. Cox regression analysis or Kaplan-Meier analysis were used to evaluate the correlation between REST expression and clinical prognosis. In Cox regression analysis, variables with p < 0.1 in univariate Cox regression were included in multivariate Cox regression analysis. Spearman correlation test was used to analyze the correlation of gene expression. P < 0.05 were considered statistically significant.
The flow chart of our study is shown in Figure 1. To analyze the difference in REST expression between gliomas and normal tissues, we used the TCGA database combined with GTEX data to analyze the gene expression level of REST in pan-cancer and adjacent tissues. The results showed that the expression of REST was significantly up-regulated in most tumors compared to normal tissues, such as esophageal carcinoma, acute myeloid leukemia (LAML) and testicular germ cell tumors (TGCT) (all p < 0.001, Figure 2A). Furthermore, we observed that REST expression level in glioma (LGG + GBM) was significantly higher than that in normal samples (Figure 2B). The ROC curve was used to analyze the diagnostic value of REST. The AUC was 0.9, which indicates that REST is a potential diagnostic biomarker (Figure 2C). In addition, we explored the protein expression of REST in glioma and normal samples and examined the immunohistochemical results of REST protein using the HPA (Supplementary Figure 1). The representative results showed that REST was not expressed in normal brain tissue, whereas high expression of REST was observed in glioma tissue (Figure 2D).

Figure 1. Flow chart of the study.
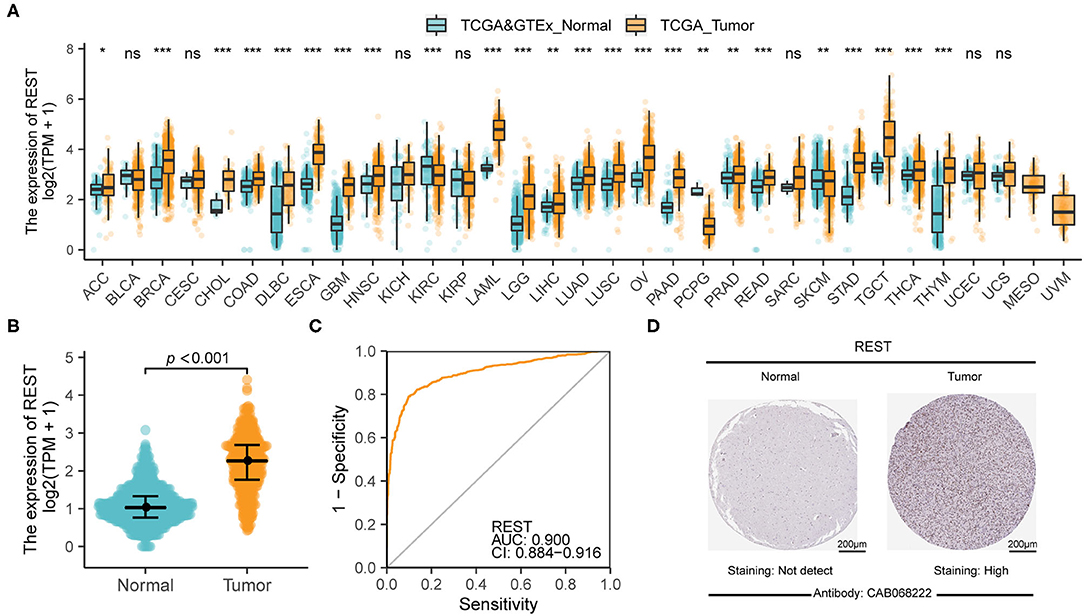
Figure 2. REST was significantly up-regulated in glioma. (A) The difference of REST expression in pan-cancer and adjacent tissues. (B) REST differential expression analysis between glioma samples in TCGA database and normal brain samples from TCGA and GTEx databases. (C) The diagnostic value of REST in glioma. (D) The representative immunohistochemical images of REST in the Human Protein Atlas database of glioma and normal tissues. All data are shown as mean ± SD, *P < 0.05, **P < 0.01, and ***P < 0.001.
The Kruskal–Wallis test and Wilcoxon signed-rank test were used to analyze the correlation between REST expression and clinical characteristics of glioma. We found that higher REST expression level positively correlated with higher WHO grade (p < 0.001, Figure 3A), IDH status-WT (p < 0.001, Figure 3B), non-1p/19q codeletion (p < 0.001, Figure 3C), histological type-GBM (p < 0.001, Figure 3D), tumor status -with tumor (p < 0.001, Figure 3E) and primary therapy outcome-PD (p < 0.001, Figure 3F). Consistent results were obtained from chi-square test (Table 1). Logistic regression analysis also suggested similar results. The results showed that REST expression was significantly correlated with 1p/19q codeletion (non-codeletion) (OR = 28.73, p < 0.001), IDH status (WT) (OR = 4.60, p < 0.001), WHO grade (G3–4) (OR = 3.84, p < 0.001), histological type (GBM) (OR = 3.44, p < 0.001), tumor status (with tumor) (OR = 2.5, p < 0.001), primary therapy outcome (SD + PD) (OR = 2.09, p < 0.001) and Karnofsky score (≤80) (OR = 2.01, p < 0.001, Table 2). These results suggest that REST expression is closely related to worse clinical characteristics.
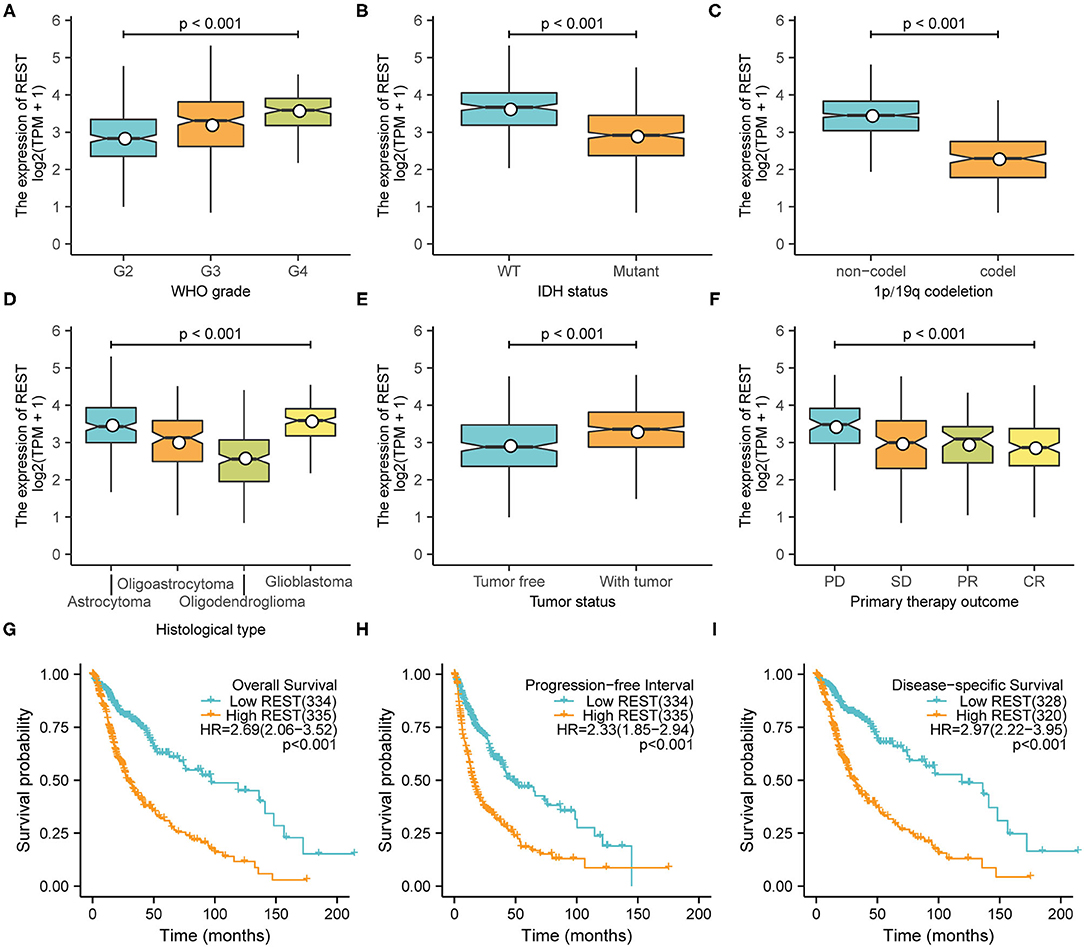
Figure 3. High expression of REST was associated with worse characteristics. The correlation between REST expression and WHO stage (A), IDH status (B), 1p/19q codeletion (C), histological type (D), tumor status (E), and primary treatment outcome (F). Prognostic analysis of REST expression and overall survival (G), progression-free interval (H), and disease-specific survival (I). Data were analyzed using Kruskal–Wallis test (A,D,F), Wilcoxon signed-rank test (B,C,E), and Kaplan–Meier analysis (G–I).
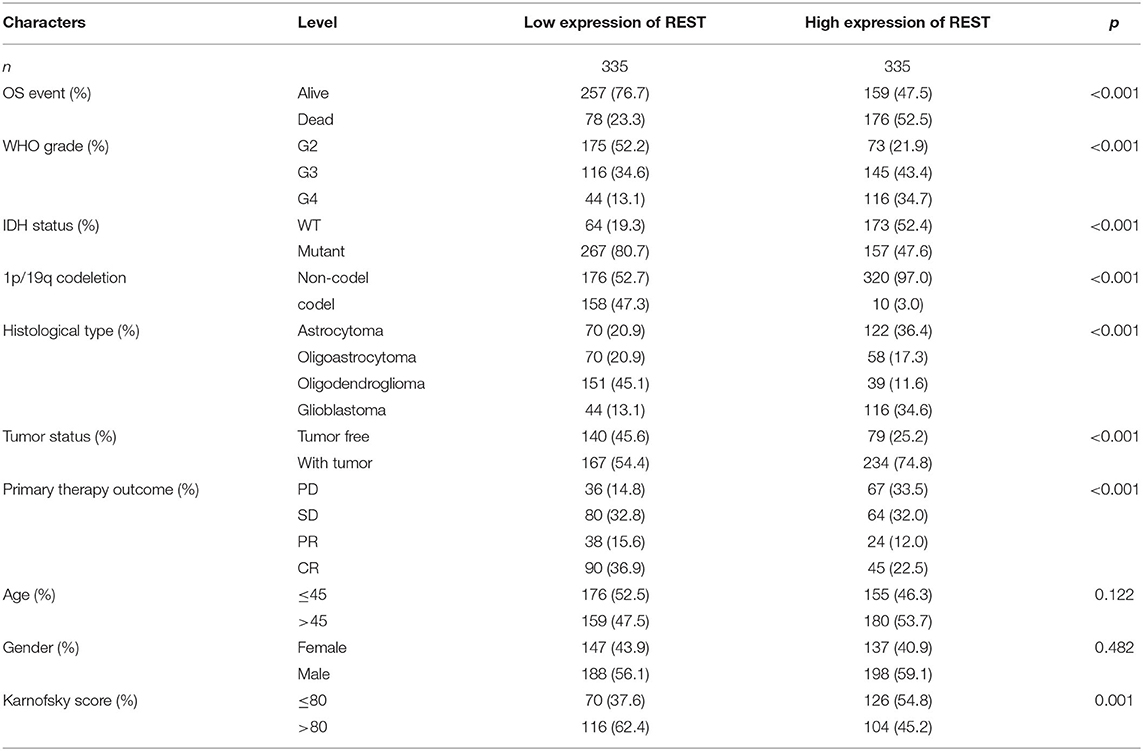
Table 1. Correlation between REST expression and clinical characteristics in glioma patients.
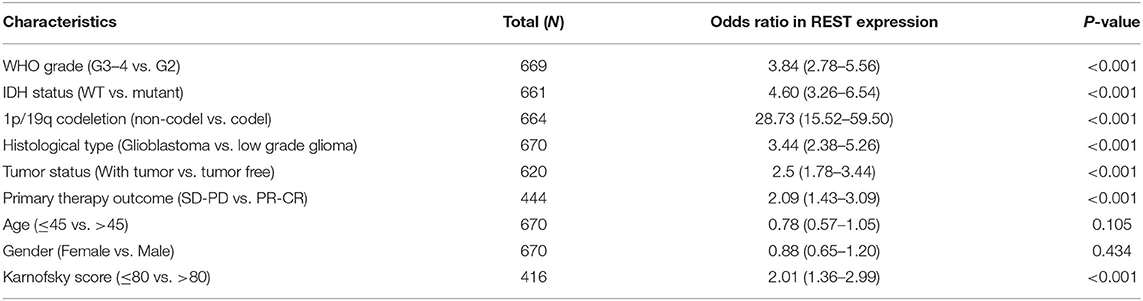
Table 2. Logistic regression of clinical characteristics based on REST expression.
To explore the relationship between REST expression and prognosis of glioma patients, we analyzed the correlation of REST expression with OS, PFI and DSS. The results showed that higher REST expression was associated with worse OS (HR = 2.69; 95% CI, 2.06–3.52; Figure 3G), worse PFI (HR = 2.33; 95% CI, 1.85–2.94; p < 0.001; Figure 3H) and worse DSS (HR = 2.97; 95% CI, 2.22–3.95; p < 0.001; Figure 3I). Univariate Cox regression analysis of OS showed that WHO grade (G3–4), IDH status (WT), 1p/19q codeletion (non-codeletion), histological type (GBM), tumor status (with tumor), primary therapy outcome (SD + PD), age (>45), Karnofsky score (≤80) and high REST expression level was associated with poor OS (all p < 0.001, Table 3). Further multivariate Cox regression analysis suggested that high REST expression level were an marginally independent prognostic marker of OS.
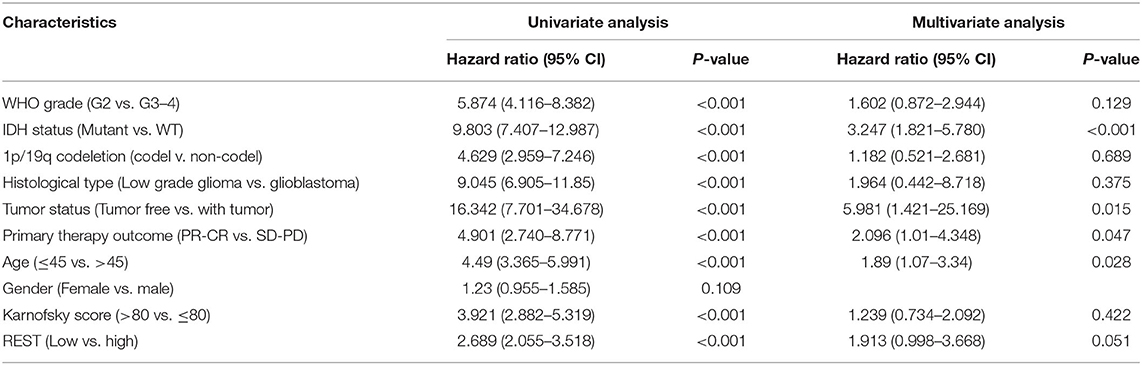
Table 3. The overall survival (OS) univariate and multivariate cox proportional risk analysis.
To further explore the biological function of REST in glioma, we grouped the expression profiles according to the level of REST expression. We analyzed differences in whole-gene expression profile between samples with REST expression in the top 30% (0–30%) and those in the bottom 30% (70–100%), and found that 2,336 up-regulated genes and 1,599 down-regulated genes were significantly correlated with REST expression (|logFC| > 1.5 and adjusted p < 0.05, Figure 4A). The top 20 up-regulated and the top 20 down-regulated DE-mRNAs are shown in a heat map (Figure 4B). In addition, we conducted GO and KEGG enrichment analysis of the REST-associated DEGs. The results of GO analysis showed that changes in biological processes (BP) of REST-associated DEGs were mainly enriched in extracellular matrix (ECM) organization, extracellular structure organization and neurotransmitter transport (Figure 4C, Table 4), while changes in cellular components (CC) were mainly enriched in the collagen-containing ECM, synaptic membrane and pre-synapse (Figure 4D, Table 4). Changes in molecular function (MF) were mainly enriched in passive transmembrane transporter activity, channel activity and ECM structural constituents (Figure 4E, Table 4). KEGG pathway analysis revealed that the REST-associated DEGs were mainly enriched in neuroactive ligand-receptor interaction, ECM-receptor interaction, and nicotine addiction (Figure 4F, Table 4).
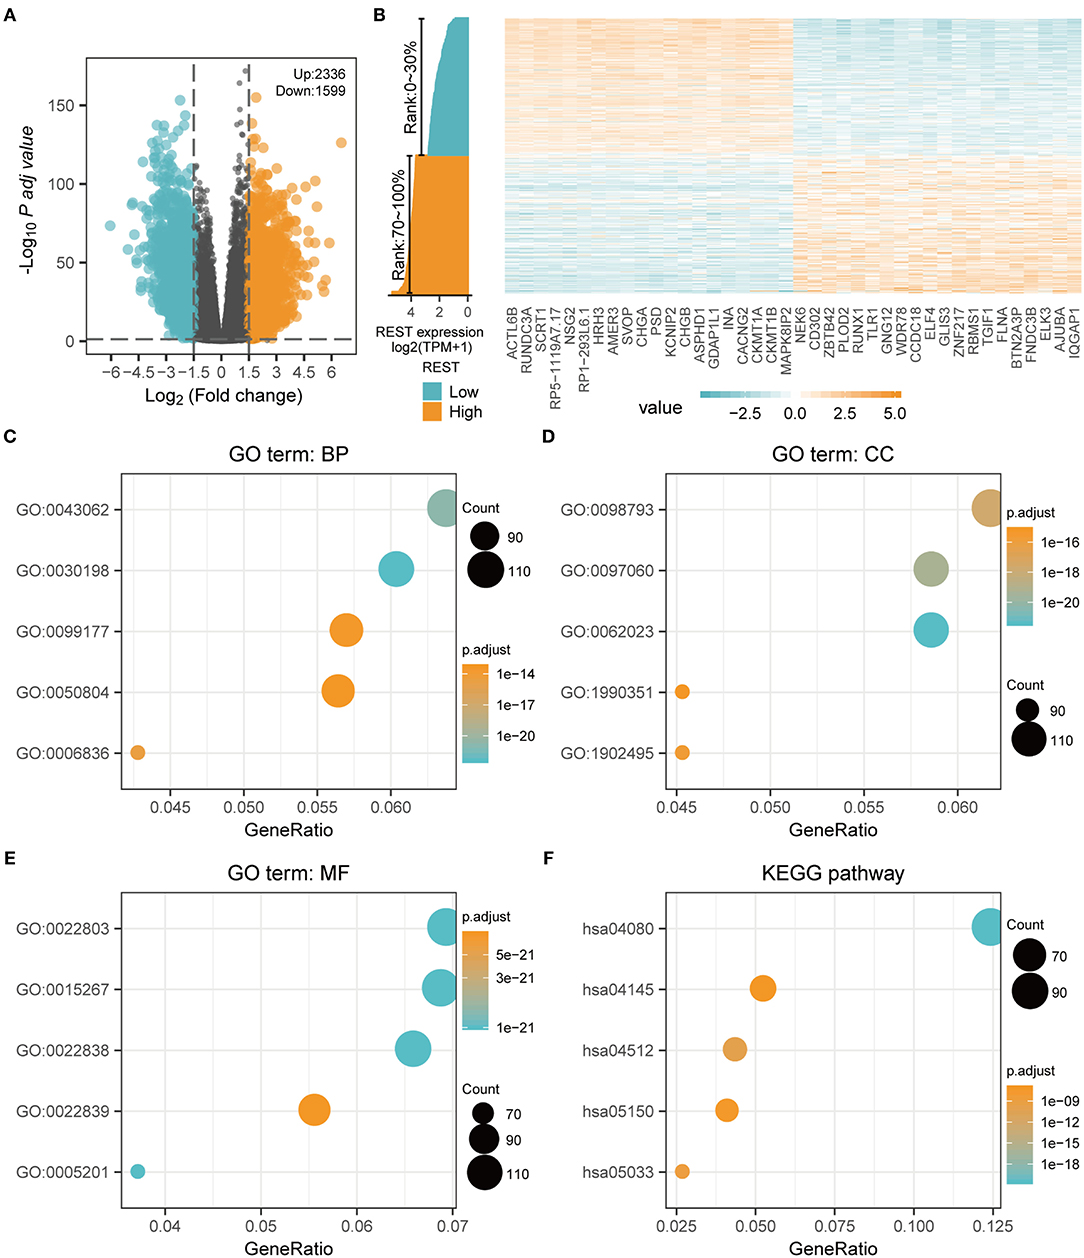
Figure 4. REST-associated differential expression gene analysis (DEGs) and GO/KEGG enrichment analysis. (A) The volcanic map showing the DE-mRNA of the high (top 30%) and low (bottom 30%) REST expression profiles. (B) The heat map showing the top 20 up-regulated and the top 20 down-regulated REST-associated DE-mRNA. (C–F) Functional enrichment analysis of REST associated DE-mRNA. The biological process (C), cellular component (D), molecular function (E), and KEGG pathway (F) were analyzed.
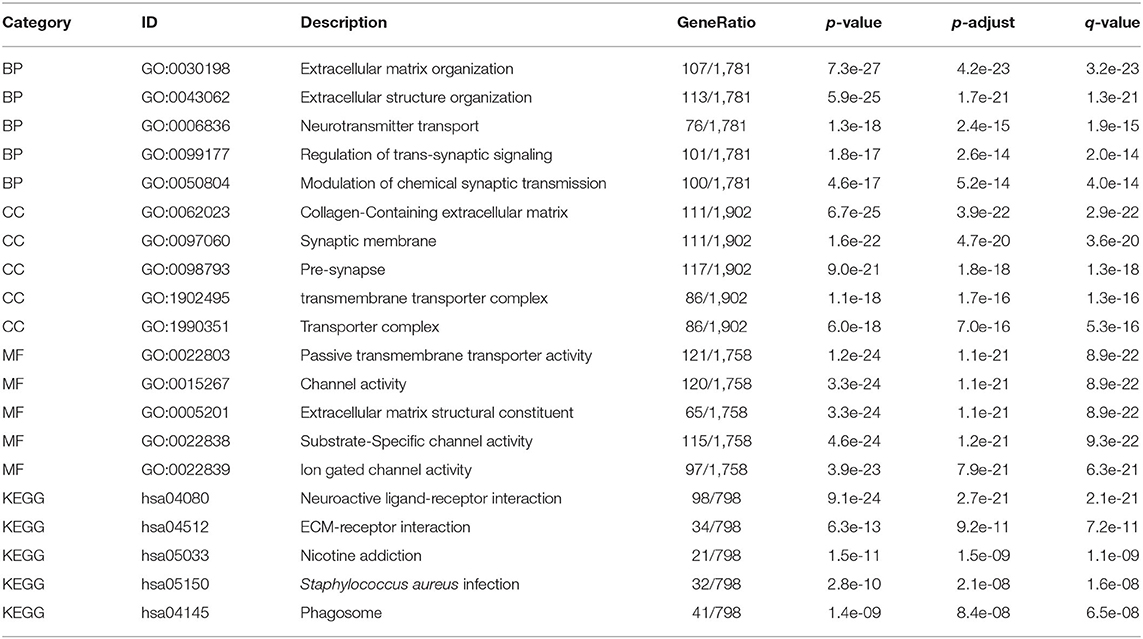
Table 4. GO/KEGG enrichment analysis of REST-associated DE-mRNAs.
To study the lncRNA and miRNA associated with REST expression, we analyzed the DEGs of the lncRNA profile and miRNA profile based on the REST high-low expression group. In the lncRNA DEGs, there were 508 up-regulated lncRNAs and 544 down-regulated lncRNAs (|logFC| > 1.5 and adjusted p < 0.05, Figure 5A). In the miRNA DEGs, there were 36 up-regulated miRNAs and 27 down-regulated miRNAs (|logFC| > 1.5 and adjusted p < 0.05, Figure 5B). The top 20 up-regulated and the top 20 down-regulated DE-lncRNAs and DE-miRNAs are shown with a heat map (Figures 5C,D).
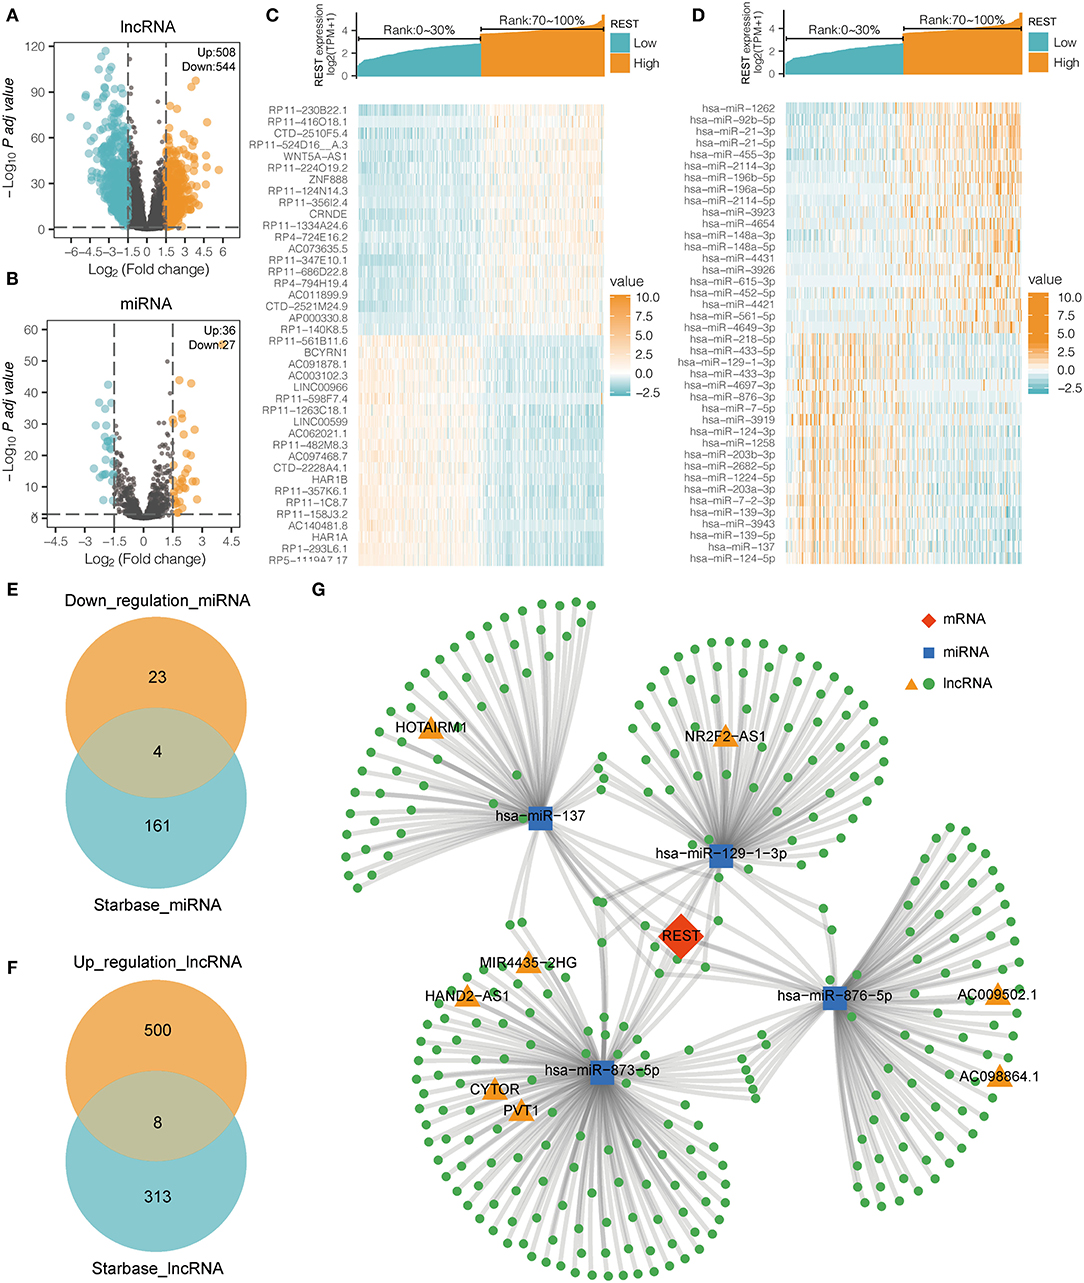
Figure 5. REST ceRNA network construction. (A,B) The volcanic map showing the DE-lncRNA (A) and DE-miRNA (B) of the high (top 30%) and low (bottom 30%) REST expression profiles. (C,D) The heat map showing the top 20 up-regulated and the top 20 down-regulated REST-associated DE-lncRNA (C) and DE-miRNA (D). (E) Venn diagram illustrating the overlap between miRNAs that are associated with low expression of REST derived from TCGA database and miRNAs which target REST predicted by Starbase. (F) Venn diagram illustrating the overlap between lncRNAs that are associated with over expression of REST derived from TCGA database and the lncRNAs which target the overlap miRNAs predicted by Starbase. (G) LncRNA-miRNA-REST ceRNA network was constructed with predicted miRNAs and lncRNAs.
In recent years, the ceRNA hypothesis has suggested a new mechanism for RNA regulatory interactions (30). miRNA can silence genes by binding to the 3′UTR of mRNA, while ceRNA can competitively sponge miRNA to up-regulate the expression of its downstream genes. ceRNA and mRNA expression are positively correlated, while miRNA and mRNA expression are negatively correlated. To explore the REST-associated ceRNA regulatory network, we constructed a lncRNA-miRNA-REST network. Starbase (27) was used to predict miRNA that may target REST, which led to the discovery of 165 miRNAs; of which, 4 miRNAs were in the list of REST-associated down-regulated miRNAs (Figure 5E). These 4 miRNAs were used to predict 321 target lncRNAs; among which, 8 lncRNAs were in the list of REST-associated up-regulated lncRNAs (Figure 5F). We then constructed a lncRNA-miRNA-REST ceRNA network including predicted miRNAs and lncRNAs (Figure 5G). The correlation between miRNAs or lncRNAs obtained from the above analysis and REST expression was analyzed individually, and the results showed that the expression of NR2F2-AS1 (R = 0.307, p < 0.001), HOTAIRM1 (R = 0.484, p < 0.001), CYTOR (R = 0.371, p < 0.001), MIR4435-2HG (R = 0.420, p < 0.001), HAND2-AS1 (R = 0.430, p < 0.001), PVT1 (R = 0.463, p < 0.001), AC009502.1 (R = 0.285, p <0.001), and AC0098864.1 (R = 0.119, p = 0.002) were positively correlated with REST expression, while the expression of hsa-miR-137 (R = −0.459, p < 0.001), hsa-miR-129-1-3p (R = −0.282, p < 0.001), hsa-miR-876-5p (R = −0.261, p < 0.001), and hsa-miR-873-5p (R = −0.223, p < 0.001) were negatively correlated with REST expression (Figure 6).
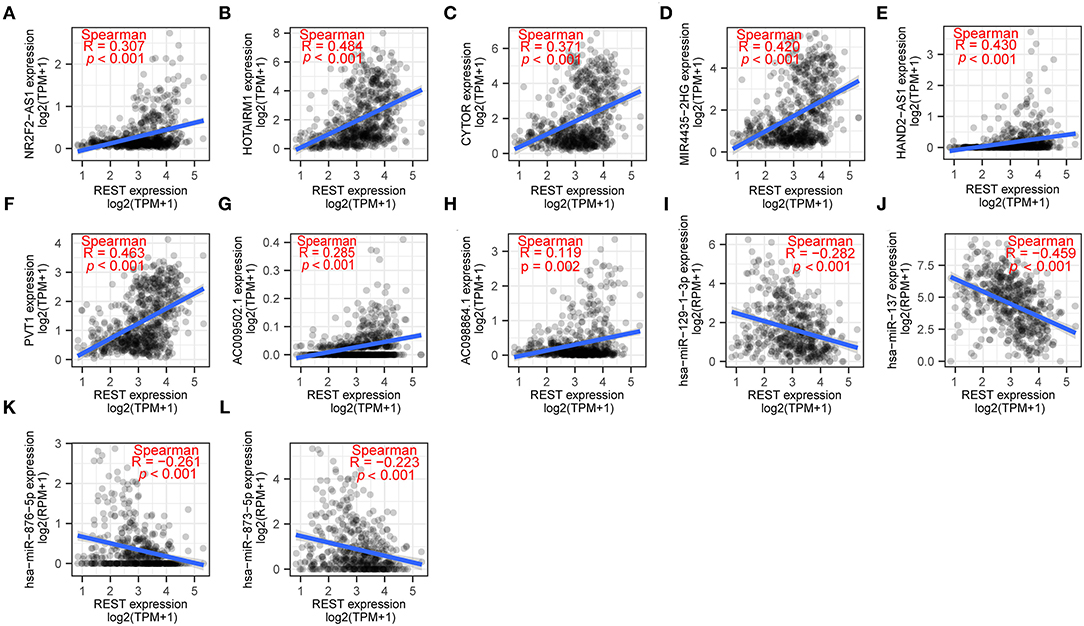
Figure 6. The correlation of REST and its hub genes of ceRNA network. The correlation between REST and NR2F2-AS1 (A), HOTAIRM1 (B), CYTOR (C), MIR4435-2HG (D), HAND2-AS1 (E), PVT1 (F), AC009502.1 (G), AC0098864.1 (H), hsa-miR-129-1-3p (I), hsa-miR-137 (J), hsa-miR-876-5p (K), hsa-miR-873-5p (L). Data were analyzed using Spearman rank correlation.
In order to determine the effectiveness of predicted miRNAs and its regulatory relationship with REST, we first overexpressed 4 miRNAs with miRNA-mimics and observed their own expression efficiency. The results showed that the level of miRNAs-mimics were significantly increased in U251 and T98G cell lines (Figures 7A,B). CCK8 assay was used to investigate the role of miRNAs in glioma cell growth and proliferation. The results showed that miR-129 and miR-137 can significantly inhibited the proliferation in glioma cell lines (Figures 7C,D). Wound healing assay was performed to evaluate the migration ability of miRNAs, and the results showed that all four miRNAs could significantly inhibit the migration of glioma cell lines (Figures 7E,F). Then, the silencing efficiency of REST mRNA (Figures 7G,H) and protein (Figure 7I) were determined by qRT-PCR and Western Blot. The results showed that only miR-129 and miR-137 can effectively regulate the expression levels of REST, at both mRNA and protein levels. Therefore, we selected miR-129 and miR-137, which can effectively regulate REST expression and have tumor inhibitory effects, for our further research. Then luciferase assays were performed to evaluate the direct binding of miR-129 or miR-137 with REST. The result showed that both miR-129 and miR-137 can directly bind to REST 3'UTR (Figures 7J,K).
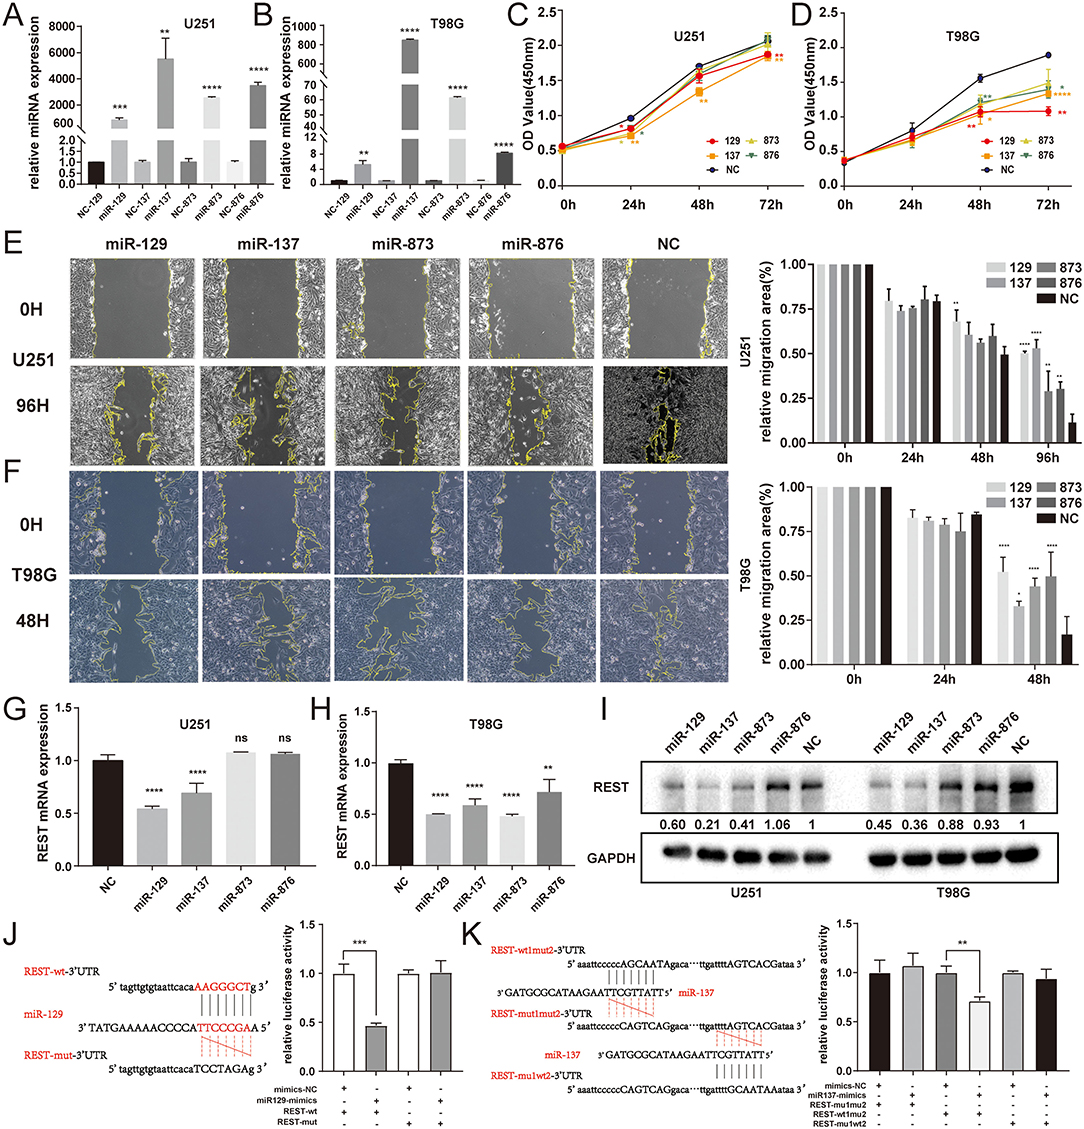
Figure 7. Experimental validation between REST and miRNAs of ceRNA. (A,B) The transfected expression of 4 miRNA-mimics in U251 and T98G cell lines. (C,D) Cell proliferation was determined by CCK8 assay. (E,F) Cell migration was determined by wound-healing assay. The expression levels of REST mRNA (G,H) and protein (I) were determined by qRT-PCR and Western Blot. (J,K) The binding site of miRNA and the 3′UTR of REST were predicted by Starbase and validated by luciferase assay. All data are shown as mean ± SD, *P < 0.05, **P < 0.01, ***P < 0.001, and ****P < 0.0001.
Further, LncRNA NR2F2-AS1 and HOTAIRM1, which were predicted to be associated with miR-129 or miR-137, were selected for further experimental verification. First, we transfected U251 cells with siRNAs of LncRNAs to knockdown the expression of LncRNAs (Figure 8A). Then, qPCR and Western Blot were performed to evaluate the regulatory effect of REST. Results showed that both two lncRNAs can reduce the expression levels of REST mRNA (Figure 8B) and protein (Figure 8C). Next, luciferase assay was performed to evaluate the direct binding of miRNA and lncRNA. It was found that miR-129 can directly bind to NR2F2AS1 (Figure 8D), and miR-137 can directly bind to HOTAIRM1 (Figure 8E). Meanwhile, in TCGA-GBM, it can be found that the expression levels of NR2F2AS1 and HOTAIRM1 were significantly higher than that of normal tissues (Figures 8F,G), and the high expression levels were significantly correlated with poor prognosis in TCGA-GBM database (Figures 8H,I). Finally, the mechanistic scheme of lncRNA-miRNA-REST in glioma is shown in Figure 8J.
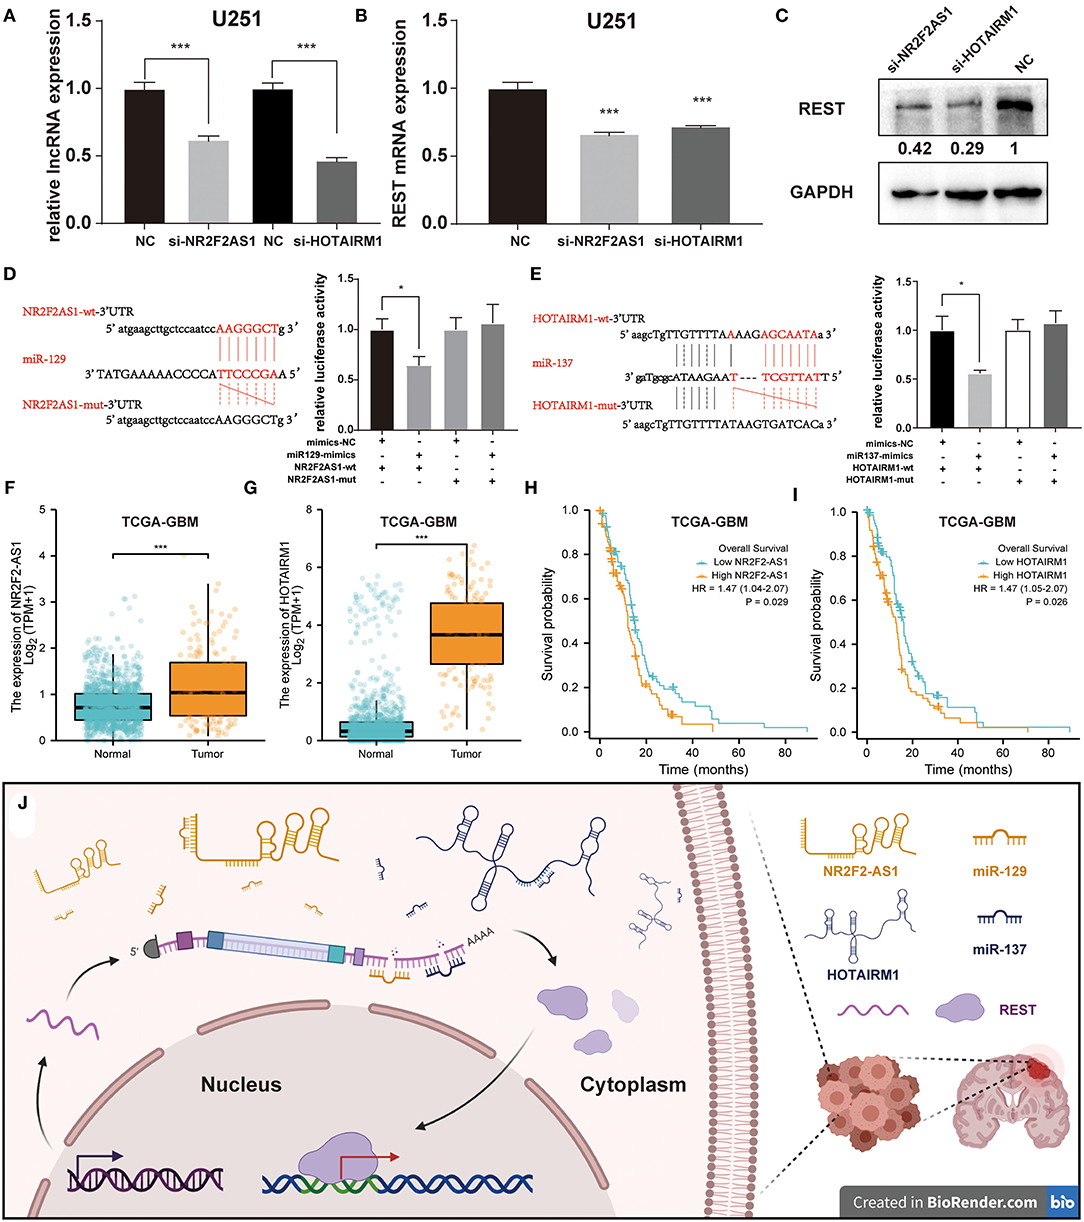
Figure 8. Experimental validation between REST, miRNA, and lncRNAs. (A) The relative LncRNA expression levels after transfection of si-lncNR2F2-AS1 and si-lncHOTAIRM1. The expression levels of REST mRNA (B) and protein (C) were determined by qPCR and Western Blot. (D,E) The binding site of miRNAs in relative lncRNAs were predicted by Starbase and validated by luciferase assay. (F,G) The differential expression analysis of lncRNA between glioma samples in TCGA-GBM database and normal brain samples from TCGA and GTEx databases. (H,I) Prognostic analysis of lncRNA expression and overall survival. (J) The mechanistic scheme of lncRNA-miRNA-REST in glioma. All data are shown as mean ± SD, *P < 0.05 and ***P < 0.001. The picture was created with BioRender.com.
REST is a member of the Gli-Kruppel family, contains nine Cys2-His2 zinc finger domains, and plays a transcriptional repressive role as a result of the zinc finger domains binding to the RE-1 motif of target genes. Recently, REST has become a hot topic in aging and neurodegenerative research (5, 31, 32). Studies have shown that REST can increase neural excitability and reduce the lifespan in vivo (32). In terms of CNS tumors, REST has been confirmed to play key roles in glioma (14–17, 33), although further bioinformatic analysis of distinct roles of REST in glioma remained elusive. The objective of this study was to systematically clarify the clinical relevance, gene functions, and ceRNA regulatory network of REST in glioma.
In the present study, REST expression and clinical data based on the TCGA database was download and analyzed to identify the clinical significance and prognostic value of REST in glioma. High REST expression was positively correlated with higher WHO grade, IDH status (WT), 1p/19q codeletion (non), histological type (GBM), tumor status (with tumor), and primary therapy outcome (SD-PD) (all p < 0.001). Moreover, higher REST expression was also significantly related with worse OS, PFI, and DSS in glioma patients, and was a weak independent prognostic factor (p = 0.051). These findings indicate an oncogenic role of REST in glioma.
Transcriptional factors (TF) and their regulatory networks are important in tumor development. Therefore, TFs are fast becoming a new direction of antitumor drug discovery (34). It has been suggested that REST may exert its biological effect through histone deacetylation (35), chromatin remodeling (36), methylation (37), and ubiquitination (38). Furthermore, it has been suggested that REST may exert tumorigenic effects by affecting the cell cycle, differentiation, apoptosis (39), proliferation, migration (17), self-renewal (15, 40), and cell signaling pathways, such as Akt-mTOR (10), Hippo (9), TGF-β (41), and Wnt-β-catenin (42). In terms of the functions and pathways of REST DE-mRNAs in glioma, our results showed that BP, such as ECM organization, extracellular structure organization, and neurotransmitter transport; CC, such as collagen-containing ECM, synaptic membrane, and pre-synapse; MF, such as passive transmembrane transporter activity, channel activity, and ECM structural constituents; and pathways, such as neuroactive ligand-receptor interaction and ECM-receptor interaction were remarkably regulated by REST in glioma. Therefore, we analyzed the DE-lncRNA and DE-miRNAs associated with REST expression in gliomas; these DE-ncRNAs may regulate or be regulated by REST either directly or indirectly. Marisetty et al. (43) found that REST regulates oncogenic properties of GBM by repressing miR-124 and miR-203 in vitro and in vivo, which were in the list that was generated in the current study (Figure 6D); this result partially increases the credibility of our study.
Recently, the ceRNA regulatory mechanism, the novel concept of interactions between ncRNAs and mRNAs, has been used to deeply understand the occurrence and development of cancer (44). Although it is known that REST can be regulated by ncRNAs (7, 45, 46), the upstream regulatory network of REST is still not fully understood. Fortunately, bioinformatics has proven to be an important tool in the study of these regulatory relationships. In the current study, a REST-associated ceRNA network with 4 miRNAs (miR-137, miR-129-1-3p, miR-876-5p, and miR-873-5p) and 9 lncRNAs (NR2F2-AS1, HOTAIRM1, CYTOR, MIR4435-2HG, HAND2-AS1, PVT1, AC009502.1, and AC0098864.1) was successfully constructed based on the TCGA and Starbase. It has been found that mir-137 (47), mir-129-1 (48), and mir-873 (49) exert tumor suppressor functions in glioma, while lncRNAs, including CYTOR (50), HOTAIRM1 (51, 52), MIR4435-2HG (53), and PVT1 (54) maintain tumorigenicity and promote progression of glioma; these studies confirm the reliability of the current findings.
Further, glioma cell lines U251 and T98G were used for subsequent experimental verification. After overexpressing 4 miRNAs using miRNA mimics, we found that only miR-129 and miR-137 could significantly regulate REST at both mRNA and protein levels, and have the ability that inhibits proliferation and migration. Luciferase assays also confirmed that both miR-129 and miR-137 could directly bind to REST 3'UTR. Next, we knocked down their potential regulatory lncRNAs NR2F2-AS1 and HOTAIRM1, respectively, in U251 cells with siRNA. As a result, the knockdown of LncRNAs NR2F2-AS1 and HOTAIRM1 could significantly down-regulate the expression of REST mRNA and protein. Luciferase assays were also confirmed the direct binding of miR-129 to NR2F2-AS1, and miR-137 to HOTAIRM1. Besides, the TCGA-GBM database show that NR2F2-AS1 and HOTAIRM1 are highly expressed and are associated with poor prognosis. Therefore, we finally obtained two REST-related ceRNA regulatory networks in glioma cell lines.
REST expression was significantly higher in glioma than that in normal samples, and was associated with clinical characteristics. High REST expression was significantly associated with worse OS, worse PFI, and worse DSS in glioma patients. REST may be a prognostic biomarker and potential target of glioma. The REST-associated ceRNA network were constructed based on TCGA database. Finally, REST-associated ceRNA, NR2F2-AS1-miR129-REST and HOTAIRM1-miR137-REST were experimentally validated. Thus, REST may be a prognostic biomarker and target in glioma, and the network validated in this study may provide insights into glioma's molecular regulatory mechanisms.
The datasets analyzed for this study can be found in The Cancer Genome Atlas database (https://portal.gdc.cancer.gov/), and The Human Protein Atlas (https://www.proteinatlas.org).
YZ and YY: conceptualization. YZ, QW, and CZ: methodology. XX, JX, HR, and XS: validation. YZ and QW: formal analysis. YZ, QW, and ZW: experiment. YY: funding acquisition. YZ and ZW: investigation. QW: data curation. YZ: writing—original draft preparation. ZW, LZ, and YY: writing—review and editing. YZ and CZ: visualization. LZ and YY: supervision and project administration. All authors have read and agreed to the published version of the manuscript.
This research was funded by the National Natural Science Foundation of China (Grant No. 81872062).
The authors declare that the research was conducted in the absence of any commercial or financial relationships that could be construed as a potential conflict of interest.
All claims expressed in this article are solely those of the authors and do not necessarily represent those of their affiliated organizations, or those of the publisher, the editors and the reviewers. Any product that may be evaluated in this article, or claim that may be made by its manufacturer, is not guaranteed or endorsed by the publisher.
The Supplementary Material for this article can be found online at: https://www.frontiersin.org/articles/10.3389/fmed.2021.739624/full#supplementary-material
Supplementary Figure 1. The protein expression of REST in glioma and normal samples using HPA. (A,B) The immunohistochemical results of REST protein of two antibodies of glioma and normal tissues were obtained from HPA. (C) Statistical column stacking diagram of REST staining in HPA.
Supplementary Table 1. The sequences of the primers or siRNA used in this study. GAPDH and U6 served as endogenous controls for mRNA or miRNA, respectively.
Supplementary Table 2. The list of GO/KEGG enrichment analysis of REST-associated differential expression gene analysis (DEGs).
1. Cheng J, Meng J, Zhu L, Peng Y. Exosomal noncoding RNAs in Glioma: biological functions and potential clinical applications. Mol Cancer. (2020) 19:66. doi: 10.1186/s12943-020-01189-3
2. Dong Z, Cui H. The emerging roles of RNA modifications in glioblastoma. Cancers. (2020) 12:736. doi: 10.3390/cancers12030736
3. Kraner SD, Chong JA, Tsay HJ, Mandel G. Silencing the type II sodium channel gene: a model for neural-specific gene regulation. Neuron. (1992) 9:37–44. doi: 10.1016/0896-6273(92)90218-3
4. Palm K, Metsis M, Timmusk T. Neuron-specific splicing of zinc finger transcription factor REST/NRSF/XBR is frequent in neuroblastomas and conserved in human, mouse and rat. Brain Res Mol Brain Res. (1999) 72:30–9. doi: 10.1016/S0169-328X(99)00196-5
5. Mampay M, Sheridan GK. REST: An epigenetic regulator of neuronal stress responses in the young and ageing brain. Front Neuroendocrinol. (2019) 53:100744. doi: 10.1016/j.yfrne.2019.04.001
6. Westbrook TF, Hu G, Ang XL, Mulligan P, Pavlova NN, Liang A, et al. SCFbeta-TRCP controls oncogenic transformation and neural differentiation through REST degradation. Nature. (2008) 452:370–4. doi: 10.1038/nature06780
7. Zhao Y, Zhu M, Yu Y, Qiu L, Zhang Y, He L, et al. Brain REST/NRSF is not only a silent repressor but also an active protector. Mol Neurobiol. (2017) 54:541–50. doi: 10.1007/s12035-015-9658-4
8. Coulson JM, Edgson JL, Woll PJ, Quinn JP. A splice variant of the neuron-restrictive silencer factor repressor is expressed in small cell lung cancer: a potential role in derepression of neuroendocrine genes and a useful clinical marker. Cancer Res. (2000) 60:1840–4.
9. Deng P, Zuo Y, Feng S, Li Z, Chen W, Li H, et al. Knockdown of NRSF inhibits cell proliferation of ovarian cancer via activating Hippo pathway. Life Sci. (2018) 215:73–9. doi: 10.1016/j.lfs.2018.10.070
10. Cho E, Moon SM, Park BR, Kim DK, Lee BK, Kim CS. NRSF/REST regulates the mTOR signaling pathway in oral cancer cells. Oncol Rep. (2015) 33:1459–64. doi: 10.3892/or.2014.3675
11. Liang J, Tong P, Zhao W, Li Y, Zhang L, Xia Y, et al. The REST gene signature predicts drug sensitivity in neuroblastoma cell lines and is significantly associated with neuroblastoma tumor stage. Int J Mol Sci. (2014) 15:11220–33. doi: 10.3390/ijms150711220
12. Pandey GK, Mitra S, Subhash S, Hertwig F, Kanduri M, Mishra K, et al. The risk-associated long noncoding RNA NBAT-1 controls neuroblastoma progression by regulating cell proliferation and neuronal differentiation. Cancer Cell. (2014) 26:722–37. doi: 10.1016/j.ccell.2014.09.014
13. Lawinger P, Venugopal R, Guo ZS, Immaneni A, Sengupta D, Lu W, et al. The neuronal repressor REST/NRSF is an essential regulator in medulloblastoma cells. Nat Med. (2000) 6:826–31. doi: 10.1038/77565
14. Palm K, Belluardo N, Metsis M, Timmusk T. Neuronal expression of zinc finger transcription factor REST/NRSF/XBR gene. J Neurosci. (1998) 18:1280–96. doi: 10.1523/JNEUROSCI.18-04-01280.1998
15. Conti L, Crisafulli L, Caldera V, Tortoreto M, Brilli E, Conforti P, et al. REST controls self-renewal and tumorigenic competence of human glioblastoma cells. PLoS ONE. (2012) 7:e38486. doi: 10.1371/journal.pone.0038486
16. Wagoner MP, Roopra A. A REST derived gene signature stratifies glioblastomas into chemotherapy resistant and responsive disease. BMC Genomics. (2012) 13:686. doi: 10.1186/1471-2164-13-686
17. Zhang D, Li Y, Wang R, Li Y, Shi P, Kan Z, et al. Inhibition of REST suppresses proliferation and migration in glioblastoma cells. Int J Mol Sci. (2016) 17(5):664. doi: 10.3390/ijms17050664
18. Huang Z, Wu Q, Guryanova OA, Cheng L, Shou W, Rich JN, et al. Deubiquitylase HAUSP stabilizes REST and promotes maintenance of neural progenitor cells. Nat Cell Biol. (2011) 13:142–52. doi: 10.1038/ncb2153
19. Chen GL, Miller GM. Extensive alternative splicing of the repressor element silencing transcription factor linked to cancer. PLoS ONE. (2013) 8:e62217. doi: 10.1371/journal.pone.0062217
20. Tomczak K, Czerwinska P, Wiznerowicz M. The cancer genome atlas (TCGA): an immeasurable source of knowledge. Contemp Oncol. (2015) 19:A68–77. doi: 10.5114/wo.2014.47136
21. Liu J, Lichtenberg T, Hoadley KA, Poisson LM, Lazar AJ, Cherniack AD, et al. An integrated TCGA pan-cancer clinical data resource to drive high-quality survival outcome analytics. Cell. (2018) 173:400–16.e1. doi: 10.1016/j.cell.2018.02.052
22. Consortium GT. Human genomics. The genotype-tissue expression (GTEx) pilot analysis: multitissue gene regulation in humans. Science. (2015) 348:648–60. doi: 10.1126/science.1262110
23. Goldman MJ, Craft B, Hastie M, et al. Visualizing and interpreting cancer genomics data via the Xena platform. Nat Biotechnol. (2020) 38:675–8. doi: 10.1038/s41587-020-0546-8
24. Love MI, Huber W, Anders S. Moderated estimation of fold change and dispersion for RNA-seq data with DESeq2. Genome Biol. (2014) 15:550. doi: 10.1186/s13059-014-0550-8
25. Yu G, Wang LG, Han Y, He QY. clusterProfiler: an R package for comparing biological themes among gene clusters. OMICS. (2012) 16:284–7. doi: 10.1089/omi.2011.0118
26. Uhlén M, Björling E, Agaton C, Szigyarto C A.-K., Amini B, et al. A human protein atlas for normal and cancer tissues based on antibody proteomics. Mol Cell Proteom. (2005) 4:1920. doi: 10.1074/mcp.M500279-MCP200
27. Li JH, Liu S, Zhou H, Qu LH, Yang JH. starBase v2.0: decoding miRNA-ceRNA, miRNA-ncRNA and protein-RNA interaction networks from large-scale CLIP-Seq data. Nucleic Acids Res. (2014) 42 (Database issue):D92–7. doi: 10.1093/nar/gkt1248
28. Cline MS, Smoot M, Cerami E, Kuchinsky A, Landys N, Workman C, et al. Integration of biological networks and gene expression data using cytoscape. Nat Protoc. (2007) 2:2366–82. doi: 10.1038/nprot.2007.324
29. Zhang Y, Wang Q, Luo N, Liu J, Ren H, Shao X, et al. MicroRNA-1269a promotes proliferation and arrest of apoptosis of glioma cells by directly targeting ATRX. Front Oncol. (2020) 10:563901. doi: 10.3389/fonc.2020.563901
30. Salmena L, Poliseno L, Tay Y, Kats L, Pandolfi PP. A ceRNA hypothesis: the rosetta stone of a hidden RNA language? Cell. (2011) 146:353–8. doi: 10.1016/j.cell.2011.07.014
31. Lu T, Aron L, Zullo J, Pan Y, Kim H, Chen Y, et al. REST and stress resistance in ageing and Alzheimer's disease. Nature. (2014) 507:448–54. doi: 10.1038/nature13163
32. Zullo JM, Drake D, Aron L, O'Hern P, Dhamne SC, Davidsohn N, et al. Regulation of lifespan by neural excitation and REST. Nature. (2019) 574:359–64. doi: 10.1038/s41586-019-1647-8
33. Bruce AW, Donaldson IJ, Wood IC, Yerbury SA, Sadowski MI, Chapman M, et al. Genome-wide analysis of repressor element 1 silencing transcription factor/neuron-restrictive silencing factor (REST/NRSF) target genes. Proc Natl Acad Sci USA. (2004) 101:10458–63. doi: 10.1073/pnas.0401827101
34. Lambert M, Jambon S, Depauw S, David-Cordonnier MH. Targeting transcription factors for cancer treatment. Molecules. (2018) 23:1479. doi: 10.3390/molecules23061479
35. Huang Y, Myers SJ, Dingledine R. Transcriptional repression by REST: recruitment of Sin3A and histone deacetylase to neuronal genes. Nat Neurosci. (1999) 2:867–72. doi: 10.1038/13165
36. Battaglioli E, Andres ME, Rose DW, Chenoweth JG, Rosenfeld MG, Anderson ME, et al. REST repression of neuronal genes requires components of the hSWI.SNF complex. J Biol Chem. (2002) 277:41038–45. doi: 10.1074/jbc.M205691200
37. Lunyak VV, Burgess R, Prefontaine GG, Nelson C, Sze SH, Chenoweth J, et al. Corepressor-dependent silencing of chromosomal regions encoding neuronal genes. Science. (2002) 298:1747–52. doi: 10.1126/science.1076469
38. Huang Z, Bao S. Ubiquitination and deubiquitination of REST and its roles in cancers. FEBS Lett. (2012) 586:1602–5. doi: 10.1016/j.febslet.2012.04.052
39. Negrini S, Prada I, D'Alessandro R, Meldolesi J. REST: an oncogene or a tumor suppressor? Trends Cell Biol. (2013) 23:289–95. doi: 10.1016/j.tcb.2013.01.006
40. Kamal MM, Sathyan P, Singh SK, Zinn PO, Marisetty AL, Liang S, et al. REST regulates oncogenic properties of glioblastoma stem cells. Stem Cells. (2012) 30:405–14. doi: 10.1002/stem.1020
41. Huang S, Wa Q, Pan J, Peng X, Ren D, Li Q, et al. Transcriptional downregulation of miR-133b by REST promotes prostate cancer metastasis to bone via activating TGF-beta signaling. Cell Death Dis. (2018) 9:779. doi: 10.1038/s41419-018-0807-3
42. Song Z, Shah SZA, Yang W, Dong H, Yang L, Zhou X, et al. Downregulation of the repressor element 1-silencing transcription factor (REST) is associated with Akt-mTOR and Wnt-beta-catenin signaling in prion diseases models. Front Mol Neurosci. (2017) 10:128. doi: 10.3389/fnmol.2017.00128
43. Marisetty AL, Singh SK, Nguyen TN, Coarfa C, Liu B, Majumder S. REST represses miR-124 and miR-203 to regulate distinct oncogenic properties of glioblastoma stem cells. Neuro Oncol. (2017) 19:514–23. doi: 10.1093/neuonc/now232
44. Aprile M, Katopodi V, Leucci E, Costa V. LncRNAs in Cancer: From garbage to Junk. Cancers. (2020) 12:3220. doi: 10.3390/cancers12113220
45. Kuwabara T, Hsieh J, Nakashima K, Taira K, Gage FH. A small modulatory dsRNA specifies the fate of adult neural stem cells. Cell. (2004) 116:779–93. doi: 10.1016/S0092-8674(04)00248-X
46. Rossbach M. Non-Coding RNAs in neural networks, REST-assured. Front Genet. (2011) 2:8. doi: 10.3389/fgene.2011.00008
47. Ji ZG, Jiang HT, Zhang PS. FOXK1 promotes cell growth through activating wnt/beta-catenin pathway and emerges as a novel target of miR-137 in glioma. Am J Transl Res. (2018) 10:1784–92.
48. Kouhkan F, Mobarra N, Soufi-Zomorrod M, Keramati F, Hosseini Rad SM, Fathi-Roudsari M, et al. MicroRNA-129-1 acts as tumour suppressor and induces cell cycle arrest of GBM cancer cells through targeting IGF2BP3 and MAPK1. J Med Genet. (2016) 53:24–33. doi: 10.1136/jmedgenet-2015-103225
49. Chen X, Zhang Y, Shi Y, Lian H, Tu H, Han S, et al. MiR-873 acts as a novel sensitizer of glioma cells to cisplatin by targeting Bcl-2. Int J Oncol. (2015) 47:1603–11. doi: 10.3892/ijo.2015.3143
50. Zou SF, Yang XY, Li JB, Ding H, Bao YY, Xu J. UPF1 alleviates the progression of glioma via targeting lncRNA CYTOR. Eur Rev Med Pharmacol Sci. (2019) 23:10005–12. doi: 10.26355/eurrev_201911_19567
51. Liang Q, Li X, Guan G, Xu X, Chen C, Cheng P, et al. Long non-coding RNA, HOTAIRM1, promotes glioma malignancy by forming a ceRNA network. Aging. (2019) 11:6805–38. doi: 10.18632/aging.102205
52. Xia H, Liu Y, Wang Z, Zhang W, Qi M, Qi B, et al. Long Noncoding RNA HOTAIRM1 maintains tumorigenicity of glioblastoma stem-like cells through regulation of HOX gene expression. Neurotherapeutics. (2019) 17:754–64. doi: 10.1007/s13311-019-00799-0
53. Li Z, Tan H, Zhao W, Xu Y, Zhang Z, Wang M, et al. Integrative analysis of DNA methylation and gene expression profiles identifies MIR4435-2HG as an oncogenic lncRNA for glioma progression. Gene. (2019) 715:144012. doi: 10.1016/j.gene.2019.144012
Keywords: REST (RE-1 silencing transcription factor), glioma, therapeutic target, ceRNA, experiment validation
Citation: Zhang Y, Wang Q, Wang Z, Zhang C, Xu X, Xu J, Ren H, Shao X, Zhen X, Zhang L and Yu Y (2021) Comprehensive Analysis of REST/NRSF Gene in Glioma and Its ceRNA Network Identification. Front. Med. 8:739624. doi: 10.3389/fmed.2021.739624
Received: 11 July 2021; Accepted: 21 September 2021;
Published: 11 November 2021.
Edited by:
Mingyue Li, University of Pennsylvania, United StatesReviewed by:
Meisheng Xiao, National Cancer Institute at Frederick, United StatesCopyright © 2021 Zhang, Wang, Wang, Zhang, Xu, Xu, Ren, Shao, Zhen, Zhang and Yu. This is an open-access article distributed under the terms of the Creative Commons Attribution License (CC BY). The use, distribution or reproduction in other forums is permitted, provided the original author(s) and the copyright owner(s) are credited and that the original publication in this journal is cited, in accordance with accepted academic practice. No use, distribution or reproduction is permitted which does not comply with these terms.
*Correspondence: Yanbing Yu, eXV5YW5iaW5nMTIzQDEyNi5jb20=
†These authors have contributed equally to this work
Disclaimer: All claims expressed in this article are solely those of the authors and do not necessarily represent those of their affiliated organizations, or those of the publisher, the editors and the reviewers. Any product that may be evaluated in this article or claim that may be made by its manufacturer is not guaranteed or endorsed by the publisher.
Research integrity at Frontiers
Learn more about the work of our research integrity team to safeguard the quality of each article we publish.