 Matthieu Doyen1Elise Mairal2Manon Bordonne2
 Timothée Zaragori1Véronique Roch1Laetitia Imbert1,2
 Antoine Verger1,2*
- 1Université de Lorraine, IADI, INSERM U1254 and Nancyclotep Imaging Platform, Nancy, France
- 2Department of Nuclear Medicine, Université de Lorraine, CHRU Nancy, Nancy, France
Purpose: This study aims to determine the effect of applying Point Spread Function (PSF) deconvolution, which is known to improve contrast and spatial resolution in brain 18F-FDG PET images, to the diagnostic thinking efficacy in Alzheimer's disease (AD).
Methods: We compared Hoffman 3-D brain phantom images reconstructed with or without PSF. The effect of PSF deconvolution on AD diagnostic clinical performance was determined from digital brain 18F-FDG PET images of AD (n = 38) and healthy (n = 35) subjects compared to controls (n = 36). Performances were assessed with SPM at the group level (p < 0.001 for the voxel) and at the individual level by visual interpretation of SPM T-maps (p < 0.005 for the voxel) by the consensual analysis of three experienced raters.
Results: A mix of large hypometabolic (1,483cm3, mean value of −867 ± 492 Bq/ml) and intense hypermetabolic (902 cm3, mean value of 1,623 ± 1,242 Bq/ml) areas was observed in the PSF compared to the no PSF phantom images. Significant hypometabolic areas were observed in the AD group compared to the controls, for reconstructions with and without PSF (respectively 23.7 and 26.2 cm3), whereas no significant hypometabolic areas were observed when comparing the group of healthy subjects to the control group. At the individual level, no significant differences in diagnostic performances for discriminating AD were observed visually (sensitivity of 89 and 92% for reconstructions with and without PSF respectively, similar specificity of 74%).
Conclusion: Diagnostic thinking efficacy performances for diagnosing AD are similar for 18F-FDG PET images reconstructed with or without PSF.
Introduction
Recently, significant improvements have been performed in the iterative reconstruction algorithms to enhance the image quality but also the accuracy of the quantification. Particularly, these methods include a resolution modeling or point-spread function (PSF) available on all vendors of clinical PET/CT systems. This PSF allows to correct from the system's depiction of point sources depending on their location in the field of view (1).
Application of this novel PSF reconstruction algorithm to brain 18F-FDG PET imaging improves image quality by enhancing contrast and spatial resolution (2). However, PSF deconvolution increases image noise and can lead to an overestimation of the real activity concentration, namely edge or Gibbs' artifacts, thereby limiting its use in routine practice.
Visual evaluation as well as semi-quantitative analyses of brain 18F-FDG PET imaging are compelling for the diagnosis of neurodegenerative disorders such as Alzheimer's disease (AD) (3). Indeed, a hypometabolic pattern involving the posterior temporo-parietal association cortex is typically reported in AD (3). Reconstructions with PSF improve lesion detectability and are generally associated with an increase in sensitivity while slightly reducing specificity. To the best of our knowledge, no study has to date investigated the application of PSF reconstructions on brain 18F-FDG PET images in the diagnostic thinking efficacy in AD. Reconstructions with PSF have predominantly been studied in the context of focal lesions (4). Although we know that AD is characterized by diffuse hypometabolism (3), the effects of reconstructions with PSF in AD are poorly understood. In addition, the lack of harmonization of reconstruction protocols for brain PET imaging currently limits multi-center collaborations (4).
Our study therefore aims to elucidate the clinical impact of PSF deconvolution, applied to brain 18F-FDG PET imaging, in the diagnosis of AD.
Materials and Methods
Phantom
A 15 min-acquisition of a Hoffman 3-D brain phantom, filled with 76.4 MBq of 18F, was performed on a digital camera (Vereos, Philips®) and then reconstructed with or without the PSF deconvolution. Spatially PET normalized images of the Montreal National Institute (MNI) space with and without PSF deconvolution were compared by subtraction, after inclusive whole-brain masking. PSF deconvolution parameters (1 iteration and 6-mm regularization kernel) were optimized according to the noise level and the gray/white matter contrast ratio (2) (Supplementary Figure 1).
Patients
We selected three groups of subjects that had undergone brain 18F-FDG PET on a digital camera (Vereos, Philips®) with a similar acquisition protocol and reported reconstruction protocol derived from the guidelines (5, 6). Briefly, brain 18F-FDG PET scans were recorded over a 15 min one bed acquisition, 45–50 min after injection of 2 MBq/kg of 18F-FDG. All subjects had fasted at least 6 h prior to receiving the injection and had blood glucose levels <160 mg/dl. All PET images were reconstructed with iterative OSEM methods, as performed in routine clinical practice, and corrected for scatter, random and attenuation with a CT scan. Reconstructed parameters included two iterations and 10 subsets, a Gaussian post- filter (4.0 mm FWHM) with a 256 mm reconstruction diameter and a 1-mm3 voxel size. The AD group was retrospectively constituted from a group of patients referred for evaluation of a cognitive complaint between March 2019 and November 2020 and who exhibited additional positive cerebro-spinal fluid biomarkers according to the NIA-AA-2018 classification (7). The other groups of heathy (H) and control subjects, were derived from the prospective NCT03345290 study, they did not have a neurological disease and were matched for age, sex, Mini Mental State Examination (MMSE) and educational level. All PET images were reconstructed with or without PSF deconvolution using the previously optimized parameters.
Statistical Parametric Mapping
Brain 18F-FDG PET images were pre-processed using SPM12 (London, UK). All 18F-FDG PET images, reconstructed with or without the PSF deconvolution, were spatially normalized with an adaptive CT template using CT attenuation corrected images and then corrected for partial volume effects (5). The pons region was used as reference for intensity normalization (8). All analyses were performed with two-sample t-tests with an inclusive AD mask. AD and H groups were compared to the control group twice, once with and then without PSF deconvolution (search for decreased metabolism with p < 0.001 for the voxel, cluster volume corrected for the expected volume provided by SPM with age and sex as covariates). Each subject from the AD and H group was individually compared to the control group (search for decreased metabolism with p < 0.005 for the voxel, cluster volume corrected for the expected volume provided by SPM) this was done for both images with and without the PSF deconvolution. Three experienced observers (MB, EM, and AV), who were blinded to the patients' clinical data, gave a dichotomous reading: AD diagnosis or not, after reviewing the SPM T-maps. A pattern of diffuse hypometabolism within the regions known to be involved in AD was considered a positive scan (3). Results were expressed as a consensual analysis for the positive diagnosis of AD.
Statistical Analysis
Categorical variables are expressed as percentages and continuous variables as means and standard deviations. Due to the non-normality of variable distributions, Chi-2 and Kruskal–Wallis tests were performed for comparisons of categorical and continuous variables, respectively. For the comparisons of diagnostic performances at the individual level, Mc Nemar tests were used with corrections for multiple comparisons. A p-value < 0.05 was considered to be significant. All tests were performed with SPSS (SPSS Statistics for Windows, Version 20.0. Armonk, NY: IBM Corp).
Results
Brain Phantom
A mix, of large hypometabolic (1,483 cm3, mean value of −867 ± 492 Bq/ml) and intense hypermetabolic (903 cm3, mean value of 1,623 ± 1,243 Bq/ml) areas, was observed in PSF images compared to the no PSF images (Figure 1).
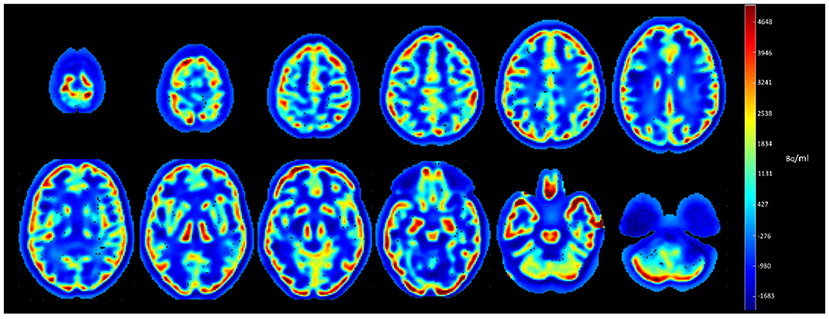
Figure 1. Subtracted axial slices of Hoffman 3-D brain phantom images reconstructed with and without PSF.
Population
The study included 109 subjects. As detailed in Table 1, no differences in age, sex, MMSE, educational level and blood glucose level were observed between healthy subjects and controls. However, AD patients were significantly older and exhibited lower levels of education, MMSE compared to the other two groups (p ≤ 0.03). Moreover, even if all subjects included in this study presented normal levels of blood glucose (<160 mg/dL), higher levels were observed in AD patients as compared to controls (p = 0.02).
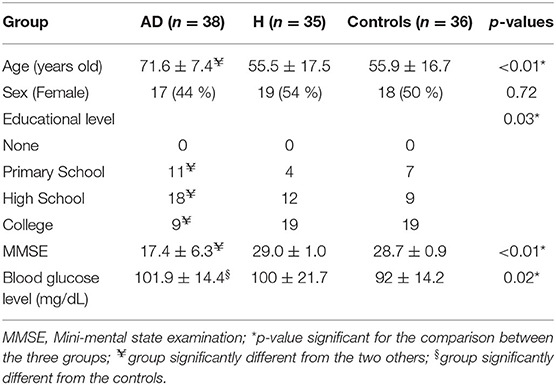
Table 1. Characteristics of Alzheimer's disease (AD), healthy (H) group patients and controls.
Image Comparisons at the Group Level
Significant hypometabolic regions were observed in AD subjects when compared to the controls with or without PSF (23.7 cm3 with a T-voxel max value of significance of 7.09, vs. 26.2 cm3 with a T-voxel max value of significance of 8.63 respectively, Figure 2). No significant hypometabolic areas were observed for either types of reconstructions when healthy subjects were compared to the controls.
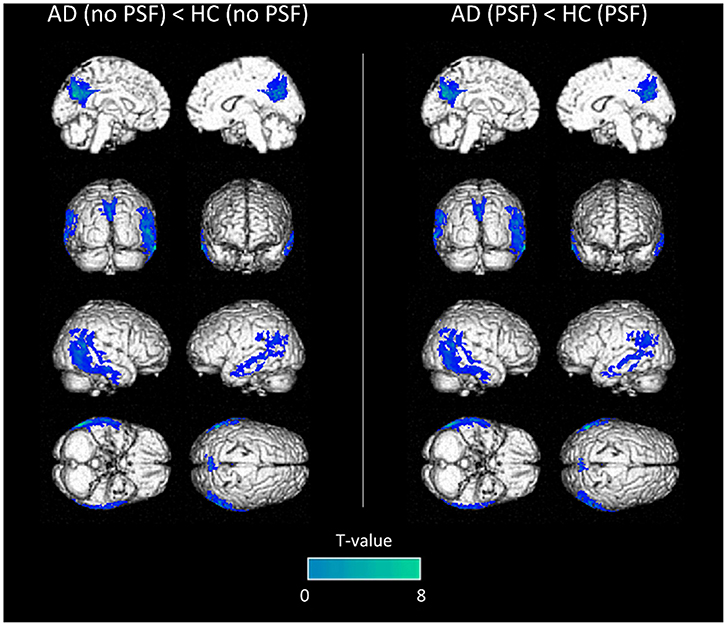
Figure 2. Anatomical localization of areas of decreased metabolic activity in AD patients compared to controls (p < 0.001, uncorrected, k > 1.5 cm3) from PET images without PSF deconvolution (left panel) or with (right panel), projected onto 3D volume rendering, spatially normalized and smoothed into the Montreal National Institute (MNI) space.
Image Comparisons at the Individual Level
Similar performances were observed in the visual analysis when using the two datasets of images for the diagnosis of AD with respective sensitivity, specificity and accuracy of 92.1, 74.3, 83.6%, for images reconstructed without PSF, and 89.5, 74.3, 82.2%, for images reconstructed with PSF (p = 1.0). Only one case was discordant between the two reconstructions (one false negative AD case identified with the PSF reconstruction).
Representative SPMT-maps used for visual analysis are shown in Figure 3.
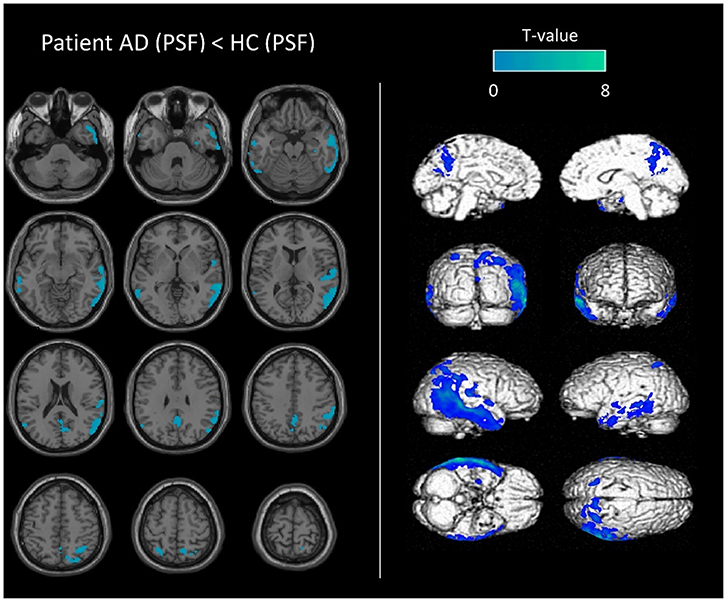
Figure 3. Representative SPM-T map images used in the visual analysis. Anatomical localization of decreased metabolic activity in an AD patient (79-year-old man with MMSE score of 10), compared to controls. SPM-T maps are projected onto two-dimensional slices of T1-weighted MRIs (from the base to the top of the skull, left panel) and 3D-rendered volumes (right panel). Images used in this example (AD patient and controls group) were reconstructed using PSF deconvolution.
Discussion
The present study shows that brain 18F-FDG PET images reconstructed with or without PSF yield similar overall AD diagnostic thinking performances.
Our preliminary results on the phantom showed that the effects of reconstructions with PSF were not homogeneous across the whole brain volume, and as expected with increased gray-to-white matter contrast ratios (4). Importantly, our voxel-to-voxel wise approach after subtraction of the two normalized images highlighted that this contrast enhancement was mainly observed in the peripheral gray-matter regions, with maximum enhancement coinciding with the maximal contrast ratio, i.e., at the interface of the cerebral cortex and the extracerebral regions (Figure 1).
Our clinical analysis showed similar findings at the group level between paired PET images reconstructed with or without PSF. In addition, diagnostic thinking efficacy at the individual level showed overall similar performances between both reconstructions. This is in contrast to a previous study (9) which reported significant differences in absolute z-scores obtained with an automated software when applying PSF reconstructions in neurodegenerative diseases. However, this particular study did not perform reconstructions on the normal database which was provided by the software. This is in contrast to our own study which exclusively compared populations with the same PSF status, given that our normal database was reconstructed with or without PSF depending on the nature of the population investigated (5). It has been previously suggested that PET images should be smoothed to the same low spatial resolution to assess comparability between images (10). However, our current study, only applies a Gaussian post-reconstruction filter adapted to the spatial resolution of a digital PET. Moreover, our AD patients, were selected on cerebro-spinal fluid biomarkers and were representative of patients encountered in daily clinical practice, exhibiting different stages of typical and atypical Alzheimer's disease. This could in part explain why a false negative AD case was misdiagnosed with the PSF reconstruction, a “non-perfect” 90% of detection sensitivity being typically reported for brain 18F-FDG PET in AD (3).
PSF enhances image quality thereby increasing visual reader comfort. Indeed, improvements in image contrast and spatial resolution facilitate the delineation of cortical gyri (2). In our study, local overestimations associated with the application of PSF did not influence the AD diagnosis, the diagnosis being related to the relative difference between brain region metabolism. Integrating PSF in reconstructions across PET/CT systems has already been suggested (4). The present study validates the application of PSF to brain 18F-FDG PET imaging as a diagnostic thinking efficacy, a confirmation that was previously lacking in the context of AD (1).
A limitation of our work is the application of reconstructions with PSF to a single PET system, which limits the generalization of our results to other manufacturers.
In light of the similar diagnostic AD thinking performances with and without PSF and the improved visual comfort of reconstructions integrating PSF, PSF can be deployed in clinical routine and used in multicenter neurodegenerative studies for protocol harmonization. The benefits of reconstructions with PSF in other brain pathologies and with other radiotracers remains to be established.
Data Availability Statement
The raw data supporting the conclusions of this article will be made available by the authors, without undue reservation.
Ethics Statement
The studies involving human participants were reviewed and approved by Subjects gave their written informed consent to participate in the study in accordance with the Declaration of Helsinki. This study was approved on January 18, 2021 by the local ethics committee (NCT04718207, ID Number S201215_051). The patients/participants provided their written informed consent to participate in this study. Written informed consent was obtained from the individual(s) for the publication of any potentially identifiable images or data included in this article.
Author Contributions
MD, EM, and AV contributed to the writing of the manuscript. LI and AV contributed to the revision of the manuscript. All authors contributed significantly to the analysis and interpretation of the data.
Conflict of Interest
The authors declare that the research was conducted in the absence of any commercial or financial relationships that could be construed as a potential conflict of interest.
Publisher's Note
All claims expressed in this article are solely those of the authors and do not necessarily represent those of their affiliated organizations, or those of the publisher, the editors and the reviewers. Any product that may be evaluated in this article, or claim that may be made by its manufacturer, is not guaranteed or endorsed by the publisher.
Acknowledgments
The authors thank the Nancyclotep imaging platform for technical and financial support.
Supplementary Material
The Supplementary Material for this article can be found online at: https://www.frontiersin.org/articles/10.3389/fmed.2021.721551/full#supplementary-material
Supplementary Figure 1. Gray/white matter contrast between peripheral gray-matter (occiput) and white matter (semi-oval center) structures, according to the noise level within the semi-oval area for different PSF parameters. Among all combinations evaluated, only acquisitions that could be visually interpreted by an experienced physician were considered. PSF parameters selected for this study are represented by the red arrow. IT, iteration number; R, regularization kernel expressed in mm.
References
1. Rogasch JMM, Boellaard R, Pike L, Borchmann P, Johnson P, Wolf J, et al. Moving the goalposts while scoring-the dilemma posed by new PET technologies. Eur J Nucl Med Mol Imaging. (2021) 48:2696–710. doi: 10.1007/s00259-021-05403-2
2. Salvadori J, Odille F, Verger A, Olivier P, Karcher G, Marie P-Y, et al. Head-to-head comparison between digital and analog PET of human and phantom images when optimized for maximizing the signal-to-noise ratio from small lesions. EJNMMI Phys. (2020) 7:11. doi: 10.1186/s40658-020-0281-8
3. Nobili F, Festari C, Altomare D, Agosta F, Orini S, Van Laere K, et al. Automated assessment of FDG-PET for differential diagnosis in patients with neurodegenerative disorders. Eur J Nucl Med Mol Imaging. (2018) 45:1557–66. doi: 10.1007/s00259-018-4030-3
4. Verwer EE, Golla SSV, Kaalep A, Lubberink M, van Velden FHP, Bettinardi V, et al. Harmonisation of PET/CT contrast recovery performance for brain studies. Eur J Nucl Med Mol Imaging. (2021) 48:2856–70. doi: 10.1007/s00259-021-05201-w
5. Mairal E, Doyen M, Rivasseau-Jonveaux T, Malaplate C, Guedj E, Verger A. Clinical impact of digital and conventional PET control databases for semi-quantitative analysis of brain 18F-FDG digital PET scans. EJNMMI Res. (2020) 10:144. doi: 10.1186/s13550-020-00733-y
6. Varrone A, Asenbaum S, Vander Borght T, Booij J, Nobili F, Någren K, et al. EANM procedure guidelines for PET brain imaging using [18F]FDG, version 2. Eur J Nucl Med Mol Imaging. (2009) 36:2103–10. doi: 10.1007/s00259-009-1264-0
7. Jack CR, Bennett DA, Blennow K, Carrillo MC, Dunn B, Haeberlein SB, et al. NIA-AA Research Framework: toward a biological definition of Alzheimer's disease. Alzheimers Dement J Alzheimers Assoc. (2018) 14:535–62. doi: 10.1016/j.jalz.2018.02.018
8. Verger A, Doyen M, Campion JY, Guedj E. The pons as reference region for intensity normalization in semi-quantitative analysis of brain 18FDG PET: application to metabolic changes related to ageing in conventional and digital control databases. EJNMMI Res. (2021) 11:31. doi: 10.1186/s13550-021-00771-0
9. Lindström E, Oddstig J, Danfors T, Jögi J, Hansson O, Lubberink M. Image reconstruction methods affect software-aided assessment of pathologies of [18F]flutemetamol and [18F]FDG brain-PET examinations in patients with neurodegenerative diseases. NeuroImage Clin. (2020) 28:102386. doi: 10.1016/j.nicl.2020.102386
Keywords: point spread function, FDG PET, Alzheimer's disease, digital, diagnostic thinking efficacy
Citation: Doyen M, Mairal E, Bordonne M, Zaragori T, Roch V, Imbert L and Verger A (2021) Effect of Point Spread Function Deconvolution in Reconstruction of Brain 18F-FDG PET Images on the Diagnostic Thinking Efficacy in Alzheimer's Disease. Front. Med. 8:721551. doi: 10.3389/fmed.2021.721551
Received: 07 June 2021; Accepted: 06 July 2021;
Published: 29 July 2021.
Edited by:
Domenico Albano, University of Brescia, ItalyCopyright © 2021 Doyen, Mairal, Bordonne, Zaragori, Roch, Imbert and Verger. This is an open-access article distributed under the terms of the Creative Commons Attribution License (CC BY). The use, distribution or reproduction in other forums is permitted, provided the original author(s) and the copyright owner(s) are credited and that the original publication in this journal is cited, in accordance with accepted academic practice. No use, distribution or reproduction is permitted which does not comply with these terms.
*Correspondence: Antoine Verger, YS52ZXJnZXJAY2hydS1uYW5jeS5mcg==